25
Reserve Risk Within ERM Presented by Roger M. Hayne, FCAS, MAAA CLRS, San Diego, CA September 10-11, 2007
| Date post: | 18-Dec-2015 |
| Category: |
Documents |
| Upload: | augusta-dickerson |
| View: | 216 times |
| Download: | 0 times |
Reserve Risk Within ERM
Presented byRoger M. Hayne, FCAS, MAAA
CLRS, San Diego, CASeptember 10-11, 2007


04/18/23 3
Why is There Reserve Risk?
First an observation:– Given knowledge available at a valuation date
there is usually a range of potential outcomes relating to a specific set future uncertain events. Given that knowledge, some of those outcomes may be more likely than others. The potential outcomes along with their relative likelihoods is often called a distribution of outcomes.
Key aspects:– Future uncertain events– With financial implications– Can only use current information

Actuarial Analysis
An actuary usually uses past history relating to the specific set of uncertain future events to develop an understanding of the related future outcomes and their relative likelihood.– Assessment can be subjective– Assessment can be based on one or more
underlying methods or models, often with statistical underpinnings
Traditional methods deterministic Stochastic models have underlying
distributions
04/18/23 4

What You Don’t Know Can Hurt
In an ERM analysis it is crucial that the ERM professional knows what the actuary means, even if they are the same person!
Notice focus in first slide on distribution of outcomes
Actuaries often talk in terms of “ranges of reasonable reserves”– “An actuarially sound loss reserve … is a provision,
based on estimates derived from reasonable assumptions and appropriate actuarial methods for the unpaid amount required to settle all claims …”
– Not outcome
04/18/23 5

Methods and Models
Traditional actuarial reserve techniques– Are deterministic– Do not directly provide information regarding the
distribution of outcomes– Are examples of “methods” or techniques amenable
to cook-book descriptions Stochastic methods begin with assumptions
regarding the underlying statistical process– Directly provide some information regarding
uncertainty– Are examples of “models” or mathematical
descriptions of “reality”
04/18/23 6
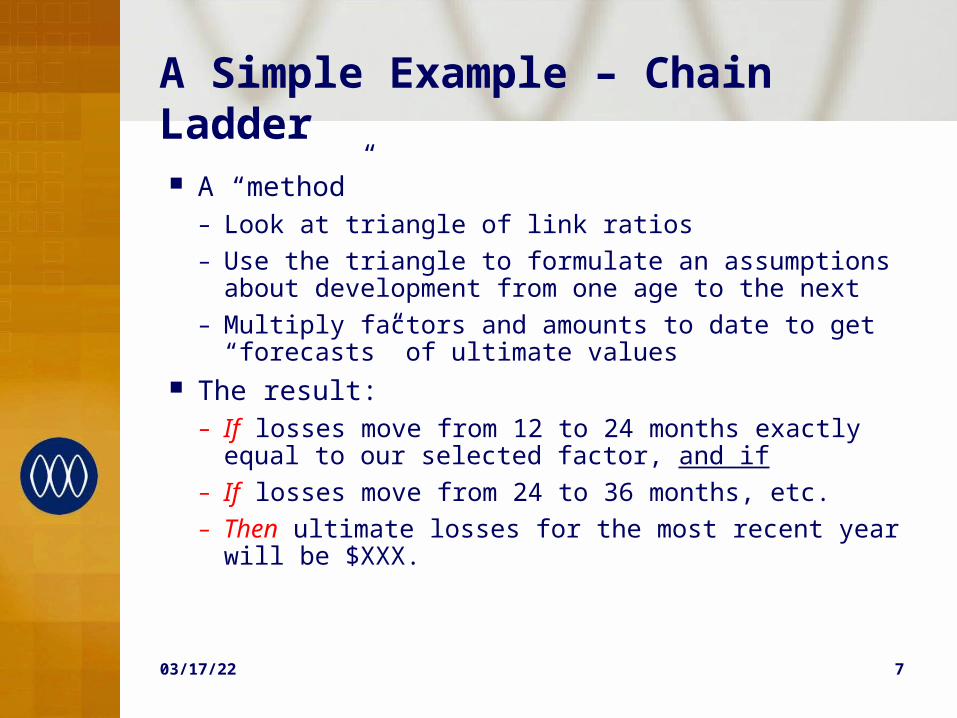
A Simple Example – Chain Ladder
A “method”– Look at triangle of link ratios– Use the triangle to formulate an assumptions about
development from one age to the next– Multiply factors and amounts to date to get “forecasts”
of ultimate values The result:– If losses move from 12 to 24 months exactly equal to
our selected factor, and if – If losses move from 24 to 36 months, etc. – Then ultimate losses for the most recent year will be
$XXX.
04/18/23 7

What Do We Have?
At the end we have a set of forecasts if each and every assumption fits what will happen in the future
No direct information about potential alternative possible (probable) outcomes
One approach is to make alternative selections for age to age factors and see the results
No direct information as to the likelihood of either original or alternate selections
Does give some read of sensitivity
04/18/23 8

A Look At “Reasonable”
Consider the following triangle:
04/18/23 9
Year 12 24 36 48 60 72 84 96 108 120
1997 1,000 1,010 1,111 1,122 1,234 1,358 1,371 1,385 1,399 1,413
1998 1,000 1,010 1,020 1,030 1,041 1,051 1,062 1,072 1,083
1999 1,000 1,010 1,020 1,030 1,041 1,051 1,062 1,072
2000 1,000 1,010 1,020 1,030 1,041 1,051 1,062
2001 1,000 1,010 1,020 1,030 1,041 1,051
2002 1,000 1,100 1,111 1,122 1,133
2003 1,000 1,010 1,020 1,030
2004 1,000 1,010 1,020
2005 1,000 1,010
2006 1,000

A Look at “Reasonable”
The triangle was generated randomly by the following development at each age:– 1.010 90% of the time– 1.100 10% of the time
What is a “reasonable” pick for an age-to-age factor?– Average (1.019)?– Mode or Median (1.01)?– Something else?
How would you assess the volatility of the chain ladder here?
04/18/23 10

A Look at “Reasonable”
Hard to argue that 1.01 is not a “reasonable” selection for each age-to-age factor, after all, it happens 9 times out of 10.
Given the true underlying model, doing this will give you a forecast with a 38.7% chance of occurring (0.387 = 0.909) and all other outcomes would be above this amount.
Actually picking the mean each time is no better, also giving a forecast below 61.3% of outcomes
Underlines the fundamental weakness of deterministic methods
04/18/23 11

A Look At “Reasonable”
Traditional chain ladder method gives no direct assessment of uncertainty
Usually actuary develops a “gut feel” for uncertainty by viewing the historical development factors compared to his/her selections
History may not be long enough to be appropriately representative of “rare” events In this example there is a 27.1% chance of at least 1.10 factor showing at an age with 3 observations, but the average of the observations would far exceed the expected
04/18/23 12

A Look At “Reasonable”
So making “reasonable” selections of age-to-age factors may not be enough
Traditionally the reserving actuary will get his/her assessment of uncertainty from looking at both the volatility of link ratios for the chain ladder as well as looking at other approaches including– Chain ladder applied to other data sets– Different forecast methods
Based on these the actuary often develops a “gut feel” for the volatility of his/her estimates
04/18/23 13

A Look At “Reasonable”
Notice the focus is on “reasonable projections” Traditionally assessed by considering– Alternate “reasonable” selections– The forecasts of alternative methods– Subjective assessment– A combination of the above
Not focused on a distribution of outcomes, but rather a sense of the “range of reasonable estimates”
Not much help in ERM
04/18/23 14

ERM Focus
What is useful to ERM is not only a reasonable estimate of what can happen but also an estimate of what can reasonably happen
Increased need for estimates of the distribution of outcomes, rather than simply a range of reasonable estimates
Need for a common language to communicate between the ERM professional and actuary, even if they are same person
04/18/23 15

ERM Focus
Actuary needs to be clear what “estimates” mean– The result of reasonable methods with
reasonable assumptions (the 38th percentile from our example)?
– A statistic based on a distribution of outcomes• Mean? • Mode? • Median?
• Percentile? • Least Pain? • Other?
– A rough statistic based on a subjectively estimated distribution of outcomes
– Other?
04/18/23 16

Some Quantitative Terms
Looking at our previous example we have assumed we know everything about the process, only chain ladder with known distributions of factors
Even knowing everything about the underlying model there is uncertainty, called
Process Uncertainty Nearly always present Statistics (mean, median, mode, percentile, least
pain, etc.) distill a distribution to a single number eliminating process uncertainty
04/18/23 17
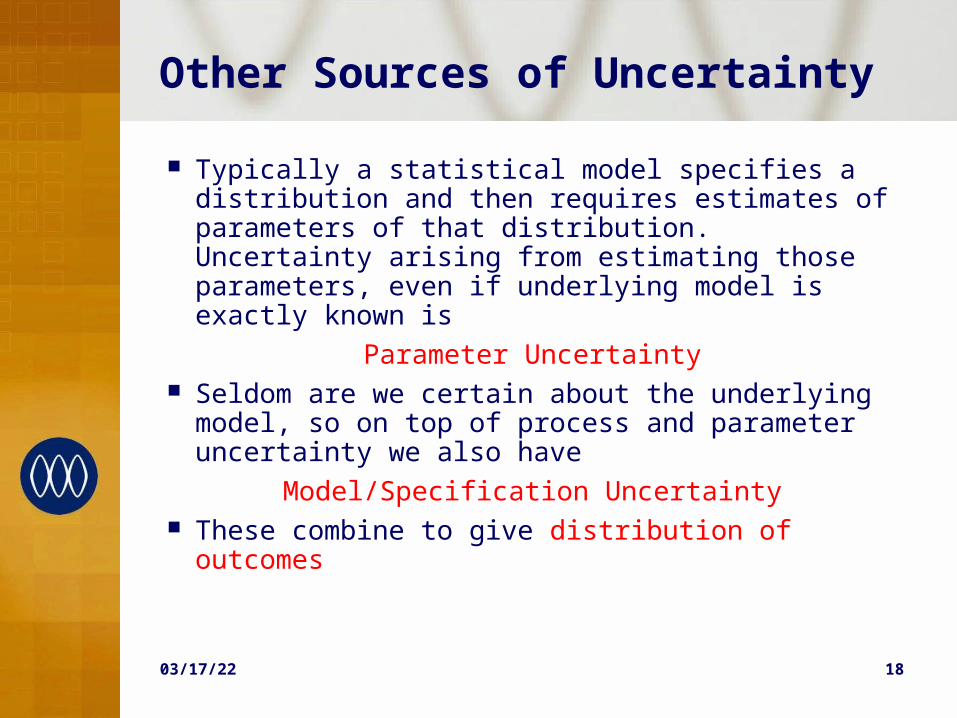
Other Sources of Uncertainty
Typically a statistical model specifies a distribution and then requires estimates of parameters of that distribution. Uncertainty arising from estimating those parameters, even if underlying model is exactly known is
Parameter Uncertainty Seldom are we certain about the underlying
model, so on top of process and parameter uncertainty we also have
Model/Specification Uncertainty These combine to give distribution of outcomes
04/18/23 18

Distributions “Light”
ERM Professional should be aware of what is considered in the distribution of outcomes
Most stochastic forecasting methods focus on a single model, applied to a single data set, e.g. chain ladder applied to paid losses, Bornhuetter-Ferguson applied to incurred losses, etc.
Little in literature on combining the indications of different models to better assess distribution of outcomes
There are a few exceptions, Keatinge, Munich Chain Ladder, etc.
04/18/23 19

Distributions “Light”
An approach being used more often now is a two-stage approach:– Use traditional methods to derive “best estimate”– Use the distribution of outcomes implied by a
bootstrap method based on the chain ladder model to impute a distribution of outcomes given the “best estimate”
Sometimes the bootstrap is later “adjusted” to “better” reflect the actuary’s subjective assessment of uncertainty
May not be consistent
04/18/23 20

Distributions “Light”
In some cases future contingencies not amenable to analysis by usual actuarial models– Asbestos & environmental– Property catastrophes near valuation date– Impact of significant court cases– Etc.
May need judgmental assessment of contribution to distribution of outcomes
Again user should be clear what the “distribution of outcomes” means
04/18/23 21

0 Calorie Distributions
Sometimes specific distributions of outcomes are not estimated
All is not lost for the ERM professional “Scenario testing” can give insight regarding the
range of potential outcomes With statistical methods you get distribution of
outcomes without specific “reasonable” events that result in those outcomes
Scenario testing can give “comfort” being able to say “you can get that outcome if such and such happens
04/18/23 22

Distributions “Light”
Analysis often conducted at a line of business level
Need to consider correlations– Among forecast methods/models– Among various lines of business
Again, key to usefulness is understanding
04/18/23 23

Distributions and ERM
Focus of ERM the identification of risks and opportunities facing the organization
Types of uncertainty in future outcomes helps point to ways to manage– Process uncertainty is usually diversifiable, law
of large numbers – Parameter and model/specification uncertainty
might not be diversifiable since they may affect all parties in the same market similarly implying other ways to manage
Again, knowledge is power
04/18/23 24

Conclusion
Reserve liabilities usually largest on an insurer’s balance sheet and may not be insignificant for other enterprises
A key concern for ERM is the distribution of outcomes not just a “range of reasonable outcomes”
Need to understand key contributors– Process– Parameter– Model/Specification
Understand what you are looking at
04/18/23 25


![EECS 3101 Prof. Andy Mirzaian. STUDY MATERIAL: [CLRS] chapter 34 [CLRS] chapter 34 2.](https://static.documents.pub/doc/80x56/56649cc25503460f9498aa35/eecs-3101-prof-andy-mirzaian-study-material-clrs-chapter-34-clrs-chapter.jpg)


![Applications of graph traversals [CLRS] – problem 22.2 - Articulation points, bridges, and biconnected components [CLRS] – subchapter 22.4 Topological.](https://static.documents.pub/doc/80x56/56649cf85503460f949c97af/applications-of-graph-traversals-clrs-problem-222-articulation-points.jpg)


