1 Reservoir Mapping Tool User Guide This tool delineates estimated inundation area and calculates the area given a location of dam points and estimated dam height data within Irrawaddy, Salween, Mekong, and Red River basins. Please follow the steps below in order to successfully create inundation polygon. There are three sections in this guide. • Section 1: Reservoir Mapping Tool Operation • Section 2: Other useful tools • Section 3: Developers and acknowledgement
Transcript
1
Reservoir Mapping Tool User Guide
This tool delineates estimated inundation area and calculates the area given a location of dam points and estimated dam height data within Irrawaddy, Salween, Mekong, and Red River basins. Please follow the steps below in order to successfully create inundation polygon. There are three sections in this guide.
• Section 1: Reservoir Mapping Tool Operation
• Section 2: Other useful tools
• Section 3: Developers and acknowledgement
2
Section 1: Reservoir Mapping Tool Operation
This section describes step-by-step how to operate the tool. 1. Go to
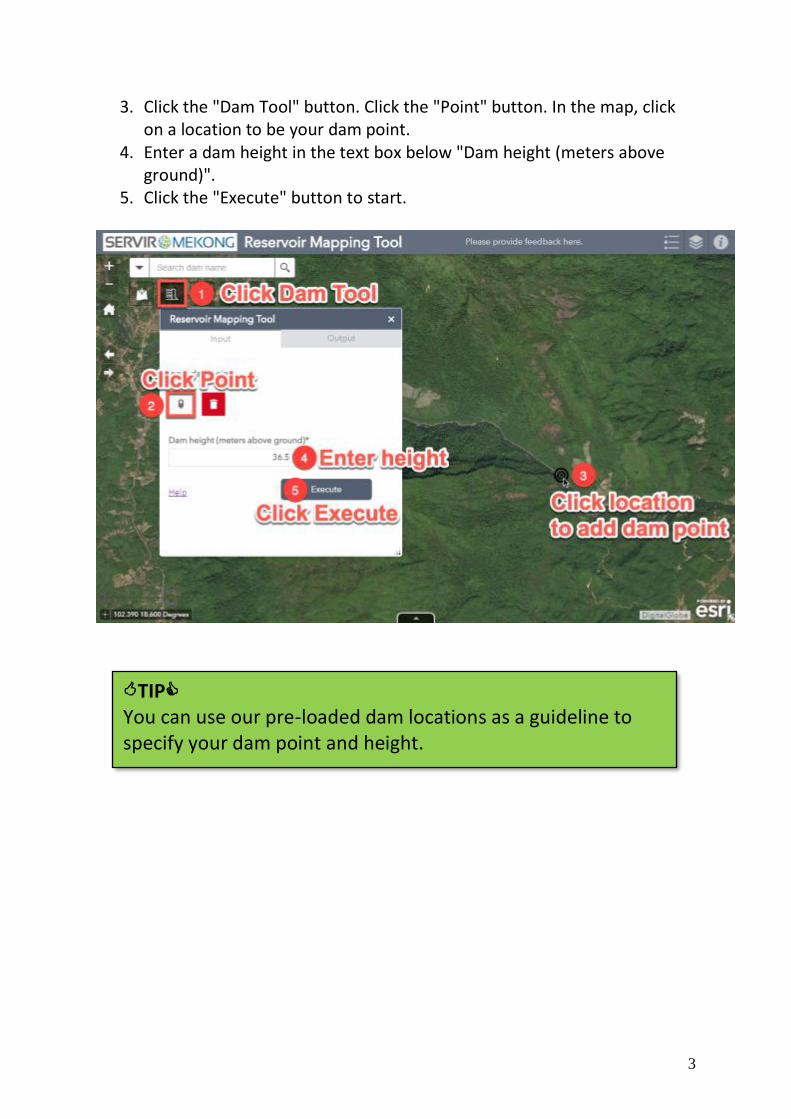
3. Click the "Dam Tool" button. Click the "Point" button. In the map, click on a location to be your dam point.
4. Enter a dam height in the text box below "Dam height (meters above ground)".
5. Click the "Execute" button to start.
TIP You can use our pre-loaded dam locations as a guideline to specify your dam point and height.
4
6. Once complete, the reservoir will be drawn on the map. The area in square meters can be viewed in the reservoir attribute table. Click on
to export output reservoir.
5
Section 2: Other useful tools
This section describes use and tips of other tools (widgets) provided in map window. They can be used to maximize the capability of Reservoir Mapping Tool.
1. Zoom Slider provides interactive zoom controls in the map display. ▪ Click the plus or minus button Zoom Slider to zoom in or out on
the map.
2. Home zooms the map to the initial map extent. ▪ When the application starts, the Home Button widget is
automatically enabled. Clicking it resets the map extent to the map initial extent.
3. Extent Navigate allows you to navigate the map to its previous or next
extent. ▪ Click the arrows on the screen to navigate the map to its previous
or next extent.
4. Add Data enables end users to add data to the map by searching for layers in ArcGIS Online or Portal for ArcGIS content, entering URLs, or uploading local files including shapefiles, CSV, GPX, and GeoJSON. In this way, end users can temporarily add layers to the map and remove them from the map. However, they cannot save them to the map.
6
• On the Search tab, choose the scope you want to search and click Add on a specific item to add the layer to the map. The added layer will appears in the Layer List widget as well. Click Remove to remove the layer from the map and the Layer List widget. Click Details to get information about the layer.
• Optionally, click the magnifying glass icon to search for layers.
• Click the icon to only search layers within the map area. Clicking it turns the icon red so you can search all layers in the scope.
• Click the Type drop-down list to search layers based on map service, feature service, image service, vector tile service, KML, or WMS.
• Click the Sort By drop-down list to sort items by relevance, title, owner, rating, view, or date.
7
• To add layers by URL, click the URL tab next to the Search tab. Choose a type and enter the URL. Click Add to add the data to the map. The added layer will appear in the Layer List widget as well. The following types are supported through the URL:
o ArcGIS for Server web service o WMS OGC web service o KML o GeoRSS o CSV
• Click Sample URL(s) to see the URL format for each type.
8
• Click the File tab to upload files locally. You can either drag and drop the file or browse to it. It supports shapefiles in Zip format, and CSV, GPX and GeoJSON files.
• To remove the layers added in step 5 and 7, click LAYERS in the lower right corner of the widget. In the Layers panel, click the trash can icon next to the layer to remove it.
• Click BACK in the lower right corner to return to the main panel.
5. Reservoir Mapping Tool enables end users to delineate the reservoir
and calculate its volume. Please refer to section 2 above for detailed operation.
9
6. Basemap Gallery presents a gallery of basemaps and allows you to select one from the gallery as your tool's basemap. The basemap can be user-defined or from your organization or portal. However, all basemaps added to the Basemap Gallery widget must have the same spatial reference. In addition, you have the option to synchronize the app at run time with the Basemap Gallery setting in your organization or portal.
• Clicking the Basemap Gallery widget displays all the basemaps configured for this widget. Clicking one of the basemap thumbnails sets it as the active basemap for the app. Click the X in the upper right corner of the Basemap Gallery window to close it.
10
7. Swipe enables you to easily compare the content of different layers in a map. It provides horizontal, vertical and spyglass view modes. You can slide the swipe tool or move mouse around to reveal the content of another layer. For example, you may want to use it to show before-and-after imagery of a flood, or display two related thematic layers in a map.
• Click the Swipe widget icon on the upper-left corner of the map to toggle the widget on and off .
• When it is toggled on, move the mouse over the widget icon to select a layer to swipe from the drop-down list. Only the layer visible on the map can take effect with the swipe tool.
• Slide the swipe tool or drag the spyglass to display the content of the layer on the map.
• Click the Swipe widget icon to toggle off the widget.
11
8. Quick Start Guide displays the quick step-by-step guide on how to operate the Reservoir Mapping Tool.
9. Search enables end users to find locations or search features on the map.
• When you enter a place-name or a keyword in the search box, you see suggestions as you type. If you see an arrow in the search box, you can search on all sources, or click the arrow and choose a locator or layer from the drop-down list.
12
Section 3: Developers and acknowledgement
This tool was originally created on ArcGIS ModelBuilder by Jarlath O’Neil-Dunne from SIG-GIS as a means of taking a dam point location, elevation and estimated dam height data in order to model estimated inundation areas. The model went through editing by David Saah, Austin Troy, and Ariel Walcutt in order to achieve iteration through a currently existing dam dataset maintained by Kim Geheb at the CGIAR Research Program on Water, Land and Ecosystems (WLE). The model successfully achieved areas of inundation created by dams in the Lower Mekong Region, and has applications for river management. It is further developed into an online tool by Aekkapol Aekakkararungroj, Hamid Mehmood, Peter Cutter, and Nuntarut Loketkawee. Developers' intention is to publish this model on the SERVIR-Mekong website in order to provide value to our stakeholders in the region. Such stakeholders including water resource management organizations, NGOs, river basin planning organizations, regional disaster management organizations, and conservation societies.