17


Reservoir Routing Analysis West Bottom Ash Pond
Clifty Creek Power Station City of Madison Jefferson County, Indiana
February, 2010

RESERVOIR ROUTING ANALYSIS WEST BOTTOM ASH POND
Table of Contents
1.0 INTRODUCTION AND SUMMARY .......................................................................................1
2.0 HYDROLOGY........................................................................................................................2
3.0 RESERVOIR ROUTING ........................................................................................................4 3.1 STAGE-STORAGE INFORMATION......................................................................................4 3.2 DAM EMBANKMENT.............................................................................................................4 3.3 PRINCIPAL SPILLWAY.........................................................................................................5
4.0 RESULTS ..............................................................................................................................7
5.0 BIBLIOGRAPHY AND REFERENCES .................................................................................8 Appendices Appendix A Watershed Layout Appendix B Hydrographs
i

RESERVOIR ROUTING ANALYSIS WEST BOTTOM ASH POND
1
1.0 Introduction and Summary
The Clifty Creek Power Station West Bottom Ash Pond (WBAP), owned and operated by the Indiana and Kentucky Electric Corp. (IKEC), is located in the City of Madison, Indiana along the northern bank of the Ohio River. The WBAP currently serves as a settling facility for sluiced bottom ash produced at the plant. In addition to the process flows from the plant, approximately 510 acres drain to the facility. The pond is formed by natural grade to the north, east and west and a dam that runs along the bank of the Ohio River.
The WBAP Dam is not currently registered with the Indiana Department of Natural Resources (IDNR), but has been identified as a Significant Hazard Structure by American Electric Power (AEP). As part of an evaluation of the dam, Stantec Consulting Services Inc. (Stantec) has been contracted to perform a reservoir routing analysis to determine the freeboard above the design storm. Stantec developed a hydrologic model of the drainage area to determine the expected runoff and routed the flows through the pond.
The results of the reservoir routing analysis indicate that the WBAP is capable of passing flows generated from the full and 50% Probable Maximum Precipitation (PMP) events without overtopping.
RESERVOIR ROUTING ANALYSIS WEST BOTTOM ASH POND Hydrology
2
2.0 Hydrology
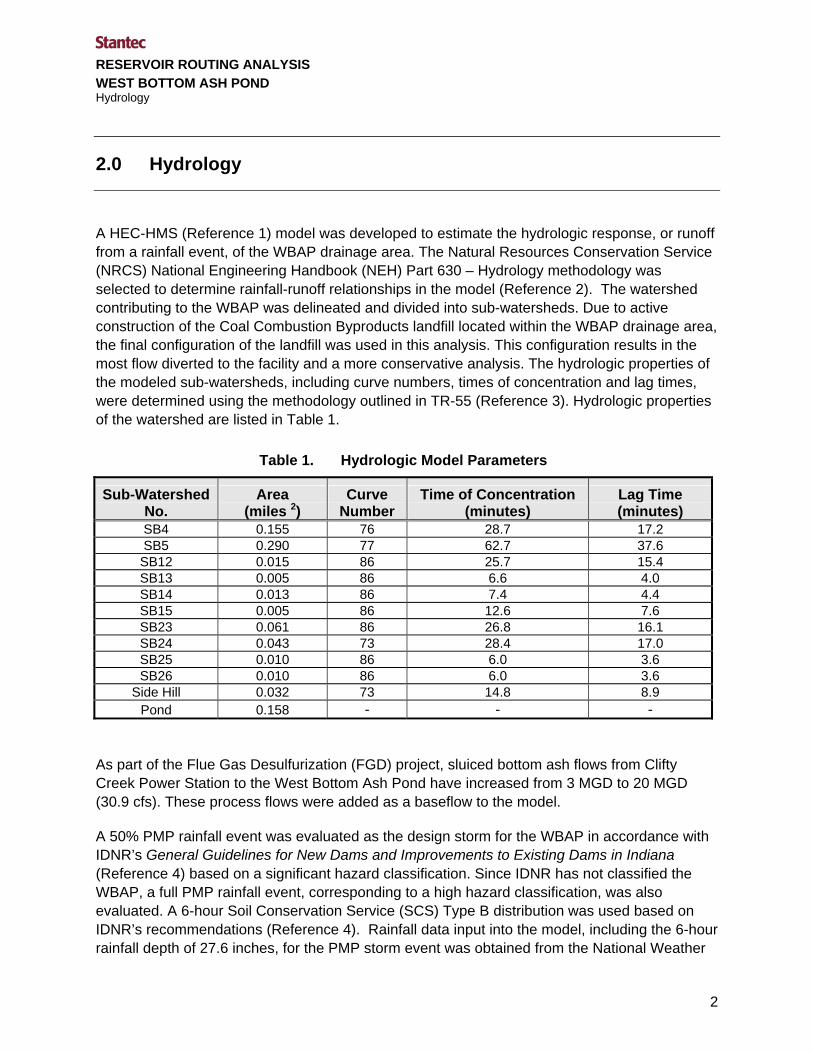
A HEC-HMS (Reference 1) model was developed to estimate the hydrologic response, or runoff from a rainfall event, of the WBAP drainage area. The Natural Resources Conservation Service (NRCS) National Engineering Handbook (NEH) Part 630 – Hydrology methodology was selected to determine rainfall-runoff relationships in the model (Reference 2). The watershed contributing to the WBAP was delineated and divided into sub-watersheds. Due to active construction of the Coal Combustion Byproducts landfill located within the WBAP drainage area, the final configuration of the landfill was used in this analysis. This configuration results in the most flow diverted to the facility and a more conservative analysis. The hydrologic properties of the modeled sub-watersheds, including curve numbers, times of concentration and lag times, were determined using the methodology outlined in TR-55 (Reference 3). Hydrologic properties of the watershed are listed in Table 1.
Table 1. Hydrologic Model Parameters
Sub-Watershed No.
Area (miles 2)
Curve Number
Time of Concentration (minutes)
Lag Time (minutes)
SB4 0.155 76 28.7 17.2 SB5 0.290 77 62.7 37.6 SB12 0.015 86 25.7 15.4 SB13 0.005 86 6.6 4.0 SB14 0.013 86 7.4 4.4 SB15 0.005 86 12.6 7.6 SB23 0.061 86 26.8 16.1 SB24 0.043 73 28.4 17.0 SB25 0.010 86 6.0 3.6 SB26 0.010 86 6.0 3.6
Side Hill 0.032 73 14.8 8.9 Pond 0.158 - - -
As part of the Flue Gas Desulfurization (FGD) project, sluiced bottom ash flows from Clifty Creek Power Station to the West Bottom Ash Pond have increased from 3 MGD to 20 MGD (30.9 cfs). These process flows were added as a baseflow to the model.
A 50% PMP rainfall event was evaluated as the design storm for the WBAP in accordance with IDNR’s General Guidelines for New Dams and Improvements to Existing Dams in Indiana (Reference 4) based on a significant hazard classification. Since IDNR has not classified the WBAP, a full PMP rainfall event, corresponding to a high hazard classification, was also evaluated. A 6-hour Soil Conservation Service (SCS) Type B distribution was used based on IDNR’s recommendations (Reference 4). Rainfall data input into the model, including the 6-hour rainfall depth of 27.6 inches, for the PMP storm event was obtained from the National Weather

RESERVOIR ROUTING ANALYSIS WEST BOTTOM ASH POND Hydrology
3
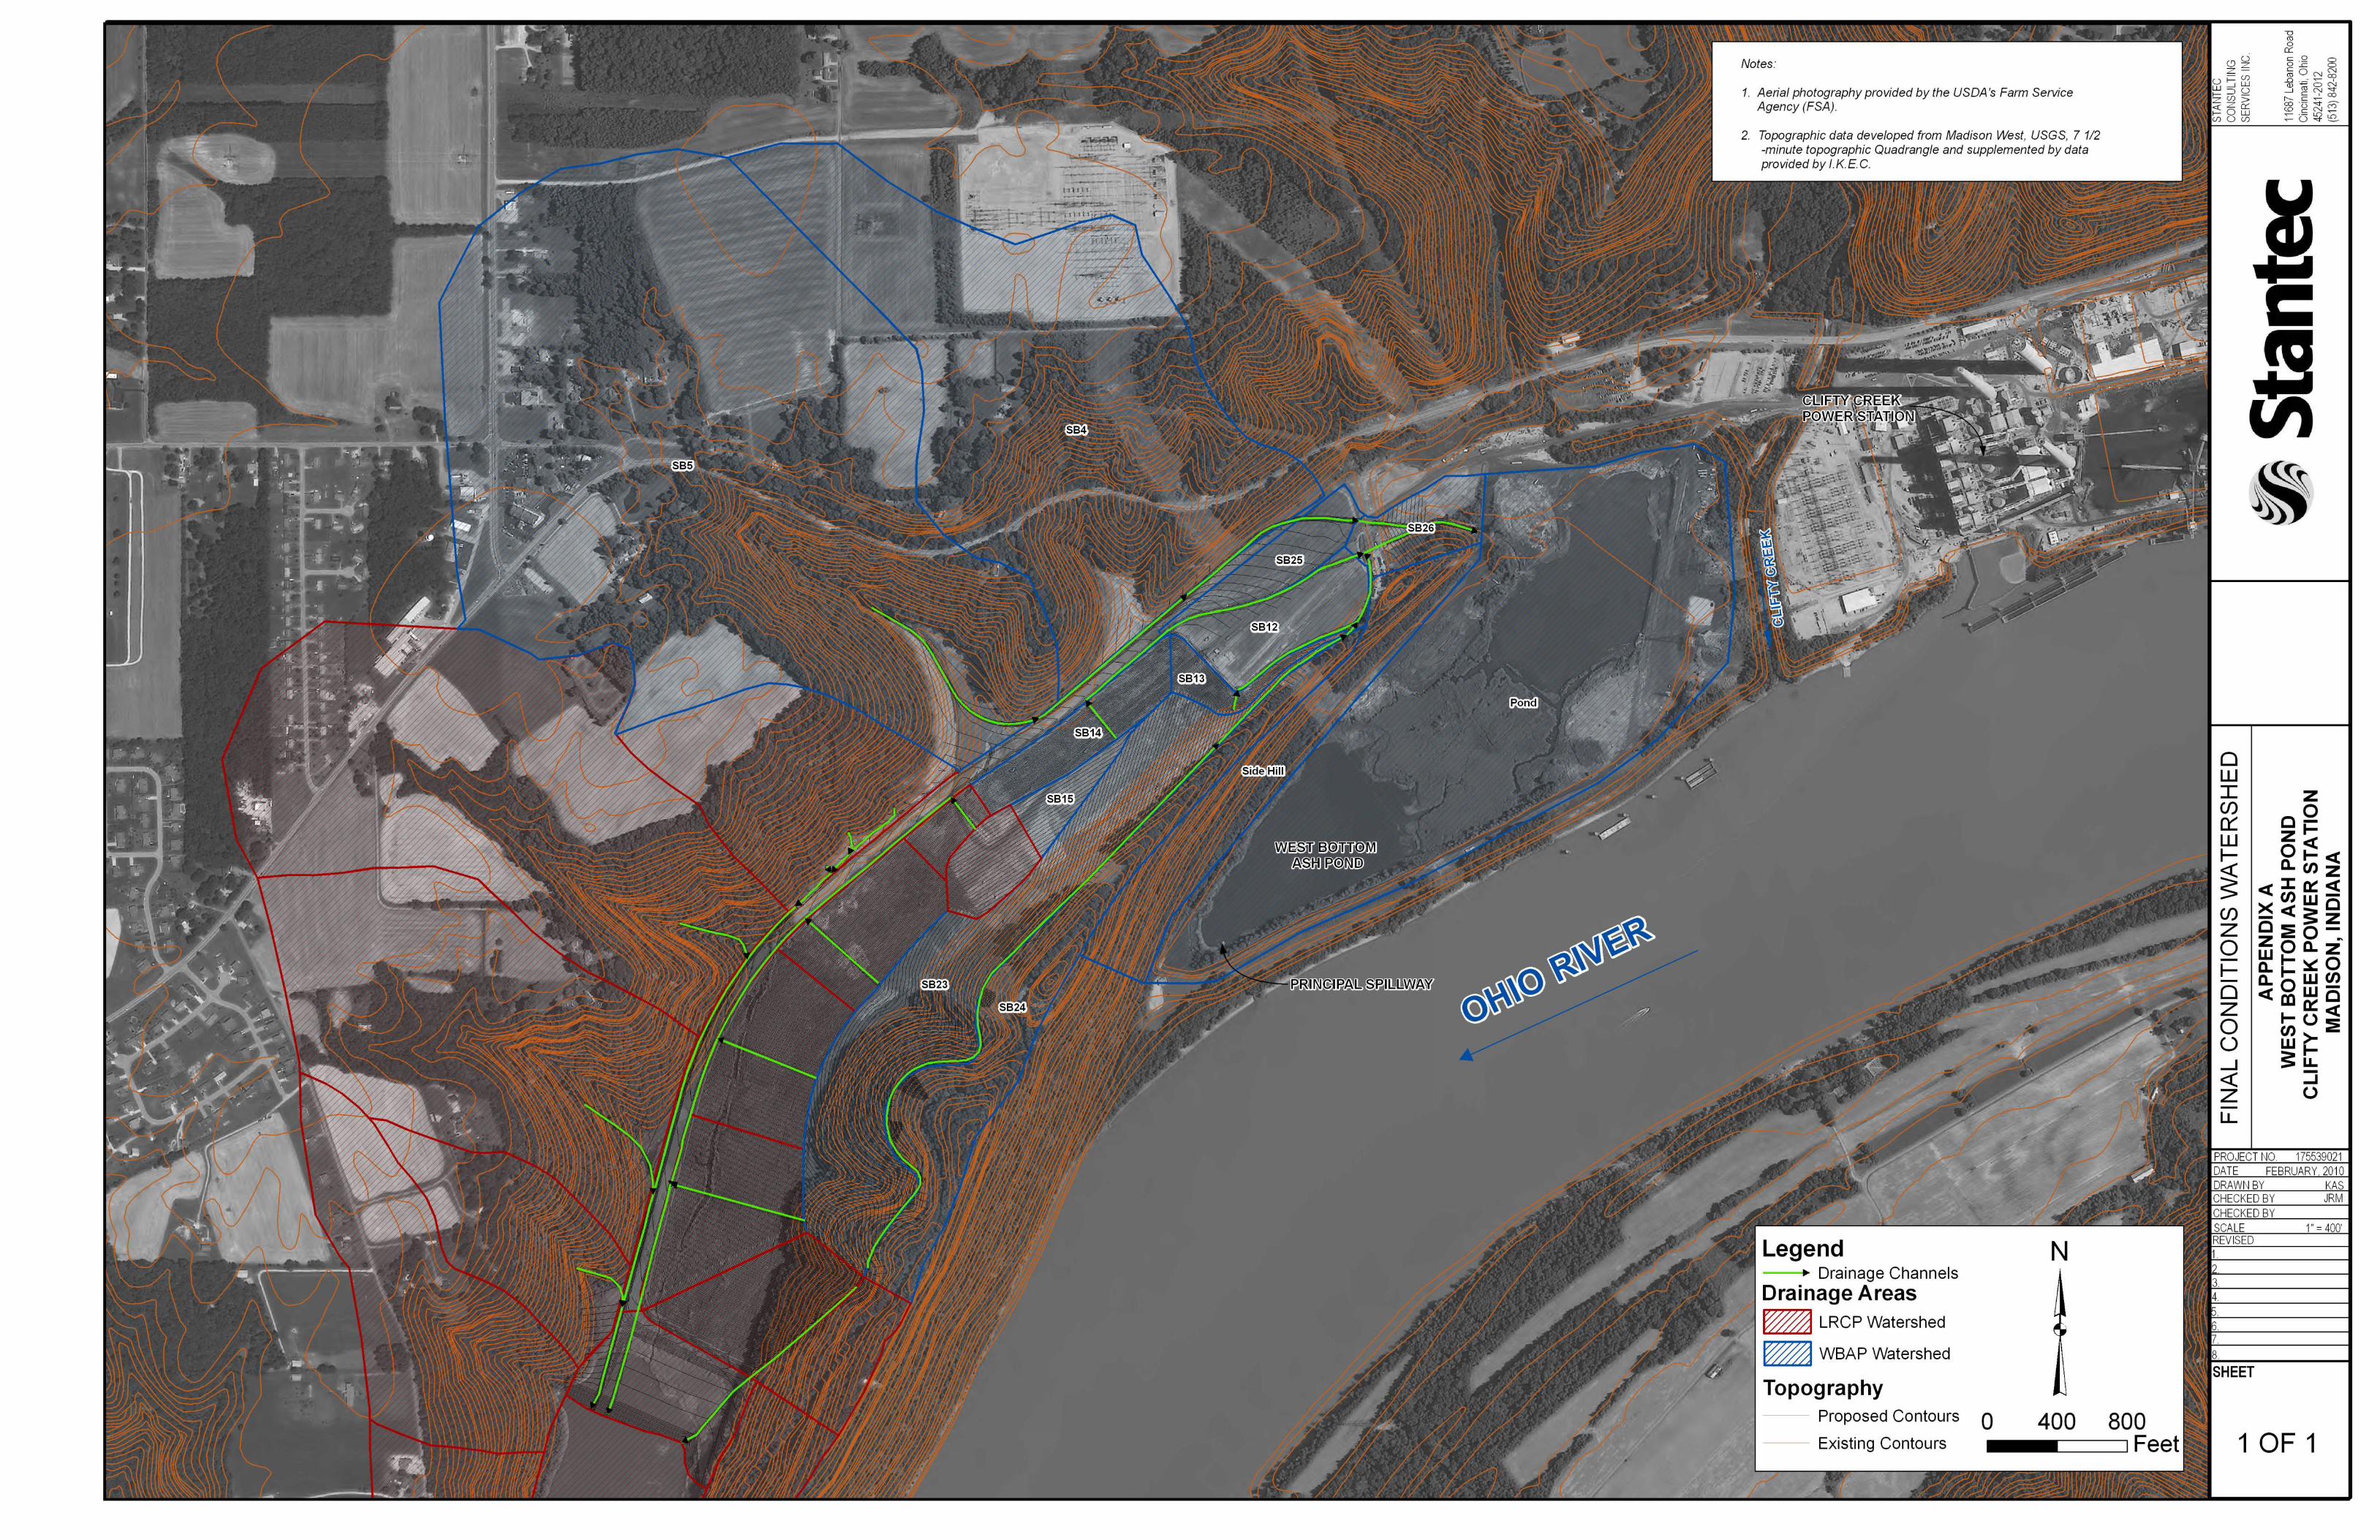
Service (Reference 5). The resultant watershed runoff hydrograph is presented in Appendix B. A drawing of the watershed layout is provided in Appendix A.

RESERVOIR ROUTING ANALYSIS WEST BOTTOM ASH POND Reservoir Routing
4
3.0 Reservoir Routing
Following the development of runoff parameters, the subsequent flows were routed through the reservoir. The WBAP storage, principal spillway and embankment characteristics were input into the HEC-HMS model to perform the reservoir routing analyses.
3.1 STAGE-STORAGE INFORMATION
The stage-storage information input into the model was used in the determination of the water level in the reservoir. The stage-storage data was calculated from 2005 topographic mapping provided by AEP (Reference 6). Table 2 lists the cumulative storage volume for a given elevation.
Table 2. WBAP Stage-Storage Elevation (feet) Storage (acre-feet)
433 0.0 435 161.4 437 324.4 439 488.9 441 654.9 443 822.5 445 991.6 447 1,162.2 449 1,334.4 451 1,508.1 453 1,683.4 455 1,860.2 457 2,038.6 459 2,218.5 461 2,399.9 463 2,582.9 465 2,767.4 467 2,953.4 469 3,141.0 471 3,330.1 473 3,520.8 475 3,713.0
3.2 DAM EMBANKMENT
The 2-foot contour interval topographic data (Reference 6) provided by AEP indicates that the crest elevation of the dam varies between 470 and 472 feet. A recent dam assessment report

RESERVOIR ROUTING ANALYSIS WEST BOTTOM ASH POND Reservoir Routing
5
dated September 14, 2009 prepared by GZA GeoEnvironmental Inc. stated that the low spot on the dam crest is at an elevation of 469 feet (Reference 8).
3.3 PRINCIPAL SPILLWAY
The WBAP spillway is a reinforced concrete box riser structure. One side of the structure has a 3-foot wide opening which acts as a weir and allows for adjustment of the water level using stop logs. The riser structure outlets to the Ohio River at elevation 426.8 feet through a 36-inch diameter, 450-foot long reinforced concrete pipe. The existing elevation of the weir provided by AEP was 442 feet. In order to account for the full range of possible water surface elevations, the principal spillway was modeled assuming the maximum stop log position of 457.7 feet. A rating curve was developed for the principal spillway and input into the HEC-HMS model to replicate the hydraulic behavior of the spillway. The rating curve of the principal spillway used in the reservoir routing models, provided in Figure 1, assumes a normal high water surface elevation of 432.8 on the Ohio River. The WBAP does not have an emergency spillway, therefore none was modeled.

FIGURE 1 West Bottom Ash Pond Rating Curve
457
458
459
460
461
462
463
464
465
466
467
468
469
470
471
0 20 40 60 80 100 120 140 160 180 200
Discharge (cfs)
Elev
atio
n (ft
)
West Bottom Ash Pond Outlet
Notes: Stop logs assumed to be set at elevation 457.7 feet.

RESERVOIR ROUTING ANALYSIS WEST BOTTOM ASH POND Results
7
4.0 Results
The reservoir routing model indicates that, with the stop logs set to the maximum elevation of 457.7 feet, the WBAP peak PMP and 50% PMP water surface elevations were 468.4 and 462.8 feet respectively. Based on a minimum crest elevation of 469 feet, the results of the reservoir routing analysis indicate that the WBAP dam is currently capable of passing flows generated from the PMP and 50% PMP while maintaining a minimum freeboard of 0.4 and 5.2 feet, respectively. With the rating curve and normal pool elevation adjusted to reflect the current stop log elevation setting of 442 feet, the model estimated the peak PMP and 50% PMP water surface elevations to be 454 and 447.5 feet, respectively. The modeled freeboard of the WBAP ranges from 15 to 0.4 feet for the PMP and 21 to 5.2 feet for the 50% PMP depending on the settings of the stop logs in the outlet structure.

RESERVOIR ROUTING ANALYSIS WEST BOTTOM ASH POND Bibliography and References
8
5.0 Bibliography and References
1. U.S. Army Corps of Engineers, Hydrologic Engineering Center, HEC-HMS Hydrology Modeling System, Version 3.1.0 Davis, California, May 2003.
2. Natural Resources Conservation Service, National Engineering Handbook (NEH)
Section 4: Hydrology, September 1997. 3. U.S. Department of Agriculture, Soil Conservation Service, Technical Release No. 55,
Urban Hydrology for Small Watersheds, January 1975. 4. Indiana Department of Natural Resources, General Guidelines for New Dams and
Improvements to Existing Dams in Indiana, 2001.` 5. National Oceanic and Atmospheric Administration, Office of Hydrology, National
Weather Service, Hydrometeorlogical Report No. 51, Maximum Precipitation Estimates, United States East of the 105th Meridian, June 1978. Reprinted August 1980.
6. Henderson Aerial Surveys Inc., Clifty Creek East Pond NAVD 27/NAVD88 in South, (2
foot contours), aerial photography exposed on 4/16/2005. 7. Indiana Kentucky Electric Corp, Clifty Creek Plant, Plot Plan. Drawings: Dwg. 16-
3002A-3, 16-3002-5, Sheets 2 and 3 of 5, August 19, 1953.
8. GZA GeoEnvironmental, Inc. (GZA),” Dam Assessment Report, Clifty Creek Station, West Bottom Ash Pond,” Inspection Date: June 10 -11, 2009, Report Date: September 14, 2009.

Appendix A
Watershed Layout

Appendix B
Hydrographs

APPENDIX B -WBAP PMP Hydrographs
0
1,000
2,000
3,000
4,000
5,000
6,000
7,000
8,000
0:00 2:00 4:00 6:00 8:00 10:00 12:00
Time (HRS)
Flow
(CFS
)
PMP Inflow Hydrograph
PMP Outflow Hydrograph
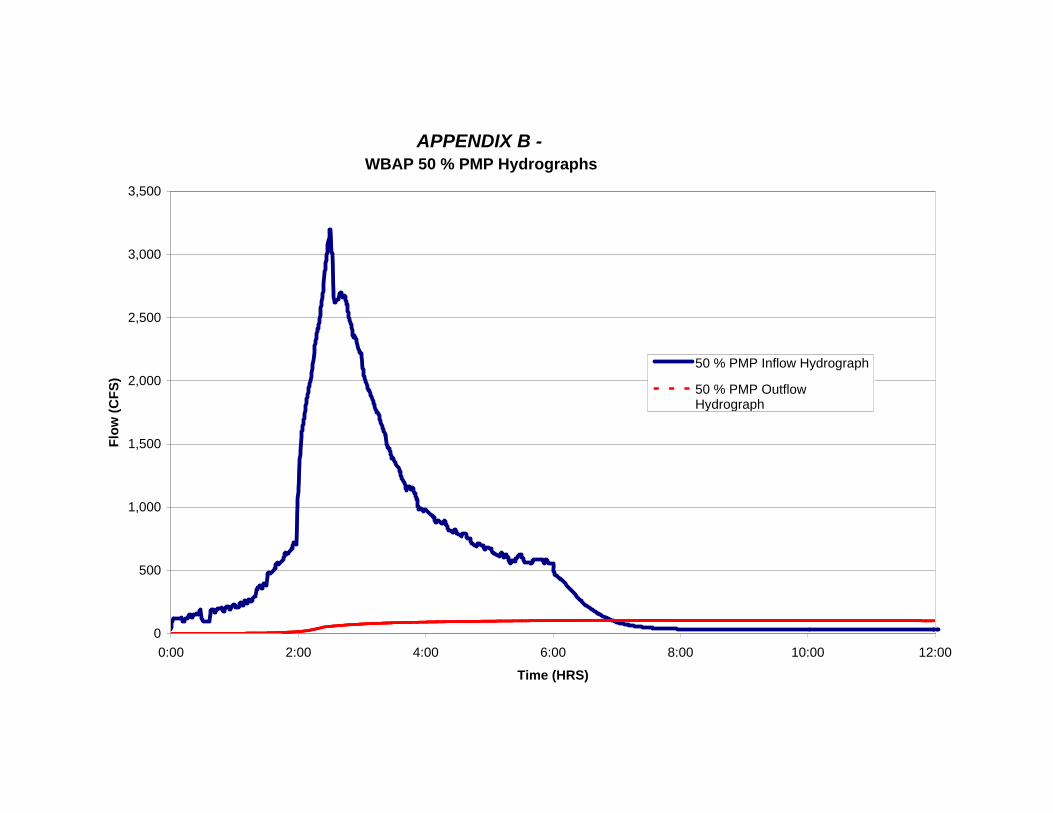
APPENDIX B -WBAP 50 % PMP Hydrographs
0
500
1,000
1,500
2,000
2,500
3,000
3,500
0:00 2:00 4:00 6:00 8:00 10:00 12:00
Time (HRS)
Flow
(CFS
)
50 % PMP Inflow Hydrograph
50 % PMP OutflowHydrograph


