32
Reservoirs Balancing Supply and Demand Ashokan Kensico Hillview Croton Reservoir Spillway
| Date post: | 21-Dec-2015 |
| Category: |
Documents |
| View: | 224 times |
| Download: | 1 times |
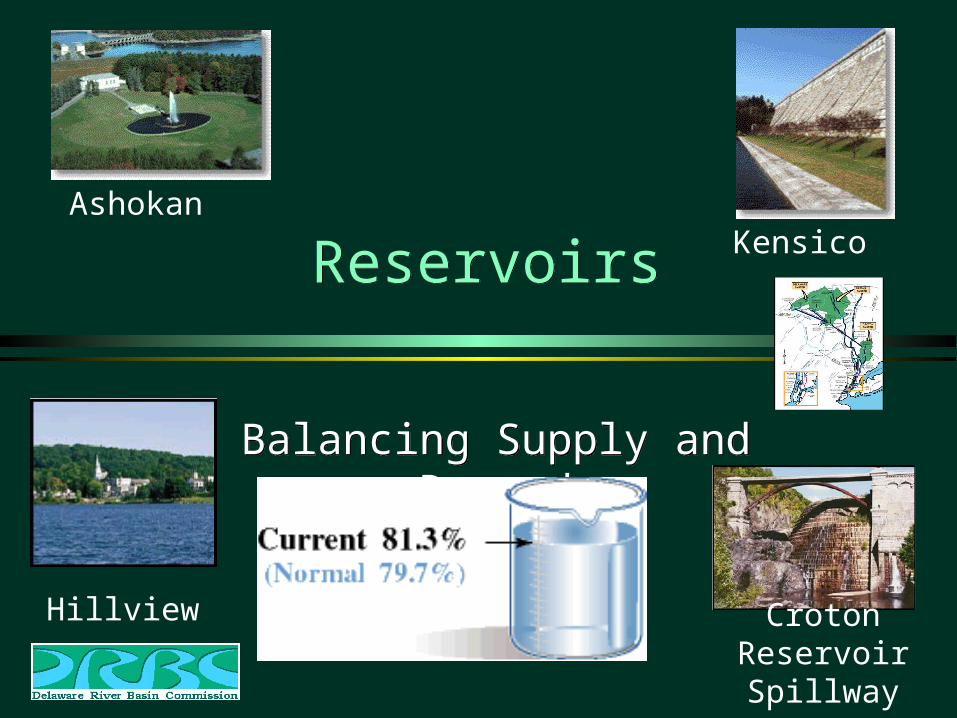
ReservoirsReservoirs
Balancing Supply and DemandBalancing Supply and Demand
AshokanKensico
Hillview Croton Reservoir Spillway
Water Supply and Demand Fluctuations
Water Supply and Demand Fluctuations
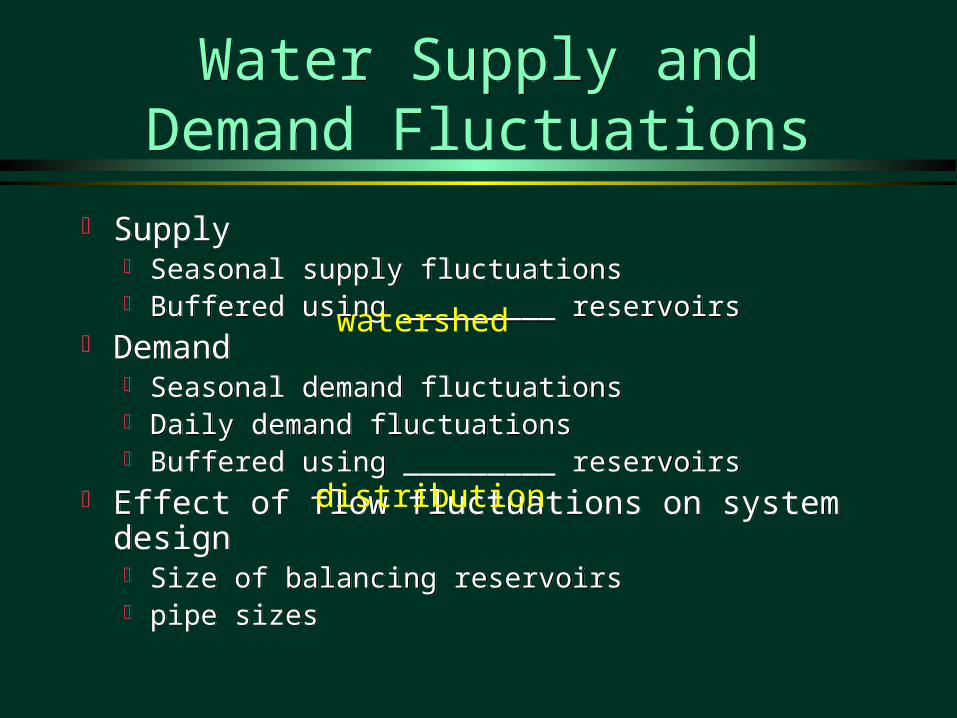
Supply Seasonal supply fluctuations Buffered using _________ reservoirs
Demand Seasonal demand fluctuations Daily demand fluctuations Buffered using _________ reservoirs
Effect of flow fluctuations on system design Size of balancing reservoirs pipe sizes
Supply Seasonal supply fluctuations Buffered using _________ reservoirs
Demand Seasonal demand fluctuations Daily demand fluctuations Buffered using _________ reservoirs
Effect of flow fluctuations on system design Size of balancing reservoirs pipe sizes
watershed
distribution
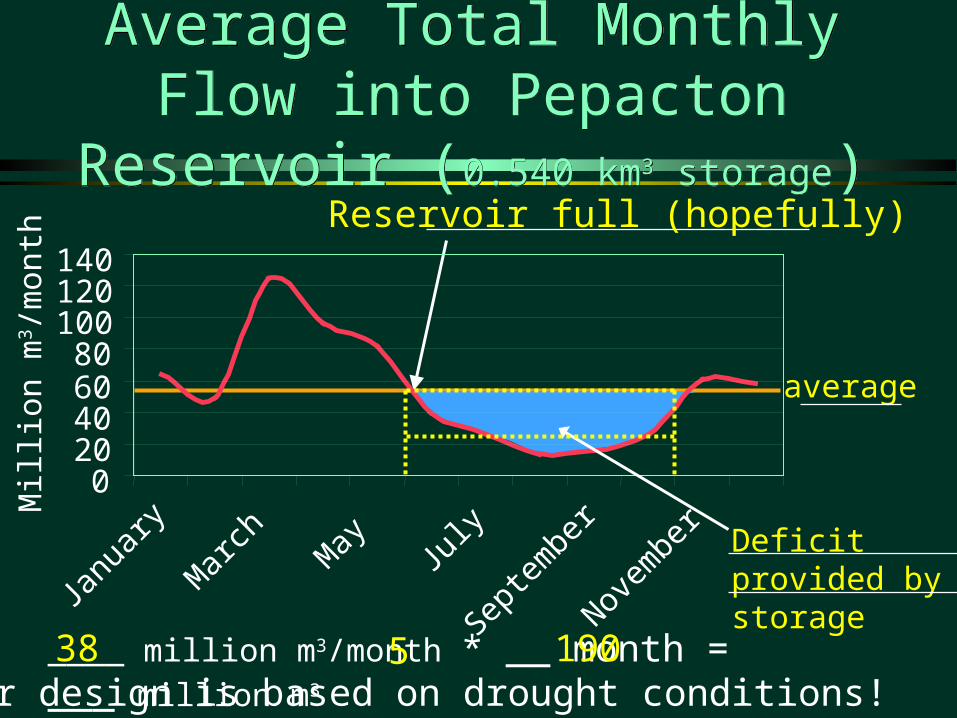
Average Total Monthly Flow into Pepacton Reservoir (0.540 km3 storage)Average Total Monthly Flow into Pepacton Reservoir (0.540 km3 storage)
020406080
100120140
Janu
ary
Marc
hM
ay July
Septem
ber
Novem
ber
Mil
lion
m3 /
mon
th
Reservoir full (hopefully)
average
Deficit provided by storage
Better design is based on drought conditions!____ million m3/month * __ month = ___ million m338 5 190
What is the safe yield from the Cannonsville Reservoir?
What is the safe yield from the Cannonsville Reservoir?
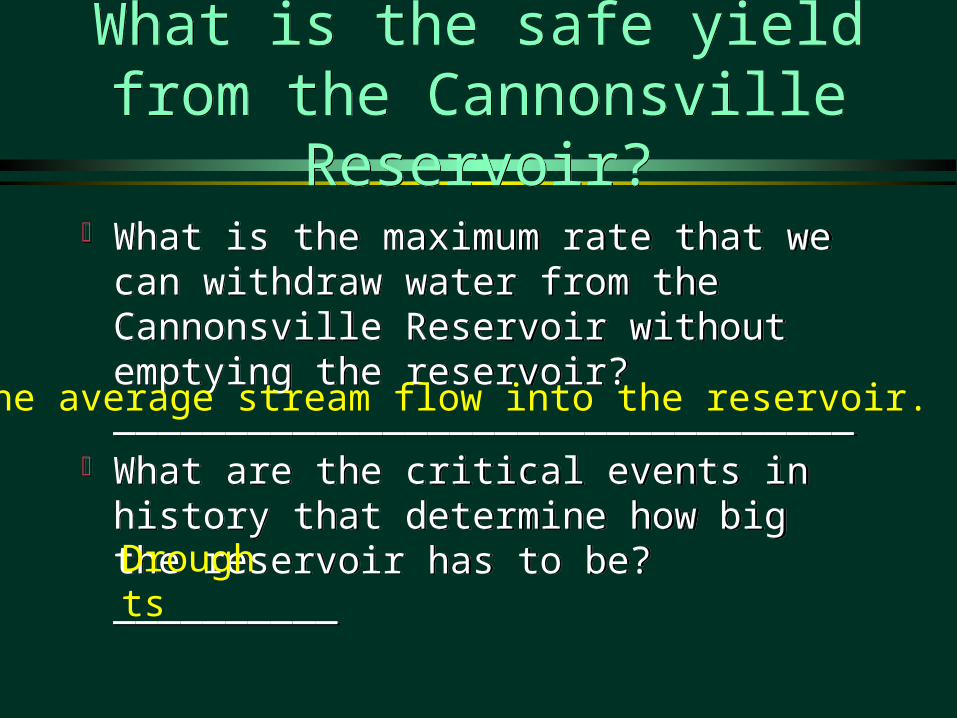
What is the maximum rate that we can withdraw water from the Cannonsville Reservoir without emptying the reservoir?_________________________________
What are the critical events in history that determine how big the reservoir has to be?__________
What is the maximum rate that we can withdraw water from the Cannonsville Reservoir without emptying the reservoir?_________________________________
What are the critical events in history that determine how big the reservoir has to be?__________
The average stream flow into the reservoir.
Droughts
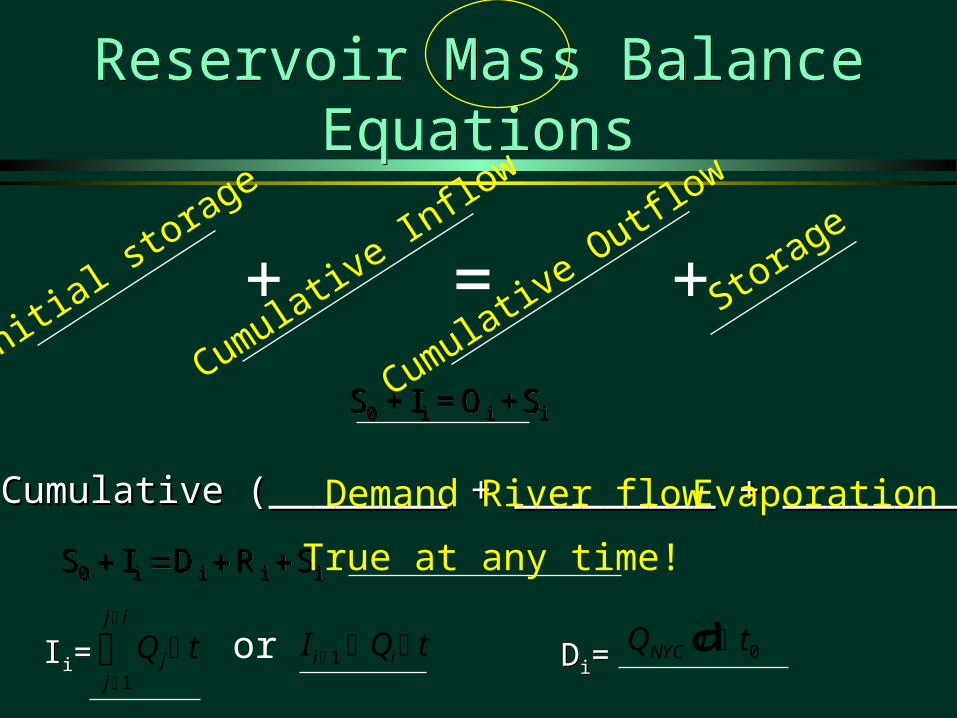
Reservoir Mass Balance Equations
Reservoir Mass Balance Equations
Di=Di=Ii=Ii=
+ +=
0 i i iS I O S+ = +0 i i iS I O S+ = +
iiii0 SRDIS iiii0 SRDIS
O = Cumulative (________ + _________ + ___________ )O = Cumulative (________ + _________ + ___________ )
Initial st
orage
Cumulative I
nflow
Cumulative O
utflow
Storage
Demand River flow Evaporation
True at any time!
Q tjj
j i
1
I Q ti i 1 or Q t tNYC 0a f
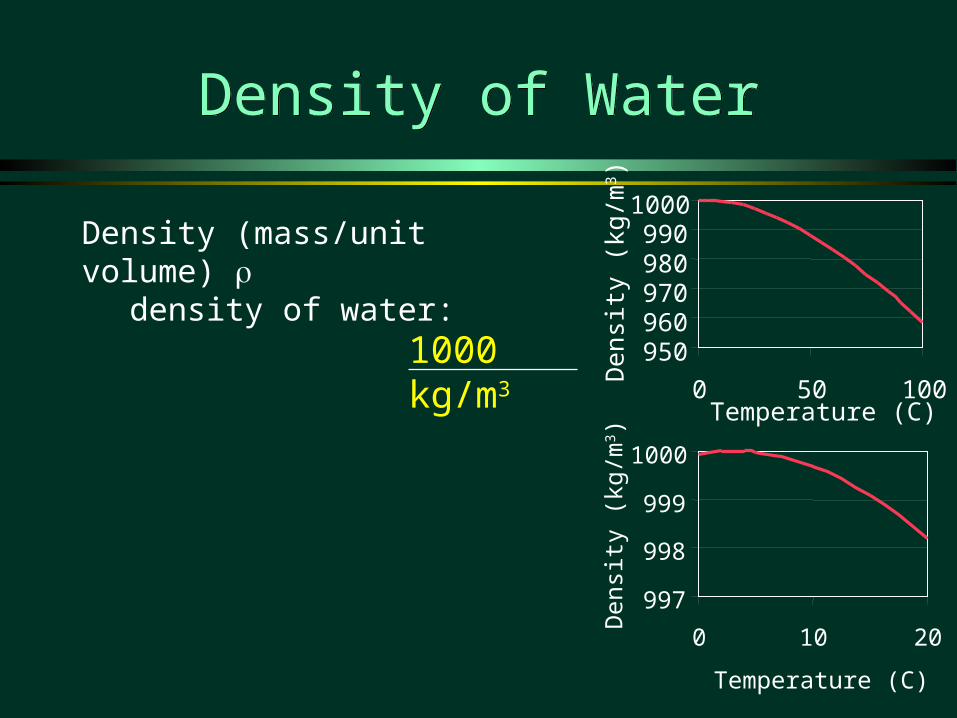
Density of WaterDensity of Water
950960970980990
1000
0 50 100Temperature (C)
Den
sity
(kg
/m3 )
997
998
999
1000
0 10 20
Temperature (C)
Den
sity
(kg
/m3 )
Density (mass/unit volume) density of water:
1000 kg/m3
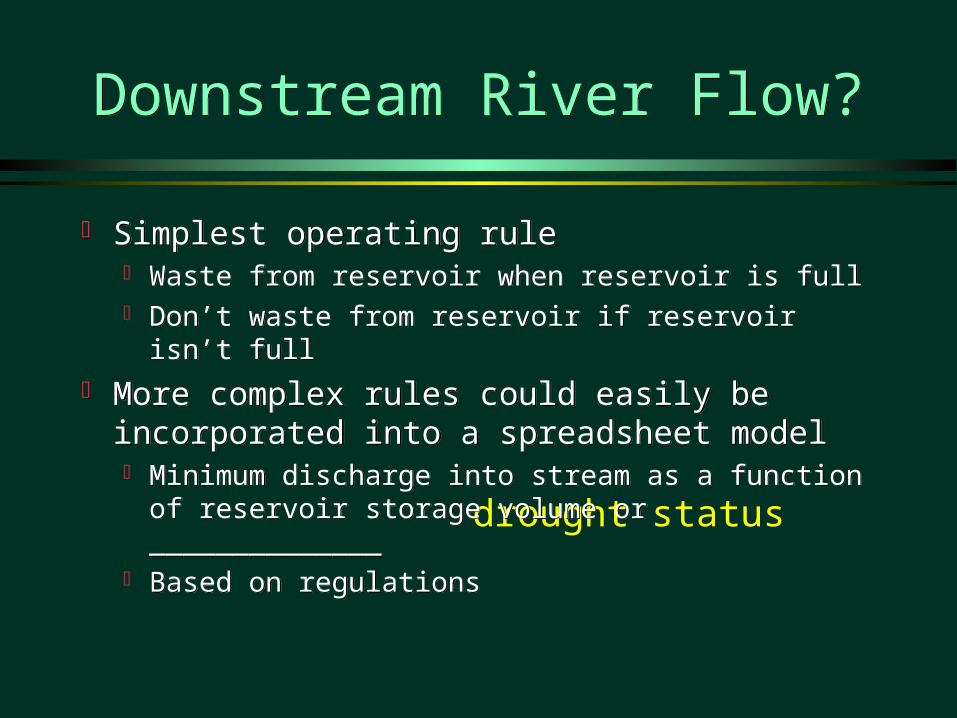
drought status
Downstream River Flow?Downstream River Flow?
Simplest operating rule Waste from reservoir when reservoir is full Don’t waste from reservoir if reservoir isn’t full
More complex rules could easily be incorporated into a spreadsheet model Minimum discharge into stream as a function of
reservoir storage volume or ______________ Based on regulations
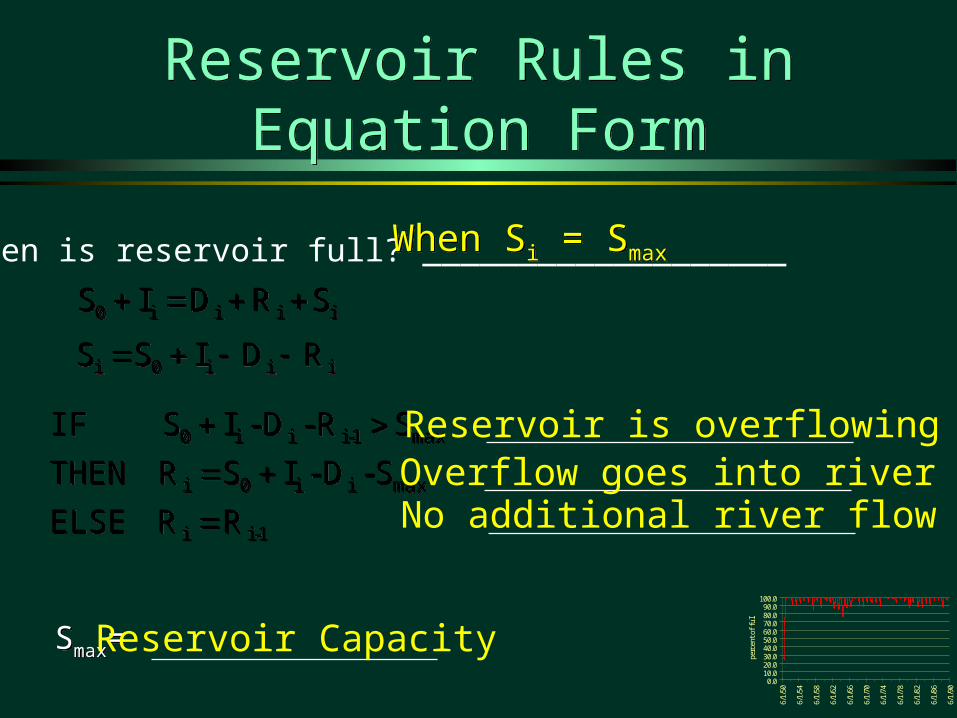
Reservoir Rules in Equation Form
Reservoir Rules in Equation Form
Smax=Smax=
When is reservoir full? ___________________
iiii0 SRDIS iiii0 SRDIS
1-ii
maxii0i
max1-iii0
RR ELSE
S-D-ISR THEN
SR-D-IS IF
1-ii
maxii0i
max1-iii0
RR ELSE
S-D-ISR THEN
SR-D-IS IF
iii0i RDISS iii0i RDISS
Reservoir Capacity
When Si = SmaxWhen Si = Smax
Reservoir is overflowingOverflow goes into riverNo additional river flow
0.010.020.030.040.050.060.070.080.090.0
100.0
6/1/
50
6/1/
54
6/1/
58
6/1/
62
6/1/
66
6/1/
70
6/1/
74
6/1/
78
6/1/
82
6/1/
86
6/1/
90
perc
ent o
f fu
ll
0.010.020.030.040.050.060.070.080.090.0
100.0
6/1/
50
6/1/
54
6/1/
58
6/1/
62
6/1/
66
6/1/
70
6/1/
74
6/1/
78
6/1/
82
6/1/
86
6/1/
90
perc
ent o
f fu
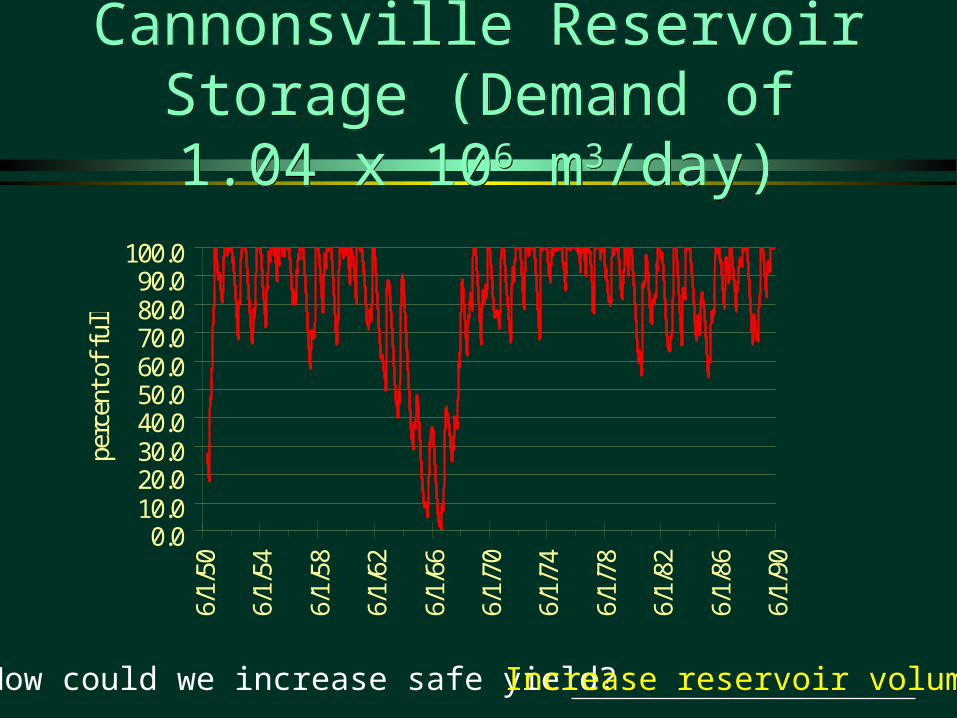
llCannonsville Reservoir Storage (Demand of 1.04 x 10⁶ m3/day)Cannonsville Reservoir Storage (Demand of 1.04 x 10⁶ m3/day)
How could we increase safe yield?Increase reservoir volume
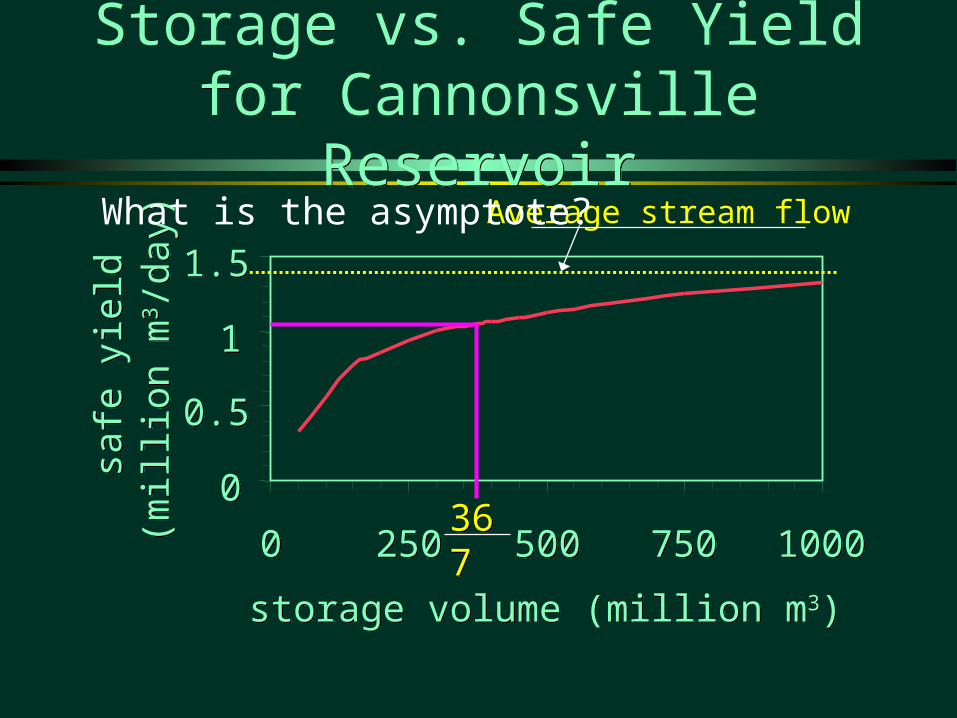
Storage vs. Safe Yield for Cannonsville Reservoir
Storage vs. Safe Yield for Cannonsville Reservoir
00
0.50.5
11
1.51.5
00 250250 500500 750750 10001000
storage volume (million m3)storage volume (million m3)
safe
yie
ldsa
fe y
ield
(mil
lion
m3 /
day)
(mil
lion
m3 /
day)
367367
Average stream flowWhat is the asymptote?
NYC ReservoirsNYC Reservoirs
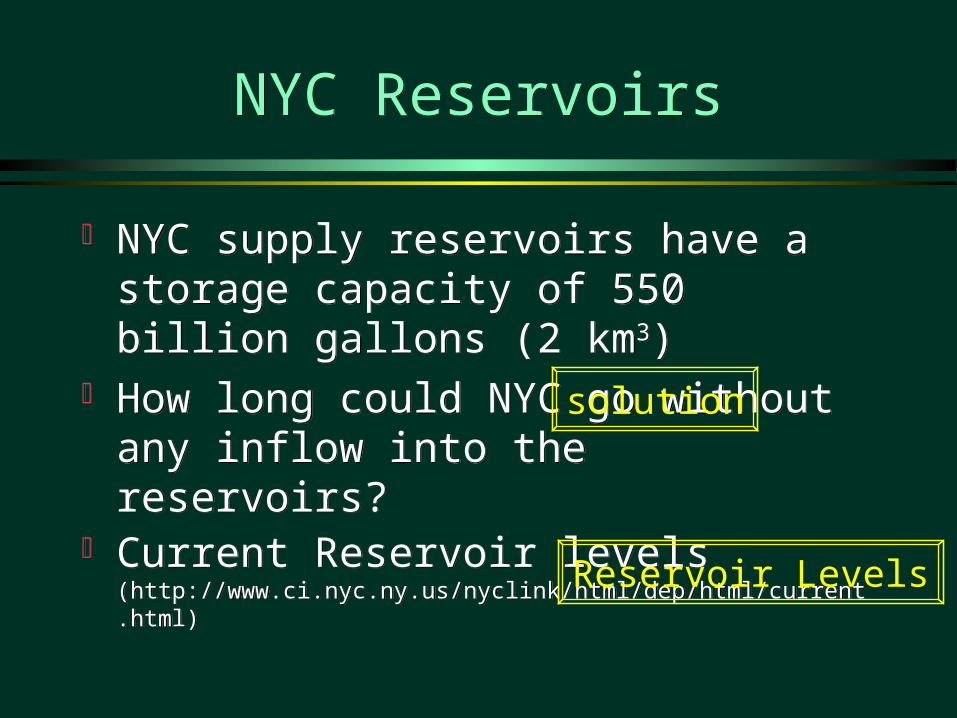
NYC supply reservoirs have a storage capacity of 550 billion gallons (2 km3)
How long could NYC go without any inflow into the reservoirs?
Current Reservoir levels (http://www.ci.nyc.ny.us/nyclink/html/dep/html/current.html)
NYC supply reservoirs have a storage capacity of 550 billion gallons (2 km3)
How long could NYC go without any inflow into the reservoirs?
Current Reservoir levels (http://www.ci.nyc.ny.us/nyclink/html/dep/html/current.html)
Reservoir Levels
solution
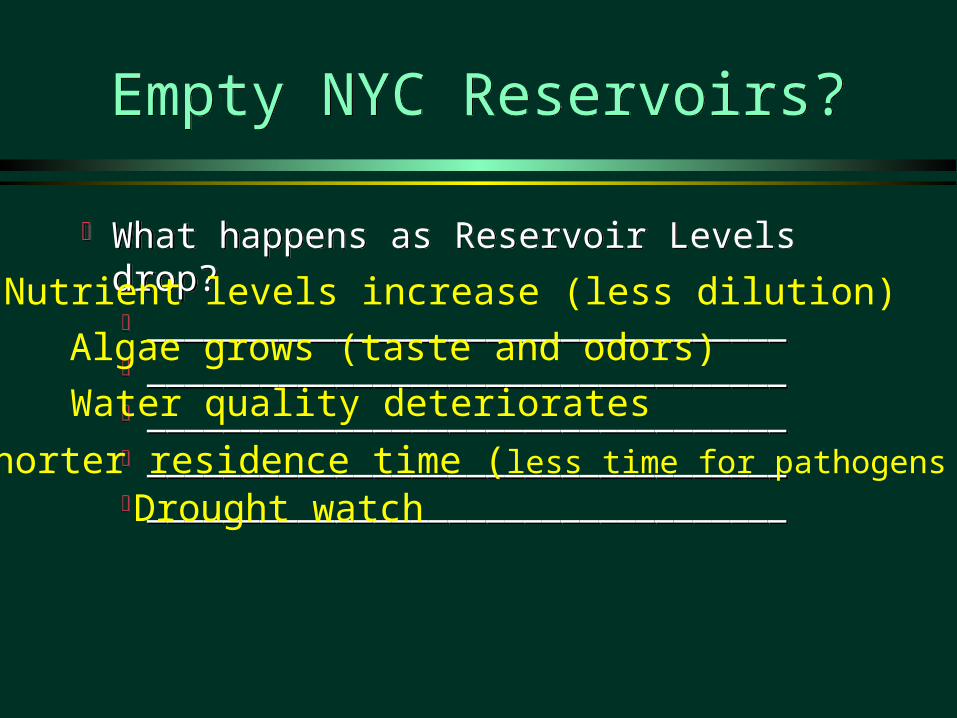
What happens as Reservoir Levels drop? __________________________________ __________________________________ __________________________________ __________________________________ __________________________________
What happens as Reservoir Levels drop? __________________________________ __________________________________ __________________________________ __________________________________ __________________________________
Empty NYC Reservoirs?Empty NYC Reservoirs?
Nutrient levels increase (less dilution)
Water quality deteriorates
Algae grows (taste and odors)
Shorter residence time (less time for pathogens to die)Drought watch
Seasonal, Daily, and Hourly Fluctuations
Seasonal, Daily, and Hourly Fluctuations
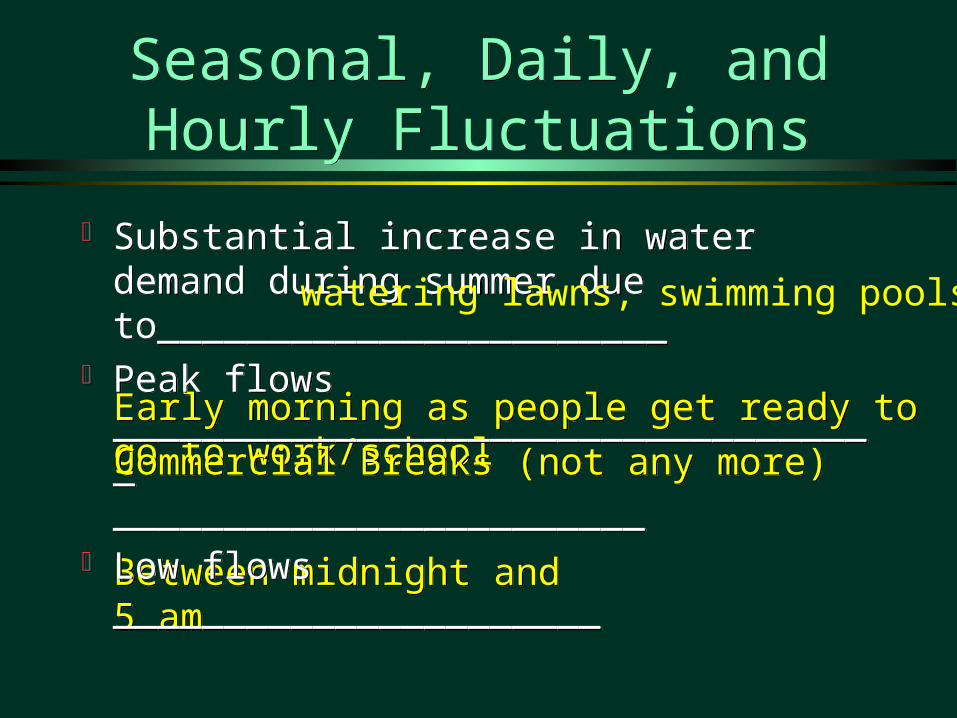
Early morning as people get ready to go to work/schoolEarly morning as people get ready to go to work/school
Commercial Breaks (not any more)Commercial Breaks (not any more)
Between midnight and 5 amBetween midnight and 5 am
Substantial increase in water demand during summer due to_______________________
Peak flows___________________________________________________________
Low flows______________________
Substantial increase in water demand during summer due to_______________________
Peak flows___________________________________________________________
Low flows______________________
watering lawns, swimming pools
Estimates of Daily and Hourly Fluctuations*
Estimates of Daily and Hourly Fluctuations*
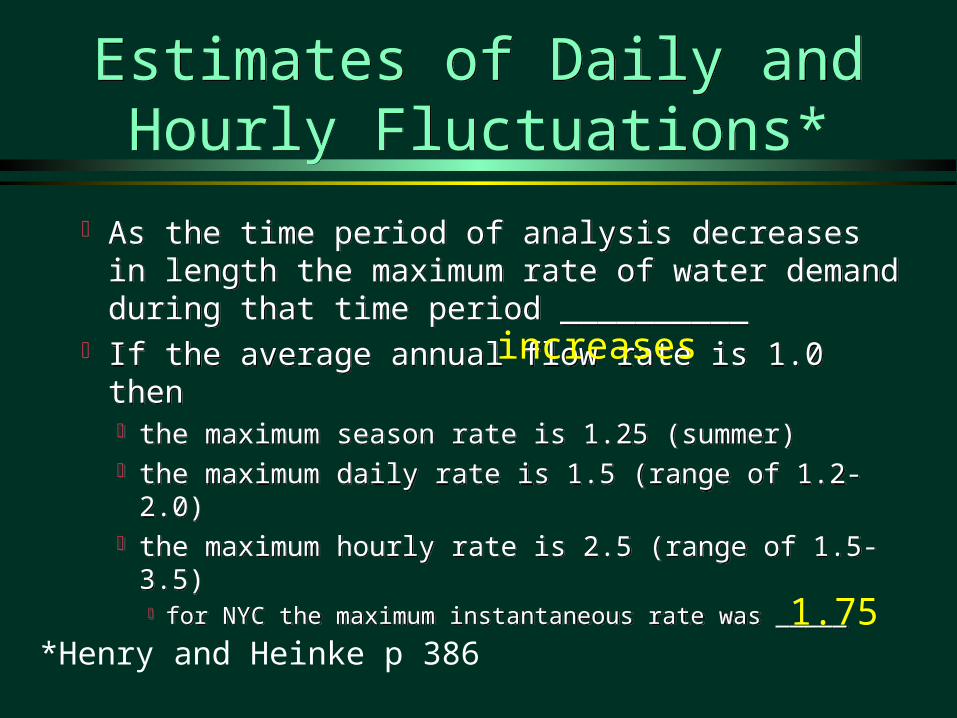
As the time period of analysis decreases in length the maximum rate of water demand during that time period __________
If the average annual flow rate is 1.0 then the maximum season rate is 1.25 (summer) the maximum daily rate is 1.5 (range of 1.2-2.0) the maximum hourly rate is 2.5 (range of 1.5-3.5)
for NYC the maximum instantaneous rate was _____
As the time period of analysis decreases in length the maximum rate of water demand during that time period __________
If the average annual flow rate is 1.0 then the maximum season rate is 1.25 (summer) the maximum daily rate is 1.5 (range of 1.2-2.0) the maximum hourly rate is 2.5 (range of 1.5-3.5)
for NYC the maximum instantaneous rate was _____*Henry and Heinke p 386
increases
1.75
Methods to Even Out Fluctuations
Methods to Even Out Fluctuations
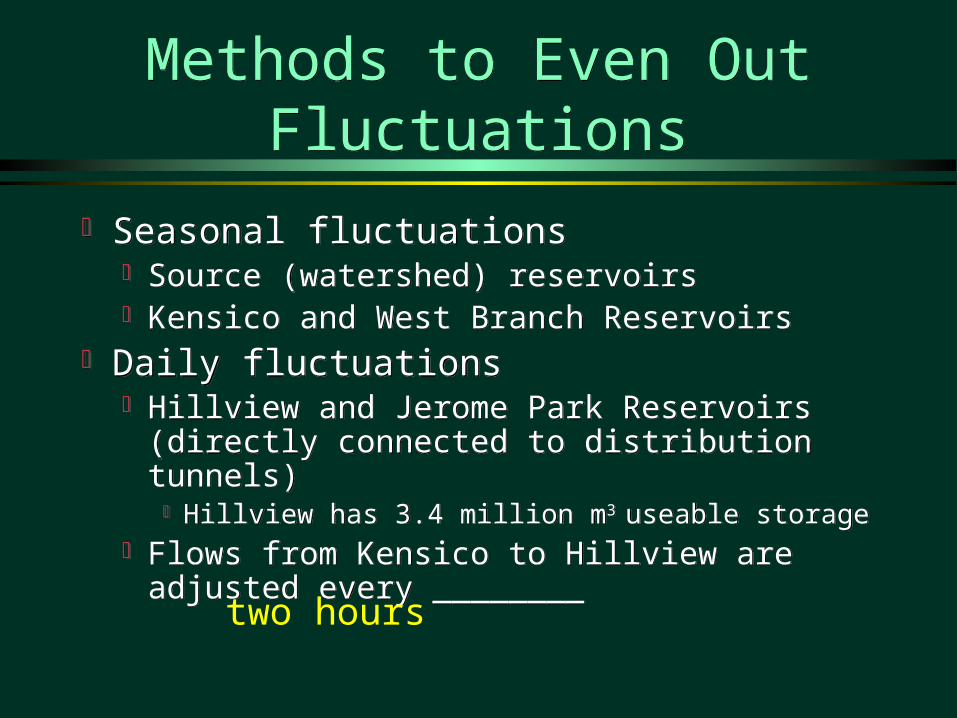
Seasonal fluctuations Source (watershed) reservoirs Kensico and West Branch Reservoirs
Daily fluctuations Hillview and Jerome Park Reservoirs (directly
connected to distribution tunnels) Hillview has 3.4 million m3 useable storage
Flows from Kensico to Hillview are adjusted every ________
Seasonal fluctuations Source (watershed) reservoirs Kensico and West Branch Reservoirs
Daily fluctuations Hillview and Jerome Park Reservoirs (directly
connected to distribution tunnels) Hillview has 3.4 million m3 useable storage
Flows from Kensico to Hillview are adjusted every ________two hours
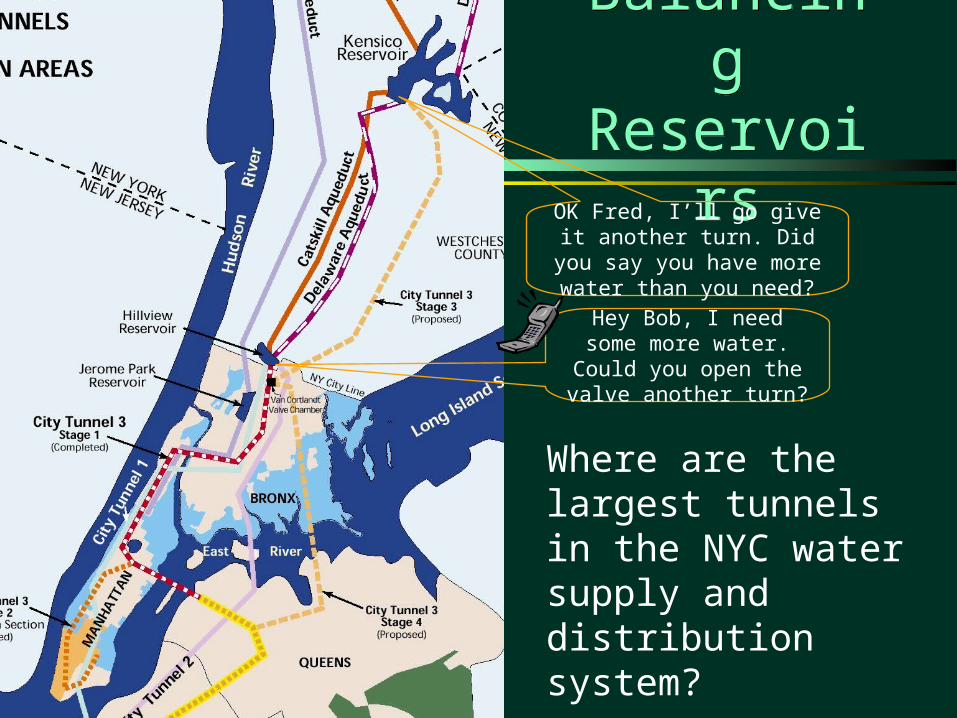
Balancing ReservoirsBalancing Reservoirs
Hey Bob, I need some more water. Could you open the
valve another turn?
OK Fred, I’ll go give it another turn. Did you say you have more water than you need?
Where are the largest tunnels in the NYC water supply and distribution system?
How Can You Estimate Required Balancing-Reservoir Capacity?
How Can You Estimate Required Balancing-Reservoir Capacity?
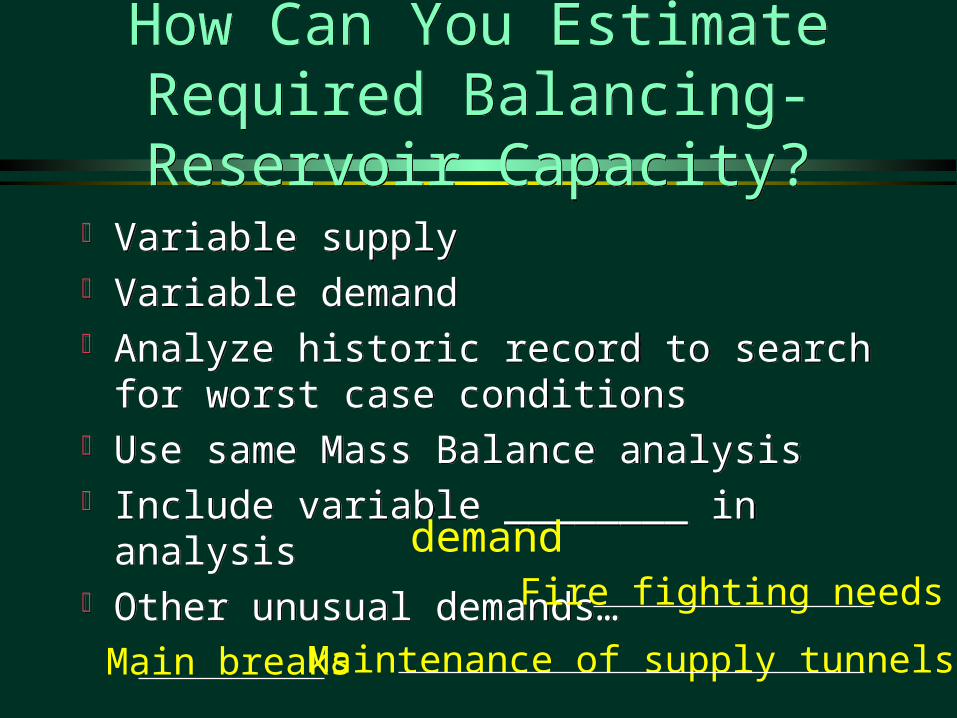
Variable supply Variable demand Analyze historic record to search for worst
case conditions Use same Mass Balance analysis Include variable ________ in analysis Other unusual demands…
Variable supply Variable demand Analyze historic record to search for worst
case conditions Use same Mass Balance analysis Include variable ________ in analysis Other unusual demands…
demandFire fighting needs
Main breaks Maintenance of supply tunnels
SummarySummary
An understanding of the variability in supply and demand are essential for the sizing of reservoirs and pipes in a water supply system
Supply Reservoirs must be sized to store water during drought periods
Balancing Reservoirs must be sized for daily or hourly fluctuations
Distribution pipes must be sized to handle peak flows
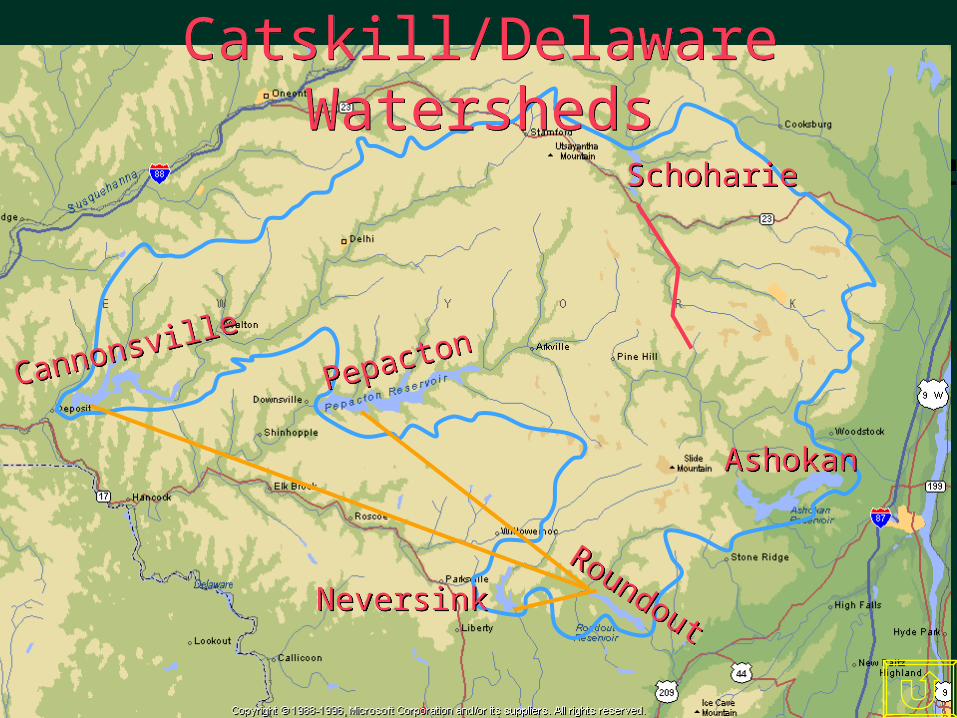
PepactonPepacton
SchoharieSchoharie
AshokanAshokan
NeversinkNeversink
Roundout
Roundout
CannonsvilleCannonsville
Catskill/Delaware WatershedsCatskill/Delaware Watersheds
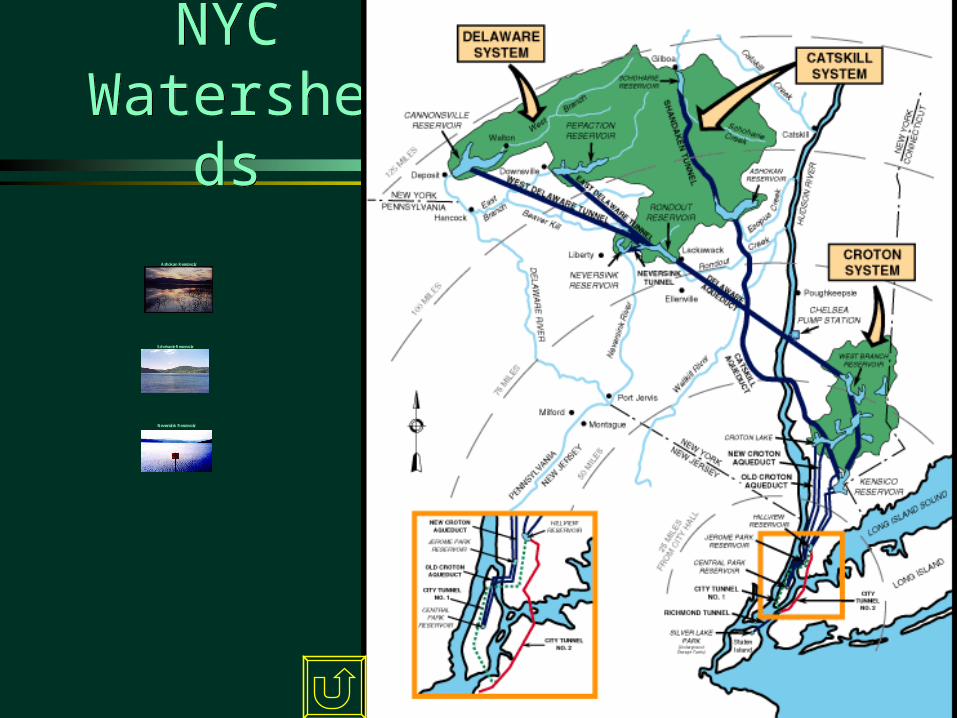
NYC Watersheds
NYC Watersheds
Ashokan ReservoirAshokan Reservoir
Schoharie ReservoirSchoharie Reservoir
Neversink ReservoirNeversink Reservoir
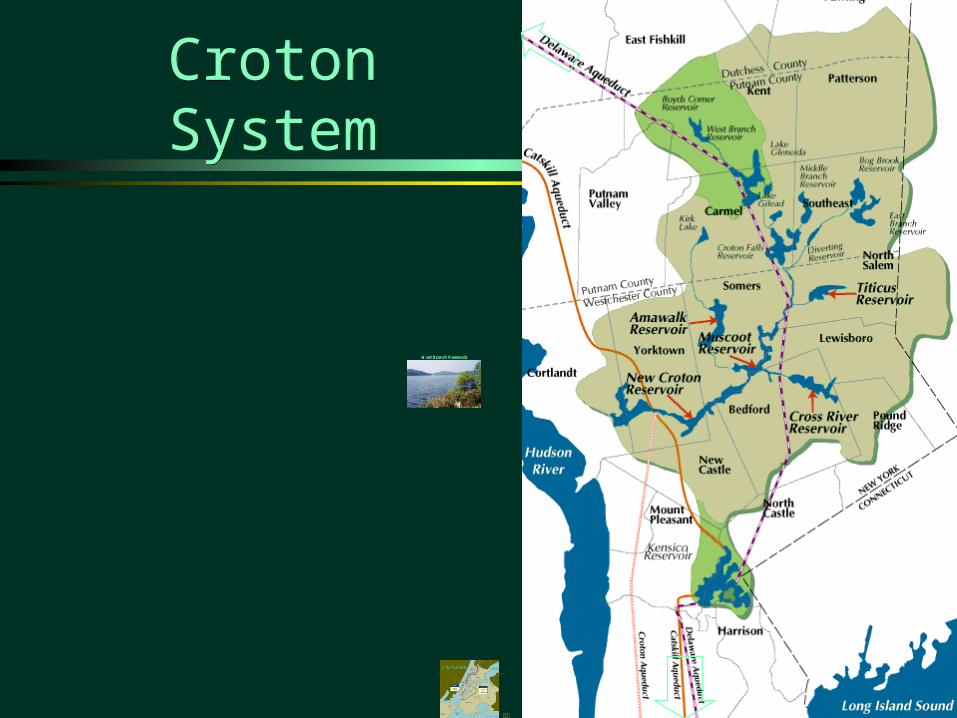
Croton SystemCroton System
West Branch ReservoirWest Branch Reservoir
City TunnelsCity Tunnels
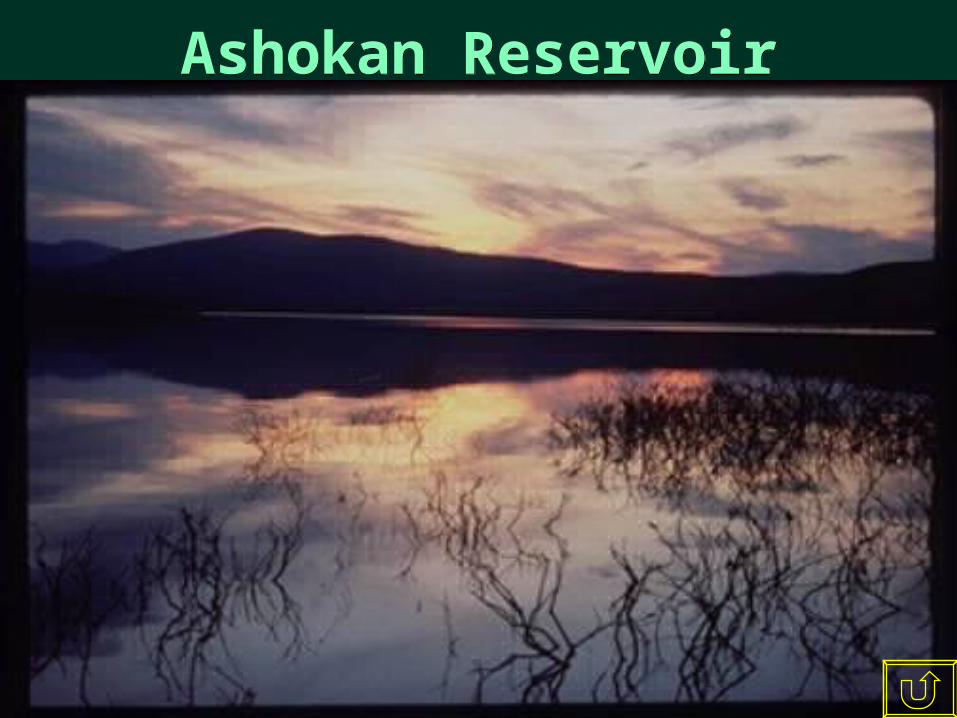
Ashokan ReservoirAshokan Reservoir
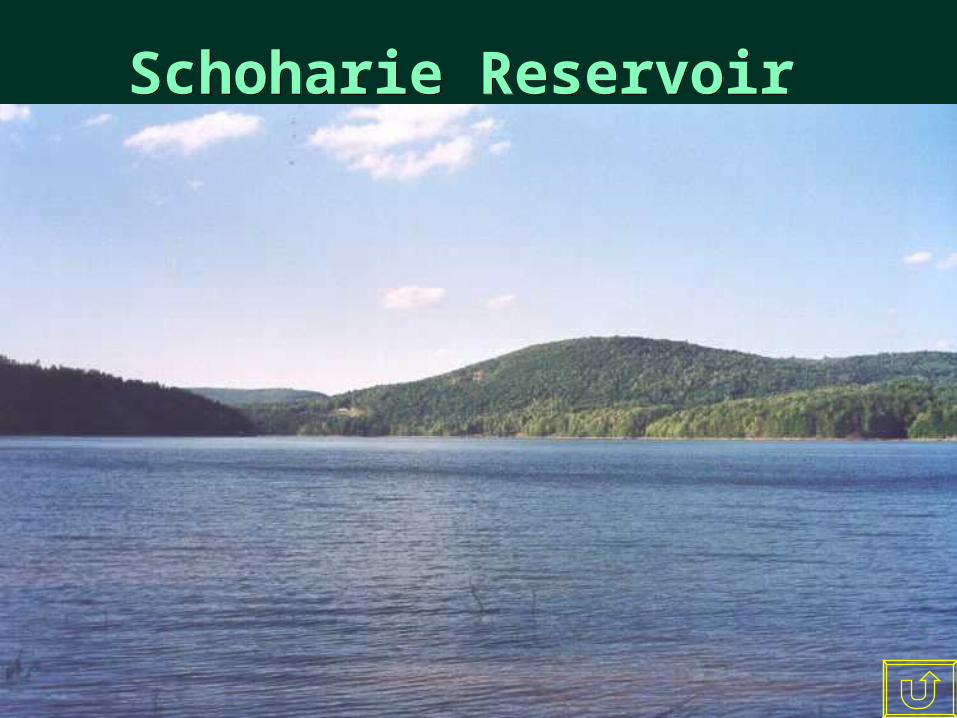
Schoharie Reservoir Schoharie Reservoir
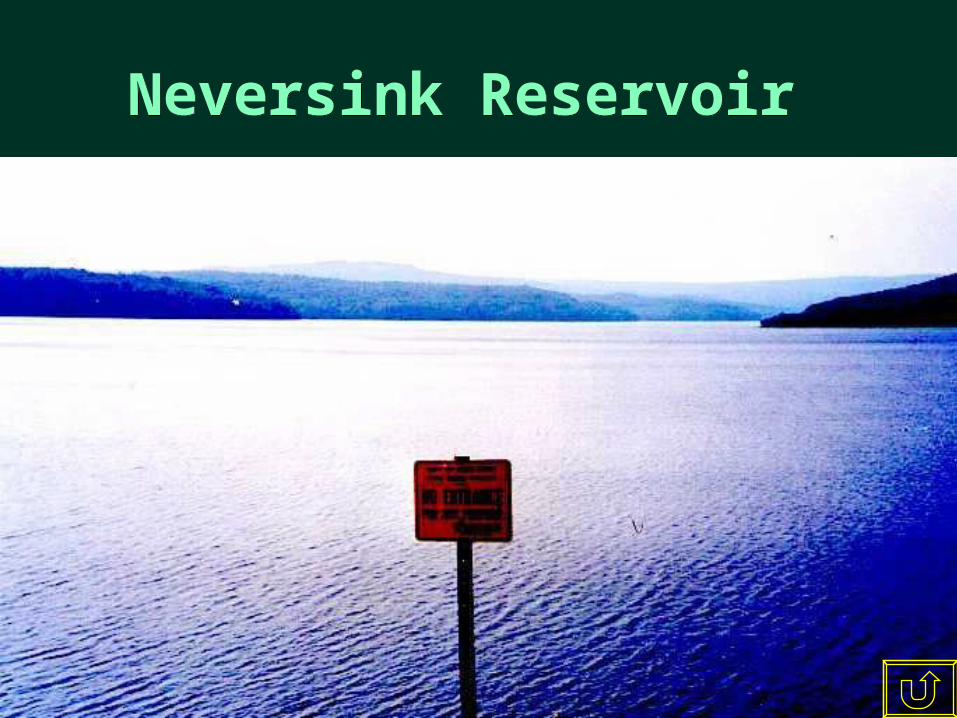
Neversink Reservoir Neversink Reservoir
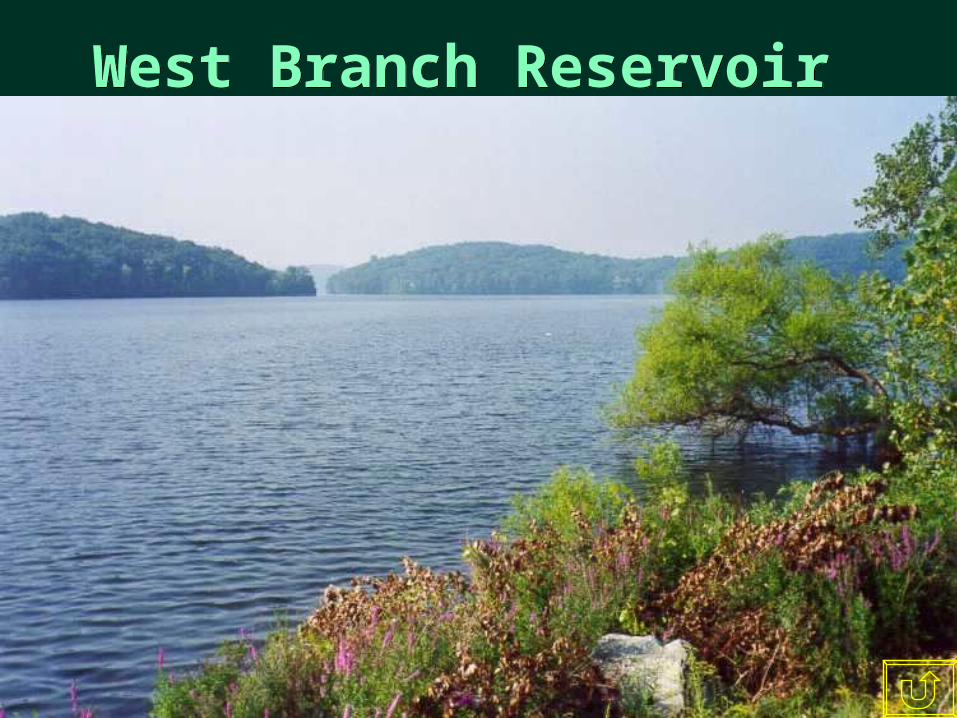
West Branch Reservoir West Branch Reservoir
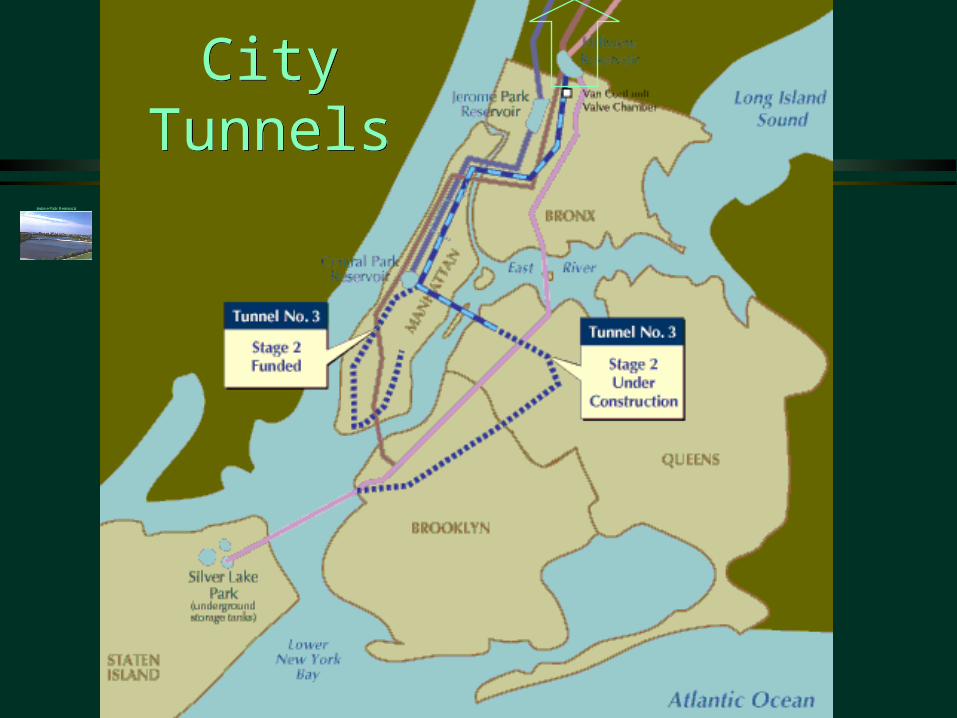
City TunnelsCity Tunnels
Jerome Park ReservoirJerome Park Reservoir
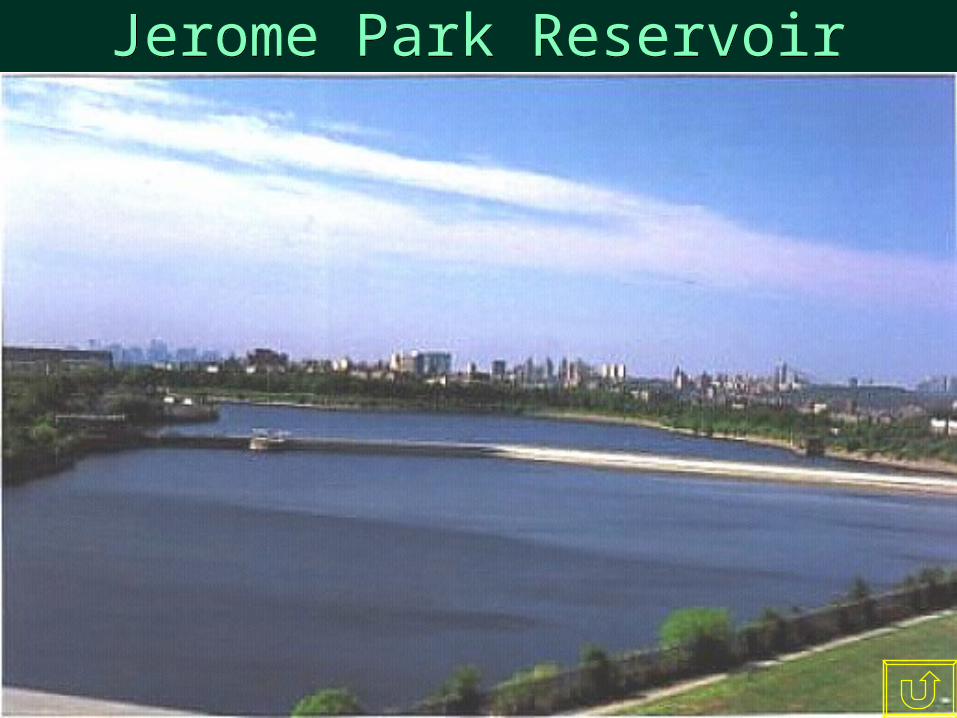
Jerome Park ReservoirJerome Park Reservoir
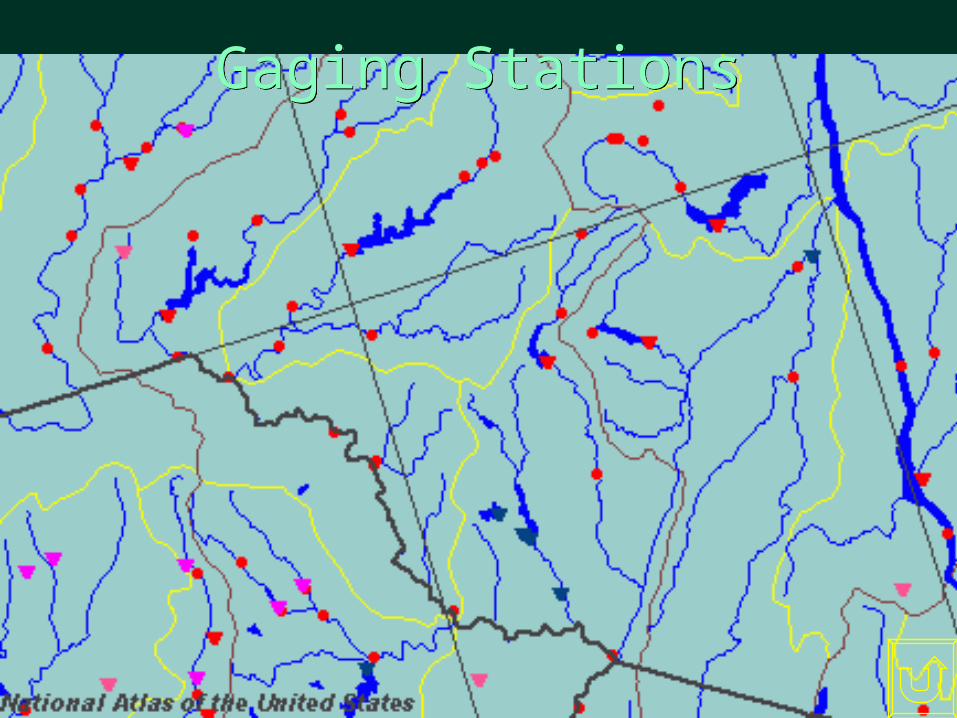
Gaging StationsGaging Stations
Empty NYC ReservoirsEmpty NYC Reservoirs
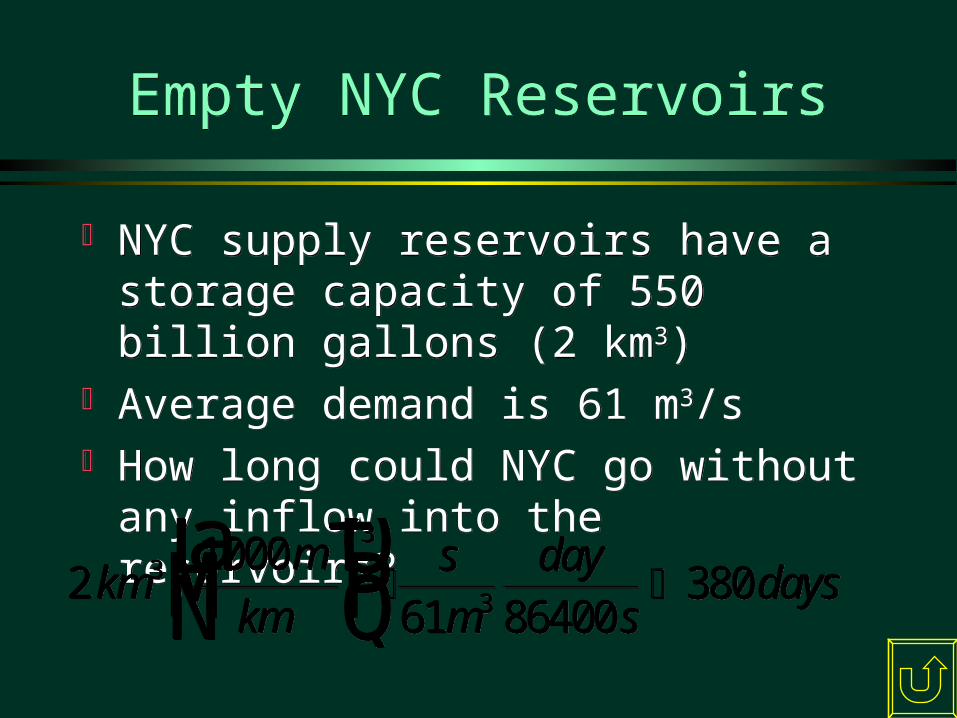
NYC supply reservoirs have a storage capacity of 550 billion gallons (2 km3)
Average demand is 61 m3/s How long could NYC go without any
inflow into the reservoirs?
NYC supply reservoirs have a storage capacity of 550 billion gallons (2 km3)
Average demand is 61 m3/s How long could NYC go without any
inflow into the reservoirs?
21000
61 864003803
3
3kmm
kmsm
days
daysa fLNM
OQP 2
1000
61 864003803
3
3kmm
kmsm
days
daysa fLNM
OQP
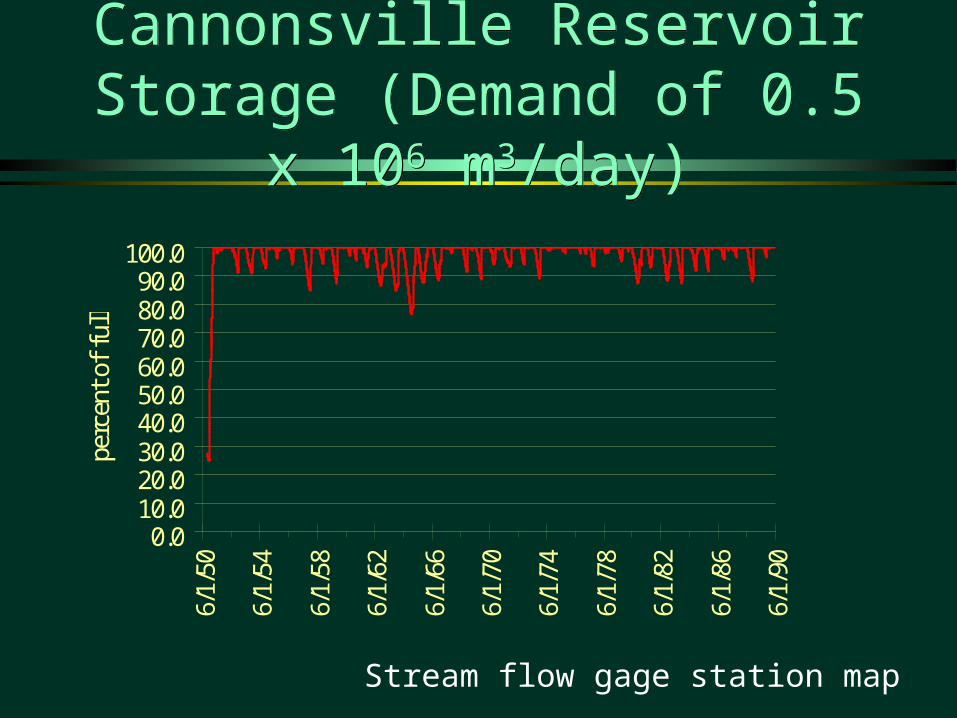
Cannonsville Reservoir Storage (Demand of 0.5 x 10⁶ m3/day)
Cannonsville Reservoir Storage (Demand of 0.5 x 10⁶ m3/day)
0.010.020.030.040.050.060.070.080.090.0
100.0
6/1/
50
6/1/
54
6/1/
58
6/1/
62
6/1/
66
6/1/
70
6/1/
74
6/1/
78
6/1/
82
6/1/
86
6/1/
90
perc
ent o
f fu
ll
Stream flow gage station map
0.010.020.030.040.050.060.070.080.090.0
100.0
6/1/
50
6/1/
54
6/1/
58
6/1/
62
6/1/
66
6/1/
70
6/1/
74
6/1/
78
6/1/
82
6/1/
86
6/1/
90
perc
ent o
f fu
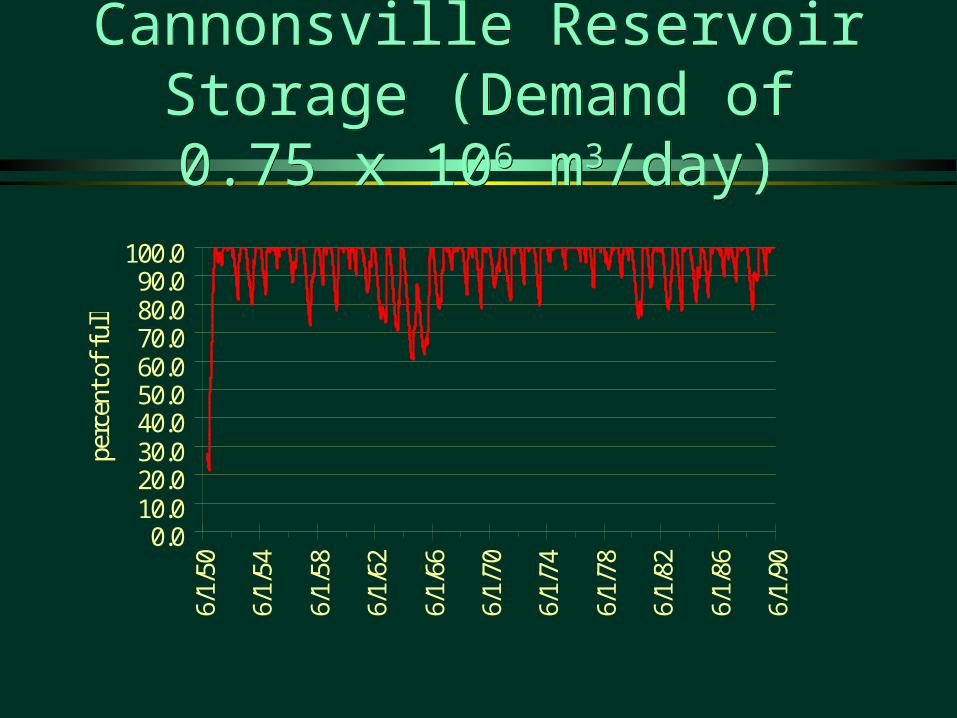
llCannonsville Reservoir Storage (Demand of 0.75 x 10⁶ m3/day)Cannonsville Reservoir Storage (Demand of 0.75 x 10⁶ m3/day)
0.010.020.030.040.050.060.070.080.090.0
100.06/
1/50
6/1/
54
6/1/
58
6/1/
62
6/1/
66
6/1/
70
6/1/
74
6/1/
78
6/1/
82
6/1/
86
6/1/
90
perc
ent o
f fu
ll
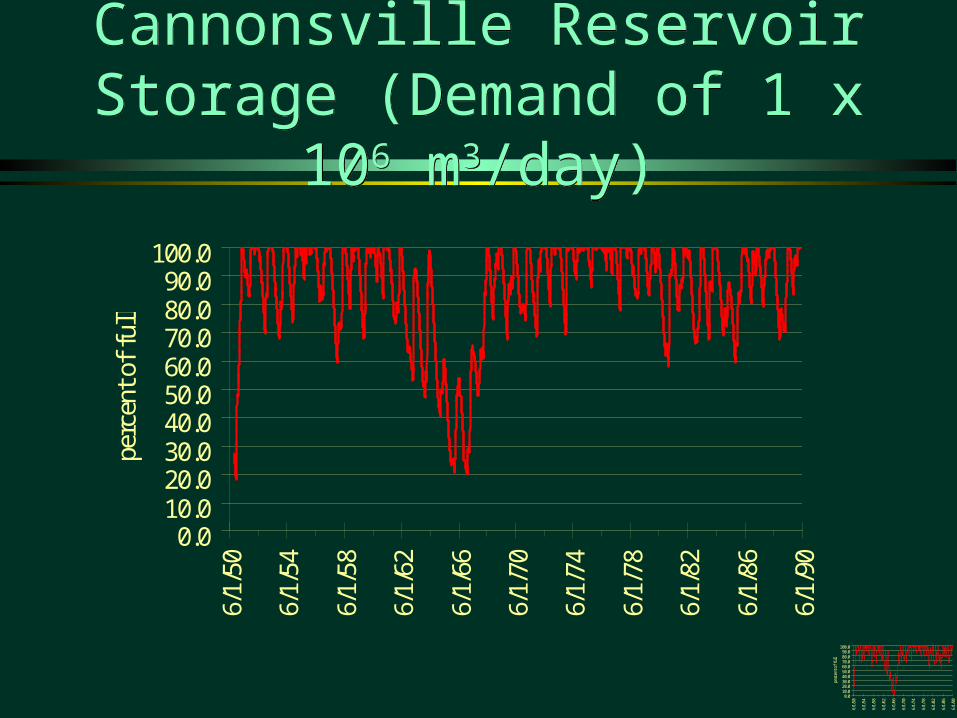
Cannonsville Reservoir Storage (Demand of 1 x 10⁶ m3/day)
Cannonsville Reservoir Storage (Demand of 1 x 10⁶ m3/day)
0.010.020.030.040.050.060.070.080.090.0
100.0
6/1/
50
6/1/
54
6/1/
58
6/1/
62
6/1/
66
6/1/
70
6/1/
74
6/1/
78
6/1/
82
6/1/
86
6/1/
90
perc
ent o
f fu
ll


