Development of Energy Performance Indicators of Residential Building Envelope Research Programme on Reducing Energy Consumption Cost and GHG Emission for Tropical Low-income Housing: Thailand Contribution Submitted to WARWICK UNIVERSITY By Joint Graduate School of Energy and Environment (JGSEE) King Mongkut’s University of Technology Thonburi (KMUTT) April-June 2015
Transcript
1
Development of Energy Performance Indicators of Residential Building Envelope
Research Programme on Reducing Energy Consumption Cost and GHG
Emission for Tropical Low-income Housing: Thailand Contribution
Submitted to
WARWICK UNIVERSITY
By
Joint Graduate School of Energy and Environment (JGSEE)
King Mongkut’s University of Technology Thonburi (KMUTT)
April-June 2015
1
CONTENTS Page CHAPTER 1 INTRODUCTION 2 1.1 Requirements on energy performance standard 2 1.2 Main attributes influencing energy consumption of air-conditioned space 5 1.3 Conceptual view on energy consumption in a building space 7 CHAPTER 2 DEVELOPMENT OF ENERGY PERFORMANCE INDICATOR FOR RESIDENTIAL BUILDING ENVELOPE 15 2.1 Thermal environment and residential building model for simulation 17 2.2. Proof of the hypothesis and elaboration of the terms of OTTVbr 18 2.3 Independence of the glazing terms from the opaque wall term 25 2.4 Validation of the developed OTTV formulation 27 Authors 32 References 33
2
CHAPTER 1 INTRODUCTION
This report is part of a quarter report for a period of April-June 2015 of ELITH-
Thailand. Objective of works during this period is identification of indicators for energy efficiency in design and end-uses of house and condominium. This report presents results of development of energy performance indicator of building envelope. Chapter 1 of this report first presents introduction of work in this period. Literature reviews and theories concerned with energy use in houses including a hypothesis on the OTTV formulation of residential buildings are presented in this section. Chapter 2 explains method use on development of energy performance indicator of residential building envelope for air-conditioned spaces. The results lead to obtain assessment criteria for proper house design and material selections under hot and humid climate. For natural ventilated spaces, the performance indicator is more complicated and will be reported in next progress report. Validation of the developed OTTV formulation are described in the final section of this Chapter.
1.1 Requirements on energy performance standard
This Section presents literature reviews of background and requirement of building energy performance standard as following.
Energy performance of wall
In a review of vernacular architecture, Zhai and Previtali [1], assert that for the tropical region, houses were constructed from materials that offer good insulation and of low thermal mass, as evidenced by those of vernacular houses in two locations in Indonesia. Lindberg, Binamu and Teikari [2], describes measured temperatures in walls of 6 test buildings in Tampere University of Technology. It was observed that for massive walls, heat could be transferred into the room during some periods when exterior temperature was falling. Thomsen, Schultz and Poel [3], refers to 12 houses in a project of the International Energy Agency (IEA) Task 13 that were designed to mainly demonstrate the effect of insulation and wall mass. The houses were considered low energy houses. Kalogirou, Florides and Tassou [4], used TRYSYS, a well-known simulation program, to simulate heating and cooling energy consumption for a room module that comprised a massive internal wall behind a glazed window with overhang. The results show that heating energy as well as cooling energy decrease with increasing wall thickness, although in the latter case less sharply. Zhu, Hurt, Correia and Boehm [5], report on the study of two identical houses in Las Vegas. The walls of the baseline house were insulated to give an R-value of 2.15 (m2.K.W-1) with standard wall composition, while those of the so-called Zero Energy House (ZEH) comprised thick reinforced concrete with insulation that rendered an R-value of 2.06 (m2.K.W-1). Measurements of wall surfaces temperatures during heating, cooling, and transitional (no heating nor cooling) seasons show that wall temperatures of the massive wall fluctuate much less when ambient air temperature fluctuates diurnally in all seasons. Furthermore, the massive wall was able to store heat sufficiently during winter daytime that no heat flux flowed into interior wall surfaces even during night time. Computer energy simulation using Energy 10 shows much lower heating energy but slightly higher cooling energy consumption from the ZEH. Chiraratananon and Hien [6], experimented with two rooms of 16 m2 each 80 km north of Bangkok and used a computer simulation program called BESim to simulate cooling load in the experimental room when the wall thickness varied. The authors conclude that thick walls may beneficially help delay heat gain for spaces that are used during daytime, the same effect increases cooling load for residential spaces that are used during night time. Bojić and Yik [7],
Chris
Highlight
3
note that cooling is a dominant energy end-use of buildings in Hong Kong. The authors observe that in Hong Kong, like the practice in several countries in hot climate region, insulation is not used on walls. The authors utilized a computer program for building energy simulation called HTB2 to simulate electrical energy and peak electrical demand of housing units in a new high-rise public housing block called ‘Harmony’. The authors used investigated 11 alternative constructions. The alternatives include combinations of the use of massive (base case) and light walls, and insulation placed on interior, exterior, and on both wall surfaces. The authors conclude that the simpler case of exterior insulation on massive exterior wall with massive interior wall without insulation offers significant reduction of both annual cooling energy and peak demand. Kossecka and Kosny [8], examined theoretical performance of six configurations of insulation placement in heavy walls. Program DOE 2.1E was used for simulating energy consumption of a ranch house in six climatic regions of USA, where heating or cooling was assumed employed for 24 hours of every day of a whole year They concluded that the wall with exterior insulation performs best, with lowest heating and lowest cooling energy, while the one with interior insulation performs worst. Even though Balocco, Grazzini and Cavalera [9], investigate transient performance of walls with different insulation placement, the authors conclude that the wall with exterior insulation performs best under both cooling and heating climates. Chirarattananon, Hien and Tummu [10], use BESim program to simulate use of insulation on exterior and interior surfaces of exposed walls of a generic building model and report that for spaces that are used during daytime, insulation reduces cooling load and is cost-effective when there is no window on the exposed wall. When there is window, solar radiation gain through window increases cooling load in the interior space predominantly that no conclusion can be drawn on the cost effectiveness of insulation. Tummu, Chirarattananon, Hien, Chaiwiwatworakul and Rakkwamsuk [11], conducted physical experiment on the use of insulation on exterior and interior wall surfaces on an experimental room in the Bangkhuntian campus of King Mongkut’s University of Technology and report that the results of heat fluxes and temperature agreed well with the results predicted by the BESim program. The authors then use BESim to investigate the use of insulation on exposed walls of residential spaces that are used during evening and night time. The authors conclude that insulation on interior surface improves thermal performance of exposed walls and enhances thermal comfort in the space, but insulation placed at the exterior surface causes the opposite effects.
Energy performance of window
A study of the effect of window area on energy saving was undertaken by Krarti, Erickson and Hillman [12], using climate conditions in the US. The simulation tool of this study was DOE-2.1E and 4 selected types of glazing were used. These were clear, blue, gray and reflective tint double glazing with different visible transmittances ranging from 0.073 (reflective tint) to 0.781 (clear). It was found that window visible transmittance and window area had significant impact on energy saving from daylighting as increasing glazing transmittance or window area contributed to greater daylight illuminance. Glazed Window and Thermal Comfort
For a period, attaching a layer of spectrally selective transparent film to glazing in the belief that the film would reduce transmission of heat from solar radiation into building interior was popularly practiced in Thailand. Chaiyapinunt, Phueakphongsuriya, Mongkornsaksit and Khomporn [13], reported that the film reduced transmission of solar radiation and improved thermal comfort for the occupants situated near a window. When the film increases reflection of infrared radiation from the glazing, the surface temperature of the glazing with attached film also reduces and helps increase thermal comfort for the nearby occupants.
Chris
Highlight
Chris
Highlight
Chris
Highlight
4
Window with Shading Devices Discomfort conditions, such as those caused by glare and excessive heat, generally
occur when direct sunlight is allowed to enter a space. It is necessary to limit the entry of direct sunlight. Therefore, shading devices are commonly used. Shading devices offer excellent opportunities for energy savings while allowing occupants a visual connection to the outdoor. Shading devices can be designed to blend into the architecture of a building and offer a more comfortable and pleasant visual environment. Also, well-designed shading devices can dramatically reduce building peak heat gain and cooling requirements. Reduction in annual cooling energy consumption of 5% to 15% associated with reduction of solar heat input by 80% to 90% have been reported depending on the area and location of fenestration, Wulfinghoff [14]. The design of a sun shading device may differ and each may evolve to suit local needs and local conditions. In Hong Kong, for instance, the frequently found external shading devices include overhangs and balconies, while side-fins are less common. Projecting windows or so called bay windows has become very popular as it is a way to increase usable space without affecting the land plot ratio, Li, Wong, Tsang and Cheung [15]. An external shading device may interfere with the view from a window, while some device helps reduce solar glare and heat. External shading is useful in almost all situations where direct sunlight through glazing increases cooling energy requirement substantially. However, an external shading device may have a major effect on the appearance of a building. In a tall building, it must be mounted securely to the building structure to counter wind loads. Heat Transfer through Roof
Since 1982, Fairey [16], reported that thermal radiation from roofs that absorbed solar radiation was the dominant mode of heat transfer in the attic and was responsible mainly for heat gain across ceiling to the space below. Experiments involving the use of radiant barrier (RB), a thin sheet of thermally reflective surface(s) (single or double sided) at Florida Solar Energy Center found that the temperatures on the surface and in the middle of fiberglass insulation mounted on the ceiling was higher than the temperature of air in the attic space, Levins and Herron [17], indicating that the insulation transferred heat to air and not vice versa. In USA, it was believed earlier that air under roof deck transferred heat to ceiling and that movement of air through the attic would help remove heat from it. Subsequent studies found that use of RB helps reduce cooling energy in summer and heating energy in winter, Levins and Hall [18]. It was also reported that accumulated dust on RB reduced its effectiveness, but it still performed its function. Moser, Frank, Schalin and Yuan [19], developed a model for calculation of heat transfer in the attic zone that included a computational fluid dynamic model, a thermal radiation exchange model, and conduction heat gain through wall model. The authors applied their model to an atrium model and obtained results for a particular time. Moujaes and Brickman [20], used backward difference for approximating the partial derivative of the heat conduction equation to find solution of energy balance equations they developed for the attic, the zone below the attic, and the whole house. Comparison of numerical results obtained from their model with experimental results show good correspondence. The authors then applied their model to show the results of application of radiant barrier under a number of situations. More recently, Soundhan, Feuillard and Bade [21], conducted experiments using four test cells to determine comparative effectiveness of radiant barrier against typical insulation materials used under roofs of different colors and for ventilated and unventilated attic space under roof deck. The authors also developed a model of the mechanisms of heat flow. The authors concluded that thermal radiation heat transfer was dominant during daytime, that the performance of the RB was comparable to that of fiber glass or polystyrene insulation when there was no ventilation and was comparatively superior when there was ventilation. Tang, Meir and Wu [22], found that vaulted or domed roofs that were traditionally used in the Middle
Chris
Highlight
Chris
Highlight
5
East where the climate was hot and dry were able to thermally radiate well in the night to help reduce temperature in the interior of buildings. Such roofs performed consistently better than flat roofs.
Requirements on energy performance
Implementing building energy efficiency standards and codes are effective means to foster energy efficient buildings that lower energy consumption in this sector, Iwaro and Mwasha [23], [24]. As further noted by Iwaro and Mwasha [23], in almost all countries in Asia and Africa, energy codes and standards for buildings, if exist, apply to non-residential buildings only as not all residential buildings use heating or cooling to control the interior environment.
For countries in hot climate, heat gain though exposed building walls is expected to contribute a significant share of the cooling load of an air-conditioned residential space. It is therefore expected that any energy conservation standards and programs for the residential sector must address energy performance of exposed walls. Chua and Chou [25], note that air-conditioning was increasingly used in residential buildings in Singapore. In order ‘to ensure that building envelope designs are suitable to be operated under air-conditioned environment, the ETTVres, and the code requirement on its value for residential buildings was introduced in 2008’. The authors also demonstrate through building energy simulations that cooling loads of two building models vary linearly with ETTVres. The Energy Technology policy Division of the International Energy Agency, IEA Secretariat [26], publishes a document called a ‘Technology Road Map for Energy Efficient Building Envelope’ to assist countries in planning, implementing, and monitoring building envelopes. The document explores existing and emerging technologies for energy efficient (EE) building envelopes and suggests policy directions to transform to EE buildings. Building energy performance rating
A more energy efficient building uses less energy resources input per productive output, minimizes detrimental environmental impacts and maximizes financial returns. Most countries in Europe and many states in USA require that buildings be assessed by qualified professionals regularly using standard methods and the results must be disclosed, Leipziger [27]. Assessment methods vary with locality and make it difficult to compare results. There is, however, consistency in how to define energy quantification methods and energy types, but little consensus on how to define floor area or what energy loads to be included. The first country in the world to implement mandatory energy rating and disclosure is Denmark in early 1990s, but now the system has spread to all of Europe, USA, China, Brazil, Australia, South Africa, and others. Studies have found that the higher rated houses command higher rental fee and higher valuation for sale, Hyland, Lyons and Lyons [28] 1.2 Main attributes influencing energy consumption of air-conditioned space
To design a potentially energy efficient building, the designer must be aware of the attributes of the building and the environment that influence eventual energy consumption of that building. There are many attributes of a building that influence its energy consumption that include the building itself, technology used with the building systems (envelope system, air-conditioning system, lighting system, and others) exterior environment of the building, and management of the building. This chapter will examine the phenomena in a broad perspective.
The purpose of air-conditioning in buildings in a tropical zone such as those in Thailand is to provide thermal comfort for the occupants that will allow occupants to concentrate and continually perform. However, the mechanism of air-conditioning includes cooling and dehumidifying air while air supplied into a zone receives heat and moisture from equipment,
Chris
Highlight
Chris
Highlight
6
human occupants, and other interior loads that lead to high level of energy consumption. To define appropriate thermal condition that lead to thermal comfort but that does not lead to excessive energy consumption is important and will be described later.
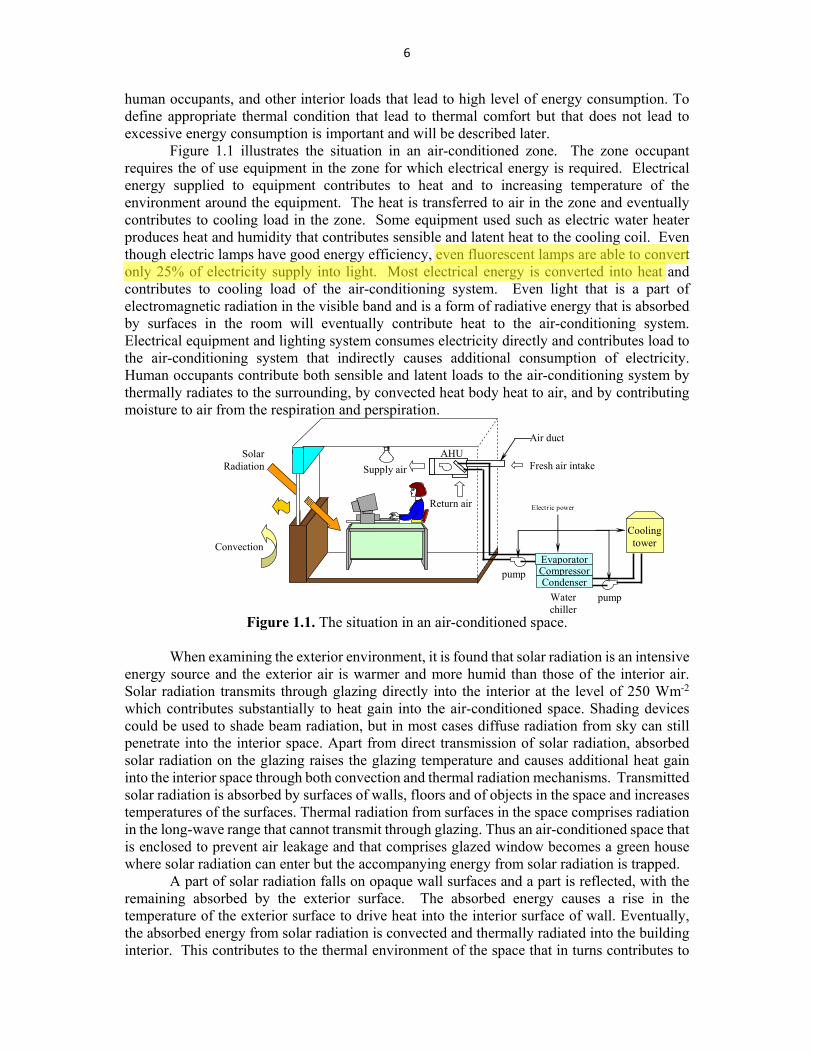
Figure 1.1 illustrates the situation in an air-conditioned zone. The zone occupant requires the of use equipment in the zone for which electrical energy is required. Electrical energy supplied to equipment contributes to heat and to increasing temperature of the environment around the equipment. The heat is transferred to air in the zone and eventually contributes to cooling load in the zone. Some equipment used such as electric water heater produces heat and humidity that contributes sensible and latent heat to the cooling coil. Even though electric lamps have good energy efficiency, even fluorescent lamps are able to convert only 25% of electricity supply into light. Most electrical energy is converted into heat and contributes to cooling load of the air-conditioning system. Even light that is a part of electromagnetic radiation in the visible band and is a form of radiative energy that is absorbed by surfaces in the room will eventually contribute heat to the air-conditioning system. Electrical equipment and lighting system consumes electricity directly and contributes load to the air-conditioning system that indirectly causes additional consumption of electricity. Human occupants contribute both sensible and latent loads to the air-conditioning system by thermally radiates to the surrounding, by convected heat body heat to air, and by contributing moisture to air from the respiration and perspiration.
Figure 1.1. The situation in an air-conditioned space.
When examining the exterior environment, it is found that solar radiation is an intensive
energy source and the exterior air is warmer and more humid than those of the interior air. Solar radiation transmits through glazing directly into the interior at the level of 250 Wm-2 which contributes substantially to heat gain into the air-conditioned space. Shading devices could be used to shade beam radiation, but in most cases diffuse radiation from sky can still penetrate into the interior space. Apart from direct transmission of solar radiation, absorbed solar radiation on the glazing raises the glazing temperature and causes additional heat gain into the interior space through both convection and thermal radiation mechanisms. Transmitted solar radiation is absorbed by surfaces of walls, floors and of objects in the space and increases temperatures of the surfaces. Thermal radiation from surfaces in the space comprises radiation in the long-wave range that cannot transmit through glazing. Thus an air-conditioned space that is enclosed to prevent air leakage and that comprises glazed window becomes a green house where solar radiation can enter but the accompanying energy from solar radiation is trapped.
A part of solar radiation falls on opaque wall surfaces and a part is reflected, with the remaining absorbed by the exterior surface. The absorbed energy causes a rise in the temperature of the exterior surface to drive heat into the interior surface of wall. Eventually, the absorbed energy from solar radiation is convected and thermally radiated into the building interior. This contributes to the thermal environment of the space that in turns contributes to
Solar Radiation
Electr ic power
Fresh air intake
Return air
Air duct
Convection
Supply air
Evaporator
Water chiller
Coolingtower
AHU
Compressor Condenser
pump
pump
Chris
Highlight
7
cooling load of the cooling coil of the air-conditioning system. The cumulative effect on the cooling coil over a period of time (such as a year) can be identified as follows
Cumulative load of cooling coil = cumulative load from external sources
+ cumulative load from internal sources On the other hand, the same relationships can be written for the average load as
Average load of cooling coil = average load from external sources + average load from internal sources.
The cooling coil load eventually reflects on electricity consumption by the air-conditioning system. Figure 1.2 illustrates the relationships that external environment drive energy and heat through opaque and transparent wall components that contributes load to the air-conditioning system. Human occupants and other internal sources contribute heat that contributes as internal load to the air-conditioning system.
Figure 1.2. Relationship between the driving forces and eventual electricity consumption.
1.3 Conceptual view on energy consumption in a building space
The starting point in the development of the energy performance standard for building envelope and the equation for computation of whole building energy consumption is the consideration of the dynamic relationships relating to cooling coil load and heat gain and energy storage components in a zone. The relationship leads to a consideration of linearity in the relationship and the use of effective performance coefficient of air-conditioning system in the calculation of energy consumption in the zone. 1.3.1 Dynamic Cooling Requirement and Energy Use in Building
The mechanisms of heat transfer into an air-conditioned zone, and the eventual transfer to the cooling coil could be illustrated by a consideration of the situation in Figure 1.1. The
8
load that the cooling coil receives from air comprises a sensible and a latent component. The air receives such load from heat convection from sources in the zone that include heat from equipment, lighting system, occupants, ventilation air and leakage air.
The air receives latent heat from occupants, ventilation air and leakage air, and other sources.
The mechanism of change of sensible heat of air can be represented by Equation (1.1)
1 1 1
( ) ( ) ( )c s zj n n n
ip sj j j j i j p zj i f p o i
j j j
exs
dTMc Q A h T T m c T T m c T T
dt
Q
(1.1)
where M =V is the mass of air in the zone,
is the density of air,
V is the volume of air,
cp is the specific heat of dry air, 1.006 kJkg-1,
ip
dTMc
dt is the rate of increase of sensible heat of air in the zone,
1
cj n
sjj
Q
is the total sensible heat loads in the zone,
1
( )sn
j j j ij
A h T T
is the sum of heat convected from surfaces in the zone to air,
1
( )zn
j p zj ij
m c T T
is the sensible heat of air that leaks into the room from other zones,
( )f p o im c T T is the sensible heat of exterior air that leaks into the room and
exsQ is the rate of removal of sensible heat of the air-conditioning
system.
For the latent heat, a similar equation can be written, as in Equation (1.2)
1 1 1
( ) ( ) ( )
( )
sL znn nLji
j Lj i sj i j zj i f o ij j jw
s s i
QdWM A h W W m W W m W W
dt h
m W W
(1.2)
where Wi is the humidity ratio of air in the room,
9
1
LnLj
j w
Q
h
is the rate of addition of water vapor due to latent loads in the space,
LjQ is the latent load i in the space,
hw is the heat content of water vapor at 25oC, approximated at 2500 kJkg-1,
1
( )sn
j Lj i sj ij
A h W W
is the term related to rate of vapor transmission through walls,
1
( )zn
j zj ij
m W W
is the rate of vapor addition due to air exchanges between zones
( )f o im W W is the rate of vapor addition due to air leakage, and
( )s s im W W is the rate of vapor contribution from the cooling coil.
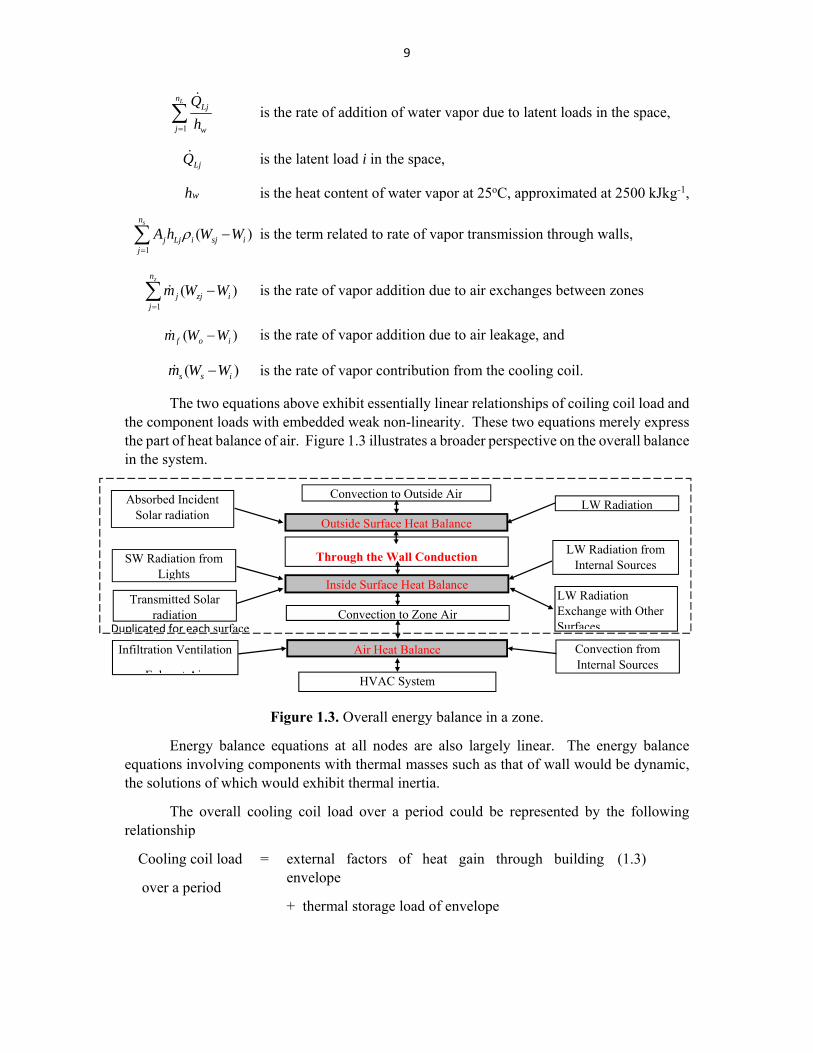
The two equations above exhibit essentially linear relationships of coiling coil load and the component loads with embedded weak non-linearity. These two equations merely express the part of heat balance of air. Figure 1.3 illustrates a broader perspective on the overall balance in the system.
Figure 1.3. Overall energy balance in a zone.
Energy balance equations at all nodes are also largely linear. The energy balance equations involving components with thermal masses such as that of wall would be dynamic, the solutions of which would exhibit thermal inertia.
The overall cooling coil load over a period could be represented by the following relationship
Cooling coil load
over a period
= external factors of heat gain through building envelope
+ thermal storage load of envelope
(1.3)
Outside Surface Heat Balance
Convection to Outside AirAbsorbed Incident Solar radiation
LW Radiation
Through the Wall Conduction
Inside Surface Heat Balance
Convection to Zone Air
SW Radiation from Lights
Transmitted Solar radiation
LW Radiation from Internal Sources
LW Radiation Exchange with Other SurfacesDuplicated for each surface
Air Heat BalanceInfiltration Ventilation
E h t Ai
Convection from Internal Sources
HVAC System
10
+ internal factors (lighting, equipment, occupants, ventilation and air leakage)
+ thermal storage load of interior walls, floors and furniture
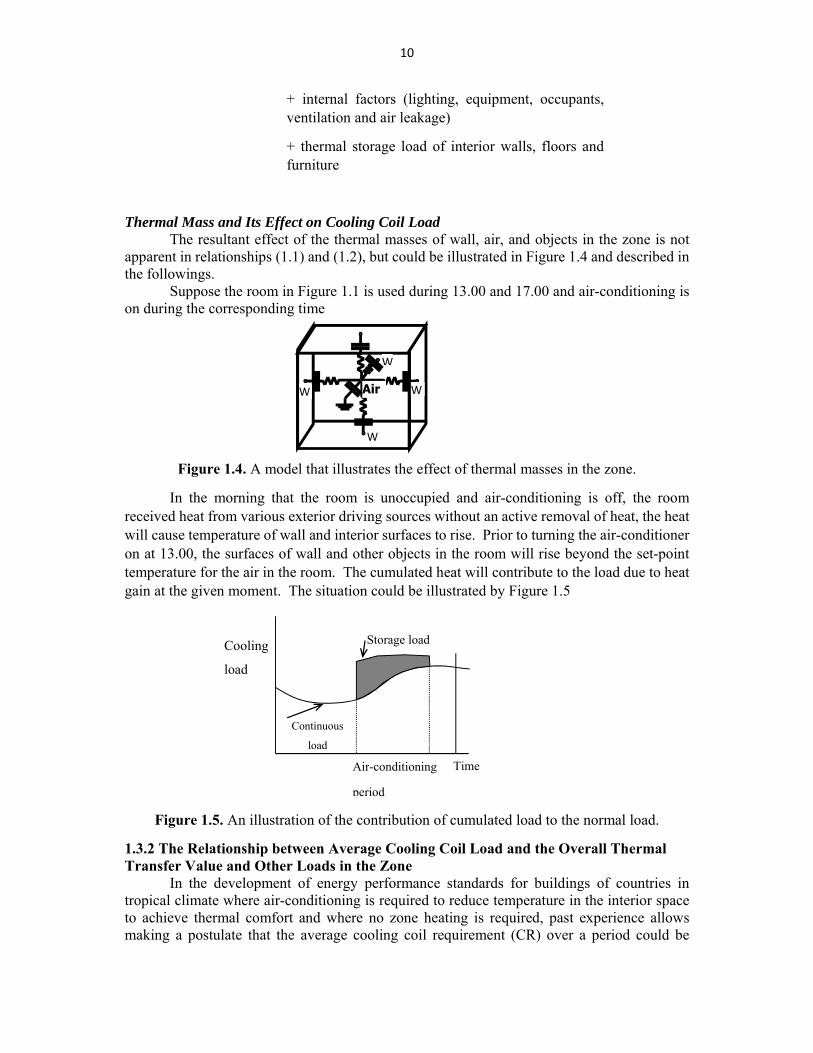
Thermal Mass and Its Effect on Cooling Coil Load The resultant effect of the thermal masses of wall, air, and objects in the zone is not
apparent in relationships (1.1) and (1.2), but could be illustrated in Figure 1.4 and described in the followings.
Suppose the room in Figure 1.1 is used during 13.00 and 17.00 and air-conditioning is on during the corresponding time
Figure 1.4. A model that illustrates the effect of thermal masses in the zone.
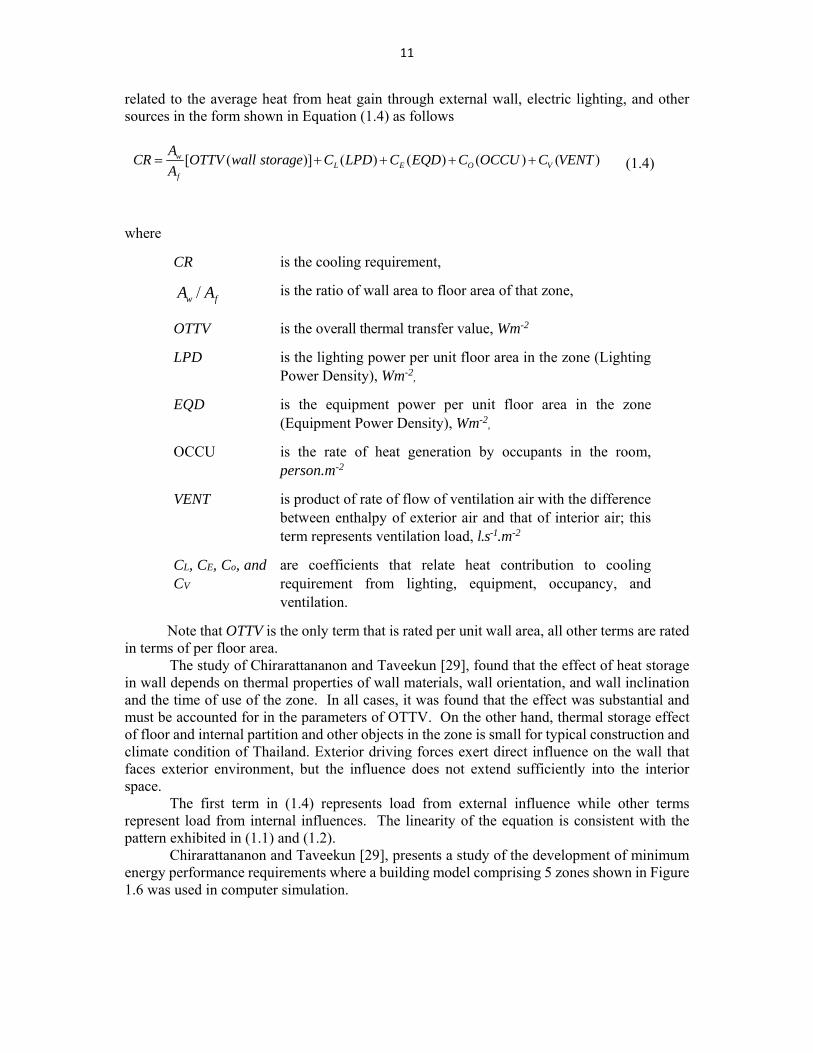
In the morning that the room is unoccupied and air-conditioning is off, the room received heat from various exterior driving sources without an active removal of heat, the heat will cause temperature of wall and interior surfaces to rise. Prior to turning the air-conditioner on at 13.00, the surfaces of wall and other objects in the room will rise beyond the set-point temperature for the air in the room. The cumulated heat will contribute to the load due to heat gain at the given moment. The situation could be illustrated by Figure 1.5
Figure 1.5. An illustration of the contribution of cumulated load to the normal load.
1.3.2 The Relationship between Average Cooling Coil Load and the Overall Thermal Transfer Value and Other Loads in the Zone
In the development of energy performance standards for buildings of countries in tropical climate where air-conditioning is required to reduce temperature in the interior space to achieve thermal comfort and where no zone heating is required, past experience allows making a postulate that the average cooling coil requirement (CR) over a period could be
W
W
W
W
Air
Time
Cooling
load
Continuous
load
Storage load
Air-conditioning
period
11
related to the average heat from heat gain through external wall, electric lighting, and other sources in the form shown in Equation (1.4) as follows
[ ( )] ( ) ( ) ( ) ( )wL E O V
f
ACR OTTV wall storage C LPD C EQD C OCCU C VENT
A (1.4)
where
CR is the cooling requirement,
/w fA A is the ratio of wall area to floor area of that zone,
OTTV is the overall thermal transfer value, Wm-2
LPD is the lighting power per unit floor area in the zone (Lighting Power Density), Wm-2
,
EQD is the equipment power per unit floor area in the zone (Equipment Power Density), Wm-2
,
OCCU is the rate of heat generation by occupants in the room, person.m-2
VENT is product of rate of flow of ventilation air with the difference between enthalpy of exterior air and that of interior air; this term represents ventilation load, l.s-1.m-2
CL, CE, Co, and CV
are coefficients that relate heat contribution to cooling requirement from lighting, equipment, occupancy, and ventilation.
Note that OTTV is the only term that is rated per unit wall area, all other terms are rated in terms of per floor area.
The study of Chirarattananon and Taveekun [29], found that the effect of heat storage in wall depends on thermal properties of wall materials, wall orientation, and wall inclination and the time of use of the zone. In all cases, it was found that the effect was substantial and must be accounted for in the parameters of OTTV. On the other hand, thermal storage effect of floor and internal partition and other objects in the zone is small for typical construction and climate condition of Thailand. Exterior driving forces exert direct influence on the wall that faces exterior environment, but the influence does not extend sufficiently into the interior space.
The first term in (1.4) represents load from external influence while other terms represent load from internal influences. The linearity of the equation is consistent with the pattern exhibited in (1.1) and (1.2).
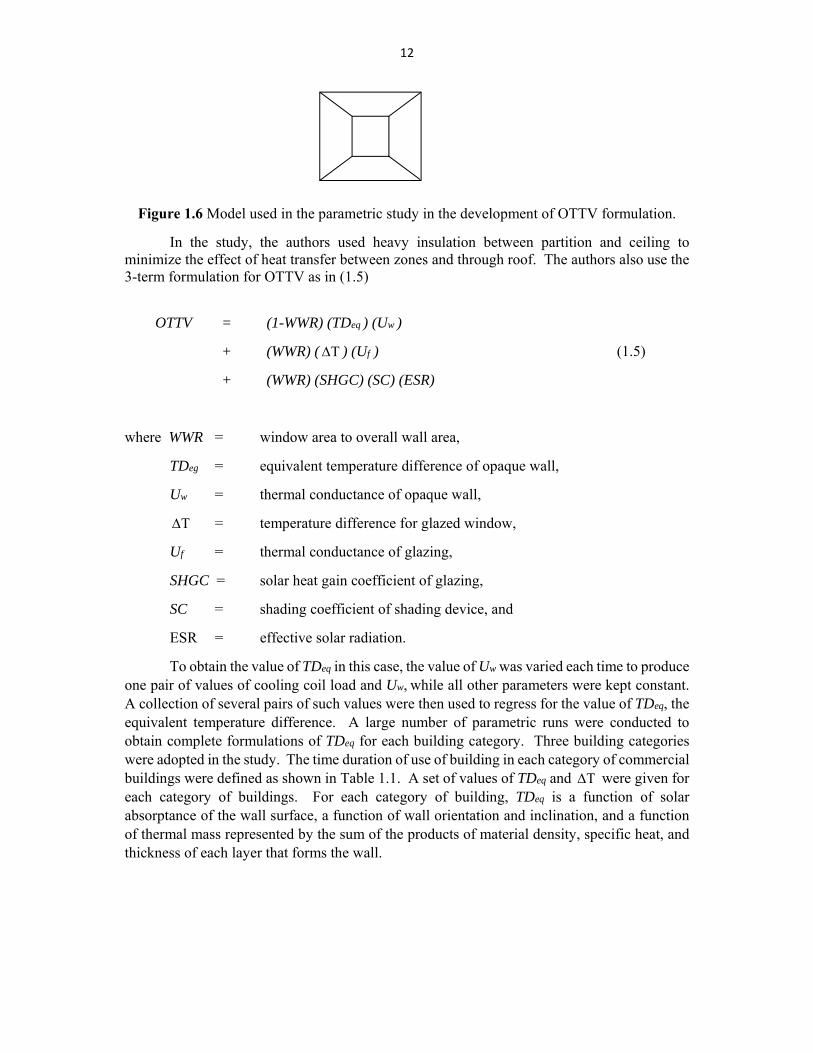
Chirarattananon and Taveekun [29], presents a study of the development of minimum energy performance requirements where a building model comprising 5 zones shown in Figure 1.6 was used in computer simulation.
12
Figure 1.6 Model used in the parametric study in the development of OTTV formulation.
In the study, the authors used heavy insulation between partition and ceiling to minimize the effect of heat transfer between zones and through roof. The authors also use the 3-term formulation for OTTV as in (1.5)
OTTV = (1-WWR) (TDeq ) (Uw )
+ (WWR) ( ) (Uf )
+ (WWR) (SHGC) (SC) (ESR)
(1.5)
where WWR = window area to overall wall area,
TDeg = equivalent temperature difference of opaque wall,
Uw = thermal conductance of opaque wall,
= temperature difference for glazed window,
Uf = thermal conductance of glazing,
SHGC = solar heat gain coefficient of glazing,
SC = shading coefficient of shading device, and
ESR = effective solar radiation.
To obtain the value of TDeq in this case, the value of Uw was varied each time to produce one pair of values of cooling coil load and Uw, while all other parameters were kept constant. A collection of several pairs of such values were then used to regress for the value of TDeq, the equivalent temperature difference. A large number of parametric runs were conducted to obtain complete formulations of TDeq for each building category. Three building categories were adopted in the study. The time duration of use of building in each category of commercial buildings were defined as shown in Table 1.1. A set of values of TDeq and were given for each category of buildings. For each category of building, TDeq is a function of solar absorptance of the wall surface, a function of wall orientation and inclination, and a function of thermal mass represented by the sum of the products of material density, specific heat, and thickness of each layer that forms the wall.
13
Table 1.1 Time duration of use of each of the three building categories.
Building Category
Time Duration of Building Use
Buildings in This Category
Office 08.00 – 17.00 Office and school
Department store
10.00 – 22.00 Department store, hypermarket, restaurant, club house
Hotel 24 - hour Hotel, hospital, convalescence home, condominium
1.3.3 Equation for Whole Building Energy Calculation The authors in Chirarattananon and Taveekun [29], derive a relationship between
average energy use in a zone and the lighting and other energy uses in the form shown in (1.6)
( )CR
Energy use in a zone LPD EQD zone floor area duration hoursCOP
(1.6)
where the coefficient of performance (COP) is the measure of the performance of the whole air-conditioning system that serves the zone. A similar equation scheduled to be used as a part of energy labeling scheme of Hong Kong called HK-Beam for calculation of reference energy consumption of office buildings appears in the HK-Beam document, HK-BEAM Society [30].
The above result, and the results of the study in the development of building energy code commissioned by the Department for Alternative Energy Development (DEDE) has been used in the whole building energy compliance procedure. The procedure specified that Equation (1.7) be used as a part of calculation of the whole building energy requirement for new building not yet constructed. From (1.7), the equation of whole building energy requirement is then obtained in the form
1
1
( ) ( )
( ) ( ) 130 ( ) 24 ( )
( )
nwi i ri i
pai i ii j
l i e i o i v ii h
i
n
i i i hi
A OTTV A RTTVE
COP COP
C LPD C EQD C OCCU C VENTA n
COP
A LPD EQD n
(1.7)
This equation assumes that the occupants fully occupy the zone during the whole duration, and lighting, air-conditioning, and other equipment in are fully utilized during the specified duration of each zone.
The requirements of the Building Energy Code has been embodied in the Ministerial Regulation for Design of New Large Buildings announced in the Royal Gazette on 20 February 2009 and has come into force on 20 June 2009. Even though minimum energy performance requirement for hot water production is also included in the Ministerial Regulation, only calculated energy consumption of the three principal systems are allowed to be exchanged.
Chris
Highlight
14
1.3.4 A Hypothesis on the OTTV formulation of residential buildings
For Singapore, OTTV represents overall heat gain across a given building envelope, Chua and Chou [25]. For Thailand, OTTV for commercial buildings in Thai BEC represents cooling coil load (CCL) of the air-conditioning system due to heat gain across the envelope per unit area of the envelope, Chirarattananon and Taveekun [29]. Such CCL is obtained from computer simulation using a generic building model. The values for TDeq, and ESR are obtained from regression procedure using (1.5) when WWR, Uw, Uf, and SHGC on the RHS of (1.5) are varied and the resultant values of CCL per unit envelope area is used on the LHS of (1.5). In applying such procedure, it is assumed that TDeq is independent of Uw, and ESR is independent of SHGC, etc.
For the present case of residential space used under the bedroom function, there is no solar radiation present on the building envelope throughout the duration of the bedroom function. However, studies in Chirarattananon, Hien and Tummu [10] and Tummu, Chirarattananon, Hien, Chaiwiwatworakul and Rakkwamsuk [11] illustrate that solar radiation on the exposed wall and its transmission into the interior space during daytime is stored as heat in the exposed wall and in the interior walls. This stored heat will be transferred to air and contributes to CCL during the bedroom period. The OTTV formulation for the bedroom function should reflect this storage effects.
The hypothesis on the formulation of a thermal performance measure for a wall enclosing a space serving the bedroom function is that it takes the form
OTTVbr = (1-WWR)(CCL due to conduction heat gain and stored heat in
opaque wall)
+ (WWR)(CCL due to conduction heat gain through glazing and stored heat in the interior room mass)
(1.8)
+ (WWR)(CCL due to heat stored in the interior room mass due to absorbed transmitted solar radiation).
The thermal performance measure for the bedroom function, OTTVbr, comprises three
terms where each term is considered independent of the other. The first term represents the CCL due to conduction heat gain through the opaque section during the bedroom period and that due to stored heat from absorption of solar radiation on the section during daytime. The second term represents CCL due to conduction heat gain through the transparent or glazed section during the bedroom period and that due to heat transferred and stored in the interior walls during daytime. The third term represents CCL due to heat stored in the interior walls from absorption of transmitted solar radiation during daytime.
15
CHAPTER 2 DEVELOPMENT OF ENERGY PERFORMANCE INDICATOR FOR
RESIDENTIAL BUILDING ENVELOPE
This Chapter presents the development of an OTTV, or the measure of thermal performance, of building walls enclosing spaces used under bedroom function. This development represents a part of an attempt to develop a building energy performance standard for residential buildings in Thailand. Bedroom function is the major residential function in the use of a residential household. Presently there is a statutory building energy code (BEC) for commercial buildings in which there is a separate OTTV formulation each for walls of office, department store, and hotel. Such OTTV formulations for commercial buildings have been used and found to be suitable in some ASEAN countries.
In Thailand, air-conditioning penetrates up to 15.6% in households country-wide and 37.4% in Bangkok and is steadily increasing (statistical office) in all areas at a rate close to10% per year. Air-conditioning contributes to electricity consumption substantially in households that possess air-conditioners. Residential sector consumes electricity at 22.3% and together with commercial sector consume 57% of total in Thailand, (electricity report, DEDE 2011) where this extent is similar to that observed globally, Lombard (2008). Chan et al. (2009) assert that buildings consume 89% of electricity in Hong Kong and air-conditioning contributes a substantial proportion. These figures underscore the importance of energy efficiency in residential buildings.
Implementing building energy efficiency standards and codes are effective means to foster energy efficient buildings that lower energy consumption in this sector, Lausten (2008), Iwaro and Mwasha (2010), UNEP (2009). As further noted by Iwaro and Mwasha (2010), in almost all countries in Asia and Africa, energy codes and standards for buildings, if exist, apply to non-residential buildings only. At present, all large commercial buildings in Thailand and other ASEAN countries are air-conditioned, while a certain percentage of residential buildings are air-conditioned. The authors are convinced that voluntary standards on energy performance for residential buildings should be introduced to Thailand and other countries in similar situation.
For countries in hot climate, heat gain though exposed building walls is expected to contribute a significant share of the cooling load of an air-conditioned residential space. It is therefore expected that any energy conservation standards and programs for the residential sector must address energy performance of exposed walls. Chua and Chou (2010) note that air-conditioning was increasingly used in residential buildings in Singapore. In order ‘to ensure that building envelope designs are suitable to be operated under air-conditioned environment, the ETTVres, and the code requirement on its value for residential buildings was introduced in 2008’. The authors also demonstrate through building energy simulations that cooling loads of two building models vary linearly with ETTVres . The Energy Technology policy Division of the International Energy Agency (IEA, 2013) publishes a document called a ‘Technology Road Map for Energy Efficient Building Envelope’ to assist countries in planning, implementing, and monitoring building envelopes. The document explores existing and emerging technologies for energy efficient (EE) building envelopes and suggests policy directions to transform to EE buildings. Sadimeni et al. (2011) examine passive means for building energy savings and review the effectiveness of past and existing means to improve components of building envelopes. Chirarattananon (2011) investigates thermal performance of massive walls enclosing commercial and residential spaces in Thailand and reports that thicker walls retain more heat during daytime and release it into the enclosed space during the night. Tummu et al., [*1 ], investigates experimentally and analytically the use of insulation on exposed walls of residential buildings under Thai climate and conclude that insulation on the interior surface
Chris
Highlight
Chris
Highlight
Chris
Highlight
Chris
Highlight
16
of a wall improves its thermal performance, but adverse results occur for a wall with insulation on the exterior surface. Granadeiro et al. (2013) consider that the most significant component that affects energy performance of a building is the building envelope, the authors then proceed to formulate an indicator for design of building envelope based on the use of heating and cooling degree days, total solar radiation in the heating and cooling seasons, envelope parameters such as U-value, solar heat gain coefficient, shading coefficient, and window area, and set-point temperature for the interior.. This paper presents the development of an OTTV, or the measure of thermal performance, of building walls enclosing spaces used under bedroom function. This development represents a part of an attempt to develop a building energy performance standard for residential buildings in Thailand. Bedroom function is the major residential function in the use of a residential household. Presently there is a statutory building energy code (BEC) for commercial buildings in which there is a separate OTTV formulation each for walls of office, department store, and hotel. Such OTTV formulations for commercial buildings have been used and found to be suitable in some ASEAN countries. Acronym and Nomenclature (Arranged in accordance with the order of appearance) Temp RH Temp-Ave Temp-Min Temp-Max RH-Ave RH-Min RH-Max IgloH IskyH IsunN WWR SHGC U-value α ρ τ OTTV Uw TDeq Uf ∆T ESR CCL
temperature, ˚Crelative humidity, % average temperature, ˚C minimum temperature, ˚C maximum temperature, ˚C average relative humidity, % minimum relative humidity, % maximum relative humidity, % horizontal global solar radiation, W/m2
horizontal diffuse solar radiation, W/m2
beam normal solar radiation, W/m2
window to wall ratio solar heat gain coefficient overall heat transfer coefficient, W/(m2∙K) solar absorptance solar reflectance solar transmittance overall thermal transfer value, W/m2 overall heat transfer coefficient of wall, W/(m2∙K) equivalent temperature different, ˚C value of overall heat transfer coefficient of glazing, W/(m2∙K) temperature different of outdoor and indoor, ˚C effective solar radiation, W/m2
density-specific heat product, kJ/(m2·K) wall with no insulation massive interior wall wall with interior insulation light interior wall
Chris
Highlight
Chris
Highlight
17
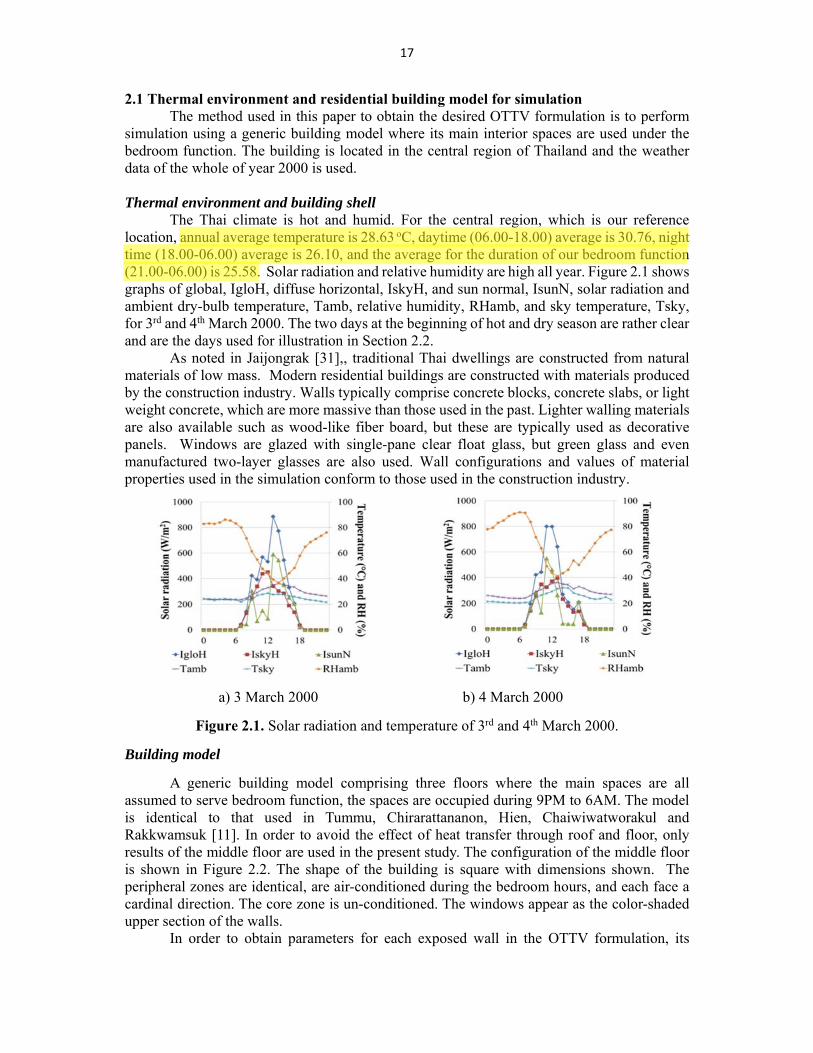
2.1 Thermal environment and residential building model for simulation The method used in this paper to obtain the desired OTTV formulation is to perform simulation using a generic building model where its main interior spaces are used under the bedroom function. The building is located in the central region of Thailand and the weather data of the whole of year 2000 is used. Thermal environment and building shell The Thai climate is hot and humid. For the central region, which is our reference location, annual average temperature is 28.63 oC, daytime (06.00-18.00) average is 30.76, night time (18.00-06.00) average is 26.10, and the average for the duration of our bedroom function (21.00-06.00) is 25.58. Solar radiation and relative humidity are high all year. Figure 2.1 shows graphs of global, IgloH, diffuse horizontal, IskyH, and sun normal, IsunN, solar radiation and ambient dry-bulb temperature, Tamb, relative humidity, RHamb, and sky temperature, Tsky, for 3rd and 4th March 2000. The two days at the beginning of hot and dry season are rather clear and are the days used for illustration in Section 2.2.
As noted in Jaijongrak [31],, traditional Thai dwellings are constructed from natural materials of low mass. Modern residential buildings are constructed with materials produced by the construction industry. Walls typically comprise concrete blocks, concrete slabs, or light weight concrete, which are more massive than those used in the past. Lighter walling materials are also available such as wood-like fiber board, but these are typically used as decorative panels. Windows are glazed with single-pane clear float glass, but green glass and even manufactured two-layer glasses are also used. Wall configurations and values of material properties used in the simulation conform to those used in the construction industry.
a) 3 March 2000 b) 4 March 2000
Figure 2.1. Solar radiation and temperature of 3rd and 4th March 2000.
Building model
A generic building model comprising three floors where the main spaces are all assumed to serve bedroom function, the spaces are occupied during 9PM to 6AM. The model is identical to that used in Tummu, Chirarattananon, Hien, Chaiwiwatworakul and Rakkwamsuk [11]. In order to avoid the effect of heat transfer through roof and floor, only results of the middle floor are used in the present study. The configuration of the middle floor is shown in Figure 2.2. The shape of the building is square with dimensions shown. The peripheral zones are identical, are air-conditioned during the bedroom hours, and each face a cardinal direction. The core zone is un-conditioned. The windows appear as the color-shaded upper section of the walls. In order to obtain parameters for each exposed wall in the OTTV formulation, its
Chris
Highlight
18
thermal properties will be varied. In addition to changing optical and thermal properties, placement of insulation will be considered for each wall surface. Optical and thermal properties of windows will be varied as well. As will be seen later, thermal properties of interior wall surfaces will also be varied.
Figure 2.2 The configuration of the middle floor of the building model.
The BESim program
This computer program is used in the simulation runs. It was developed earlier and was described in a number of researches reported in Chiraratananon and Hien [6], [10, 11, 32, 33]. The program uses local meteorological data to calculate dynamic heat transfers under the principle of energy balance. It accounts for solar, short wave, and long wave radiation heat transfers using numerically calculated view factors. Raytracing is also used with beam radiation when a surface has a specular reflectance component. A zone can be air-conditioned or naturally ventilated. Outputs of the program include: i) temperatures on and components of heat fluxes from zone surfaces and temperatures of air in each zones on user-specified time and dates, and ii) cooling coil load of air-conditioning system and electricity cost.
2.2. Proof of the hypothesis and elaboration of the terms of OTTVbr Objective of this section is to proof the hypothesis of OTTVbr stated in Section 1.3.4. Each term in (1.8) is considered consequentially as follows. Opaque wall term
Consider Equation (2), let WWR = 0 and let the product (Uw) (TDshw) represents CCL during the bedroom period of the building model in Figure 2, i.e.
CCL = (Uw) (TDshw). (2.1) Here, TDshw is the equivalent temperature difference due to conduction heat transfer through wall and that due to heat stored in the wall from solar radiation absorbed during daytime period. In order to obtain its values for different wall conditions, properties of the opaque wall material and of its surface are varied to obtain different values of CCL during the bedroom period. A layer of 50-mm polystyrene foam insulation is added at the interior wall surface as an option on wall compositions. Table 2.1 lists the ranges of variation of relevant properties and values of Uw. The thickness of the wall is 0.1m.
Chris
Highlight
19
Table 2.1 Variation of wall properties and values of Uw.
Wall orientation Density, kg/m2 Solar absorptance
Thermal conductivity,
W/(m·K)
Values of Uw, W/(m2·K)
North, south, east, west
300 – 3,000 0.1 – 0.9 0.3 – 2.0 0.34- 3.63
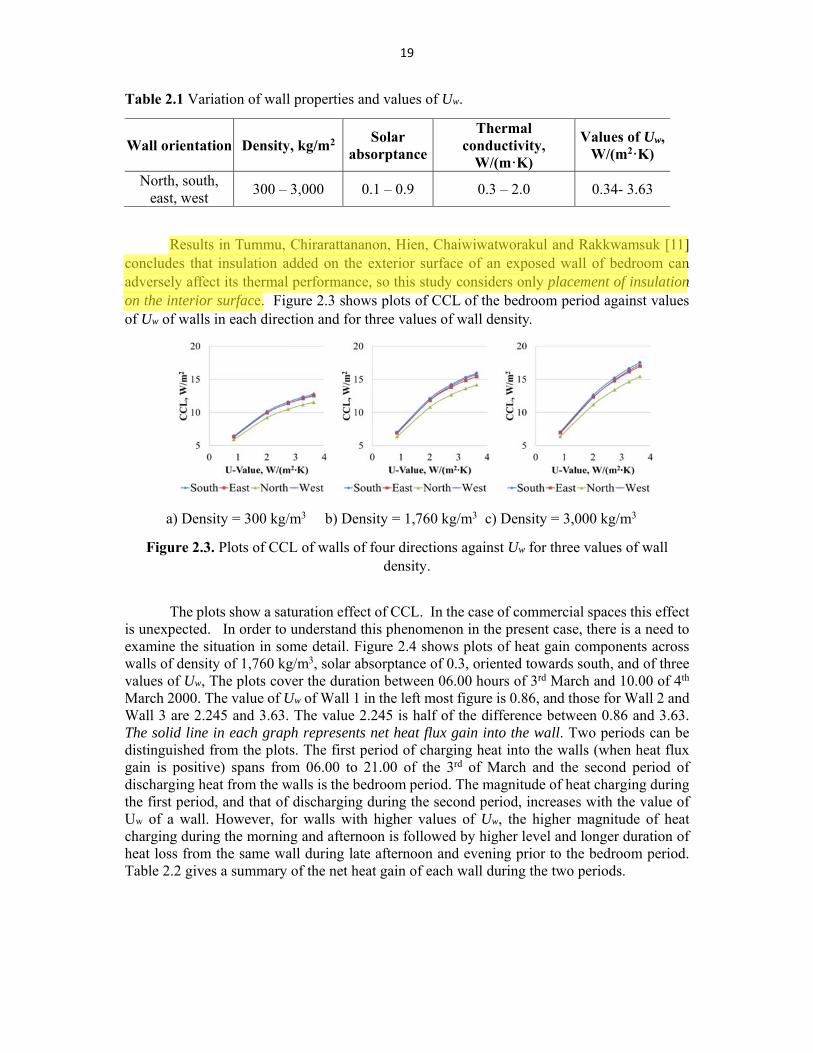
Results in Tummu, Chirarattananon, Hien, Chaiwiwatworakul and Rakkwamsuk [11] concludes that insulation added on the exterior surface of an exposed wall of bedroom can adversely affect its thermal performance, so this study considers only placement of insulation on the interior surface. Figure 2.3 shows plots of CCL of the bedroom period against values of Uw of walls in each direction and for three values of wall density.
a) Density = 300 kg/m3 b) Density = 1,760 kg/m3 c) Density = 3,000 kg/m3
Figure 2.3. Plots of CCL of walls of four directions against Uw for three values of wall density.
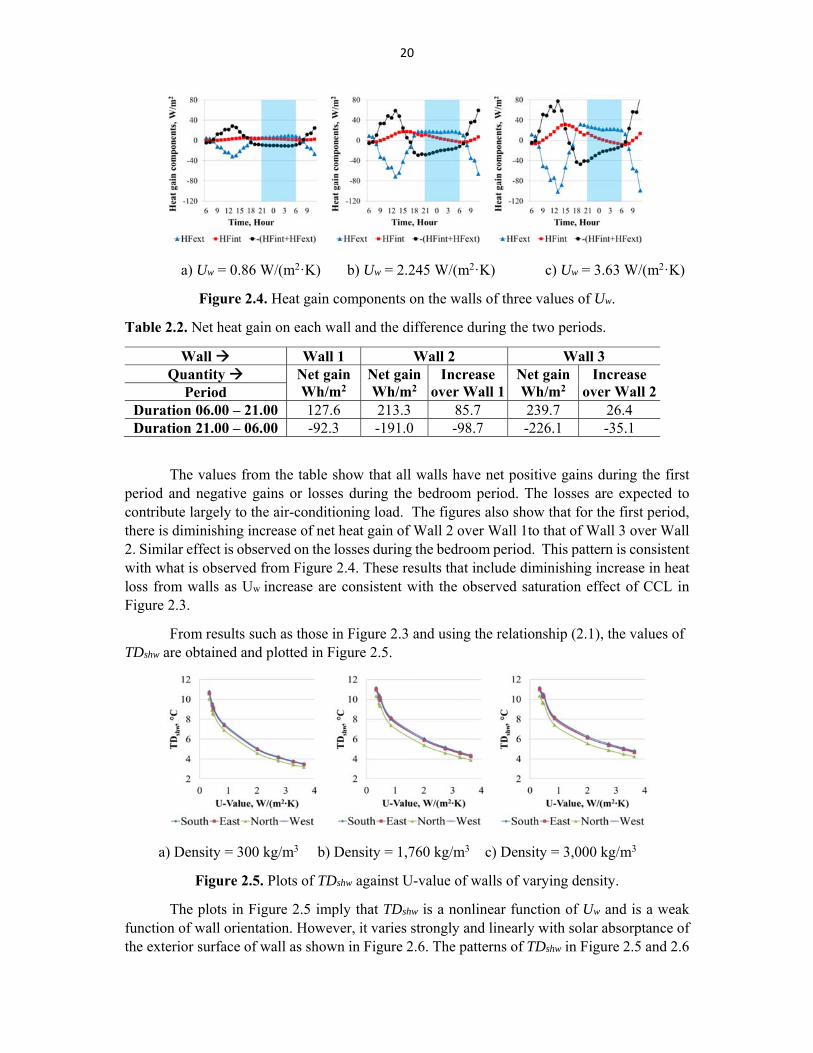
The plots show a saturation effect of CCL. In the case of commercial spaces this effect
is unexpected. In order to understand this phenomenon in the present case, there is a need to examine the situation in some detail. Figure 2.4 shows plots of heat gain components across walls of density of 1,760 kg/m3, solar absorptance of 0.3, oriented towards south, and of three values of Uw, The plots cover the duration between 06.00 hours of 3rd March and 10.00 of 4th March 2000. The value of Uw of Wall 1 in the left most figure is 0.86, and those for Wall 2 and Wall 3 are 2.245 and 3.63. The value 2.245 is half of the difference between 0.86 and 3.63. The solid line in each graph represents net heat flux gain into the wall. Two periods can be distinguished from the plots. The first period of charging heat into the walls (when heat flux gain is positive) spans from 06.00 to 21.00 of the 3rd of March and the second period of discharging heat from the walls is the bedroom period. The magnitude of heat charging during the first period, and that of discharging during the second period, increases with the value of Uw of a wall. However, for walls with higher values of Uw, the higher magnitude of heat charging during the morning and afternoon is followed by higher level and longer duration of heat loss from the same wall during late afternoon and evening prior to the bedroom period. Table 2.2 gives a summary of the net heat gain of each wall during the two periods.
Chris
Highlight
20
a) Uw = 0.86 W/(m2·K) b) Uw = 2.245 W/(m2·K) c) Uw = 3.63 W/(m2·K)
Figure 2.4. Heat gain components on the walls of three values of Uw.
Table 2.2. Net heat gain on each wall and the difference during the two periods.
The values from the table show that all walls have net positive gains during the first period and negative gains or losses during the bedroom period. The losses are expected to contribute largely to the air-conditioning load. The figures also show that for the first period, there is diminishing increase of net heat gain of Wall 2 over Wall 1to that of Wall 3 over Wall 2. Similar effect is observed on the losses during the bedroom period. This pattern is consistent with what is observed from Figure 2.4. These results that include diminishing increase in heat loss from walls as Uw increase are consistent with the observed saturation effect of CCL in Figure 2.3.
From results such as those in Figure 2.3 and using the relationship (2.1), the values of TDshw are obtained and plotted in Figure 2.5.
a) Density = 300 kg/m3 b) Density = 1,760 kg/m3 c) Density = 3,000 kg/m3
Figure 2.5. Plots of TDshw against U-value of walls of varying density.
The plots in Figure 2.5 imply that TDshw is a nonlinear function of Uw and is a weak function of wall orientation. However, it varies strongly and linearly with solar absorptance of the exterior surface of wall as shown in Figure 2.6. The patterns of TDshw in Figure 2.5 and 2.6
21
imply that it should vary weakly with wall density. The pattern in Figure 2.7 confirms this observation. The effect of density is more pronounced for walls of higher Uw and higher solar absorptance.
a) Uw = 0.34 W/(m2·K) b) Uw = 3.63 W/(m2·K)
Figure 2.6. Plots of TDshw against solar absorptance of wall surface.
a) Uw = 0.34 W/(m2·K) b) Uw = 3.63 W/(m2·K)
Figure 2.7. Plots of TDshw against wall density.
The window and glazing terms Consider the case where there is a window on each exposed wall in Figure 1.2. Now CCL that occurs during the period of bedroom function is postulated to comprise two independent sources. The first source is the conduction heat transfer through the exposed opaque wall and heat stored in it prior to the bedroom period. This first part is dealt with and characterized in previous Section. The size of CCL due to this source can be calculated as product of WWR, Uw, and TDshw. The second source includes the heat and solar radiation transfer through glazing and absorbed by internal walls and masses prior to the bedroom period and heat transfer during the bedroom period. The CCL due to the second source is represented by two terms as follows
CCLG = (Uf)(CTD) + SHGC)(ASH) (2.2)
22
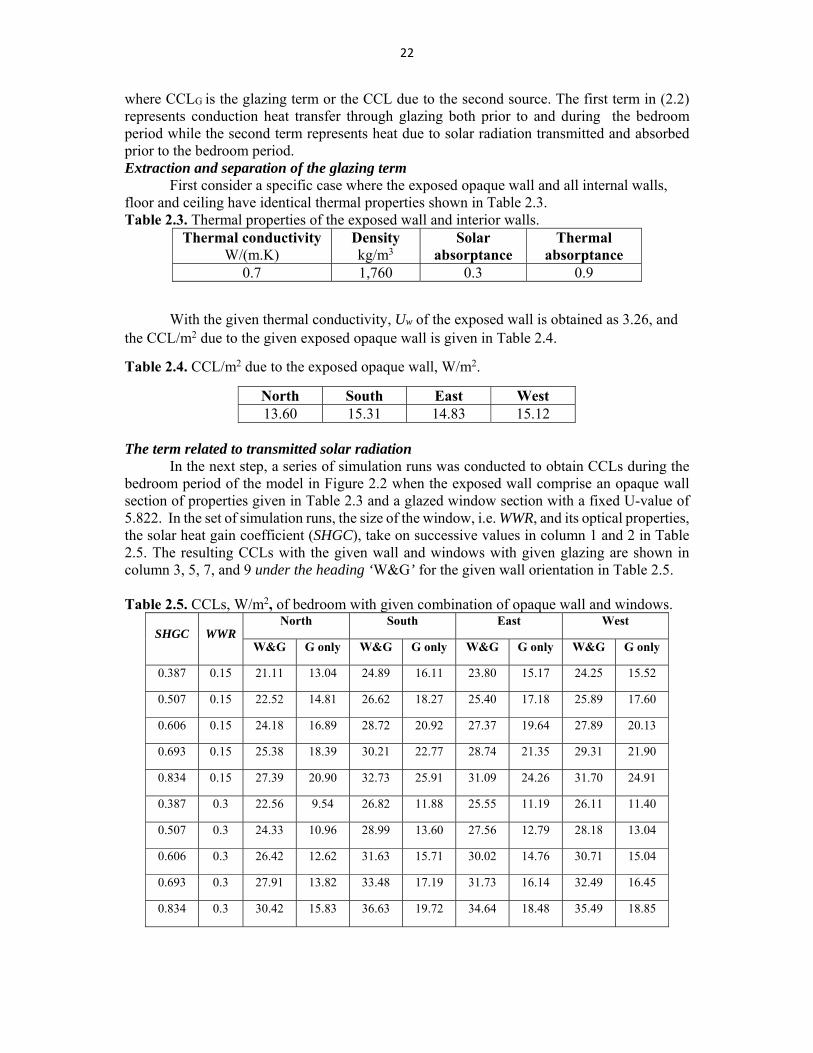
where CCLG is the glazing term or the CCL due to the second source. The first term in (2.2) represents conduction heat transfer through glazing both prior to and during the bedroom period while the second term represents heat due to solar radiation transmitted and absorbed prior to the bedroom period. Extraction and separation of the glazing term First consider a specific case where the exposed opaque wall and all internal walls, floor and ceiling have identical thermal properties shown in Table 2.3. Table 2.3. Thermal properties of the exposed wall and interior walls.
Thermal conductivity W/(m.K)
Density kg/m3
Solar absorptance
Thermal absorptance
0.7 1,760 0.3 0.9
With the given thermal conductivity, Uw of the exposed wall is obtained as 3.26, and the CCL/m2 due to the given exposed opaque wall is given in Table 2.4.
Table 2.4. CCL/m2 due to the exposed opaque wall, W/m2.
North South East West 13.60 15.31 14.83 15.12
The term related to transmitted solar radiation
In the next step, a series of simulation runs was conducted to obtain CCLs during the bedroom period of the model in Figure 2.2 when the exposed wall comprise an opaque wall section of properties given in Table 2.3 and a glazed window section with a fixed U-value of 5.822. In the set of simulation runs, the size of the window, i.e. WWR, and its optical properties, the solar heat gain coefficient (SHGC), take on successive values in column 1 and 2 in Table 2.5. The resulting CCLs with the given wall and windows with given glazing are shown in column 3, 5, 7, and 9 under the heading ‘W&G’ for the given wall orientation in Table 2.5.
Table 2.5. CCLs, W/m2, of bedroom with given combination of opaque wall and windows.
In order to obtain values of CCL due to glazing only, the portion of CCL due to the opaque part of the wall must be removed. According to the postulate, this portion of CCL can be obtained proportionately to wall area from the CCL of exposed opaque wall in Table 2.4. The size of this CCL is CCLOW where CCLOW = (1-WWR)(CCL in Table 2.4). (2.3)
The CCL due to the glazing of given size and given optical and thermal properties is
then obtained as CCLG where CCLG = (CCL in Table 2.5) – CCLOW. (2.4)
The resulting values of CCLG is shown under the heading ‘G only’ in Table 2.5. Figure 2.8 shows a plot of the values of CCLG against the product SHGC*WWR. The power function that fits the plot under the least-square criterion is 5046.0)*(022.41),( WWRSHGCWWRSHGCfCCL CGG (2.5)
Figure 2.8. Plots of CCLG against SHGC*WWR.
Since CCLG in (2.4) and (2.5) is obtained as cooling coil load due to glazing of relative size WWR, such cooling coil load (due to glazing) per unit area, CCLGUA, is then obtained as
GGUA
CCLCCL
WWR ,
where 4954.05046.0 **022.41 WWRSHGCCCLGUA and where this term represents cooling coil
load due to absorbed solar radiation, so its form is identical to the second term in (2.2) as
*GUASCCL SHGC ASH ,
where ASH is the parameter that represents ‘absorbed solar radiation heat’ that contributes to the CCL. The value of ASH is obtained as the derivative with respect to SHGC of CCLGUAS, which is
4954.0
1
)(698.20)(
)(
WWRSHGCd
CCLdASH
SHGC
GUA
To obtain the appropriate value for ASH, the value of WWR should be >0 and should correspond to the smaller value of 0.15 in Table 2.5. This gives ASH = 52.98 for the given wall and window glazing.
24
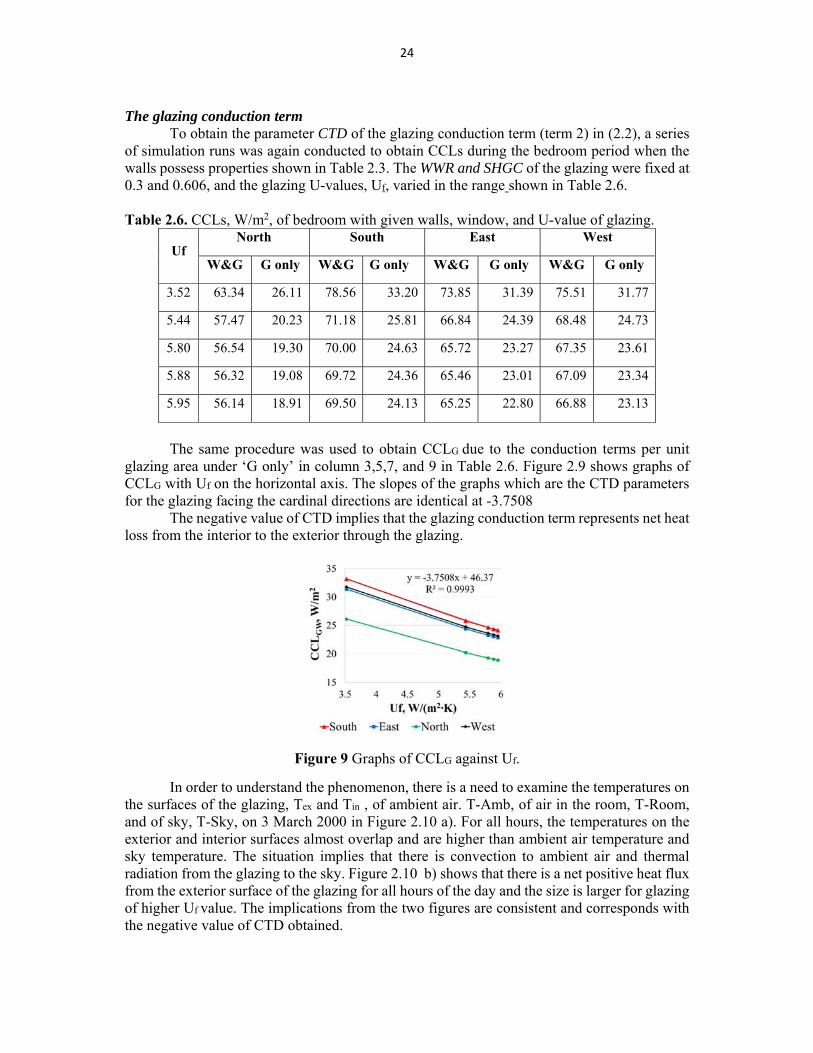
The glazing conduction term To obtain the parameter CTD of the glazing conduction term (term 2) in (2.2), a series of simulation runs was again conducted to obtain CCLs during the bedroom period when the walls possess properties shown in Table 2.3. The WWR and SHGC of the glazing were fixed at 0.3 and 0.606, and the glazing U-values, Uf, varied in the range shown in Table 2.6. Table 2.6. CCLs, W/m2, of bedroom with given walls, window, and U-value of glazing.
The same procedure was used to obtain CCLG due to the conduction terms per unit glazing area under ‘G only’ in column 3,5,7, and 9 in Table 2.6. Figure 2.9 shows graphs of CCLG with Uf on the horizontal axis. The slopes of the graphs which are the CTD parameters for the glazing facing the cardinal directions are identical at -3.7508
The negative value of CTD implies that the glazing conduction term represents net heat loss from the interior to the exterior through the glazing.
Figure 9 Graphs of CCLG against Uf.
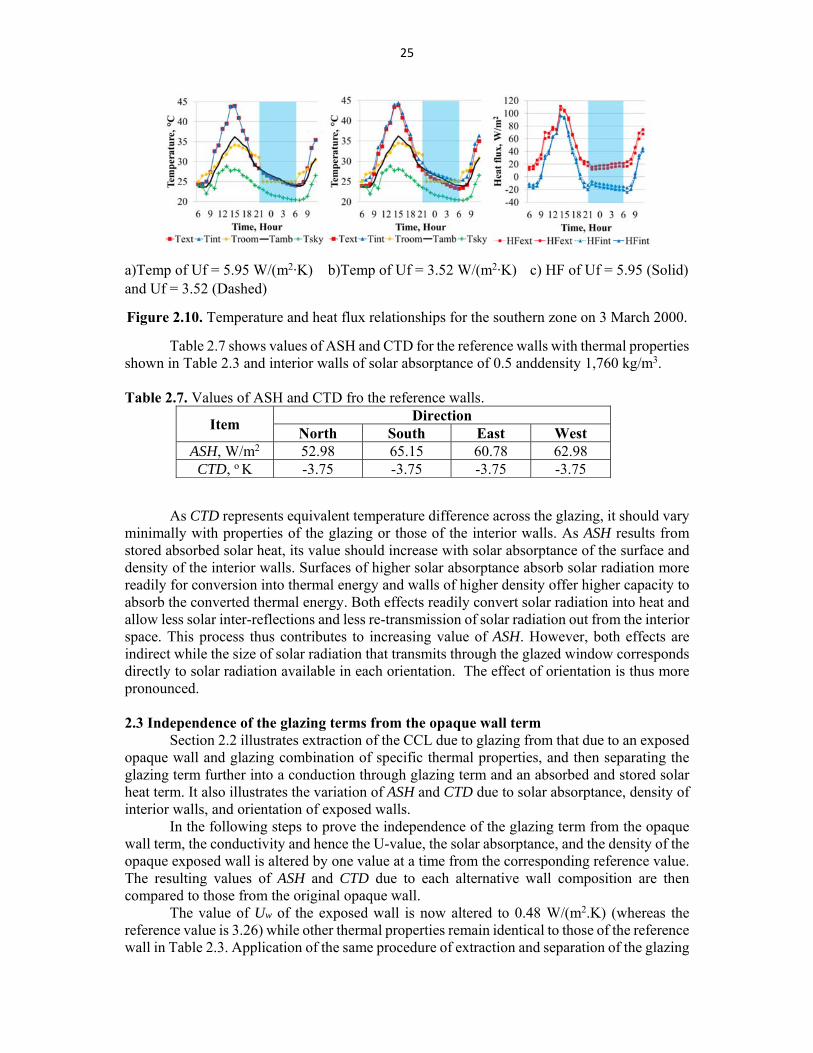
In order to understand the phenomenon, there is a need to examine the temperatures on the surfaces of the glazing, Tex and Tin , of ambient air. T-Amb, of air in the room, T-Room, and of sky, T-Sky, on 3 March 2000 in Figure 2.10 a). For all hours, the temperatures on the exterior and interior surfaces almost overlap and are higher than ambient air temperature and sky temperature. The situation implies that there is convection to ambient air and thermal radiation from the glazing to the sky. Figure 2.10 b) shows that there is a net positive heat flux from the exterior surface of the glazing for all hours of the day and the size is larger for glazing of higher Uf value. The implications from the two figures are consistent and corresponds with the negative value of CTD obtained.
25
a)Temp of Uf = 5.95 W/(m2∙K) b)Temp of Uf = 3.52 W/(m2∙K) c) HF of Uf = 5.95 (Solid) and Uf = 3.52 (Dashed)
Figure 2.10. Temperature and heat flux relationships for the southern zone on 3 March 2000.
Table 2.7 shows values of ASH and CTD for the reference walls with thermal properties shown in Table 2.3 and interior walls of solar absorptance of 0.5 anddensity 1,760 kg/m3. Table 2.7. Values of ASH and CTD fro the reference walls.
Item Direction
North South East West ASH, W/m2 52.98 65.15 60.78 62.98
CTD, o K -3.75 -3.75 -3.75 -3.75
As CTD represents equivalent temperature difference across the glazing, it should vary minimally with properties of the glazing or those of the interior walls. As ASH results from stored absorbed solar heat, its value should increase with solar absorptance of the surface and density of the interior walls. Surfaces of higher solar absorptance absorb solar radiation more readily for conversion into thermal energy and walls of higher density offer higher capacity to absorb the converted thermal energy. Both effects readily convert solar radiation into heat and allow less solar inter-reflections and less re-transmission of solar radiation out from the interior space. This process thus contributes to increasing value of ASH. However, both effects are indirect while the size of solar radiation that transmits through the glazed window corresponds directly to solar radiation available in each orientation. The effect of orientation is thus more pronounced.
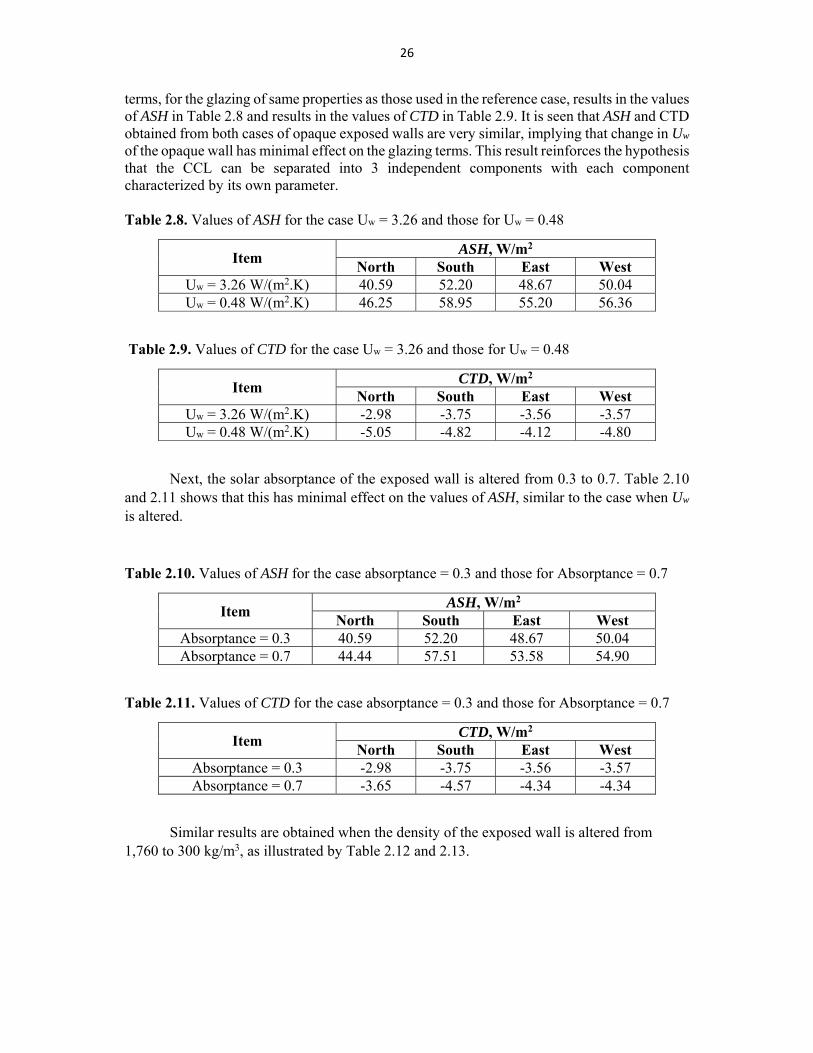
2.3 Independence of the glazing terms from the opaque wall term Section 2.2 illustrates extraction of the CCL due to glazing from that due to an exposed opaque wall and glazing combination of specific thermal properties, and then separating the glazing term further into a conduction through glazing term and an absorbed and stored solar heat term. It also illustrates the variation of ASH and CTD due to solar absorptance, density of interior walls, and orientation of exposed walls. In the following steps to prove the independence of the glazing term from the opaque wall term, the conductivity and hence the U-value, the solar absorptance, and the density of the opaque exposed wall is altered by one value at a time from the corresponding reference value. The resulting values of ASH and CTD due to each alternative wall composition are then compared to those from the original opaque wall. The value of Uw of the exposed wall is now altered to 0.48 W/(m2.K) (whereas the reference value is 3.26) while other thermal properties remain identical to those of the reference wall in Table 2.3. Application of the same procedure of extraction and separation of the glazing
26
terms, for the glazing of same properties as those used in the reference case, results in the values of ASH in Table 2.8 and results in the values of CTD in Table 2.9. It is seen that ASH and CTD obtained from both cases of opaque exposed walls are very similar, implying that change in Uw of the opaque wall has minimal effect on the glazing terms. This result reinforces the hypothesis that the CCL can be separated into 3 independent components with each component characterized by its own parameter. Table 2.8. Values of ASH for the case Uw = 3.26 and those for Uw = 0.48
Item ASH, W/m2
North South East West Uw = 3.26 W/(m2.K) 40.59 52.20 48.67 50.04 Uw = 0.48 W/(m2.K) 46.25 58.95 55.20 56.36
Table 2.9. Values of CTD for the case Uw = 3.26 and those for Uw = 0.48
Item CTD, W/m2
North South East West Uw = 3.26 W/(m2.K) -2.98 -3.75 -3.56 -3.57 Uw = 0.48 W/(m2.K) -5.05 -4.82 -4.12 -4.80
Next, the solar absorptance of the exposed wall is altered from 0.3 to 0.7. Table 2.10 and 2.11 shows that this has minimal effect on the values of ASH, similar to the case when Uw
is altered.
Table 2.10. Values of ASH for the case absorptance = 0.3 and those for Absorptance = 0.7
Item ASH, W/m2
North South East West Absorptance = 0.3 40.59 52.20 48.67 50.04 Absorptance = 0.7 44.44 57.51 53.58 54.90
Table 2.11. Values of CTD for the case absorptance = 0.3 and those for Absorptance = 0.7
Item CTD, W/m2
North South East West Absorptance = 0.3 -2.98 -3.75 -3.56 -3.57 Absorptance = 0.7 -3.65 -4.57 -4.34 -4.34
Similar results are obtained when the density of the exposed wall is altered from 1,760 to 300 kg/m3, as illustrated by Table 2.12 and 2.13.
27
Table 2.12. Values of ASH for the case density = 1,760 kg/m3 and those for density = 300 kg/m3
Item ASH, W/m2
North South East West Density = 1,760 kg/m3 40.59 52.20 48.67 50.04 Density = 300 kg/m3 40.43 51.71 48.31 49.50
Table 2.13. Values of ASH for the case density = 1,760 kg/m3 and those for density = 300 kg/m3
Item CTD, W/m2
North South East West Density = 1,760 kg/m3 -2.98 -3.75 -3.56 -3.57 Density = 300 kg/m3 -3.06 -3.84 -3.65 -3.68
2.4 Validation of the developed OTTV formulation
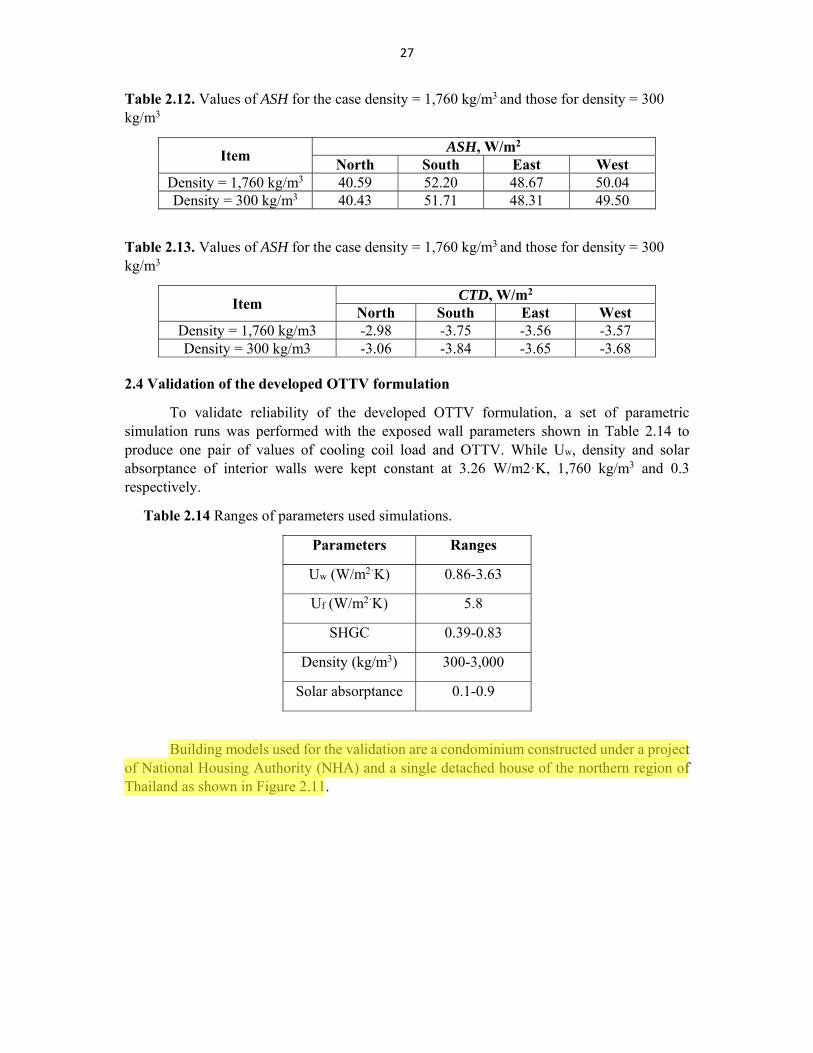
To validate reliability of the developed OTTV formulation, a set of parametric simulation runs was performed with the exposed wall parameters shown in Table 2.14 to produce one pair of values of cooling coil load and OTTV. While Uw, density and solar absorptance of interior walls were kept constant at 3.26 W/m2·K, 1,760 kg/m3 and 0.3 respectively.
Table 2.14 Ranges of parameters used simulations.
Parameters Ranges
Uw (W/m2·K) 0.86-3.63
Uf (W/m2·K) 5.8
SHGC 0.39-0.83
Density (kg/m3) 300-3,000
Solar absorptance 0.1-0.9
Building models used for the validation are a condominium constructed under a project of National Housing Authority (NHA) and a single detached house of the northern region of Thailand as shown in Figure 2.11.
Chris
Highlight
28
a) NHA condominium b) single detached house
Figure 2.11 Building models used in the validation
NHA condominium
The condominium comprises 3-story and each story comprises 20 units of a condominium. Each unit possess a dimension of 5.2m x 6m of width and length with height of 2.8m and each unit comprises bedroom, living room, entrance room, and kitchen as shown in Figure 2.12. Dimension of bedroom is 3m x 3.25m and only this room is assumed to use air conditioner during 9PM-6AM.
Figure 2.12 Floor plan of each unit of NHA condominium
Adjacent
unit
Adjacent
unit
GlazingExposed wall
Living room
Entrance
room
Kitchen
Bedroom
Walk way
29
A simplified building model of condominium is created as shown in Figure 2.13. The building model comprises 3-story and the bedroom is assumed facing the West façade. The bedrooms of 3 floors are assumed to use air-conditioner but only CCL of bedroom of the 2nd floor is considered to eliminate effect of heat transfer through roof and floor. Non air-conditioned zones of kitchen and entrance room of 3 floors and nearby adjacent zones are considered to be single zone. The walls and glazing of the building model are assumed to be constructed by materials in Table 2.14 to possess OTTV values of 13.24, 29.05, and 44.90 W/m2.
Figure 2.13 Building model of condominium
The BESim program and the well-known program namely TRNSYS are used for calculations for whole year CCL of air-conditioned zone by using year 2000 weather data of Thailand. Pairs of OTTV and CCL from the programs are shown in Figure 2.14. The graph shows that increasing of OTTV lead to increase CCL of air-conditioned space and CCL is near zero when OTTV value is zero. The results are similar for both CCL calculated from BESim and TRNSYS programs.
Figure 2.14 Relationship of Yearly CCL against OTTV of NHA condominium
W
Kitchen and
entrance
room
Bedroom
1st floor
Bedroom
2nd floor
Adjacent
unit
E
SN
Adjacent
zone
Adjacent
unit
Bedroom
3rd floor
30
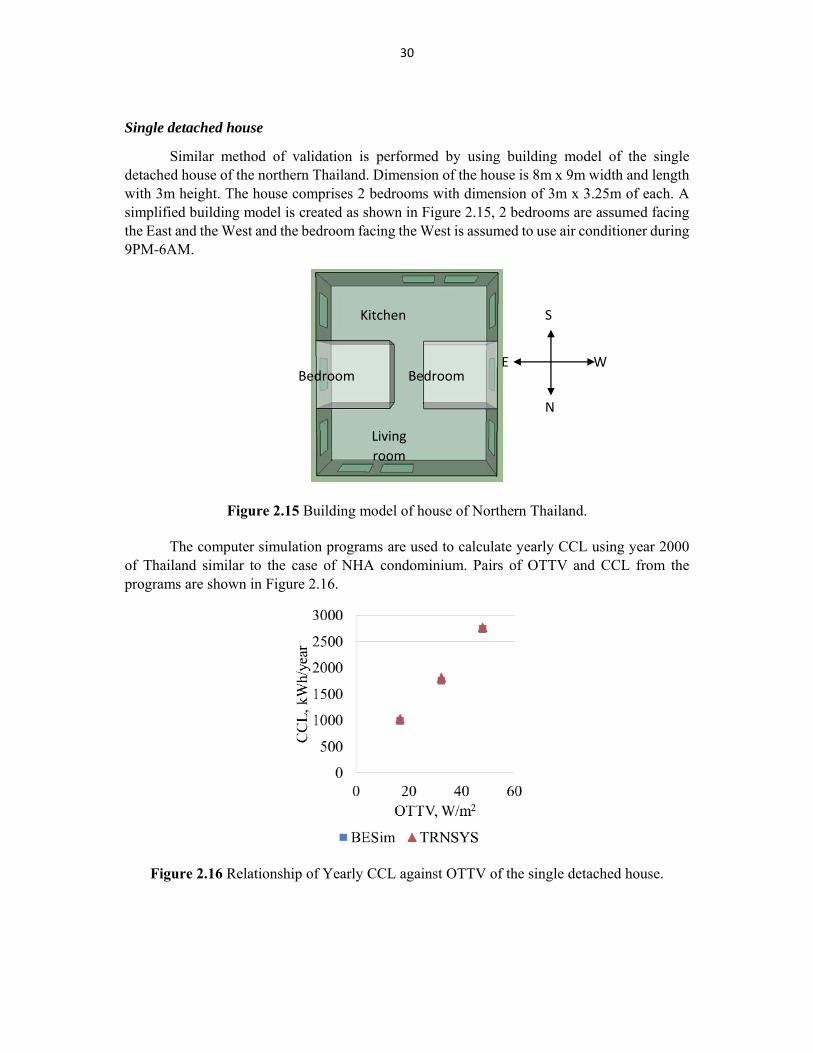
Single detached house
Similar method of validation is performed by using building model of the single detached house of the northern Thailand. Dimension of the house is 8m x 9m width and length with 3m height. The house comprises 2 bedrooms with dimension of 3m x 3.25m of each. A simplified building model is created as shown in Figure 2.15, 2 bedrooms are assumed facing the East and the West and the bedroom facing the West is assumed to use air conditioner during 9PM-6AM.
Figure 2.15 Building model of house of Northern Thailand.
The computer simulation programs are used to calculate yearly CCL using year 2000 of Thailand similar to the case of NHA condominium. Pairs of OTTV and CCL from the programs are shown in Figure 2.16.
Figure 2.16 Relationship of Yearly CCL against OTTV of the single detached house.
W Bedroom Bedroom
Kitchen
Living
room
E
S
N
31
The results are similar to the case of NHA condominium. Increasing of OTTV, increase CCL of air-conditioned space and CCL becomes near zero when OTTV value is zero. The results conclude that the developed OTTV formulation can evaluate performance of walls precisely.
The results of the study indicates that building envelope and interior walls should be constructed by using low thermal mass materials including low solar absorptance of wall surfaces to reduce heat storage from solar radiation and temperature different on walls during daytime. The exposed wall should be installed interior insulations and if the wall comprises window area, the glazing type and shading device should be considered to screen the transmitted solar radiation through window which is much influenced with the performance of building envelopes.
Chris
Highlight
32
AUTHORS
Joint Graduate School of Energy and Environment (JGSEE) King Mongkut’s University of Technology Thonburi (KMUTT)
Thailand Project: Research Programme on Reducing Energy Consumption Cost and GHG Emission
for Tropical Low-income Housing: Thailand Contribution
Name Position in the Project
Prof. Dr. Surapong Chirarattananon Principal Investigator Asst. Prof. Dr. Pattana Rakkwamsuk Co-investigator
Asst. Prof. Dr. Siriluk Chiarakorn Co-investigator Asst. Prof. Pipat Chaiwiwatworakul Co-investigator
Dr. Surawut Chuangchote Co-investigator Mr. Preecha Tummu Research Associate
Ms. Bupphapan Puangbuppha Research Associate Ms. Kasawn Ruangtinakorn Research Assistant
33
REFERENCES [1] Z. Zhai, J.M. Previtali, Ancient vernacular architecture: characteristics categorization and energy performance evaluation, Energy and Buildings, 42 (3) (2010) 357-365. [2] R. Lindberg, A. Binamu, M. Teikari, Five-year data of measured weather, energy consumption, and time-dependent temperature variations within different exterior wall structures, Energy and Buildings, 36 (6) (2004) 495-501. [3] K.E. Thomsen, J.M. Schultz, B. Poel, Measured performance of 12 demonstration projects—IEA Task 13 “advanced solar low energy buildings”, Energy and Buildings, 37 (2) (2005) 111-119. [4] S.A. Kalogirou, G. Florides, S. Tassou, Energy analysis of buildings employing thermal mass in Cyprus, Renewable Energy, 27 (3) (2002) 353-368. [5] L. Zhu, R. Hurt, D. Correia, R. Boehm, Detailed energy saving performance analyses on thermal mass walls demonstrated in a zero energy house, Energy and Buildings, 41 (3) (2009) 303-310. [6] S. Chiraratananon, V.D. Hien, Thermal performance and cost effectiveness of massive walls under thai climate, Energy and Buildings, 43 (7) (2011) 1655-1662. [7] M. Bojić, F. Yik, Cooling energy evaluation for high-rise residential buildings in Hong Kong, Energy and Buildings, 37 (4) (2005) 345-351. [8] E. Kossecka, J. Kosny, Influence of insulation configuration on heating and cooling loads in a continuously used building, Energy and Buildings, 34 (4) (2002) 321-331. [9] C. Balocco, G. Grazzini, A. Cavalera, Transient analysis of an external building cladding, Energy and Buildings, 40 (7) (2008) 1273-1277. [10] S. Chirarattananon, V.D. Hien, P. Tummu, Thermal performance and cost effectiveness of wall insulation under Thai climate, Energy and Buildings, 45 (0) (2012) 82-90. [11] P. Tummu, S. Chirarattananon, V.D. Hien, P. Chaiwiwatworakul, P. Rakkwamsuk, Thermal performance of insulated walls enclosing residential spaces in Thailand, Energy and Buildings, 61 (0) (2013) 323-332. [12] M. Krarti, P.M. Erickson, T.C. Hillman, A simplified method to estimate energy savings of artificial lighting use from daylighting, Building and Environment, 40 (6) (2005) 747-754. [13] S. Chaiyapinunt, B. Phueakphongsuriya, K. Mongkornsaksit, N. Khomporn, Performance rating of glass windows and glass windows with films in aspect of thermal comfort and heat transmission, Energy and Buildings, 37 (7) (2005) 725-738. [14] D.R. Wulfinghoff, Energy Efficiency Manual, in, Energy Institute Press, 1999, pp. 919-929 and 1000-1005.
34
[15] D.H.W. Li, S.L. Wong, C.L. Tsang, G.H.W. Cheung, A study of the daylighting performance and energy use in heavily obstructed residential buildings via computer simulation techniques, Energy and Buildings, 38 (11) (2006) 1343-1348. [16] F.W. Fairey, Efffects of Infrared Radiation Barriers on the Effective Thermal Resistance of Building Envelopes, in: ASHRAE/DOE Conference on ‘Thermal Performance of the Exterior Envelopes of Buildings II, Las Vegas, USA, 1982. [17] W.P. Levins, D.L. Herron, Radiant Barrier Field Tests in Army Family Housing Units at Fort Benning, in, ASHRAE Transactions Part II, Georgia, USA, 1990, pp. 589-597. [18] W.P. Levins, J.A. Hall, Measured Effects of Dust on the Performance of Radiant Barriers Installed on Top of Attic Insulation, in, ASHRAE Transactions, Part II, 1990, pp. 253-260. [19] A. Moser, O. Frank, A. Schalin, X. Yuan, Numerical Modeling of Heat Transfer by Radiation and Convection in a Atrium with Thermal Inertia, in, ASHRAE Transactions: Symposia, 1995, pp. 1136-1143. [20] S.F. Moujaes, R.A. Brickman, Effect of Radiant Barrier on the Cooling Load of a Residential Application in a Hot and Arid Region: Attic Duct Effect, Heating Ventilating Air-conditioning and Refrigeration Research, 4 (1998) 231-244. [21] T. Soundhan, T. Feuillard, F. Bade, Experimental Evaluation of Insulation Material in Roofing Sysytem under Trropical Climate, Solar Energy, 79 (2005) 311-320. [22] R. Tang, I.A. Meir, T. Wu, Thermal performance of non air-conditioned buildings with vaulted roofs in comparison with flat roofs, Building and Environment, 41 (3) (2006) 268-276. [23] J. Iwaro, A. Mwasha, A review of building energy regulation and policy for energy conservation in developing countries, Energy Policy, 38 (12) (2010) 7744-7755. [24] Lausten, Enegy efficiency requirements in building energy codes and energy efficiency policies for new buildings, in: IEA Information Paper in support of the G8 Plan of Action, IEA, 2008. [25] K.J. Chua, S.K. Chou, An ETTV-based approach to improving the energy performance of commercial buildings, Energy and Buildings, 42 (4) (2010) 491-499. [26] IEA Secretariat, Technology Road Map: Energy Efficient Building Envelopes, in, IEA, Paris, 2013. [27] D. Leipziger, Comparing building energy performance measurement: a framework for international energy efficiency assessment systems, in, Institute for Market Transformation, Washington DC, 2013. [28] M. Hyland, R.C. Lyons, S. Lyons, The value of domestic building energy efficiency- evidence from Ireland, in: Department of Economics Discussion Paper, University of Oxford, Manor Road Building, Oxford, 2012.
35
[29] S. Chirarattananon, J. Taveekun, An OTTV-based energy estimation model for commercial buildings in Thailand, Energy and Buildings, 36 (7) (2004) 680-689. [30] HK-BEAM Society, HK-BEAM An Environmental Assessment for Buildings, in, Business Environmental Council of Hong Kong, 2004. [31] R. Jaijongrak, Ruen Thai Derm: traditional Thai house, The Association of Siamese Architects Under Royal Patronage, 2000. [32] S. Chirarattananon, P. Chaiwiwatworakul, V.D. Hien, P. Rakkwamsuk, K. Kubaha, Revised building energy code of Thailand: Potential energy savings, in: sustainable building South-East Asia, Kuala Lumpur, Malaysia, 2007. [33] S. Chirarattananon, P. Rakkwamsuk, V.D. Hien, J. Taveekun, V. Mettanant, Development of a building energy code for new buildings in Thailand, in: Sustainable Energy and Environment (SEE), the Joint Graduate School of Energy and Environment and Kyoto University, Hua Hin, Thailand, 2004, pp. 859-867.