Residential burglaries A comparison between self-report studies of burglars and observational data from Enschede Author: Feike Aantjes Supervisors University of Twente: Mw. Prof. Dr. M. Junger Mw. Dr. A.L. Montoya Enschede, May 2012
Transcript
Residential burglaries
A comparison between self-report studies of burglars and observational data from Enschede
Author: Feike Aantjes
Supervisors University of Twente: Mw. Prof. Dr. M. Junger
Mw. Dr. A.L. Montoya
Enschede, May 2012
2
Abstract
Residential burglary is a serious crime. In Twente the amount of residential burglaries increased
in the period of 2007 till 2011 every year by at least 8%. A burglary has a significant impact on
the victims, not only financially but emotionally as well. Once a burglary is committed, a repeat
of the crime is very likely.
Some theories try to explain how burglars operate and why. These theories are the rational
choice perspective, the routine activities approach, the opportunity theory, the crime pattern theory
and crime prevention through environmental design (CPTED).
This study compares the results of self report studies of burglars with observational data from Enschede,
a Dutch city with approximately 157.000 citizens. The self report studies are from Macintyre (2001). He
interviewed 50 burglars to obtain a list of seventeen cues, which play a role in assessing whether a
house is suitable to break in to or not. Some cues attract burglars, while others deter them. In Enschede
851 houses were observed in 2010, 430 of them were burglarized in 2008 and the other 421 were not
burglarized the past 5 years. Every house was observed using a checklist, which was used for
characteristics of the houses and the direct environment. Every cue of Macintyre is compared with the
data from Enschede, to find out whether the cues correspond or not.
The factors dog evidence and people in the street have in agreement with Macintyre a significant lower
chance of getting burglarized. Houses with bad window frames or bad maintenance or a corner house
are significantly more likely to get burglarized.
Houses with high fences, an alarm system or extra locks are more likely to get burglarized, in contrast
with what was expected. The other cues had no significant impact on the chance of getting burglarized.
Further research can take alarm systems and extra locks into account and investigate whether these are
effective measures, as well as dead-end streets and take the different types of dead-end streets into
account. Finally a replica of Macintyre’s study in a Dutch setting with information about the modus
operandi could generate more insight in the target selection and breaking and entering of burglars in
The Netherlands.
3
Residential burglaries
Burglary of dwellings is a serious crime, which confronts a lot of Dutch citizens. In 2009 nearly 74.000
burglaries were committed, an increase of 6% compared to 2008 (CBS, 2010). This increase continued in
2010, when the Dutch police registered 10% more burglaries (CBS, 2011). Several police regions
reported again an increase in burglaries in the first six months of 2011 (De Waard, 2011). Similarly, the
same tendency can be seen in Enschede, a Dutch city with more than 157.000 residents in the region
Twente. In 2008 and 2009 the amount of burglaries in the region Twente increased consecutively with
8.5% and 7.7% to 1777 burglaries in 2009 (Politie Twente, 2010). In 2010 the number of residential
burglaries increased again with 8% to 1915 burglaries (Politie Twente, 2011). In 2011 the number of
burglaries increased even more, 2284 burglaries meant an increase of almost 20% (Politie Twente,
2012). This trend is displayed in figure 1: Burglaries in Twente.
Figure 1: Burglaries in Twente
The number of burglaries did not only increase in absolute terms, it also increased relatively to the
population of Enschede. The number of citizens increased from 2006 till 2011 every year on average
with 0.45%. Similar, the number of residential spaces increased from 2007 till 2009 with 0.69% on
average every year. Detailed information about the number of residential spaces can be seen in
Appendix B, table 1.
4
A burglary has a significant impact on the victims and is therefore a crime feared among many citizens.
Besides financial damage there are large consequences for the victims, women in particular (Shover,
1991). Once a dwelling is burglarized, the chance of a repeat of the burglary is relatively higher (repeat
victimization). Houses in the nearby area are more at risk of getting burglarized or a burglary attempt
due to the fact that burglars are familiar with the area and the characteristics of the houses (Bernasco,
2008). Due to the large impact on victims and the annual increase of burglaries it is important to pay
attention to the prevention of burglaries. The social benefits of this research focus on the prevention of
burglaries by gaining more and better knowledge about burglaries in Twente.
Some approaches explain how burglars operate and why. In the next section the rational choice
perspective, the routine activities approach, opportunity, the crime pattern theory and crime prevention
through environmental design (CPTED) will be discussed.
1. Rational Choice Perspective
The rational choice perspective focuses on the decision-making process of the offender. This approach
assumes that an offence is a specific behavior and that the offender will benefit in some way. The word
‘rational’ in rational choice perspective means that an offender seeks for optimal utilization, just like an
economic model. Optimal means that the process differs for every offender. It therefore includes the
making of decisions and choices. Time, the cognitive attributes of an offender as well as the accessibility
of proper information are important aspects (Cornish & Clarke, 2008; Felson & Clarke, 1998). Burglars
consider the costs and benefits for every attempt to burglary. These cons consist not only of the trouble
they have to go through the process to commit a burglary, but also of the chances of getting caught. The
pros are often cash and/or assets, but it can also be the desire for psychological thrills (Ekblom, 1997;
Katz, 1988). These considerations are explained with the rational choice perspective and the opportunity
theory (Felson & Clarke, 1998).
The opportunity theory explains that the chance of committing a crime increases when the opportunity
is larger. This theory is connected to situational crime prevention. According to advocates of this theory,
every form of crime has something to do with opportunity. Even when an offender is motivated, without
opportunity there is no crime possible. This theory accounts for almost every type of crime. Felson and
Clark (1998) published ten principles of crime opportunity. They are briefly discussed below.
5
Crime opportunities are always specific, a single opportunity factor cannot account for every type of
crime. In case of a burglary a burglar might be looking for specific assets like cash and jewelry, while
another burglar might only be looking for expensive art. Opportunities are always concentrated in time
and space, there are enough places, people and properties that are not suitable for crime. On the
contrary, people that prevent criminal behavior like police officers, receptionists or security officers are
unable to be in place everywhere.
Another principle of the opportunity theory is that an offender easily gets involved in other crimes. An
example is a burglar who first steals certain goods and later sells the stolen goods or threatens the
residents during the burglary (Felson & Clarke, 1998).
Some products are more sensitive to crime than others. Burglars of dwellings often search for cash,
jewelry and electronic devices.
Social and technological changes lead to new crime opportunities. On the other hand, a lot of products
are no longer interesting for criminals, for example is a video recorder. Items like these will hardly be
stolen anymore, because they are no longer produced and barely used or because their resale value is
very low (Felson & Clarke, 1998).
Crime can be prevented when the opportunity is removed. Most people do this every day, for example
locking the door and putting away your money. Nevertheless, taking the opportunity away does not
automatically lead to displacement of crime.
Specific reduction of opportunity can reduce crime in space. An example is that the environment can
profit from certain safety measures. For example when a burglar alarm is installed in a dwelling, burglars
can evade dwellings in the direct neighborhood (Felson & Clarke, 1998). There is a diffusion of
prevention measures in the sense that the reduction covers a larger area than originally expected.
Another approach within Crime Science is the Routine Activities Approach. This approach originates
from the 70’s and states that when these three elements coincide the chances of a crime are significant:
A potential offender;
A suitable target;
6
The absence of protection.
The first requirement, a potential offender, means a motivated offender who is willing to commit a
crime.
The second requirement, a suitable target, can be a person, object or place. There are two acronyms to
describe these, VIVA and CRAVED. VIVA stands for value, inertia, visibility, access. Inertia is the weight of
the object and whether an offender is able to take it with him. In case of a person as a target it is about
whether the offender can deal with him or not. CRAVED stands for concealable, removable, available,
valuable, enjoyable and disposable.
The third requirement, absence of guardianship, means there is no possibility of intervention. This can
be a police officer, but also a citizen, a neighbor or someone else who is around. It can even be CCTV,
provided that someone monitors it.
The Routine Activities Approach is in the USA and Europe the best explanation for the increasing
number of burglaries of dwellings in the 60’s and 70’s. This approach explains on both micro and macro
level how crime increases (Felson, 2008; Felson & Clarke, 1998).
2. Crime pattern
The crime pattern theory states that crime consists of certain patterns. Central elements are how people
and others who are involved move in time and space. This theory is connected to the Routine Activities
Theory. Three elements are important at the crime pattern theory, namely nodes, paths and edges.
Nodes are the places to where people travel and return. This can contain places that cause crime or
where crime is present. Every offender seeks opportunities for crime in or around his personal nodes.
This can be his own or a friend’s house, school or places to go out. Crime occurs on the paths that are
used for this. When these two are combined one can generate crime maps.
The third element of the crime pattern theory, edges, contains the edges of areas in which people live
and move. Crime often occurs at these edges, where people meet each other. Mapping certain patterns
and information makes it possible to reduce some forms of crime. Burglaries of dwellings have different
patterns, because offenders chose a specific dwelling and neighborhood to commit their crime. Many
offenders live in the neighborhood of their victims and repeat victimization often occurs. This can occur
7
to a house that is already burglarized, but also dwellings in the direct environment. Offenders already
know the area and layout of the dwelling (Felson & Clarke, 1998).
CPTED
These theories led to the existence of Crime Prevention Through Environmental Design (CPTED). This is a
method for crime prevention which is often based on the physical environment. CPTED is derived from
Newman’s model from the 70’s of defensible space. Defensible space was about the adjustment of the
physical environment in order to control the living area. CPTED has a methodology with clear basic rules
about how the built on environment should be designed. The point of origin is that crime should
decrease and the feelings of safety should increase. CPTED can be applied at every place. The
adjustments according to CPTED can be best applied at the development stage, but existing
constructions can also be adjusted according to CPTED principles.
CPTED consists of six core values that fade over, there are no concrete mutual boundaries. The six core
Target hardening Dog evidence 0,562 0,706 0,53 0,475
Light in the niche 0,03 0,993 0,024 1,01
Interaction effects Path at the rear by Volume vehicles high 0,263 0,713 0,332 0,565a
Dog evidence by Volume vehicles high 1,221 2,129 - -
Alarm evidence by Volume vehicles high 1,13 0,429 0,889 3,06
Wald 108.58
23.45 Nagelkerke R Square 0.164
0.081
Chi Square 60.874***
39.324** Houses included 513
637
ap<.1
*p<.05 **p<.01 ***p<.001
The multiple logistic regression displays a model with predictions of the probability of houses
getting burglarized. A distinction is made between houses that are burglarized during the day
23
and during the night. This distinction is based on real sunrise/sunset data. Multiple locks and
burglar alarms are excluded from the model, because they both show a reversed association.
The daytime model can predict 74,6%, while the nighttime can only predict 63,8%. The odds
ratio for every cue are displayed, for example houses with a path at the rear are during the day
1,56 times more likely to be burglarized and during the night 1,3 times more likely to be
burglarized. Other interesting findings are that houses with a high volume of vehicles or
pedestrians are more likely to be burglarized during the night than during the day. Corner
houses are more vulnerable during the day (p<.05) than at night. Houses in a dead end street
have a higher chance of getting burglarized during the night than during the day. Houses with
bad maintenance are less likely to get burglarized during the day than the night.
Discussion
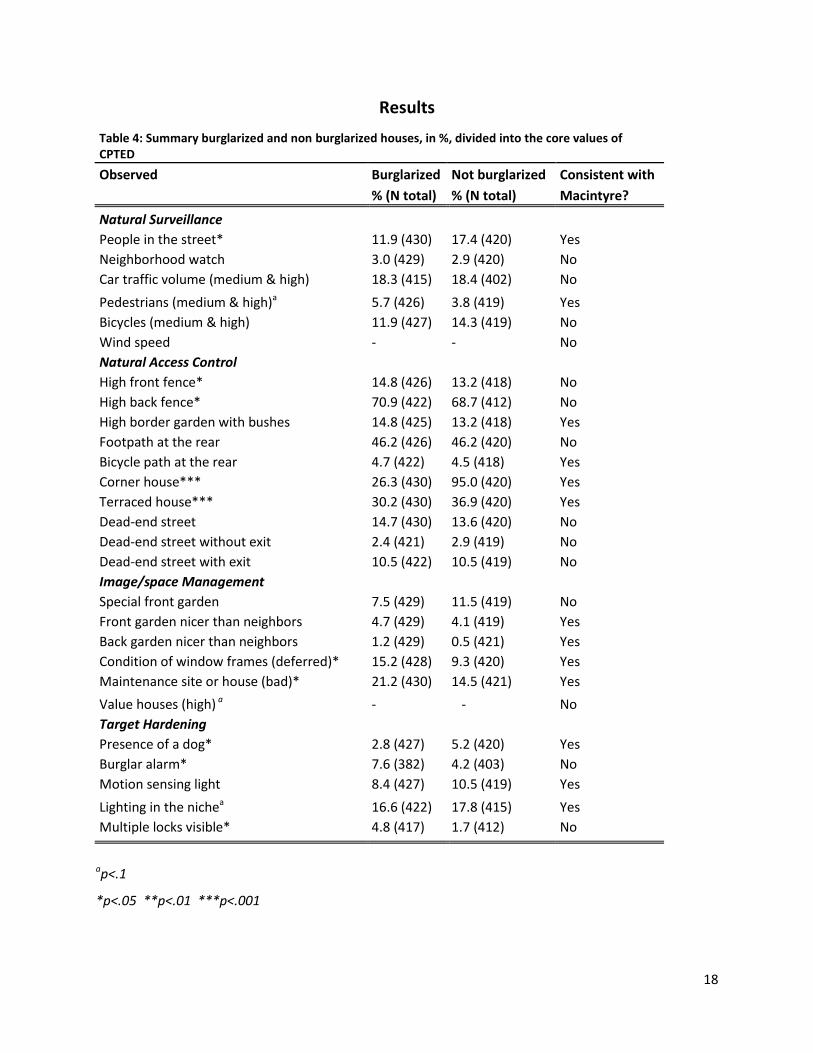
This study examined the level of similarities between statements of burglars and observational data
from Enschede. Several cues were compared and six factors were in complete agreement with
Macintyre and four factors were the opposite of what was expected. Another seven factors were in
agreement with Macintyre, but not significant and ten factors were not in agreement with Macintyre,
but not significant as well.
In agreement with Macintyre the chances of a burglary are lower at houses with evidence of a dog and
people in the street. The chances of a burglary are higher at houses with bad window frames or bad
maintenance of the house or property in general. As expected corner houses have a higher chance of
getting burglarized than terraced houses. These findings are all in accordance with other various studies
and confirm that these cues are related to burglary.
Some cues did not differ much in the risk of getting burglarized. The factors motion sensing lights, a
bicycle path at the rear, having a nicer garden than the neighbors, a high or medium number of
pedestrians crossing and a high border with bushes were in agreement with Macintyre, but not
significant.
24
Not in agreement with Macintyre but not significant were a dead-end street and a footpath at the rear,
high or medium car and bike traffic volume, having a special front garden, high wind speed and a
neighborhood watch.
Houses in a dead-end street were expected to be less burglarized than houses in other street types. In
Enschede no evidence was found for houses in a dead-end street being less vulnerable to burglary.
However, houses in a dead-end street without an exit are slightly less likely to be burglarized than
houses in a dead-end street with an exit, which is in accordance with Macintyre’s participants. The
result is however not significant and is not in line with other research (R. Armitage, 2007; Johnson &
Bowers, 2010).
Houses with a footpath or bicycle path at the rear were expected to have more burglaries, but no
evidence was found for both these factors. Houses with a bicycle path were slightly more burglarized,
but the result is not significant. A possible explanation can be that burglars in Enschede make less use of
escape routes.
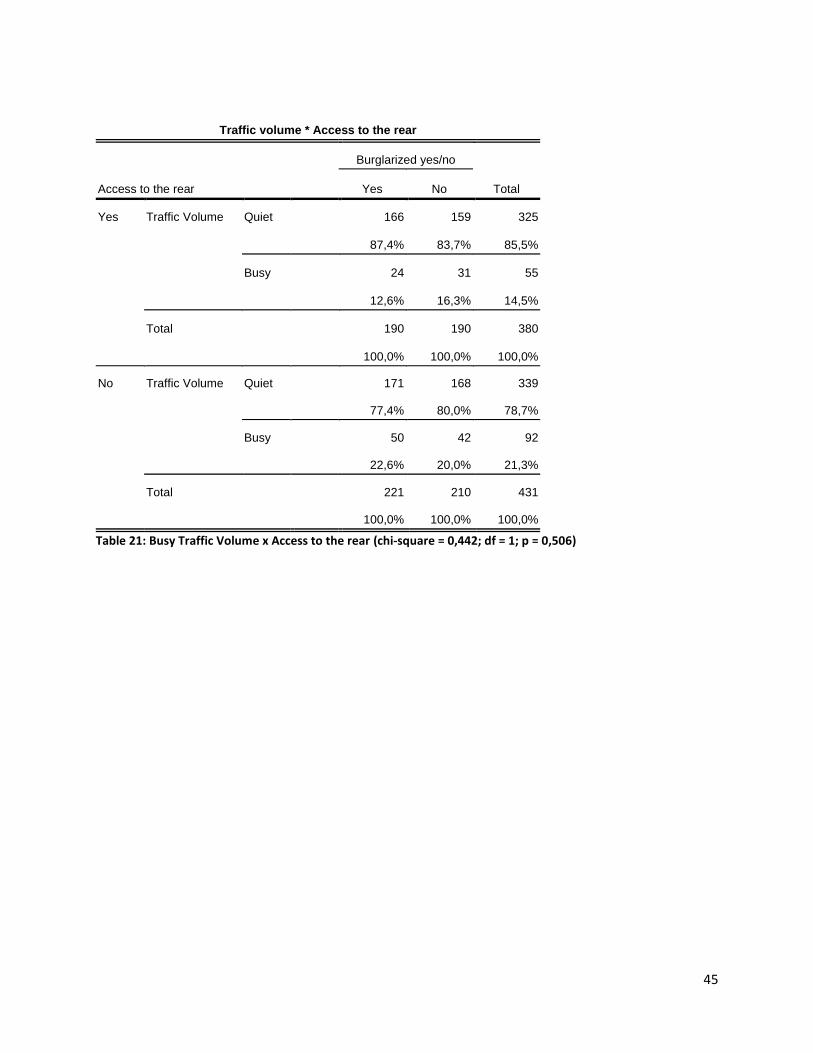
Macintyre’s participants stated they prefer busy streets, which makes them less visible when
committing a burglary. Regarding traffic intensity, only houses with a high number of pedestrians were
more burglarized, the result is marginally significant.
Not in agreement with Macintyre but significant are the higher chances of a burglary at houses with an
alarm and houses with multiple locks, as well as houses with a high fence at the front or the back. The
value of burglarized houses was also not in agreement with Macintyre. The values of the burglarized
houses were slightly lower than the values of the non burglarized houses.
Like stated before, the number of burglaries at houses with an alarm showed an opposite association,
houses with an alarm were more burglarized than houses without an alarm. An explanation can be that
an alarm indicates that there are valuable goods inside or that victims or a burglary fit an alarm after
they are burglarized. This is called the ‘Paris Hilton effect’ according to Vollaard (2010). Without having
experienced a burglary, people often fail to implement security measures that prevent burglaries. After
they are burglarized they take a lot of measures, like multiple locks. This can explain why these houses
were more burglarized. Another possible explanation is the time effect. The data of the burglarized
25
houses is from 2008, the observations were performed in 2010. Over the years residents could have
moved somewhere else, reconstruct their dwelling or experience a burglary or another crime and take
measures. Macintyre’s participants stated they do not prefer high fences. Houses with a high fence at
the front or the back also showed an opposite association. A possible explanation is that burglars in
Enschede used a different point of entry for the houses or the fences were not closed (properly) and
easy to move past. According to Krainz (1988), burglars might also be attracted to a residence when a
high fences blocks the neighbors views.
Limitations
Offender interviews should be treated with caution. Nevertheless, offenders are a wide source of
information and with the right methodology and maximizing the validity a lot of information of
offenders can be learned. Maximizing validity for using information of offenders is the biggest challenge.
This can be done in various ways (Field, 2005). Macintyre took this into account by selecting the
offenders in a non threatening environment, where they were beyond the reach of the law. The first
group of 50 offenders came from a drug treatment center and had no connection the police or the court
of Justice. The second group of 96 offenders was selected via a private centre for released prisoners.
These offenders served their time in prison and had no connection to the law anymore. All offenders
were experienced burglars; some committed a few burglaries while others committed more than 100
burglaries. The burglars from the first study were still active or recently active as a burglar (Macintyre,
2001).
Some cues are time sensitive. For example, the cues people in the street and traffic volume of cars, bikes
and pedestrians can differ at any time. This study did not take the times in which the burglaries occurred
into account, which could influence the reliability of the results.
The study of Macintyre is performed in Australia, which can raise concern about the generalizability of
cues to the Netherlands, which is in another continent. Study one of Macintyre took place in Bisbane, a
city located in the east of Australia. This part of Australia has a subtropical climate and the climate can
have windstorms during the rainy season, which is from January till April. The generalizability of the cue
‘weather’ is therefore less, because in the Netherlands these windstorms are less likely to occur. This
can also be an explanation why no evidence was found for wind speed and burglary. Other research
26
discovered that variables about burglary can have a significant effect in the same direction in other
countries (Tseloni, et al., 2004).
The WOZ value was used to analyze whether expensive houses were more burglarized than less
expensive houses. This is the value the municipality assigns for taxes purposes to a property including
the parcel, with the garden and garage. A limitation of using this value for analyses is for example a
small apartment in an expensive neighborhood, which can potentially cost the same as a medium house
on a very large parcel. A burglar could see the difference between those houses by using other cues, but
the WOZ value would not reflect this difference. Using building values only could solve this issue. The
WOZ value was only available at neighborhood level and not at individual level. This makes this outcome
less reliable.
Suggestions for further research
Suggestions for further research could be a study of burglar alarms and other target hardening
measures. Further research can go into detail about alarm systems and whether they are installed
before or after a crime, which can gain useful information about the effect of alarm systems. This can
apply to other target hardening measures as well, like multiple locks. The effect of both measures is
unclear at this moment.
Another suggestion for further research is a study for houses in a dead-end street. This study made no
difference between the type of street, only whether there was an exit. A new study can take the types
of cul-de-sacs (linear in geometry and more sinuous) into account and analyze whether the risk of
burglary is higher in a certain type.
A final suggestion for further research would be a replica of Macintyre’s study in The Netherlands. This
requires a comprehensive research and should be combined with an investigation about the modus
operandi of a burglary. This can give new insights in the selection of a target in Dutch cities and the way
how breaking and entering is performed.
27
Literature
Armitage, R. (2000). An Evaluation of Secured by Design Housing within West Yorkshire. Home Office Briefing Note, 7(00), 1-4.
Armitage, R. (2007). Sustainability versus safety: confusion, conflict and contradiction in designing out
crime. Crime Prevention Studies, 21, 81-110. Bennett, T., & Wright, R. T. (1984). Burglars on burglary: Prevention and the offender. Hampshire, UK:
Gower. Bernasco, W. (2008). Them Again?: Same-Offender Involvement in Repeat and Near Repeat Burglaries.
European Journal of Criminology, 5(4), 411-431. doi: 10.1177/1477370808095124 Bernasco, W., & Luykx, F. (2003). Effects of attractiveness, opportunity and accessibility to burglars on
Brunninkhuis, K. (2010). Invloed van weersomstandigheden op het aantal woninginbraken in de periode
2004 t/m 2008 in de gemeente Enschede. University of Twente, Enschede. Buck, A. J., Hakim, S., & Rengert, G. F. (1993). Burglar alarms and the choice behavior of burglars: A
Budd, T. (1999). Burglary of Domestic Dwellings. Findings from the British Crime Survey. London:
Information and Publications Group. Bureau Van Dijk, Van Soomeren en Partners Amsterdam,. (1991). Woninginbraak. Motieven en
werkwijzen vanuit daderperspectief. Den Haag: Landelijk Bureau Voorkoming Misdrijven. CBS. (2010). Geregistreerde criminaliteit blijft gelijk Retrieved 2011-03-01, from http://www.cbs.nl/nl-
NL/menu/themas/veiligheid-recht/publicaties/artikelen/archief/2010/2010-3161-wm.htm CBS. (2011). Politie registreerde 1,2 miljoen misdrijven in 2010 Retrieved 2011-12-01, from
Cozens, P. (2008). Crime Prevention Through Environmental Design. In R. Wortley & L. Mazerolle (Eds.), Environmental Criminology and Crime Analysis (pp. 153-177). Portland: Willan Publishing.
De Waard, J. (2011). Preventieve maatregelen woninginbraak zeer effectief. Secondant, 6, 8-13. Ekblom, P. (1997). Gearing Up Against Crime: a Dynamic Framework to Help Designers Keep up with the Adaptive Criminal in a Changing World. International Journal of Risk, Security and Crime Prevention, 2(4),
249-265. Felson, M. (2008). Routine Activity Approach. In R. Wortley & L. Mazerolle (Eds.), Environmental
Criminology and Crime Analysis (pp. 70-77). Portland: Willan Publishing. Felson, M., & Clarke, R. (1998). Opportunity Makes the Thief: Practical theory for crime prevention.
Police Research Series, 98. Field, A. (2005). Discovering statistics using SPSS (2nd ed). London: Sage. Hakim, S., & Buck, A. J. (1992). What makes a good burglary site? . Security Distributing and Marketing,
April, 68-69. Hakim, S., Shachmurove, Y., & Fishman, G. (1998). Do Burglars Calculate ROI? A Logistic Regression
Analysis Journal of Economic and Social Measurement, 24(1), 1-13. Handel, C. v. d., Nauta, O., Soomeren, P. v., & Amersfoort, P. v. (2009). Hoe doen ze het toch? Modus
Operandi Woninginbraak. Amsterdam: DSP-groep. Hearnden, I., & Magill, C. (2004). Decision-making by house burglars: offenders' perspectives (Vol. 249).
London: Home Office. Hirschfield, A., Newton, A., & Rogerson, M. (2010). Linking Burglary and Target Hardening at the
Property Level: New Insights Into Victimization and Burglary Protection. Criminal Justice Policy Review, 21(3), 319-337. doi: 10.1177/0887403409356965
Hough, M. (1987). 'Offenders' Choice of Target: Findings from Victim Survey's. Journal of Quantitative
Criminology, 3(4), 355-369. Johnson, S., & Bowers, K. (2010). Permeability and Burglary Risk: Are Cul-de-Sacs Safer? Journal of
Quantitative Criminology, 26(1), 89-111. doi: 10.1007/s10940-009-9084-8 Junger, M. (1989). Discrepancies between police and self-report data for Dutch racial minorities. British
Journal of Criminology, 29(3), 273-284. Katz, J. (1988). Seductions of crime. New York: Basic Books. Kleemans, E. (2001). Repeat Burglary Victimization: Results of Empirical Research in the Netherlands.
Crime Prevention Studies, 12, 53-68. Krainz, K. W. (1988). Prävention von Hauseinbrüchen: Ergebnisse einer Täterbefragung: Universität Graz.
29
Lee, S. (2008). The impact of home burglar alarm systems on residential burglaries. Ph. D, The State
University of New Jersy, New Jersey. Macintyre, S. D. (2001). Burglar Decision Making. Griffith University, Queensland. Nauta, O. (2005). Liever geen inbrekers? Het Politiekeurmerk wérkt. Secondant, 1, 30-34. Nee, C., & Meenaghan, A. (2006). Expert Decision Making in Burglars. British Journal of Criminology,
http://www.politie.nl/twente/projecten/terugblikopveiligheidintwente2011.asp Poyner, B. (1993). What works in crime prevention: An overview of Evaluations. Crime Prevention
Studies, 1, 7-34. Rebscher, E. (1990). Crime Prevention In The Field of Burglary: Empirical Police Research in the Federal
Republic of Germany. Police Studies, 13(1), 10-13. Rengert, G., & Wasilchick, J. (1985). Suburban Burglary - A Time and a Place for Everything. Springfield,
IL: Charles C Thomas. Repetto, T. A. (1974). Residential Crime. Cambridge, MA: Ballinger Publishing Company. Shover, N. (1991). Burglary. Crime and Justice, 14, 73-113. Taylor, M., & Nee, C. (1988). The Role of Cues in Simulated Residential Burglary. The British Journal of
Criminology, 28(3), 396-403. Tilley, N., & Webb, J. (1994). Burglary Reduction: Findings From Safer Cities Schemes Crime Prevention
Unit (Vol. 51). London: Home Office. Tseloni, A., Wittebrood, K., Farrell, G., & Pease, K. (2004). Burglary Victimization in England and Wales,
the United States and the Netherlands. British Journal of Criminology, 44(1), 66-91. doi: 10.1093/bjc/44.1.66
Vermeulen, C., & Overbeeke, R. v. (1992). Inbraak in Nijmegen: een onderzoek naar inbraak in woningen
en in auto’s met behulp van processen-verbaal en daderinterviews. Amsterdam: DSP-groep. Vollaard, B. (2009a). The effect of built-in security on burglary. Evidence from a natural experiment.
Paper presented at the Workshop on Law and Economics, University of Paris Ouest, Nanterre, Paris.
Vollaard, B. (2009b). Het publieke belang bij private preventie. Politie & Wetenschap, 51. Vollaard, B. (2010). Diestal als nare verrassing-de gedragseconomie van diefstalpreventie. TPEdigitaal,
4(4), 49-60. Wright, R. T., & Decker, S. (1994). Burglars On The Job: Streetlife and Residential Break-ins. Saint Louis,
Missouri: Northwestern University Press. Wright, R. T., Logie, R. H., & Decker, S. (1995). Criminal Expertise and Offender Decision Making: An
Experimental Study of the Target Selection Process in Residential Burglary. Journal of Research in Crime and Delinquency, 32(1), 39-53.
31
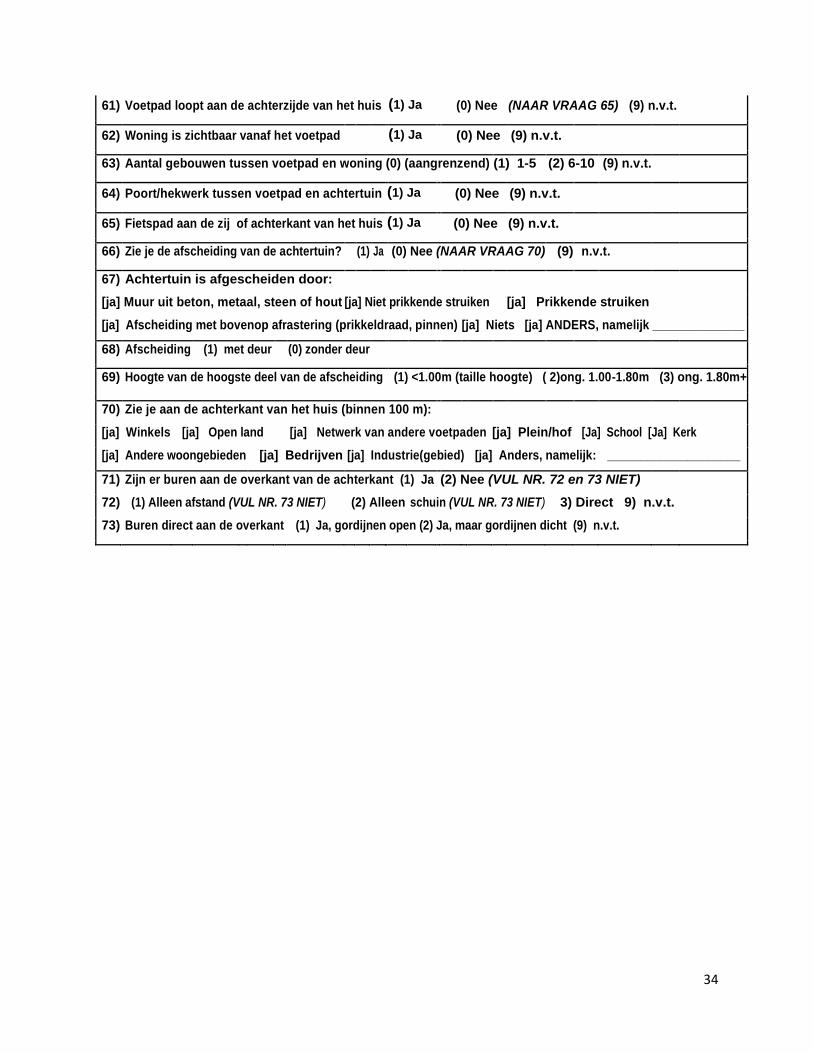
Appendix A
Checklist t.b.v. observaties – Februari - maart 2010
INVULLEN of CIRKEL BIJ VAN TOEPASSING
Adres: Dag: Tijd:
Waargenomen door bewoner (bv.opengaande gordijnen) (ja) (nee) (1)bewoner (2)Buurman/-vrouw/-kind
Bevraagd/geconfronteerd door bewoner (ja) (nee)
Woontype
1) Bouwjaar woning (schatting): (1) ouder dan 1930 (2) 1930 (3) 1950 -1960 (3) 1970-1980 (4) 1990 of later
2) Type woning
(1) 2 ond. 1 kap (2) Hoekwoning (eind van blok) (3) Vrijstaand (4) Tussenwoning (5) Flat (beneden woning)