Consumer expenditure remains the strongestcontributor to growth in New South Wales (see
Graph 1). Its current growth rate of 2.6% hasbeen stable for the last five quarters and the
sector accounts for 60.7% ($263 billion) ofGross State Product. Of this, $40 billion is abalance of payments deficit. New South Walesis largest contributor to the country’s balanceof payments deficit with 14% of nationalexports and 27% of national imports.
Non-dwelling construction is the second largestcontributor to GSP at 1.2%. Most of its growthcomes from the commercial infrastructure
sector, which has grown from 23.2% one year ago to 30.7% in the latest quarter. However, thesector reached a peak last quarter and will gradually ease from its present position.
Total dwelling construction only contributes 0.1% to GSP, however new dwelling constructioncontributed 0.3%. This was modified by -0.2% growth for additions and alterations. New dwellingconstruction grew by 16.0% in the latest quarter.
For the last 15 years, the state has had a
persistent and growing balance of paymentsdeficit (see Graph 2). Despite the significantdeficit, NSW exports grew by 7.9% in the latestquarter while imports slowed to 0.4%. The
deficit has been trimmed slightly in the last twoquarters with a slowing of imports from 8.0%growth one year ago to 0.4% growth in the
latest quarter.
The import share of GSP is slowly changing. Inthe last 12 months it has moved from 20.5% of
GSP to 20.0%.
On the other hand, exports share of GSP is still 10.6% and as evident in Graph 2, considerable
improvement is needed to restore a balance. The weakening position of the Australian dollar willhelp as we move forward.
The current unemployment position is providedin Graph 3. The unemployment rate was 5.4%
at June 2013, which is about 16.4% less thanit was at its peak following the GFC.Importantly, the rate is less than the nationalaverage of 5.7%, and it is relatively stable and
not growing to the same extent as in otherstates. In the NSW Government's 2013-14budget speech, delivered by the NSWTreasurer, the Honourable Mike Baird MP, said
“…New South Wales has registered thestrongest employment increase of any state inthe nation. We promised 100,000 new jobs in
our first term, but total employment hasincreased by 128,900 in just two years.” 1
NSW is fortunate in the sense that State Government policies have been relatively expansionary
in the recent past as they peruse a path of investing in much needed new infrastructure and
encourage increased activity in the new housing development.
The budget speech points to the following important points2:
Achieving a smaller deficit of $329 million in 2013/14 (previous forecast of $423 million),followed by a surplus of $829 million in 2014/15 (down from $1.3 billion forecast)
Newcastle Port to be leased for 99 years. The Port is expected to raise more than $700million, with $340 million to be spent on revitalising Newcastle, including light rail.
Payroll tax threshold to rise from $689,000 to $750,000 from July 1. NSW Government to spend $1.8 billion on WestConnex road project over four years,
funding the first stage itself to prove traffic usage before seeking private investment. $220 million to pay for an extra 69,000 emergency department visits and an extra 34,000
hospital admissions (including 3,000 extra operations). Stamp duty collection is at a record high of $4.39 billion. Stamp duty on residential
transfers in 2012-13 is expected to be 18.4% higher than last year, which suggests thegovernment is anticipating an increasing level of sales activity.
$300 million to be spent on new infrastructure to support the development of 43,000 new
homes in areas such as The Hills, Green Square, Blacktown and the Hunter Region. A total of $14.6 billion to be spent on public transport, roads and maritime services and
infrastructure, including $806 million for the North West Rail Link, $353 million for the
South West Rail Link and almost $1 billion for Pacific Highway upgrades. The $15,000 First Home Owner Grant to be extended by two years. $300 million to be spent on providing priority infrastructure to allow the release of new
land via the construction of Old Wallgrove Road, as well as supporting 11 critical projects
to accelerate the delivery of approximately 43,000 new housing lots.
In the section Important State Statistics for NSW various important indicators are presented. Youwill note that both housing commencements and housing approvals are in an upturn and arecurrently above the five year quarterly median. Population growth is also in an upturn, but thequarterly number is still below the five year quarterly median. This suggests that there is achance of some oversupply developing. However, in the last five years the provision of stock
failed to meet market requirements and there is currently around 3,000 dwellings in surplus onResidex calculations. This suggests the supply level needs to be monitored and populationgrowth numbers need to improve.
1 NSW Government. (2013). Budget Paper No. 1– New South Wales Budget Speech. Retrieved July 23, 2013, from
http://www.budget.nsw.gov.au/__data/assets/pdf_file/0019/25192/BP1_Budget_Speech.pdf 2 NSW Government. (2013). Budget Paper No. 1 – New South Wales Budget Speech. Retrieved July 23, 2013, fromhttp://www.budget.nsw.gov.au/__data/assets/pdf_file/0019/25192/BP1_Budget_Speech.pdf
SydneyIn the graph Sydney by Price Ranges in Dollarsover 12 months, it is very clear that theSydney housing market is generally improvingwith a clear trend to lower numbers of suburbs
falling in value.
In Graph 4, the capital growth trend forSydney is presented. The graph clearly showsthe trend is now very positive and is no longeradjusting. In fact, the growth rate for housesin the last 12 months was a very respectable
7.37%. This rate of growth is better than theaverage rate achieved over the last 20 years(6.82% per annum).
Graph 5 presents sales market activity since
the GFC. While sales are at last starting to pickup, activity remains relatively weak andcurrent growth and auction clearance rates are
more a function of stock levels being lowerthan demand. The real test in the market willcome after the election as we move into thespring selling season when a higher level of
available stock on the market is expected.
Overall, it is clear that the Sydney market hasentered a new growth phase, howeveraffordability is still poor and it will remain like
this even if we see a further interest ratereduction. The real telling point is the amount
of after tax cash a borrower has post mortgage repayments. In Sydney, it is only $835 per week(see Affordability – NSW ).
Given the above, Residex is of the view that the growth period we are entering will be relatively
small by comparison to what has been seen over the last few decades. However, it is anticipatedthat growth will be close to the average per annum growth achieved over the last 20 years.
Regional NSW
The fortunes of regional NSW are going to bedriven by gas resource projects and thegovernment’s infrastructure spend. While thereis clearly opposition to the development of thegas resource, Residex backs a positive
outcome as NSW is dependent on new gassupplies being delivered to meet demand. TheNewcastle and Central Coast areas are mostlikely to be the largest beneficiaries of these.
Like Sydney, Regional NSW has also entered anew growth period, however it is not as strong
Graph 7 presents the regional sales trend. Alsosimilar to Sydney, the trend is moving up.
Overall, the NSW market has a positiveoutlook compared to other states and shouldperform well as the economy is stimulated by
positive State Government action. Interestrates will increase in the medium term, whichwill occur following a period of house pricegrowth. This will further diminish affordabilityand put pressure on dollar weekly rentals. Theoutcome will be significantly better rentalyields and lower levels of risk for leveraged
This section displays a set of tables and graphs that are relevant to the housing market for thestate as a whole. They have been developed around the knowledge that the important issues for
prices and rental yields revolve around supply, take up of supply and demand being a result ofpopulation growth or retraction via immigration or natural increases.
Housing Approvals Trend Change
Last Quarter 10,003
Last Six Months 20,279
Last 12 Months 38,470
Median Quarterly Change last 5 Years 8,254
Current Difference to Quarterly Median 1,749
Commencements and Trends Trend Change
Last Quarter 9,897
Last Six Months 19,691
Last 12 Months 36,883
Median Quarterly Change last 5 Years 7,816
Current Difference to Quarterly Median 2,081
Population and Trends Trend Change
Last Quarter 22,238Last Six Months 45,968Last 12 Months 85,954
Median Quarterly Change last 5 Years 22,782Current Difference to Median -544
% Change due to ImmigrationLast Quarter 72.25%Last Six Months 71.98%Last 12 Months 71.53%
Median Quarterly Change last 5 Years 70.34%Current Difference to Quarterly Median 1.91%
Finance and Trends Trend Change
Last Month 2.20%
Last Three Months 7.06%
Last 12 Months 5.43%
Median Monthly Change Last Year 0.65%
Current Difference to Monthly Median 1.55%
Residex developed all information presented in this table from ABS publications.
The estimated new dwellings needed per annum measure is based on ABS data and assumes
household formation of 2.77 persons per household.
Residex is not certain and cannot be confident that the number of people required for household
formation is as quoted. Further, ABS numbers are unlikely to be complete. Having said this, thefinal estimate will provide a good guide to what the situation is.
If the Best Estimate Range is positive, it is likely that there is a state housing shortage, whichcauses house prices to increase and/or rentals to increase. A housing surplus, indicated by anegative figure for the Best Estimate Range, causes housing values to stagnate or adjust slightly.Changes also cause housing formation numbers to alter. That is, if rental and housing purchase
costs are generally unaffordable the population will have a tendency to increase the number ofpeople per property. The only time a reasonably clear indicator of the number of people likely to
be the basis of housing formation is at the Census date.
Due to the above, it is not wise to aggregate shortages/surpluses year on year. It is better tosimply identify or develop a broad understanding of what the current likely housing requirementis in the current year. A very positive number indicates that there are a significant number of
dwellings required, which would be taken up if they were available and affordable. This is saidbecause clearly, at any point in time, the population is basically housed but potentially not in afashion that they would prefer.
Affordability - NSW
Median Household Income: $103,872Median House Cost: $715,500Median Unit Cost: $501,500Assumed Deposit: 20%Assumed Interest Rate: 5.56% pa convertible monthlyRental Yield Houses: 4.27%Rental Yield Units: 5.25%
Loan repayment for house = 49.31% of A/T household income or after loan repaymentsborrower has $835 per week to spend on other things.
Rent for house = 35.56% of A/T household income or after rent tenant has $1,062 per week to
spend on other things.
Loan repayment for unit = 34.56% of A/T household income or after loan repayments borrowerhas $1,079 per week to spend on other things.
Rent for unit = 30.59% of A/T household income or after rent tenant has $1,144 per week tospend on other things.
Based on history it seems as if a comfortable commitment level for a household is something in
The median value of Sydney properties as at 30/06/2013 was $601,000 The overall rate of growth for the quarter ending 30/06/2013 for Sydney property was
2.88%
Sydney Houses
There were 40,852 house sales in Sydney duringthe last year.
Capital growth in the Sydney housing market over
the last year was 7.37% and the Sydney medianhouse value is now $715,500.
The Sydney house median rental yield is 4.27%and the median weekly rent is $585.
Current Quarter Future Predictions
Median Value: $715,500 Capital Growth: 3.13% 6%+ pa next 5 yrs
Number of sales: 12,060 Rental yield: 4.27% 7%+ pa next 8 yrs
Median rent: $585 Total return: 2.37%
Sydney Units
There were 37,500 unit sales in Sydney during the
last year. Capital growth in the Sydney unit market over the
last year was 2.29% and the Sydney median unitvalue is now $501,500.
The Sydney unit median rental yield is 5.25% andthe median weekly rent is $505.
Current Quarter Future Predictions
Median Value: $501,500 Capital Growth: 2.43% 4%+ pa next 5 yrs
Number of sales: 10,541 Rental yield: 5.25% 5%+ pa next 8 yrs
This section looks at various segments to identify where the activity is and if any sectors arefailing to maintain growth or are in an upswing. From this information it is possible for lenders
and investors to understand the areas at risk with respect to security values and the areas wherethere is some risk of failing.
Sydney by Price Ranges in Dollars
House Price Ranges Number ofSuburbs
Suburbs falling in Valuelast Quarter %
Suburbs falling in Valuelast Quarter by Number
From $273,000 to $484,500 144 9.72% 14
From $484,500 to $715,000 164 4.27% 7
From $715,000 to $1,035,500 185 15.14% 28
From $1,035,500 to $2,853,500 194 26.80% 52
Unit Price Ranges Number ofSuburbs
Suburbs falling in Valuelast Quarter %
Suburbs falling in Valuelast Quarter by Number
From $214,500 to $383,000 158 5.70% 9
From $383,000 to $501,500 132 8.33% 11
From $501,500 to $653,000 164 7.93% 13
From $653,000 to $1,503,500 137 16.79% 23
Sydney by Price Ranges in Dollars over 12 months
By looking at the change in the sectors over the last 12 months, it is possible to understand if asegment is moving into or out of trouble, or if it is simply stable.
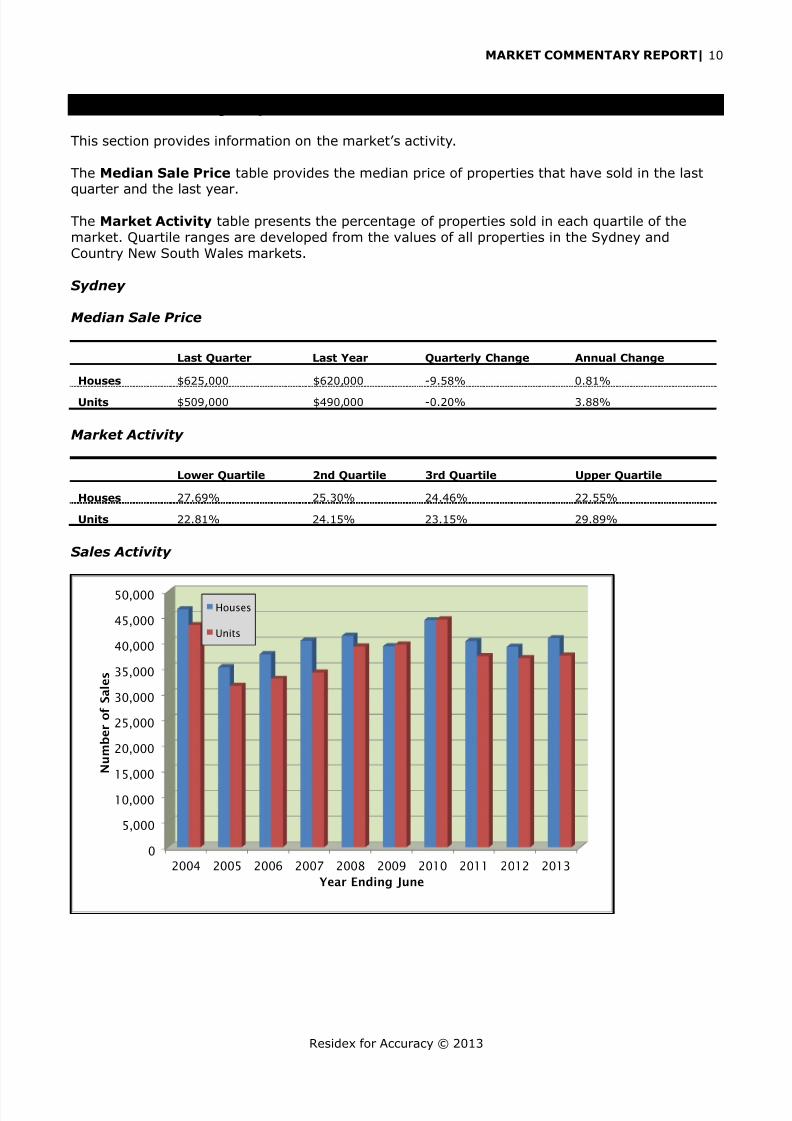
This section provides information on the market’s activity.
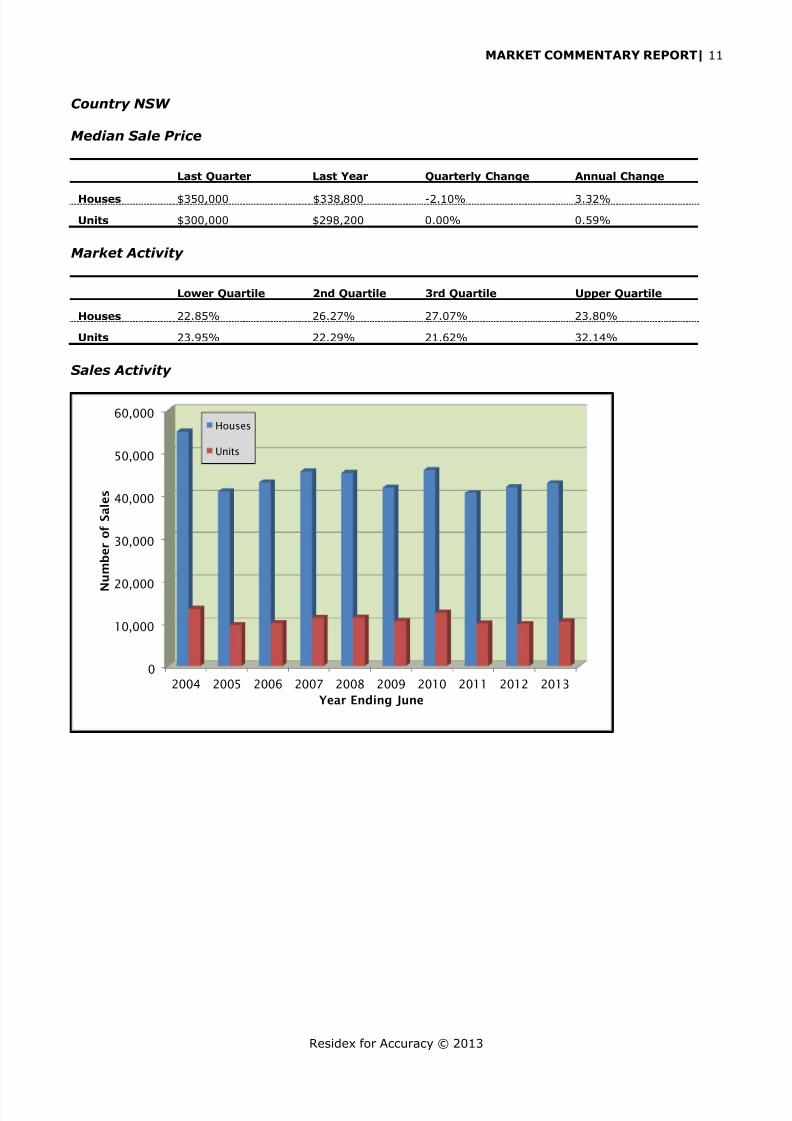
The Median Sale Price table provides the median price of properties that have sold in the lastquarter and the last year.
The Market Activity table presents the percentage of properties sold in each quartile of themarket. Quartile ranges are developed from the values of all properties in the Sydney andCountry New South Wales markets.
Sydney
Median Sale Price
Last Quarter Last Year Quarterly Change Annual Change
The Parties* making this report available to you give no warranty nor accept any liability for any
decision based wholly or in part on this report, such as any decision to invest in, to buy or not buyproperty described herein. The Parties believe the statements, information, calculations, data andgraphs contained herein to be correct and not misleading but give no warranty in relation theretoand expressly disclaim any liability for any loss or damage which may arise from any person actingor deciding not to act partly or wholly on the basis of any such statements, information,recommendations, calculations, data or graphs.
Residex is subject to Privacy Legislation, including the National Privacy Principles ("NPPs") underthe Privacy Act 1988 (Cth), The Privacy and Personal Information Protection Act (1988) andcontractual requirements relating to Privacy pursuant to a number of State and TerritoryGovernment Licence Agreements. Material published in this report is protected by the same laws of copyright which apply to books,
videos and music. The right to 'copy' always remains with the owner of the material. Unlessexpressly stated otherwise, you are not permitted to copy, republish or alter anything you find inthis report without the express permission of The Parties. By using this report you are have agreedto the terms above.
* “Parties” means Residex Pty Ltd, their customers and clients, and the customers and clientsrepresentatives.
Residex Pty Ltd is authorised as a Property Sales Information provider by the Department ofFinance and Services, Land and Property Information. The information provided in this reportcontains property sales information provided under licence from the Department of Finance andServices, Land and Property Information. Issue date: 2013-7-5


![Quarterly Results 30 Sep 14[1]](https://static.documents.pub/doc/80x56/563db920550346aa9a9a4131/quarterly-results-30-sep-141.jpg)

