178
Resilience Dividend Valuation Model Framework Development and Initial Case Studies Craig A. Bond, Aaron Strong, Nicholas Burger, Sarah Weilant, Uzaib Saya, Anita Chandra
www.rand.org
RR-2129-RF 9 7 8 0 8 3 3 0 9 8 9 6 2
ISBN-13 978-0-8330-9896-2ISBN-10 0-8330-9896-9
54550
$45.50
Policymakers, program practitioners, and investors who want to achieve the greatest possible benefits from the resilience projects that they support lack effective tools to estimate the net benefits of those projects. Existing approaches often do not provide a sufficient framework for estimating the benefits that might accrue from a project aimed at increasing resilience, especially if a shock or stress does not occur.
The RAND Corporation and the Rockefeller Foundation formed a partnership to develop a modeling framework that can be used to estimate the net benefits of a resilience project. We call the framework the Resilience Dividend Valuation Model (RDVM). We use the term resilience dividend to describe the net benefits associated with the absorption of shocks and stressors, the recovery path following a shock, and any co-benefits that accrue from a project, even in the absence of a shock. For any given project, the estimated dividend may be positive or negative.
This report describes how we developed the RDVM and offers a set of case studies to demonstrate how it can be applied across diverse settings. The RDVM is designed to provide a systematic, “structural” framework for assessing resilience interventions that ultimately create benefits and costs within a system, such as a community or city. While the model is not designed to be a one-size-fits-all tool, it does provide a way to systematically account for the returns to resilience investments across a range of contexts.
Resilience Dividend Valuation M
odelBond et al.
R
Resilience Dividend Valuation ModelFramework Development and Initial Case Studies
Craig A. Bond, Aaron Strong, Nicholas Burger, Sarah Weilant,
Uzaib Saya, Anita Chandra
Limited Print and Electronic Distribution Rights
This document and trademark(s) contained herein are protected by law. This representation of RAND intellectual property is provided for noncommercial use only. Unauthorized posting of this publication online is prohibited. Permission is given to duplicate this document for personal use only, as long as it is unaltered and complete. Permission is required from RAND to reproduce, or reuse in another form, any of its research documents for commercial use. For information on reprint and linking permissions, please visit www.rand.org/pubs/permissions.
The RAND Corporation is a research organization that develops solutions to public policy challenges to help make communities throughout the world safer and more secure, healthier and more prosperous. RAND is nonprofit, nonpartisan, and committed to the public interest.
RAND’s publications do not necessarily reflect the opinions of its research clients and sponsors.
Support RANDMake a tax-deductible charitable contribution at
www.rand.org/giving/contribute
www.rand.org
For more information on this publication, visit www.rand.org/t/RR2129
Library of Congress Cataloging-in-Publication Data is available for this publication.
ISBN: 978-0-8330-9896-2
Published by the RAND Corporation, Santa Monica, Calif.
© Copyright 2017 RAND Corporation
R® is a registered trademark.
Cover image: tranquocphongvn/Fotolia.

iii
Preface
Policymakers, program practitioners, and investors who want to achieve the greatest possible benefits from the resilience projects that they support lack effective tools to estimate the net benefits of those projects. In large part, however, quantification of the net benefits from increas-ing system resilience has largely relied on indices or scorecards, in which various indicators assumed to be correlated with resilience are measured and possibly aggregated. While useful if validated, these indices do not provide information about the value of resilience investments, which is needed if decisionmakers strive to made evidence-based choices consistent with maxi-mizing overall social welfare. To date, however, there has been little research into approaches to do so, perhaps due to the complexity of systems, the multitude of potential short- and long-term benefits that might arise from a resilience project or portfolio, and problems of measurability.
Motivated by a desire to provide more structure for thinking about the benefits and costs of projects developed with a resilience lens, the RAND Corporation and the Rockefeller Foun-dation formed a partnership to develop a modeling framework that can be used in a decision analysis environment. In particular, we sought to develop a model that could be used to evalu-ate resilience outcomes by quantifying the resilience dividend, defined herein as the difference in net benefits between outcomes resulting from a resilience project versus business as usual (e.g., no project at all). The resultant conceptual modeling framework is the Resilience Divi-dend Valuation Model (RDVM).
This report describes the RDVM and its application to six case studies selected jointly by RAND and the Rockefeller Foundation. It is intended for use by practitioners, analysts, and researchers to understand how to conceptualize particular systems and interventions in a struc-tural economic framework, and to use this information to plan data collection and modeling efforts that can be used to estimate parts of the resilience dividend.
This research complements much of the past and ongoing research in RAND’s Infrastructure Resilience and Environmental Policy program, including research on coastal resilience, emer-gency preparedness, infrastructure, and economic recovery. Interested readers are referred to http://www.rand.org/topics/community-resilience.html.
iv
RAND Infrastructure Resilience and Environmental Policy
The research reported here was conducted in the RAND Infrastructure Resilience and Environmental Policy program, which performs analyses on urbanization and other stresses. This includes research on infrastructure development; infrastructure financing; energy policy; urban planning and the role of public–private partnerships; transportation policy; climate response, mitigation, and adaptation; environmental sustainability; and water resource management and coastal protection. Program research is supported by government agencies, foundations, and the private sector.
This program is part of RAND Justice, Infrastructure, and Environment, a division of the RAND Corporation dedicated to improving policy and decision making in a wide range of policy domains, including civil and criminal justice, infrastructure protection and homeland security, transportation and energy policy, and environmental and natural resource policy.
Questions or comments about this report should be sent to the co-project leaders, Craig Bond ([email protected]) or Aaron Strong ([email protected]). For more information about RAND Infrastructure Resilience and Environmental Policy, see www.rand.org/jie/irep or contact the director at [email protected].
v
Table of Contents
Preface ............................................................................................................................................ iiiFigures ...........................................................................................................................................viiiTables ...............................................................................................................................................ixSummary .........................................................................................................................................xiAcknowledgments .......................................................................................................................... xvAbbreviations ...............................................................................................................................xvii
CHAPTER 1
Introduction .....................................................................................................................................1Background and Motivation of the Research Project .......................................................................1
The Resilience Dividend ...............................................................................................................2Using the Resilience Dividend......................................................................................................3
Objectives of this Report .................................................................................................................3Organization of this Report ............................................................................................................4
CHAPTER 2
A Review of Resilience Frameworks ................................................................................................5Foundations of Resilience ................................................................................................................5Components of Resilience ...............................................................................................................7Resilience Frameworks in the Literature ..........................................................................................8Summary ......................................................................................................................................19
CHAPTER 3
The Resilience Dividend Valuation Model (RDVM)....................................................................21Theory of Inclusive Wealth ............................................................................................................21Inclusive Wealth and the Concept of Resilience ............................................................................24Adapting the Theory to the Resilience Dividend ...........................................................................25Elements of the Resilience Dividend Valuation Model ..................................................................26
Capital Stocks ............................................................................................................................26Goods and Services ....................................................................................................................26Production Functions and the Allocation Mechanisms ..............................................................27Social Welfare Function .............................................................................................................29Shocks and Stressors ...................................................................................................................30Project Interventions ..................................................................................................................30
Types of Benefits in the Resilience Dividend .................................................................................33Direct Benefits ...........................................................................................................................33Co-Benefits ................................................................................................................................34Benefits Related to the Allocation Mechanism ...........................................................................35Costs of the Project ....................................................................................................................35
A Graphical Representation of the Framework ..............................................................................36Primary Challenges in Estimating the Resilience Dividend ...........................................................37
vi
CHAPTER 4
Case Studies using the RDVM ......................................................................................................39Oxfam Nepal ................................................................................................................................42
Executive Summary ...................................................................................................................42Oxfam-Nepal Intervention Background .....................................................................................45Applying the RDVM to Estimate the Potential Dividend for Oxfam’s Nepal Project .................46Aspects of the Resilience Dividend .............................................................................................49Empirical Methods .....................................................................................................................50Data ...........................................................................................................................................51Resilience Dividend Results .......................................................................................................53Lessons Learned .........................................................................................................................59
Oxfam Pakistan ............................................................................................................................60Executive Summary ...................................................................................................................61Oxfam-Pakistan Intervention Background .................................................................................62Applying the RDVM to Estimate the Potential Dividend for Oxfam’s Pakistan Project .............63Intervention and the System .......................................................................................................65Aspects of the Resilience Dividend .............................................................................................65Empirical Methods .....................................................................................................................66Data ...........................................................................................................................................67Results........................................................................................................................................69Conclusions and Lessons Learned ..............................................................................................75
Diamond Valley ............................................................................................................................76Executive Summary ...................................................................................................................77Diamond Valley Background .....................................................................................................80Applying the Resilience Dividend Model to Estimate the Potential Dividend for the
Diamond Valley ...................................................................................................................81Empirical Methods .....................................................................................................................85Results........................................................................................................................................87Resilience Dividend Summary ...................................................................................................91Lessons Learned .........................................................................................................................92Conclusions ................................................................................................................................95
Forest Bond ...................................................................................................................................96Executive Summary ...................................................................................................................96Forest Bond Intervention Background ........................................................................................98Applying the Resilience Dividend Valuation Model to Estimate the Potential Dividend for
Forest Resilience Bond .........................................................................................................99Aspects of the Resilience Dividend ...........................................................................................103Empirical Estimates .................................................................................................................104Conclusions and Lessons Learned ............................................................................................ 110
ISET Da Nang, Vietnam ............................................................................................................ 112Executive Summary ................................................................................................................. 112Background of the Case ........................................................................................................... 115Evidence of Resilience .............................................................................................................. 117Applying the RDVM to Estimate the Potential Dividend for Da Nang ................................... 118Data .........................................................................................................................................121Empirical Methods ...................................................................................................................122
vii
Results......................................................................................................................................126Lessons Learned .......................................................................................................................126Conclusions ..............................................................................................................................127
Asian Development Bank–Bangladesh ........................................................................................128Executive Summary .................................................................................................................128ADB–Bangladesh Intervention Background ............................................................................130Applying the Resilience Dividend Model to Establish a Dividend for
ADB’s Bangladesh Project ..................................................................................................130Aspects of the Resilience Dividend ...........................................................................................133Empirical Methods ...................................................................................................................134Data .........................................................................................................................................135Conclusions and Lessons Learned ............................................................................................137
CHAPTER 5
The Resilience Dividend Valuation Model: Lessons Learned and Next Steps ..........................139Lessons Learned about Quantifying the Dividend ......................................................................139Lessons Learned about the Role of Behavior ............................................................................... 141Lessons Learned about Data and Evidence ..................................................................................143Lessons Learned about Model Limitations .................................................................................. 145Conclusions and Further Research ..............................................................................................146
Appendix A. Characteristics of Resilient Systems and the Allocation Mechanism ..................149Appendix B. Key Definitions Used in this Report ..................................................................... 151References ..................................................................................................................................... 153
viii
Figures
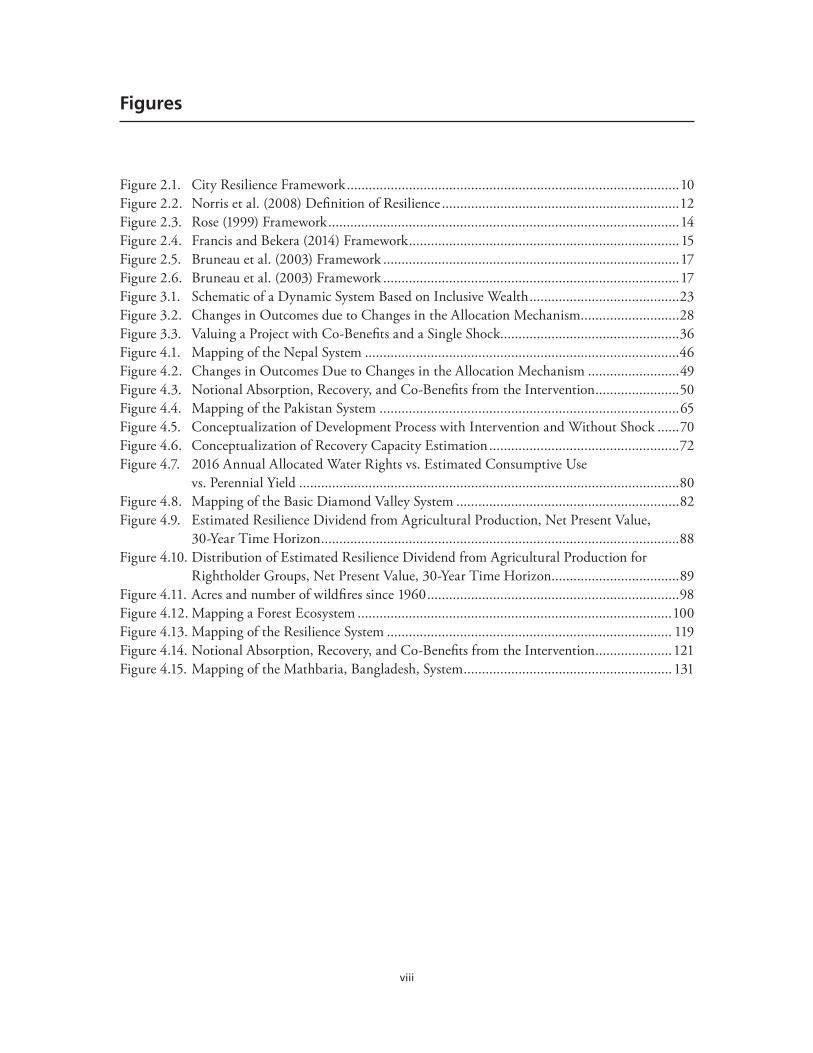
Figure 2.1. City Resilience Framework ...........................................................................................10Figure 2.2. Norris et al. (2008) Definition of Resilience .................................................................12Figure 2.3. Rose (1999) Framework ................................................................................................14Figure 2.4. Francis and Bekera (2014) Framework ..........................................................................15Figure 2.5. Bruneau et al. (2003) Framework .................................................................................17Figure 2.6. Bruneau et al. (2003) Framework .................................................................................17Figure 3.1. Schematic of a Dynamic System Based on Inclusive Wealth .........................................23Figure 3.2. Changes in Outcomes due to Changes in the Allocation Mechanism...........................28Figure 3.3. Valuing a Project with Co-Benefits and a Single Shock.................................................36Figure 4.1. Mapping of the Nepal System ......................................................................................46Figure 4.2. Changes in Outcomes Due to Changes in the Allocation Mechanism .........................49Figure 4.3. Notional Absorption, Recovery, and Co-Benefits from the Intervention .......................50Figure 4.4. Mapping of the Pakistan System ..................................................................................65Figure 4.5. Conceptualization of Development Process with Intervention and Without Shock ......70Figure 4.6. Conceptualization of Recovery Capacity Estimation ....................................................72Figure 4.7. 2016 Annual Allocated Water Rights vs. Estimated Consumptive Use
vs. Perennial Yield ........................................................................................................80Figure 4.8. Mapping of the Basic Diamond Valley System .............................................................82Figure 4.9. Estimated Resilience Dividend from Agricultural Production, Net Present Value,
30-Year Time Horizon ..................................................................................................88Figure 4.10. Distribution of Estimated Resilience Dividend from Agricultural Production for
Rightholder Groups, Net Present Value, 30-Year Time Horizon...................................89Figure 4.11. Acres and number of wildfires since 1960 .....................................................................98Figure 4.12. Mapping a Forest Ecosystem ......................................................................................100Figure 4.13. Mapping of the Resilience System .............................................................................. 119Figure 4.14. Notional Absorption, Recovery, and Co-Benefits from the Intervention .....................121Figure 4.15. Mapping of the Mathbaria, Bangladesh, System .........................................................131
ix
Tables
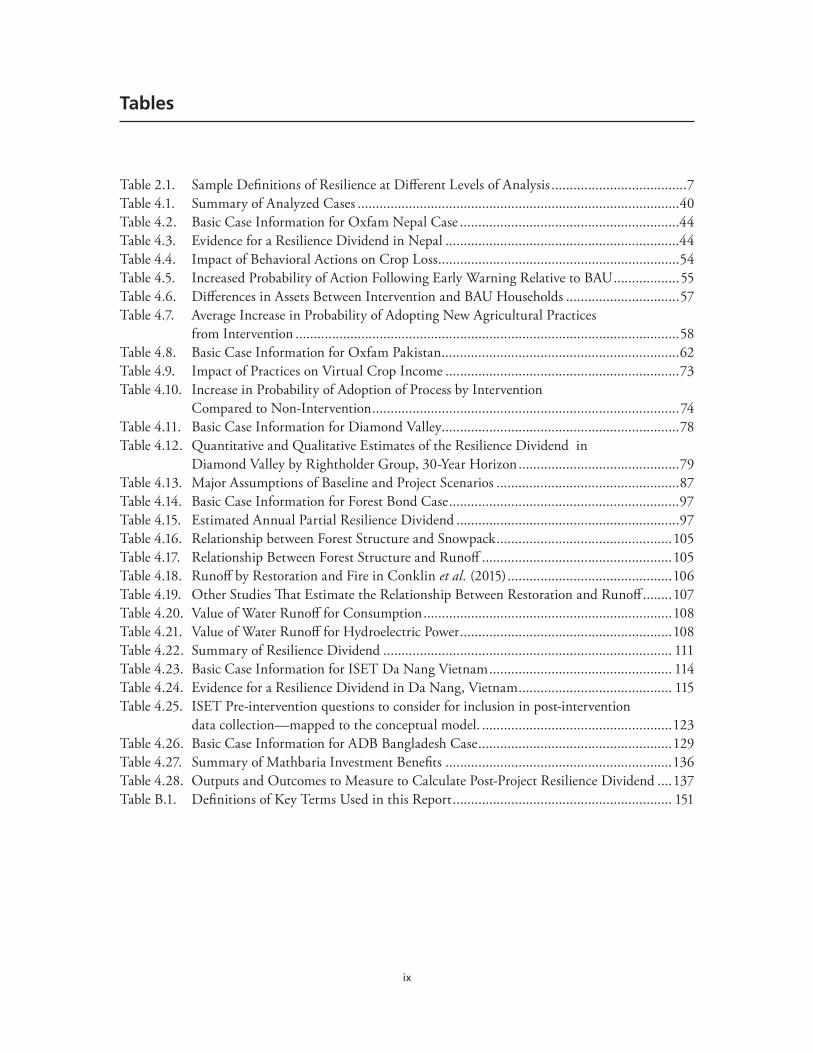
Table 2.1. Sample Definitions of Resilience at Different Levels of Analysis .....................................7Table 4.1. Summary of Analyzed Cases ........................................................................................40Table 4.2. Basic Case Information for Oxfam Nepal Case ............................................................44Table 4.3. Evidence for a Resilience Dividend in Nepal ................................................................44Table 4.4. Impact of Behavioral Actions on Crop Loss ..................................................................54Table 4.5. Increased Probability of Action Following Early Warning Relative to BAU ..................55Table 4.6. Differences in Assets Between Intervention and BAU Households ...............................57Table 4.7. Average Increase in Probability of Adopting New Agricultural Practices
from Intervention .........................................................................................................58Table 4.8. Basic Case Information for Oxfam Pakistan .................................................................62Table 4.9. Impact of Practices on Virtual Crop Income ................................................................73Table 4.10. Increase in Probability of Adoption of Process by Intervention
Compared to Non-Intervention ....................................................................................74Table 4.11. Basic Case Information for Diamond Valley .................................................................78Table 4.12. Quantitative and Qualitative Estimates of the Resilience Dividend in
Diamond Valley by Rightholder Group, 30-Year Horizon ............................................79Table 4.13. Major Assumptions of Baseline and Project Scenarios ..................................................87Table 4.14. Basic Case Information for Forest Bond Case ...............................................................97Table 4.15. Estimated Annual Partial Resilience Dividend .............................................................97Table 4.16. Relationship between Forest Structure and Snowpack ................................................105Table 4.17. Relationship Between Forest Structure and Runoff ....................................................105Table 4.18. Runoff by Restoration and Fire in Conklin et al. (2015) .............................................106Table 4.19. Other Studies That Estimate the Relationship Between Restoration and Runoff ........107Table 4.20. Value of Water Runoff for Consumption ....................................................................108Table 4.21. Value of Water Runoff for Hydroelectric Power ..........................................................108Table 4.22. Summary of Resilience Dividend ............................................................................... 111Table 4.23. Basic Case Information for ISET Da Nang Vietnam .................................................. 114Table 4.24. Evidence for a Resilience Dividend in Da Nang, Vietnam .......................................... 115Table 4.25. ISET Pre-intervention questions to consider for inclusion in post-intervention
data collection—mapped to the conceptual model. ....................................................123Table 4.26. Basic Case Information for ADB Bangladesh Case .....................................................129Table 4.27. Summary of Mathbaria Investment Benefits ..............................................................136Table 4.28. Outputs and Outcomes to Measure to Calculate Post-Project Resilience Dividend ....137Table B.1. Definitions of Key Terms Used in this Report ............................................................ 151


xi
Summary
Policymakers, program practitioners, and investors who want to achieve the greatest possible benefits from the resilience projects that they support lack effective tools to estimate the net benefits of those projects. Current approaches tend to focus on resilience indices or scorecards, which often compile indicators that are assumed to reflect the ability of a community (or, more broadly, a “system”) to absorb or recover from a shock or stressor. While useful if validated, this approach does not provide a framework for valuing the net benefits of a purposeful interven-tion—or any benefits that might accrue from a project aimed at increasing resilience even if a shock does not occur.
The RAND Corporation and the Rockefeller Foundation formed a partnership to develop a modeling framework that can be used to estimate the net benefits, whether positive or nega-tive, of a resilience project. We call the framework the Resilience Dividend Valuation Model (RDVM), and use the term resilience dividend to describe the net benefits. The resilience divi-dend includes net benefits associated with the absorption of shocks and stressors, the recovery path following a shock, and any co-benefits that accrue from a project even in the absence of a shock. For any given project, the estimated dividend may be positive or negative.
The RDVM described in this report is designed to provide a systematic, “structural” frame-work for assessing resilience interventions that ultimately create benefits and costs within a system such as a community or city. The model is a means to systemically account for the returns to resilience investments across a variety of contexts.
About the Resilience Dividend Valuation Model
The RDVM is a modeling framework designed to help analysts and practitioners estimate the realized or potential resilience dividend from a project. The RDVM combines elements of proj-ect evaluation and economic valuation, and can be used to guide thinking about the probable outcomes of resilience investments and how valuable these outcomes might be to stakeholders that operate within the system. The objective of building and applying this model is to estab-lish a theoretical and empirical basis for estimating the resilience dividend over a range of proj-ects, settings, and scales. The RDVM will be most useful in settings where there is an existing or potential resilience investment within a complex system and for which data exist or can be collected for critical components of that system. The approach is also relevant even if data do not exist or cannot be collected, since it can help stakeholders structure their thinking about how the investment will or will not contribute to resilience.
The RDVM is based on the theory of inclusive wealth, which represents the (net present) value of a system derived from the contributions of capital assets to society’s well-being. The RDVM takes advantage of this underlying intuition and conceptual structure, which assume that capi-tal stocks (human labor or man-made capital) combine with technology (methods and tools) to produce flows of goods and services. The consumption of goods and services contributes to society’s well-being by creating income for producers, satisfying consumer demand, and
xii
improving quality of life, among other benefits. The theory also takes into account (through what is called an allocation mechanism) how humans respond to changes in capital stocks or the broader system.
The RDVM applies these concepts to create a framework for valuing and monetizing the impacts of a resilience project (or potential resilience project) compared to a business as usual (BAU)scenario in which the project does not take place.1 The difference between the two is the resilience dividend.
This structure can be used to illustrate the causal relationships among key system elements like capital stocks, the goods and services that they are used to produce, and the behavior of actors within the system. This mapping of relationships can be used to generate hypotheses about system relationships that, given the right data, might be tested for any given project, or used to create simulation models that can represent the system going forward into the future.
The RDVM is a flexible approach that helps users think about interventions in a structured, systems-focused way, and it guides users in how to use data to provide evidence of the divi-dend. In real-world settings with limited data, the RDVM may only be useful in quantifying a partial resilience dividend, especially when some goods and services that are affected by a proj-ect cannot be measured, the relationships between capital stocks may not be well understood, or people’s response to the project may be uncertain. Furthermore, if a project is expected to create benefits or costs that persist into the future, a full accounting of the dividend may not be possible. In general, however, the better a system can be characterized and measured, the more fully can the resilience dividend be estimated.
Model Advantages and Disadvantages
The broad advantages of RDVM over other models include
• an explicit link to project-related resilience benefits
• a focus on identifying and measuring changed behaviors
• the guidance it provides in terms of modeling, data collection, and estimation.
However, the RDVM also has some limitations:
• The approach is more complex than more traditional evaluation and monitoring approaches.
• The data needed to quantify the resilience dividend are extensive.
• Some stakeholders may be uncomfortable with the underlying assumptions of the model.
The primary reason for the complexity of the model is that resilience is an inherent property of complex systems that evolve over time. This introduces the need to evaluate outcomes over time and to measure or model changes in behavior that contribute to those outcomes. The RDVM thus provides an organizational structure to think about the likely logical chain from intervention to outcomes over time. As with all models, practitioners may opt to trade off model complexity with comprehensiveness, and estimate a partial resilience dividend.
1 In this sense, the RDVM is similar to formal project evaluation.

xiii
Application of the RDVM to Resilience Case Studies
Over the course of the six-month project in which the model was developed, RAND applied the model to various case studies in Bangladesh, Nepal, Pakistan, Vietnam, and the United States, using pre-existing data, project designs, and models not necessarily designed for use with the RDVM. These cases were selected jointly with the sponsor and an advisory committee to span the Rockefeller Foundation’s diverse resilience portfolio, and not necessarily because the project and/or available data were ideally suited for the RDVM. Through the course of this exercise, we learned a number of lessons about the use of the model over a variety of archetypes, the data structures that can best suit quantification of the dividend, the importance of behavior in generating a resilience dividend, and the limitations of the model. While we believe that the inclusive wealth conceptualization of systems for evaluating resilience projects is a promising way forward, the need to generate and use extensive quantities of data in complex ways does provide some barriers to adoption.
As might be expected from the development of a new approach to tackle a complex problem, our results are mixed. We maintain that the theoretical underpinnings of the RDVM (and in particular, the relationships inherent in an inclusive wealth modeling approach) are valuable in clearly and explicitly representing the expected causal pathways from project intervention to changes in social welfare, but we are aware of the significant empirical challenges (not the least of which is data intensity) in applying the model.
Future Research
Looking forward, there is considerable opportunity for more research into the quantification of the resilience dividend. A key first step stemming directly from one of our lessons learned is to jointly design the data collection mechanism and RDVM for a number of well-funded archetypal cases at the outset of a project or program to begin to build more intuition about the art of the possible in resilience evaluation (and the tradeoffs in terms of costs). Building on this work with subsequent cases and projects can help to create a portfolio of evidence about the resilience dividend, and to develop best practices for empirical strategies, simulation mod-eling, and data collection.
Of particular interest is research into understanding and quantifying the behavioral implica-tions of changing institutions, social norms, and social relations (social capital), and how these elements relate to the resilience dividend both individually and together. This is no small task and will require multi-disciplinary investigations into any number of cases, as well as creative empirical and data collection strategies.
Cataloguing this information in an easily accessible, public manner is also needed. The envi-ronmental and ecosystem service communities have done this with regard to environmental non-market values, providing opportunities for researchers and practitioners to share informa-tion, use a methodological technique known as benefit transfer, and perform meta-analysis over multiple studies to gain insight into differences in values across contexts. Because every system is different, research into this aspect of variation in the resilience dividend could be quite useful to both researchers and practitioners.

xiv
The case studies used to this point have focused on specific projects. Moving away from proj-ects and toward portfolio design will allow for better understanding of the complementar-ity and substitutability of different projects. Additionally, knowing the winners and losers of specific projects will allow for the construction of portfolios that can, potentially, make all stakeholders winners with the appropriate choices of projects with portfolios. The budget constraints that arise in portfolio analysis provide additional limitations that this approach is designed to handle.
Organization of this Report
This report compiles the results of several outputs prepared at the request of the Rockefeller Foundation; namely, a review of pre-existing resilience frameworks in the literature, a descrip-tion of how the RDVM and the inclusive wealth framework can be used to characterize sys-tems, resilience interventions, and, ultimately, the resilience dividend, and several case studies that were used to illustrate various aspects of the approach. In this report, we have generally compiled each of these outputs as a separate chapter.
Chapter 2 provides some background information on the definitions and foundations of resil-ience, and reviews various resilience frameworks. Chapter 3 presents the RDVM, including a brief discussion of the theory or inclusive wealth and the elements of the model. Chapter 4 reports the results of the case studies analyzed as part of the research project. For each case, we applied the principles of the RDVM and attempted to quantify as many of the elements of the resilience dividend as possible given the data and project documentation available. Chapter 5 reports the overall lessons learned about the RDVM from the case studies and our experience over the course of the project and conclusions. For the convenience of the reader, a discussion of the characteristics of resilient systems and how they relate to the allocation mechanisms in the RDVM is presented in Appendix A, and a list of key definitions used in the report is pre-sented in Appendix B.
xv
Acknowledgments
We thank Dr. Judith Rodin and Dr. Zia Khan of the Rockefeller Foundation for their overall support of the project. Sundaa Bridgett-Jones and Carol Tan of the Rockefeller Foundation were instrumental in providing day-to-day support and feedback on the research. We would also like to thank the other Rockefeller Foundation personnel who met with us and provided critical information on their projects and activities, including Alex Martinez, Fred Boltz, and Adam Connaker. Leah Hershey at RAND provided invaluable administrative support.
Our advisory panel, consisting of Claire Hutchings (Oxfam Great Britain), Dr. Edward Barbier (University of Wyoming), Colin McQuistan (Practical Action), and Dr. Pankaj Lal (Mont-clair State University), provided excellent guidance and research over the course of the project, including formal comments on our written products.
We would also like to thank the Rockefeller Foundation project partners at Oxfam, the Asian Cities Climate Change Resilience Network (ACCCRN), ISET (Vietnam), Sierra Nevada Adaptive Management Project, and Blue Forest Conservation. In particular, Phong Tran at ISET; Simone Lombardini and Rob Fuller at Oxfam; Nick Wobbrock at Blue Forest Con-servation; Sasank Vemuri and Elma Morsheda at the Asian Development Bank; Phil Saksa at Sierra Nevada Adaptive Management Project; Michael Young at the University of Ade-laide and Nicholas Institute for Environmental Policy Solutions at Duke University; and Greg Characklis at the University of North Carolina and Chapel Hill provided information and data that were critical to the research.
Our peer reviewer, Dr. Radha Iyengar, provided helpful comments on the manuscript that greatly improved its clarity.
All errors remain those of the authors.

xvii
Abbreviations
ADB Asian Development Bank
ATT average treatment effect on the treated
BAU business as usual
BCA benefit cost analysis
BEEJ Balochistan Environmental and Educational Journey
CMA critical management area
GMP groundwater management plan
ISET Institute for Social and Environmental Transition-Vietnam
NGO non-governmental organization
NSE Nevada State Engineer
RDVM Resilience Dividend Valuation Model
SAFWCO Sindh Agricultural and Forestry Workers Coordinating Organisation
SPLATS Strategically Placed Landscape Treatments
USFS United States Forest Service
WUI wildlife urban interface

1
CHAPTER 1
Introduction
Communities, cities, states, and countries around the world are often faced with complex decisions about how to mitigate risk and be more resilient in their responses to large political, economic, and environmental events or stressors. Determining how best to respond to adverse events is complex and multifaceted; this complexity can result in ineffective or suboptimal responses that do not maximize the community’s overall well-being. With such high stakes, decisionmakers and practitioners could benefit from decision-support tools that help them compare alternative courses of action.
In general, effective tools to estimate the net benefits of resilience projects are lacking for policymakers, program practitioners, and investors who want to achieve the greatest possible benefits from the projects that they support. Current approaches tend to focus on resilience indices or scorecards, which often compile indicators that are assumed to reflect the ability of a community (or, more broadly, a “system”) to absorb or recover from a shock or stressor. While useful if validated, this approach to shocks does not provide a framework for valuing the net benefits of a purposeful intervention—or any benefits that might accrue from a project aimed at increasing resilience even if a shock does not occur. In addition, many of the scorecards and indices assume that the resilience of subsets of a larger system implies resilience of the whole system, which may not necessarily be the case.
Developed to help overcome these issues, the Resilience Dividend Valuation Model (RDVM) documented in this report is a modeling framework designed to help analysts and practitioners estimate the realized or potential resilience dividend from a project. Based on inclusive wealth theory, the RDVM is a dynamic, systems-based approach that maps changes in the flow of goods and services from a resilience project into changes in well-being, and provides guidance on the data needed to estimate the resilience dividend. The model provides the theoretical and empirical basis for estimating the resilience dividend over a range of projects, settings, and scales. RDVM combines elements of project evaluation and economic valuation, and can be used to guide thinking about the probable outcomes of resilience investments and how valu-able these outcomes might be to the system’s stakeholders.
Background and Motivation of the Research Project
The academic literature has largely viewed the concept of resilience as the study of “how com-plex systems self-organize and change over time.”1 Carpenter and Brock2—intellectual leaders in defining and analyzing the term—succinctly summarize resilience as a “broad, multifac-eted, and loosely organized cluster of concepts, each one related to some aspect of the interplay of transformation and persistence.” Despite these rather broad notions, most authors appear to recognize resilience as the capacity to withstand and recover from shocks and stressors.
1 Anderies, J., Folke, C., Walker, B., and Ostrom, E. (2013). “Aligning key concepts for global change policy: Robustness, resilience, and sustainability.” Ecology and Society, 18(2), 8.
2 Carpenter, S. and Brock, W. (2008). “Adaptive capacity and traps.” Ecology and Society, 13(2).
2
As such, our working definition of resilience is the capacity of a system—a household, a com-munity, an organization, or a coupled natural-human system—to prepare for disruptions from outside the system, to recover from shocks and stresses, and to adapt to and grow from a disruptive experience. A resilience project is defined as an intervention that, at least in part, targets improving the ability to manage, respond to, or recover from a shock or stress outside of a system that would likely decrease well-being, and that has the potential to produce other benefits not directly related to the shock or stressor. This latter concept—often termed the “co-benefits” associated with the resilience project—is a key part of what distinguishes a resil-ience project from an intervention that focuses solely on disaster risk reduction outcomes. In particular, what might be termed a resilience lens is a view that approaches project development and investment strategies in a way that takes into account the system’s properties and addresses both the risk of loss from an outside shock or stressor and any co-benefits the project or invest-ment produces.
However, as noted by Anderies, et al.:
The resilience lens is useful for making suggestions about broad categories of investment such as in the capacity to learn, adapt, and transform without being too specific about what this actually means in practice, i.e., how much it costs, who pays, who benefits, etc. Thus, although resilience thinking provides heuristics for living in a complex world, its system-level nature limits its utility in concrete decision analysis, at least in its current state of development.3
Motivated by a desire to provide more structure for thinking about and characterizing the benefits and costs of projects developed with a resilience lens, RAND and the Rockefeller Foundation formed a partnership to develop a modeling framework that can help support decisionmaking.
The Resilience Dividend
We sought to develop a model that could be used to evaluate resilience outcomes by quantify-ing the resilience dividend: the difference in outcomes resulting from a resilience project com-pared to what those outcomes would have been without the resilience project, a counterfactual that we call the business as usual (BAU) scenario (Rodin, 2014).4 Outcomes are typically related to the ability of “people to better withstand disruption in the future, to improve current situations, and/or to positively change the trajectory of a place and/or people’s lives.”5 In other words, the resilience dividend can be defined as the difference in the stream of net benefits between a world in which resilience projects are implemented and a counterfactual setting. This counterfactual, which can be defined as either a no-project case or an alternative project that is not developed with a resilience lens, provides the baseline against which the project-level benefits are compared.
3 Anderies, J., et al. (2013). “Aligning key concepts for global change policy: Robustness, resilience, and sustainability.” Ecology and Society, 18(2), 8.
4 Rodin, J. (2014). The resilience dividend: Being strong in a world where things go wrong. New York: PublicAffairs.5 This language was taken from documents provided to the RAND research team by the Rockefeller Foundation.

3
It is important to understand that the resilience dividend is not necessarily restricted to benefits/costs related to recovering from a particular shock or withstanding a stressor. Rather, we take a broader interpretation of the dividend that is more inclusive: the total net expected benefits of a project or portfolio designed with a resilience lens over time, relative to a chosen baseline. This allows for the possibility that projects developed with a resilience lens could have “co-benefits” (or, in some cases, costs) that accrue even in the absence of an adverse event. As such, the resil-ience dividend is not equivalent to the value of increased resilience of the system, though it theoretically includes these potential net benefits.
Valuing the resilience dividend requires that we understand how resilience policy and program interventions change the valuable elements of any given system over time. Projects can change these elements directly or indirectly by providing resources, relaxing constraints, or increasing opportunities to stakeholders. Stakeholders’ reactions to these changed elements may alter the flow of goods and services (both market and non-market) as a result of the intervention. It is this changed flow that creates value for stakeholders and that should be monetized in order to estimate the resilience dividend. As such, estimating the (experienced or expected) net benefits that a project provides requires evaluating its impacts.6
Using the Resilience Dividend
From an economic standpoint, good decisionmaking requires prioritizing feasible projects with the greatest total net benefits. Failure to fully take positive resilience dividend benefits into account will underestimate the total value of a project, perhaps leading to suboptimal decisions since the true value of the project will not be accurately estimated. In particular, a decision needs to consider co-benefits and changes to structural dynamics to reflect the full range of benefits and costs. For example, changing land use planning compared with building a levee may have the same reductions in the risk of damage from floods but have very different benefits and costs. Failure to take into account the non-flood-related benefits such as ecosystem ser-vices (e.g., better water quality, recreation) that arise from land use planning may bias the deci-sion toward levees. Even if the full resilience dividend cannot be explicitly valued (due to, e.g., data limitations), qualitative information about different streams of benefits and costs might be useful in describing project outcomes and choosing between competing courses of action.
Objectives of this Report
The RDVM is based on the theory of inclusive wealth and sits within the broader literature on resilience frameworks and metrics. This report sets the context for the RDVM, explains how we developed the approach, and provides a set of case studies that offer insight into the oppor-tunities and challenges of using the RDVM to estimate the resilience dividend. It provides detailed, technical background information, documents the inclusive wealth framework, and deconstructs the components of the RDVM that flow out of the framework. It is intended for researchers and other individuals and organizations interested in the details of measuring and valuing resilience and the resilience dividend.
6 As noted later in this report, estimates of the resilience dividend can be calculated either before (ex ante) or after (ex post) they are implemented.

4
This report is not designed to be a users’ guide for the RDVM. We have produced a separate guidethat focuses on when and how to estimate a partial resilience dividend. This guide is designed for staffers and management interested in using an RDVM to generate information that could be used to inform recommendations to senior decisionmakers.
Organization of this Report
This report has four major components, organized into chapters. Chapter 2 provides back-ground information on definitions and foundations of resilience and reviews various resilience frameworks.
Chapter 3 formally describes the theory of inclusive wealth and shows how this modeling approach can be used to estimate the resilience dividend. This chapter outlines the elements of the RDVM and documents the major types of benefits and costs in the resilience dividend. It concludes with a brief summary of challenges to estimating the resilience dividend.
Chapter 4 reports the results of the case studies analyzed as part of the research project. The cases explore the model’s application across a wide range of projects, and they help us under-stand the usefulness of the theoretical and empirical approach embodied in the RDVM.
Chapter 5 concludes the report with lessons learned and some implications for future work.
For the convenience of the reader, a discussion of the characteristics of resilient systems and how they relate to the allocation mechanisms in the RDVM is presented in Appendix A, and a list of key definitions used in the report is presented in Appendix B.
5
CHAPTER 2
A Review of Resilience Frameworks
The concept of resiliency is gaining ground in hazards and risk communities that want to move away from traditional assessments of risk and vulnerability. While the frameworks and analytic methods for traditional risk assessment are fairly mature, this is not necessarily the case for resiliency. As a recent National Academies report on the topic states: “no systematic or evidence-based assessment has been conducted to identify which strategies are most effective in fostering local collaborations to build community resilience.”1 One of the main obstacles is the lack of an agreed upon definition of resilience and a common framework for assessing it. This chapter reviews some of those definitions, describes major components of the resilience concept, and discusses past resilience frameworks that appear in the literature.
Foundations of Resilience
Resilience has its foundations in materials science, mathematics and physics, with the focus primarily on equilibrium analysis.2 Two main considerations within this realm are the magni-tude of a stressor, as measured by the movement of the system from one equilibrium state to another, and the length of time it takes for the system to rebalance once the stressor has been removed. C.S. Holling3 was the first to transfer these ideas from the physical sciences to the bio-logical sciences. Holling’s distinction from the physical sciences is that there is a clear difference between resilience and stability. For example, although an ecological system may fluctuate or have cycles and not be stable, it may be resilient to outside stressors. Holling’s view suggests that the main concern of resilience is on how large a stress the system can take and still maintain its integrity, as opposed to movement to new equilibrium point. Since this is not an equilibrium analysis and cycles may exist within the system, there is less focus on time than on magnitude.
Norris et al.4 provide a broad overview of resilience definitions that have transitioned from the physical and biological sciences to the social sciences, and Alexander provides an etymologi-cal analysis of resilience.5 Table 2.1, taken from Norris et al.,6 lists definitions from a variety
1 National Academies of Science, Engineering and Medicine (2012). Disaster resilience: A national imperative. Washington D.C.: The National Academies Press.
2 Bodin, P., and Wiman, B. (2004). “Resilience and other stability concepts in ecology: Notes on their origin, validity, and usefulness.” ESS bulletin, 2(2), 33-43.
3 Holling, C. S. (1973). “Resilience and stability of ecological systems.” Annual Review of Ecology and Systematics, 1-23.4 Norris, F. H., Stevens, S. P., Pfefferbaum, B., Wyche, K. F., and Pfefferbaum, R. L. (2008). “Community resilience as
a metaphor, theory, set of capacities, and strategy for disaster readiness.” American Journal of Community Psychology, 41(1-2), 127-150.
5 Alexander, D. E. (2013). “Resilience and disaster risk reduction: Aan etymological journey.” Natural Hazards and Earth System Science, 13(11), 2707-2716.
6 Norris, F. H., et al. (2008). “Community resilience as a metaphor, theory, set of capacities, and strategy for disaster readiness.” American Journal of Community Psychology, 41(1-2), 127-150.

6
of disciplines and perspectives. The main commonalities among all of the community-level definitions of resilience are threefold.
• Absorption capacity: How large a disaster/stress can a community absorb/resist and still function in the pre-event mindset? Some authors have described this as resistance or absorption capacity.
• Adaptive capacity: How adaptive is the system to stresses while still maintaining function? This can be viewed as the redundancies within the system that enable the system to con-tinue to function (although potentially at a reduced capacity), what has been called the adaptive capacity.
• Restorative capacity: How restorative is the system once productive capacity has been reduced? Specifically, how quickly can the system get back to “normal” functioning—understanding that “normal” may look different after the event than before it—labeled restorative capacity. These ideas are laid out implicitly in Francis and Bekera7 and explicitly in Rose.8
The ideas underlying the study of resilience are linked to other efforts that emphasize vulner-ability and adaptive capacity. All these ideas are linked by a common goal of reducing the risk to a community from external forces.9 As Miller et al., and other authors have noted, resilience and vulnerability should be viewed as complementing each other rather than being at odds.10 The main distinguishing characteristic between these two views is that vulnerability appears to focus on the system whereas resilience focuses on the actors within the system. Cutter et al. note that the shift from vulnerability to resilience among federal agencies may be thought of as a move toward a “more proactive and positive expression of community engagement with natural hazards reduction.”11 Beatley also distinguishes resilience from mitigation in that resil-ience focuses on increasing adaptation and learning as well as building underlying capacity to deal with future stressors, as opposed to mitigation and recovery after the fact.12
7 Francis, R., and Bekera, B. (2014). “A metric and frameworks for resilience analysis of engineered and infrastructure systems.” Reliability Engineering & System Safety, 121, 90-103.
8 Rose, A. (2004). “Defining and measuring economic resilience to disasters.” Disaster Prevention and Management: An International Journal, 13(4), 307-314.
9 Lei, Y., Wang, J., Yue Y., and Yin, W. (2014). “Rethinking the relationships of vulnerability, resilience, and adaptation from a disaster risk perspective.” Natural Hazards, 70(1), 609-627.
10 Miller, F., et al. (2010). “Resilience and vulnerability: complementary or conflicting concepts?” Ecology and Society, 15(3), 1-25.
11 Cutter, S. L., et al. (2008). “A place-based model for understanding community resilience to natural disasters.” Global Environmental Change, 18(4), 598.
12 Beatley, T. (2012). Planning for coastal resilience: Best practices for calamitous times, Washington D.C.: Island Press.

7
Components of Resilience
There is a growing convergence of the definitions of resilience used in disaster and risk plan-ning and mitigation that centers on the three principal components of absorption, adaptation and restoration. These three components are very much in tune with the three phases of disas-ter planning: preparedness and mitigation, response, and recovery. Although a large segment of the literature still distinguishes between hazard mitigation and resilience, these two con-cepts should be thought of as complements. Distinguishing between hazard mitigation and the recovery process, as many authors have, may remove some responses to risk that may be beneficial. In particular, if the focus is solely on what happens after a disaster occurs, there is a risk that strategies or actions to reduce vulnerabilities will be undervalued or ignored entirely. Alternatively, if the focus is solely on hazard mitigation, important capacities to the recovery process may be ignored. A less vulnerable community is a more resilient community since it faces fewer disasters from which to recover.
Table 2.1. Sample Definitions of Resilience at Different Levels of Analysis
Citation, year Level of analysis Definition
Gordon, 1978 Physical The ability to store strain energy and deflect elastically under a load without breaking or being deformed
Bodin and Wiman, 2004
Physical The speed with which a system returns to equilibrium after displacement, irrespective of how many oscillations are required
Holling, 1973 Ecological system The persistence of relationships within a system; a measure of the ability of systems to absorb changes of state variables, driving variables, and parameters, and still persist
Waller, 2001 Ecological system Positive adaptation in response to adversity; it is not the absence of vulnerability, not an inherent characteristic, and not static
Klein, 2003 Ecological system The ability of a system that has undergone stress to recover and return to its original state; more precisely (i) the amount of disturbance a system can absorb and still remain within the same state or domain of attraction and (ii) the degree to which the system is capable of self-organization (see also Carpenter et al. 2001)
Longstaff, 2005 Ecological system The ability by an individual, group, or organization to continue its existence (or remain more or less stable) in the face of some sort of surprise….Resilience is found in systems that are highly adaptable (not locked into specific strategies) and have diverse resources
Resilience Alliance, 2006
Ecological system The capacity of a system to absorb disturbance and reorganize while undergoing change so as to still retain essentially the same function, structure and feedbacks—and therefore the same identity
Adger, 2000 Social The ability of communities to withstand external shocks to their social infrastructure
Bruneau, 2003 Social The ability of social units to mitigate hazards, contain the effects of disasters when they occur, and carry out recovery activities in ways that minimize social disruption and mitigate the effects of future earthquakes
Godschalk, 2003 City A sustainable network of physical systems and human communities, capable of managing extreme events; during disaster, both must be able to survive and function under extreme stress
Brown, 1996 Community The ability to recover from or adjust easily to misfortune or sustained life stress

8
Table 2.1.—Continued
Citation, year Level of analysis Definition
Sonn, 1998 Community The process through which mediating structures (schools, peer groups, family) and activity settings moderate the impact of oppressive systems
Paton, 2001 Community The capability to bounce back and to use physical and economic resources effectively to aid recovery following exposure to hazards
Ganor, 2003 Community The ability of individuals and communities to deal with a state of continuous, long term stress; the ability to find unknown inner strengths and resources in order to cope effectively; the measure of adaptation and flexibility
Ahmed, 2004 Community The development of material, physical, socio-political, socio-cultural, and psychological resources that promote safety of residents and buffer adversity
Kimhi, 2004 Community Individuals’ sense of the ability of their own community to deal successfully with the ongoing political violence
Coles, 2004 Community A community’s capacities, skills, and knowledge that allow it to participate fully in recovery from disasters
Pfefferbaum, 2005 Community The ability of community members to take meaningful, deliberate, collective action to remedy the impact of a problem, including the ability to interpret the environment, intervene, and move on
Masten, 1990 Individual The process of, capacity for, or outcome of successful adaptation despite challenging or threatening circumstances
Egeland, 1993 Individual The capacity for successful adaptation, positive functioning, or competence…despite high-risk status, chronic stress, or following prolonged or severe trauma
Butler, 2007 Individual Good adaptation under extenuating circumstances; a recovery trajectory that returns to baseline functioning following a challenge
SOURCE: Compiled by Norris, Stevens et al. (2008).
Resilience Frameworks in the Literature
Many of the nuances in definitions arise when developing frameworks for analyzing resilience and community risk. A system-of-systems approach disaggregates a system into its constituent parts which are linked together in subsystems, and those subsystems themselves are linked. The premise is that individual subsystems can be isolated to carry out specific functions, thus the approach is a way of viewing independent subsystems as part of a larger, more complex system.
In considering the different frameworks that have been used, our approach builds on the work of Arup, which was used to develop the City Resilience Framework and City Resilience Index.13 Additionally, the National Institute of Standards and Technology (NIST) provides a broad overview of the components of community resilience from a system-of-systems approach.14 As Arup explicitly say, “systems based approaches align more closely with the concept of resilience,
13 Arup International Devlopment (2014). City resilience index: Understanding and measuring city resilience. The Rockefeller Foundation, Arup International Development.
14 NIST (2015). Disaster resilience framework.
9
and the long-standing notion of cities as ‘systems of systems.’”15 However, Arup reviews stud-ies on subsystems rather than on the system as a whole. This leaves the interdependencies that arise across systems mostly unconsidered. In contrast, NIST explicitly has a chapter on these cross-system dependencies.
Arup is explicit:
Every city is unique. The way resilience manifests itself plays out differently in different places. The City Resilience Framework provides a lens through which the complexity of cities and the numerous factors that contribute to a city’s resilience can be understood.16
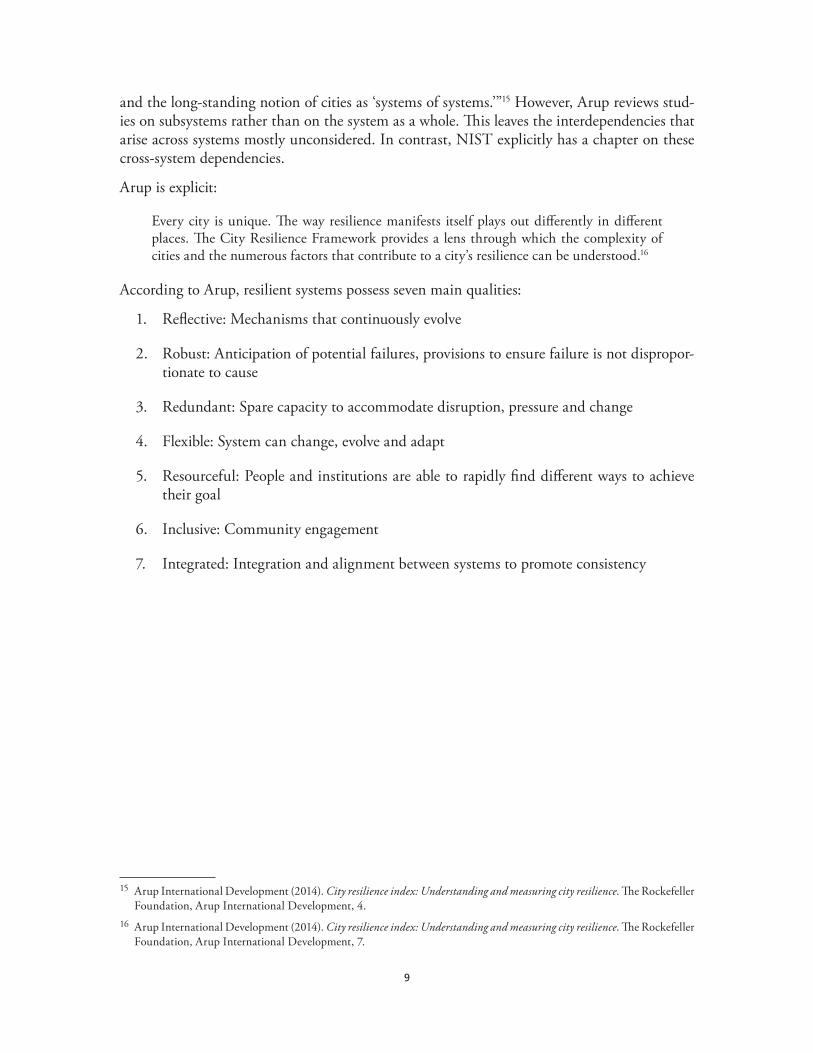
According to Arup, resilient systems possess seven main qualities:
1. Reflective: Mechanisms that continuously evolve
2. Robust: Anticipation of potential failures, provisions to ensure failure is not dispropor-tionate to cause
3. Redundant: Spare capacity to accommodate disruption, pressure and change
4. Flexible: System can change, evolve and adapt
5. Resourceful: People and institutions are able to rapidly find different ways to achieve their goal
6. Inclusive: Community engagement
7. Integrated: Integration and alignment between systems to promote consistency
15 Arup International Development (2014). City resilience index: Understanding and measuring city resilience. The Rockefeller Foundation, Arup International Development, 4.
16 Arup International Development (2014). City resilience index: Understanding and measuring city resilience. The Rockefeller Foundation, Arup International Development, 7.

10
In a unifying framework depicted in Figure 2.1, Arupshow linkages across the various components of leadership and strategy, health and well-being, economy and society, and infrastructure and environment through the seven qualities of resilient cities. This integrates the individual systems through various channels.
Figure 2.1. City Resilience Framework
© Ove Arup & Partners International Limited
SOURCE: Arup (2014). Used with permission.
11
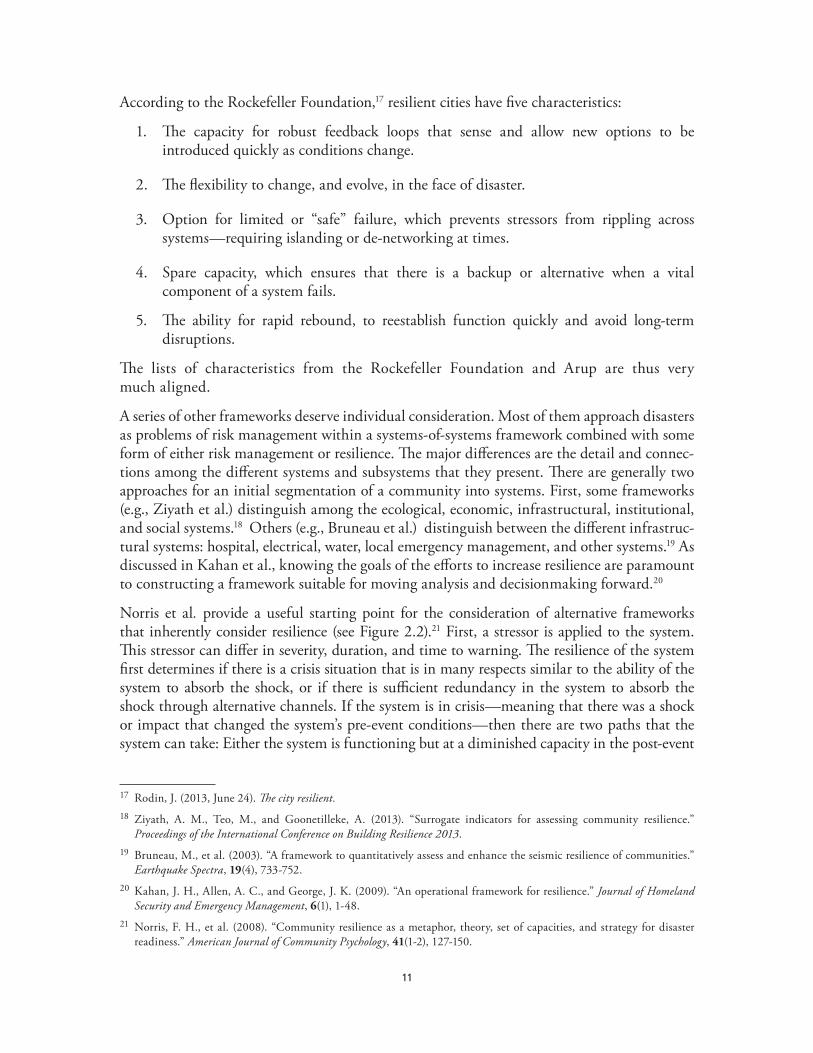
According to the Rockefeller Foundation,17 resilient cities have five characteristics:
1. The capacity for robust feedback loops that sense and allow new options to be introduced quickly as conditions change.
2. The flexibility to change, and evolve, in the face of disaster.
3. Option for limited or “safe” failure, which prevents stressors from rippling across systems—requiring islanding or de-networking at times.
4. Spare capacity, which ensures that there is a backup or alternative when a vital component of a system fails.
5. The ability for rapid rebound, to reestablish function quickly and avoid long-term disruptions.
The lists of characteristics from the Rockefeller Foundation and Arup are thus very much aligned.
A series of other frameworks deserve individual consideration. Most of them approach disasters as problems of risk management within a systems-of-systems framework combined with some form of either risk management or resilience. The major differences are the detail and connec-tions among the different systems and subsystems that they present. There are generally two approaches for an initial segmentation of a community into systems. First, some frameworks (e.g., Ziyath et al.) distinguish among the ecological, economic, infrastructural, institutional, and social systems.18 Others (e.g., Bruneau et al.) distinguish between the different infrastruc-tural systems: hospital, electrical, water, local emergency management, and other systems.19 As discussed in Kahan et al., knowing the goals of the efforts to increase resilience are paramount to constructing a framework suitable for moving analysis and decisionmaking forward.20
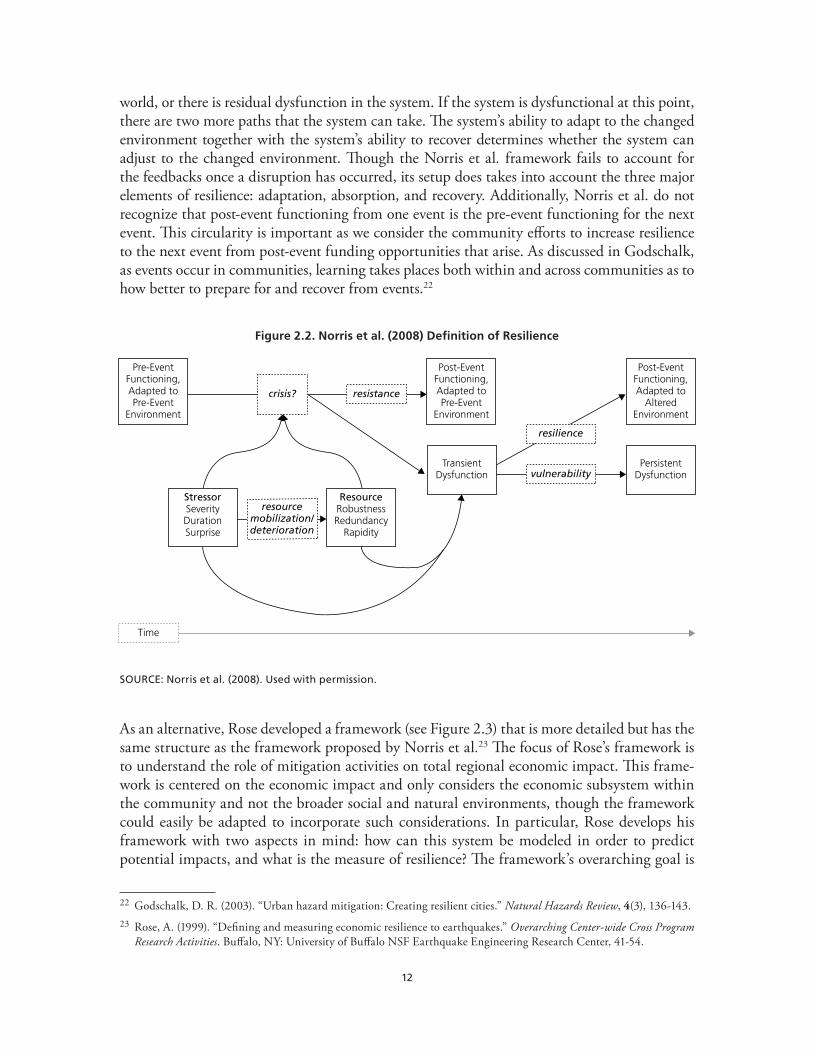
Norris et al. provide a useful starting point for the consideration of alternative frameworks that inherently consider resilience (see Figure 2.2).21 First, a stressor is applied to the system. This stressor can differ in severity, duration, and time to warning. The resilience of the system first determines if there is a crisis situation that is in many respects similar to the ability of the system to absorb the shock, or if there is sufficient redundancy in the system to absorb the shock through alternative channels. If the system is in crisis—meaning that there was a shock or impact that changed the system’s pre-event conditions—then there are two paths that the system can take: Either the system is functioning but at a diminished capacity in the post-event
17 Rodin, J. (2013, June 24). The city resilient.18 Ziyath, A. M., Teo, M., and Goonetilleke, A. (2013). “Surrogate indicators for assessing community resilience.”
Proceedings of the International Conference on Building Resilience 2013. 19 Bruneau, M., et al. (2003). “A framework to quantitatively assess and enhance the seismic resilience of communities.”
Earthquake Spectra, 19(4), 733-752.20 Kahan, J. H., Allen, A. C., and George, J. K. (2009). “An operational framework for resilience.” Journal of Homeland
Security and Emergency Management, 6(1), 1-48.21 Norris, F. H., et al. (2008). “Community resilience as a metaphor, theory, set of capacities, and strategy for disaster
readiness.” American Journal of Community Psychology, 41(1-2), 127-150.
12
world, or there is residual dysfunction in the system. If the system is dysfunctional at this point, there are two more paths that the system can take. The system’s ability to adapt to the changed environment together with the system’s ability to recover determines whether the system can adjust to the changed environment. Though the Norris et al. framework fails to account for the feedbacks once a disruption has occurred, its setup does takes into account the three major elements of resilience: adaptation, absorption, and recovery. Additionally, Norris et al. do not recognize that post-event functioning from one event is the pre-event functioning for the next event. This circularity is important as we consider the community efforts to increase resilience to the next event from post-event funding opportunities that arise. As discussed in Godschalk, as events occur in communities, learning takes places both within and across communities as to how better to prepare for and recover from events.22
Figure 2.2. Norris et al. (2008) Definition of Resilience
Pre-EventFunctioning,Adapted toPre-Event
Environment
resistance
Post-EventFunctioning,Adapted toPre-Event
Environment
crisis?
PersistentDysfunctionvulnerability
TransientDysfunction
resilience
Post-EventFunctioning,Adapted to
AlteredEnvironment
resourcemobilization/deterioration
StressorSeverityDurationSurprise
ResourceRobustnessRedundancy
Rapidity
Time
SOURCE: Norris et al. (2008). Used with permission.
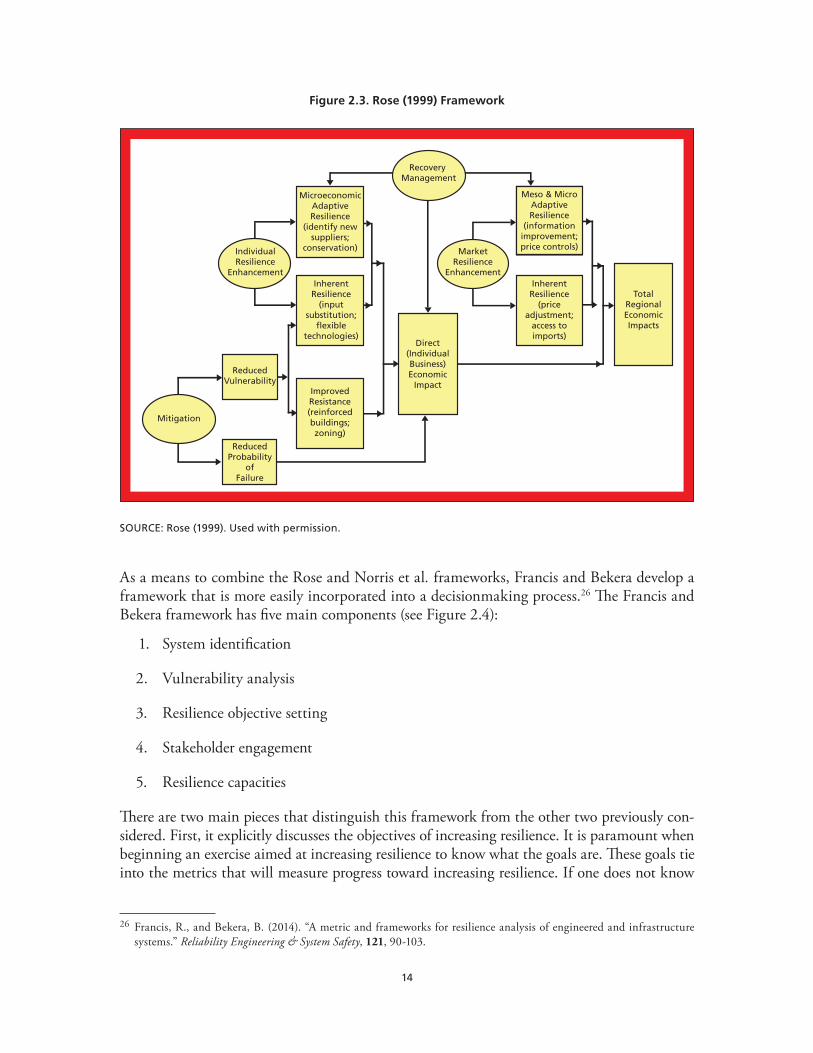
As an alternative, Rose developed a framework (see Figure 2.3) that is more detailed but has the same structure as the framework proposed by Norris et al.23 The focus of Rose’s framework is to understand the role of mitigation activities on total regional economic impact. This frame-work is centered on the economic impact and only considers the economic subsystem within the community and not the broader social and natural environments, though the framework could easily be adapted to incorporate such considerations. In particular, Rose develops his framework with two aspects in mind: how can this system be modeled in order to predict potential impacts, and what is the measure of resilience? The framework’s overarching goal is
22 Godschalk, D. R. (2003). “Urban hazard mitigation: Creating resilient cities.” Natural Hazards Review, 4(3), 136-143.23 Rose, A. (1999). “Defining and measuring economic resilience to earthquakes.” Overarching Center-wide Cross Program
Research Activities. Buffalo, NY: University of Buffalo NSF Earthquake Engineering Research Center, 41-54.

13
to minimize the total regional economic disruptions, whichare modeled using a general equi-librium model. By focusing on the economic subsystem, a number of different roles for adapta-tion are revealed that could be applied in a broader framework.
The key insight from Rose is that community resilience is a function of household resilience, firm resilience, and system resilience, but it is neither additive nor multiplicative between these subsystems. In particular, a mitigating strategy first affects the direct impact that an event may have. Hence, mitigation first operates to reduce the risk that a disruption will take place. Next, individuals and firms adapt to a changed environment by changing as necessary the inputs they use to produce goods and services and, ultimately, community well-being. How flexible the system is, inherently, and how it is enhanced through the mitigating activities of firms and individual households determines the system’s inherent level of resilience. Once the initial adaptation takes place, recovery begins through a reconstruction of capital that was lost to the disruption and through alternative production functions that may be inherently more flexible and responsive to price signals that the system sends to the firms and households. In other words, how individuals and firms behave before, during, and after a shock (or in the presence of a stressor) serve as mitigating factors that influence the resilience of the system.
Although Rose uses a different definition of resilience—namely, “the ability or capacity of a system to absorb or cushion against damage or loss”—the three major aspects of resilience (absorptive, adaptive, and restorative capacity) are embedded in his ideas of inherent resil-ience and adaptive resilience as subcategories of resilience.24 Rose’s view of resilience is that it is a property of the system and that it can be thought of at various spatial and organizational scales. Additionally, given the computable general equilibrium modeling that he uses, the link-ages across sectors are also considered. If infrastructure is damaged, it affects a variety of sec-tors and cascades through the system due to the effects on both upstream and downstream supply chains. Additionally, Rose is able to estimate the inherent resilience of a system due to the effects of mitigating activities and then to improve understanding of how investments affect resilience.25
24 Rose, A. (1999). 25 Rose, A. (1999).
14
Figure 2.3. Rose (1999) Framework
Recovery Management
MicroeconomicAdaptiveResilience
(identify newsuppliers;
conservation)IndividualResilience
EnhancementInherent
Resilience(input
substitution;flexible
technologies)
ReducedVulnerability
Mitigation
ReducedProbability
ofFailure
ImprovedResistance(reinforcedbuildings;zoning)
Direct(IndividualBusiness)Economic
Impact
Meso & MicroAdaptiveResilience
(informationimprovement;price controls)Market
ResilienceEnhancement
InherentResilience
(priceadjustment;
access toimports)
TotalRegionalEconomicImpacts
SOURCE: Rose (1999). Used with permission.
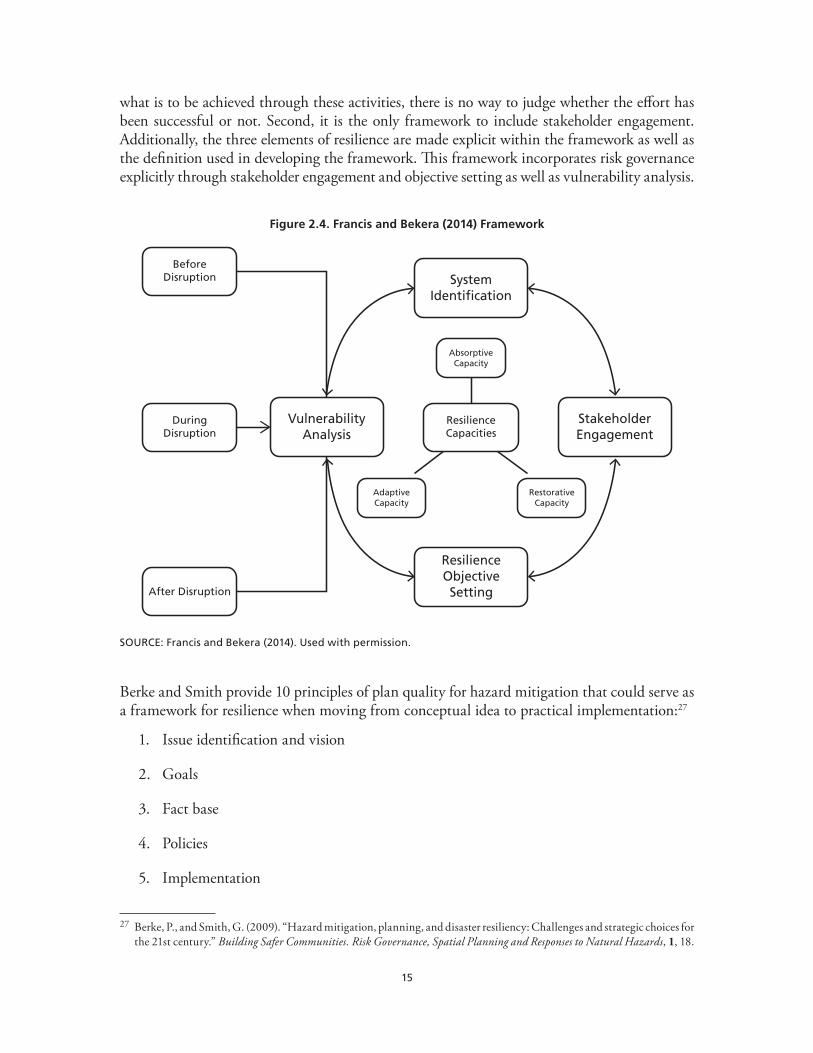
As a means to combine the Rose and Norris et al. frameworks, Francis and Bekera develop a framework that is more easily incorporated into a decisionmaking process.26 The Francis and Bekera framework has five main components (see Figure 2.4):
1. System identification
2. Vulnerability analysis
3. Resilience objective setting
4. Stakeholder engagement
5. Resilience capacities
There are two main pieces that distinguish this framework from the other two previously con-sidered. First, it explicitly discusses the objectives of increasing resilience. It is paramount when beginning an exercise aimed at increasing resilience to know what the goals are. These goals tie into the metrics that will measure progress toward increasing resilience. If one does not know
26 Francis, R., and Bekera, B. (2014). “A metric and frameworks for resilience analysis of engineered and infrastructure systems.” Reliability Engineering & System Safety, 121, 90-103.
15
what is to be achieved through these activities, there is no way to judge whether the effort has been successful or not. Second, it is the only framework to include stakeholder engagement. Additionally, the three elements of resilience are made explicit within the framework as well as the definition used in developing the framework. This framework incorporates risk governance explicitly through stakeholder engagement and objective setting as well as vulnerability analysis.
Figure 2.4. Francis and Bekera (2014) Framework
SystemIdentification
StakeholderEngagement
ResilienceObjectiveSetting
AdaptiveCapacity
RestorativeCapacity
ResilienceCapacities
AbsorptiveCapacity
BeforeDisruption
DuringDisruption
After Disruption
VulnerabilityAnalysis
SOURCE: Francis and Bekera (2014). Used with permission.
Berke and Smith provide 10 principles of plan quality for hazard mitigation that could serve as a framework for resilience when moving from conceptual idea to practical implementation:27
1. Issue identification and vision
2. Goals
3. Fact base
4. Policies
5. Implementation
27 Berke, P., and Smith, G. (2009). “Hazard mitigation, planning, and disaster resiliency: Challenges and strategic choices for the 21st century.” Building Safer Communities. Risk Governance, Spatial Planning and Responses to Natural Hazards, 1, 18.
16
6. Monitoring and evaluation
7. Internal consistency
8. Organization and presentation
9. Inter-organizational coordination
10. Compliance
The first six principles provide for internal consistency, and the last four represent external consistency. The key difference between the Berke and Smith approach and that of Francis and Bekera is a focus on consistency across the community as well as monitoring and evaluating progress toward the goals identified.
Cutter et al.28 and Cutter, Bornutt et al.29 explicitly distinguish between vulnerability and resil-ience. The big distinction between what has already been discussed and the Cutter work is that vulnerability and resilience are distinct but interrelated concepts. Cutter’s view is that resilience is focused on the adaptive nature of the system and not on the vulnerabilities that are embed-ded within it. Taking a broad view of resilience that encompasses the adaptive, restorative, and absorptive capabilities of the system may reveal complementarities among these definitions that can improve the well-being of a community. By making this distinction between vulner-ability and resilience, these potential complementarities may be lost. One key point the Cutter work recognizes is the link between resilience and sustainability. Sustainability is a large part of resilience, especially when considering the idea of resilience of place and the policy definition that incorporates “with limited outside assistance.” Resilience can be thought of as a larger but linked idea in terms of post-disaster adaptation and recovery.
Unlike the previous frameworks, Bruneau et al. focus on critical infrastructure systems as opposed to social, economic, natural, and built systems (see Figure 2.5).30 The starting point for the Bruneau et al. analysis is that the four dimensions of resilience are: technical (T), orga-nizational (O), social (S), and economic (E). This TOSE framework places critical infrastruc-ture in the overall resilience of a community through technical and organizational dimen-sions. The interdependencies within the critical infrastructure are key to understanding how events may cascade through the system, which many of the other frameworks fail to recognize explicitly. These interdependencies are captured through the social and economic systems that overlie the critical infrastructure. There are two large distinctions within the larger framework for analysis (see Figure 2.6). First, the individual subsystems are analyzed. Then, these subsys-tem analyses are incorporated into a larger, community-level analysis that considers the joint
28 Cutter, S. L., et al. (2008). “A place-based model for understanding community resilience to natural disasters.” Global Environmental Change, 18(4), 598-606.
29 Cutter, S. L., et al. (2003). “Social vulnerability to environmental hazards.” Social Science Quarterly, 84(2), 242-261.30 Bruneau, M., Boruff, B. J., and Shirley, W. L. (2003). “A framework to quantitatively assess and enhance the seismic
resilience of communities.” Earthquake Spectra, 19(4), 733-752.
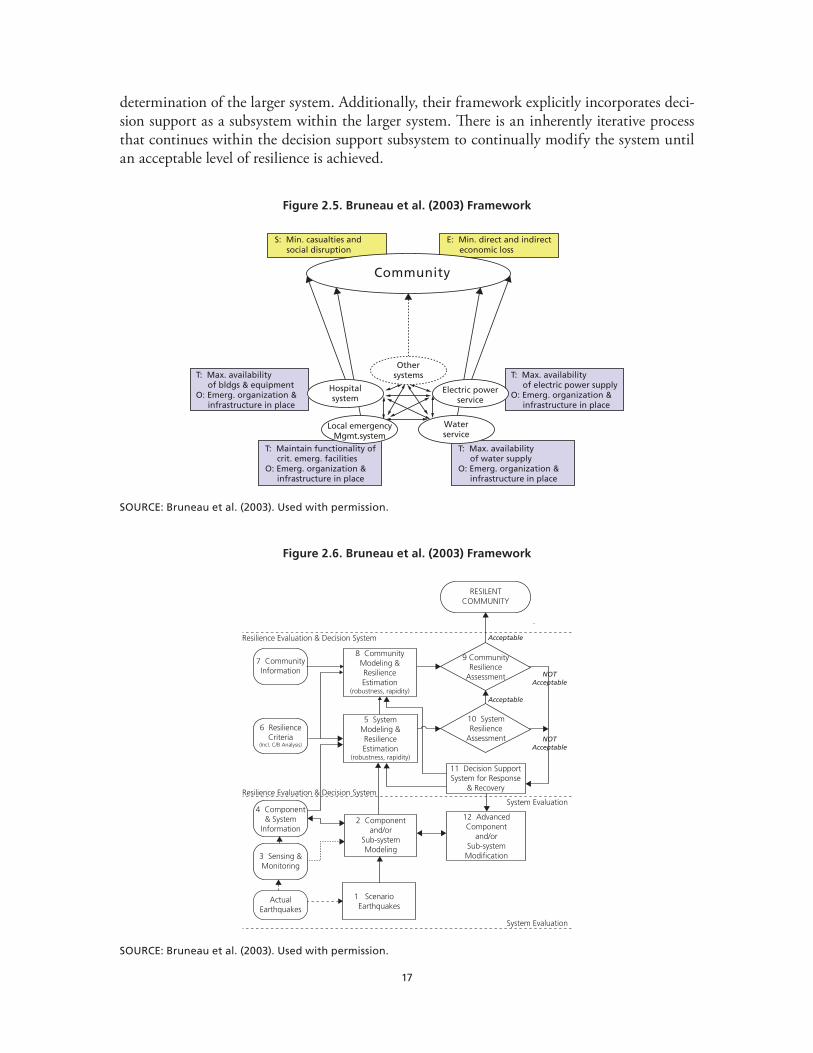
17
determination of the larger system. Additionally, their framework explicitly incorporates deci-sion support as a subsystem within the larger system. There is an inherently iterative process that continues within the decision support subsystem to continually modify the system until an acceptable level of resilience is achieved.
Figure 2.5. Bruneau et al. (2003) Framework
S: Min. casualties and social disruption
E: Min. direct and indirect economic loss
T: Max. availability of bldgs & equipmentO: Emerg. organization & infrastructure in place
T: Maintain functionality of crit. emerg. facilitiesO: Emerg. organization & infrastructure in place
T: Max. availability of water supplyO: Emerg. organization & infrastructure in place
T: Max. availability of electric power supplyO: Emerg. organization & infrastructure in place
Community
Othersystems
Hospitalsystem
Electric powerservice
Waterservice
Local emergencyMgmt.system
SOURCE: Bruneau et al. (2003). Used with permission.
Figure 2.6. Bruneau et al. (2003) Framework
RESILENTCOMMUNITY
Resilience Evaluation & Decision System
9 CommunityResilience
Assessment
10 SystemResilience
Assessment
Acceptable
Acceptable
NOTAcceptable
NOTAcceptable
11 Decision SupportSystem for Response
& RecoveryResilience Evaluation & Decision SystemSystem Evaluation
System Evaluation
12 AdvancedComponent
and/orSub-systemModification
2 Componentand/or
Sub-systemModeling
1 Scenario Earthquakes
5 SystemModeling &ResilienceEstimation
(robustness, rapidity)
8 CommunityModeling &ResilienceEstimation
(robustness, rapidity)
7 CommunityInformation
6 ResilienceCriteria
(Incl. C/B Analysis)
4 Component& System
Information
3 Sensing &Monitoring
ActualEarthquakes
SOURCE: Bruneau et al. (2003). Used with permission.
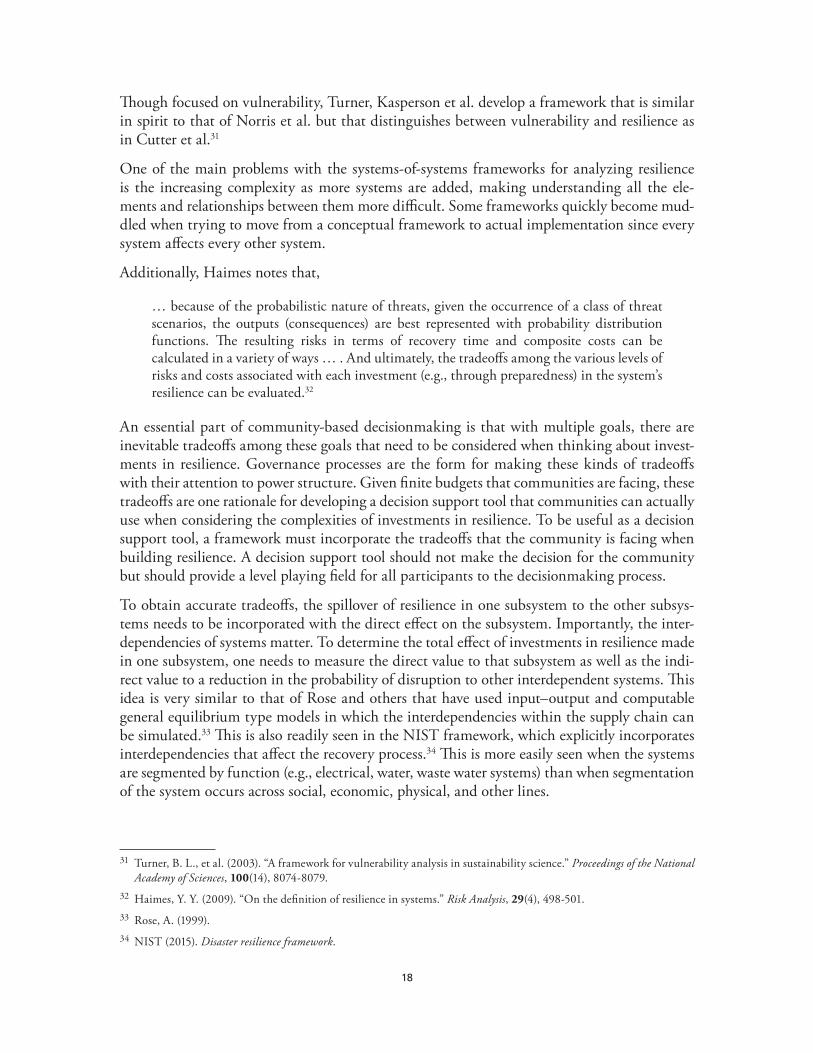
18
Though focused on vulnerability, Turner, Kasperson et al. develop a framework that is similar in spirit to that of Norris et al. but that distinguishes between vulnerability and resilience as in Cutter et al.31
One of the main problems with the systems-of-systems frameworks for analyzing resilience is the increasing complexity as more systems are added, making understanding all the ele-ments and relationships between them more difficult. Some frameworks quickly become mud-dled when trying to move from a conceptual framework to actual implementation since every system affects every other system.
Additionally, Haimes notes that,
… because of the probabilistic nature of threats, given the occurrence of a class of threat scenarios, the outputs (consequences) are best represented with probability distribution functions. The resulting risks in terms of recovery time and composite costs can be calculated in a variety of ways … . And ultimately, the tradeoffs among the various levels of risks and costs associated with each investment (e.g., through preparedness) in the system’s resilience can be evaluated.32
An essential part of community-based decisionmaking is that with multiple goals, there are inevitable tradeoffs among these goals that need to be considered when thinking about invest-ments in resilience. Governance processes are the form for making these kinds of tradeoffs with their attention to power structure. Given finite budgets that communities are facing, these tradeoffs are one rationale for developing a decision support tool that communities can actually use when considering the complexities of investments in resilience. To be useful as a decision support tool, a framework must incorporate the tradeoffs that the community is facing when building resilience. A decision support tool should not make the decision for the community but should provide a level playing field for all participants to the decisionmaking process.
To obtain accurate tradeoffs, the spillover of resilience in one subsystem to the other subsys-tems needs to be incorporated with the direct effect on the subsystem. Importantly, the inter-dependencies of systems matter. To determine the total effect of investments in resilience made in one subsystem, one needs to measure the direct value to that subsystem as well as the indi-rect value to a reduction in the probability of disruption to other interdependent systems. This idea is very similar to that of Rose and others that have used input–output and computable general equilibrium type models in which the interdependencies within the supply chain can be simulated.33 This is also readily seen in the NIST framework, which explicitly incorporates interdependencies that affect the recovery process.34 This is more easily seen when the systems are segmented by function (e.g., electrical, water, waste water systems) than when segmentation of the system occurs across social, economic, physical, and other lines.
31 Turner, B. L., et al. (2003). “A framework for vulnerability analysis in sustainability science.” Proceedings of the National Academy of Sciences, 100(14), 8074-8079.
32 Haimes, Y. Y. (2009). “On the definition of resilience in systems.” Risk Analysis, 29(4), 498-501. 33 Rose, A. (1999). 34 NIST (2015). Disaster resilience framework.
19
Mayunga proposes an alternative view.35 Similar to the economics literature on sustainability, his focus is on capital explicitly rather than systems. He considers investments in resilience to be investments in different capital stocks that are used together to increase the property of resilience. Although not explicit, this is the view that is taken by most of the scorecard or indicator systems, but few acknowledge this in the development of conceptual frameworks for considering resilience.
In a manner similar to that of weak sustainability,36 resilience increases are the value of the increase in total capital stock where the values of different capital stocks are interrelated as opposed to separable in the sustainability literature. One could also view the absorptive, adap-tive, and restorative capacities as a different segmentation of the capital stocks in much the same manner. There are important substitution and complementary relationships between cap-ital stocks that impact resilience stemming from the interdependencies.
Summary
Although this is not an exhaustive overview of the frameworks that have been used in under-standing community risk assessment, it is representative of the literature that exists. Most frameworks acknowledge, either implicitly or explicitly, the role of absorption and recovery in contributing to system resilience. In addition, more attention is being paid to the role of adaptive behaviors and substitutability when discussing the resiliency of systems. Furthermore, when taking a system-of-systems approach, the interdependencies across subsystems play an important role in how the entire system responds to an adverse event.
While none of the frameworks presented in this chapter are designed for valuation of the benefits (or costs) associated with resilience projects, they provide important insights into the elements of systems that might be incorporated into a valuation framework for estimating the resilience dividend. Especially important are the dynamic nature of the concept of resilience, the inherent complexity of community systems and the linkages between non-independent subsystems, and the importance of behavior and substitution in adaptation and recovery. In the next chapter, we present the RDVM, which takes these considerations into account and draws on the past literature and the theory of inclusive wealth.
35 Mayunga, J. S. (2007). “Understanding and applying the concept of community disaster resilience: A capital-based approach.” Summer Academy for Social Vulnerability and Resilience Building.
36 Pearce, D. W., and Atkinson, G. D. (1993). “Capital theory and the measurement of sustainable development: An indicator of 'weak' sustainability.” Ecological Economics, 8(2), 103-108.

21
CHAPTER 3
The Resilience Dividend Valuation Model (RDVM)
This chapter documents the RDVM. It begins with a brief review of the theory of inclusive wealth (on which the model is based), and how the concept of resilience has been used in this context. We then discuss the notion of the resilience dividend in this formal context. For a more informal discussion of the resilience dividend, readers are referred to Chapter 1.
We then turn to a discussion of the elements of the RDVM, including capital stocks, goods and services, production functions and the allocation mechanism, the social welfare function, shocks and stressors, and types of project interventions. Readers interested in the “how-to” details of these model elements are referred to the practitioner’s guide.
Next, we discuss the types of benefits and costs that might appear in the resilience dividend for any given project. Our intention in doing so is to help researchers think about their individual systems of interest and how resilience projects might affect them.
Finally, we present some major challenges in estimating the resilience dividend.
Theory of Inclusive Wealth
The inclusive wealth framework, as originally developed (Arrow et al., Dasgupta and Mäler, Mäler, et al.),1 allows for a capital-theoretic representation of a particular system (e.g., the coupled economic-natural system of national or global economics or subsets thereof) in a wel-fare-theoretic dynamic framework.2 It describes a system in terms of the relationships between capital stocks, goods and services, and the value of goods and services to stakeholders in an economic system over time. Capital stocks are durable resources that can be used together to produce a stream of goods and services. Goods and services are flows that individuals and firms find valuable. Technologies and behavior in the system are represented by the ways in which individuals and firms use the capital stocks to produce and consume goods and services. The
1 Dasgupta, P., and Mäler, K.-G. (2000). “Net national product, wealth, and social well-being.” Environment and Development Economics, 5(01), 69-93.
Dasgupta, P. (2001). “Valuing objects and evaluating policies in imperfect economies.” The Economic Journal, 111(471), 1-29.
Arrow, K. J., Dasgupta, P., and Mäler, K.-G. (2003). “Evaluating projects and assessing sustainable development in imperfect economies.” Environmental and Resource Economics, 26(4), 647-685.
Mäler, K.-G. (2008). “Sustainable development and resilience in ecosystems.” Environmental and Resource Economics, 39(1), 17-24.
Dasgupta, P. (2009). “The welfare economic theory of green national accounts.” Environmental and Resource Economics, 42(1), 3.
2 Contemporary review articles include: Barbier, E. B. (2013). “Wealth accounting, ecological capital and ecosystem services.” Environment and Development Economics, 18(02), 133-161.
Irwin, E. G., Gopalakrishnan, S., and Randall, A. (2016). “Welfare, wealth, and sustainability.” Annual Review of Resource Economics, 8, 77-98.
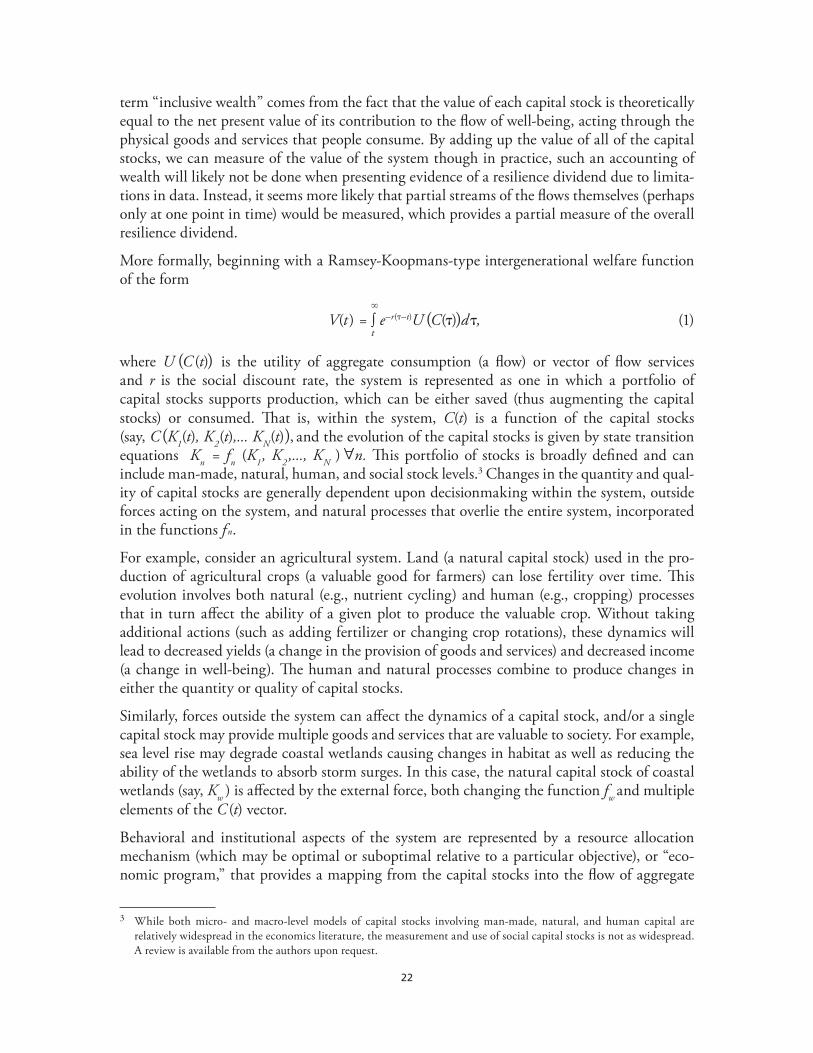
22
term “inclusive wealth” comes from the fact that the value of each capital stock is theoretically equal to the net present value of its contribution to the flow of well-being, acting through the physical goods and services that people consume. By adding up the value of all of the capital stocks, we can measure of the value of the system though in practice, such an accounting of wealth will likely not be done when presenting evidence of a resilience dividend due to limita-tions in data. Instead, it seems more likely that partial streams of the flows themselves (perhaps only at one point in time) would be measured, which provides a partial measure of the overall resilience dividend.
More formally, beginning with a Ramsey-Koopmans-type intergenerational welfare function of the form
�
V(t) = ∫ e–r(�–t)U (C(�))d�, (1)t
where U (C (t)) is the utility of aggregate consumption (a flow) or vector of flow services and r is the social discount rate, the system is represented as one in which a portfolio of capital stocks supports production, which can be either saved (thus augmenting the capital stocks) or consumed. That is, within the system, C(t) is a function of the capital stocks (say, C (K1(t), K2(t),... KN(t)), and the evolution of the capital stocks is given by state transition equations Kn = fn (K1, K2,..., KN )
An. This portfolio of stocks is broadly defined and can
include man-made, natural, human, and social stock levels.3 Changes in the quantity and qual-ity of capital stocks are generally dependent upon decisionmaking within the system, outside forces acting on the system, and natural processes that overlie the entire system, incorporated in the functions f n.
For example, consider an agricultural system. Land (a natural capital stock) used in the pro-duction of agricultural crops (a valuable good for farmers) can lose fertility over time. This evolution involves both natural (e.g., nutrient cycling) and human (e.g., cropping) processes that in turn affect the ability of a given plot to produce the valuable crop. Without taking additional actions (such as adding fertilizer or changing crop rotations), these dynamics will lead to decreased yields (a change in the provision of goods and services) and decreased income (a change in well-being). The human and natural processes combine to produce changes in either the quantity or quality of capital stocks.
Similarly, forces outside the system can affect the dynamics of a capital stock, and/or a single capital stock may provide multiple goods and services that are valuable to society. For example, sea level rise may degrade coastal wetlands causing changes in habitat as well as reducing the ability of the wetlands to absorb storm surges. In this case, the natural capital stock of coastal wetlands (say, Kw ) is affected by the external force, both changing the function fw and multiple elements of the C (t) vector.
Behavioral and institutional aspects of the system are represented by a resource allocation mechanism (which may be optimal or suboptimal relative to a particular objective), or “eco-nomic program,” that provides a mapping from the capital stocks into the flow of aggregate
3 While both micro- and macro-level models of capital stocks involving man-made, natural, and human capital are relatively widespread in the economics literature, the measurement and use of social capital stocks is not as widespread. A review is available from the authors upon request.

23
consumption that is time autonomous.4 This mechanism determines the allocation of stocks and flows (and more specifically, the associated benefits and costs) within the system. For example, the response of fishers to changes in (expected) fish stocks shows an example of endogenous behavioral response to changes in a system stock. Providing disaster risk reduction information to certain households (thus causing a change in mitigating behaviors) or creating a community-based loan program to increase access to financial capital stocks are exogenous interventions that would manifest themselves through changes in the allocation mechanism. Our experience to date has suggested that many resilience projects view changes in this alloca-tion mechanism as key sub-objectives in the intervention. The provision of information has the ability to change how people respond and how they choose which goods and services to pro-duce and how to produce them. Appendix A provides a brief discussion of the characteristics of resilient systems (as defined by the Rockefeller Foundation) and the allocation mechanism. Figure 3.1 provides a schematic representation of the model.
Figure 3.1. Schematic of a Dynamic System Based on Inclusive Wealth
Capital Stock 1
Capital Stock 2
Capital Stock 3
Good/Service
1
Good/Service
2
Well-Being
Y1 = f(X1 ,X2 ,a(X1 ,X2 ,X3 ))
Y2 = f(X2 ,X3 ,�(X1 ,X2 ,X3 ))
NOTES: The functions a( ) and �( ) are the allocation mechanisms that represent human response/behaviors relative to the capital stocks. They embody behavior and institutions that enable/constrain it.
SOURCE: Authors’ representation.
Because this allocation mechanism is a function of the stocks (and potentially other parameter values), the value function in (1) can be rewritten as a function of the stocks as well. In other words, an equivalent representation of (1) is
W (K(t))=V(t), (2)
where K(t) is an appropriate vector of all capital stocks in the system.
4 Irwin, E. G., et al. (2016). “Welfare, wealth, and sustainability.” Annual Review of Resource Economics, 8, 77-98.
24
We can differentiate (2) with respect to time (t), which provides an expression that captures the change in intergenerational well-being (V) over time in terms of the associated shadow prices (or marginal values) of the capital stock. The functions that determine those shadow values are a theoretically consistent representation of the maximum willingness to pay for an additional unit of the stock, and can be used to calculate the aggregate value of all productive stocks in the economy at any point in time. This “inclusive wealth” metric, so termed because it capital-izes the value all of the relevant (future) flows of goods and services represented by C(t), is an “almost perfect” indicator of future welfare and sustainability.5
Inclusive Wealth and the Concept of Resilience
Building on this deterministic framework, Mäler6 and Mäler and Li7 develop a stochastic version in order to value the property of resilience. Assuming that a system can be in either a “good” and “bad” state, the value of an investment in resilience is conceptualized as the dif-ference in welfare in each, weighted by the change in probability of the bad state occurring. Fundamentally, this approach is based on notions of ecological resilience initially developed by Holling,8 which assumes a threshold (or bifurcation) that determines the basin of attraction for a particular stock.
Simply put, the property of resilience is defined as one minus the probability of a switch into the bad state, and valued as the change in the net present value of future flows associated with a change in a related resilience “stock.”9 The approach was used by Walker, et al. in the context of salinity in Southeast Australia.10
5 Dasgupta, P., and Mäler, K.-G. (2000). “Net national product, wealth, and social well-being.” Environment and Development Economics, 5(01), 69-93.
Arrow, K. J., et al. (2003). “Evaluating projects and assessing sustainable development in imperfect economies.” Environmental and Resource Economics, 26(4), 647-685.
Mäler, K., et al. (2007). “Pricing resilience in a dynamic economy environment system: A capital theoretical approach.” The Beijer Institute of Ecological Economics Discussion Paper (208).
Irwin, E. G., et al. (2016). “Welfare, wealth, and sustainability.” Annual Review of Resource Economics, 8, 77-98. 6 Mäler, K.-G. (2008). “Sustainable development and resilience in ecosystems.” Environmental and Resource
Economics, 39(1), 17-24.7 Mäler, K.-G., and Li, C.-Z. (2010). “Measuring sustainability under regime shift uncertainty: a resilience pricing
approach.” Environment and Development Economics, 15(06), 707-719.8 Holling, C. S. (1973). “Resilience and stability of ecological systems.” Annual Review of Ecology and Systematics, 1-23.9 Strictly speaking, the probabilities are functions of an observable stock and associated threshold, and may or may not
contribute to other valuable flows. See equation (5) in Maler and Li for a more formal representation: Mäler, K.-G., and Li, C.-Z. (2010). “Measuring sustainability under regime shift uncertainty: a resilience pricing approach.” Environment and Development Economics, 15(06), 707-719.
10 Walker, B., et al. (2010). “Incorporating resilience in the assessment of inclusive wealth: An example from South East Australia.” Environmental and Resource Economics, 45(2), 183-202.

25
In a related but separate stream of literature, Reed and Haras11 and Barbier12 consider the case of a catastrophic ecosystem collapse, and model the change in the probability of collapse directly as a state variable in the dynamic system. As this quantity is explicitly represented as a state variable in the system, it derives value in the same way that any state variable does, and thus the marginal values of an endogenous or exogenous change in probabilities can be obtained. This augmented state space approach is similar to the dynamic systems used in the study of adaptive resource management to obtain the value of information.13
In either formulation, the net result is to monetize changes in the probabilities of a particular state or stream of states occurring through the estimation of an accounting price for the stock of resilience.
Adapting the Theory to the Resilience Dividend
This framework can be adapted to our definition of the resilience dividend. Let social pref-erences be represented by a utility function U (C(t)), where C(t) is a vector of valued flows that accrue over time t, and assume that this vector of flows are differentiated in two discrete worlds: one in which a resilience project is implemented, denoted C1(t), and one in which a counterfactual is implemented, denoted C0(t). Each of these paths is conditional on the alloca-tion mechanism, or economic program, assumed in each world, and may be associated with differential evolutionary paths of capital stocks (say, K1 and K0 respectively). The former is particularly important for project-level interventions that are designed to influence behaviors within the systems, as changes in the intertemporal flows might work specifically through this mechanism.
The overall intertemporal welfare difference between the two worlds, or equivalently the resilience dividend, at time s is thus
s W(s) = ∫ e–rt[U (C1(t))–U (C0(t))]dt , (3)
0
which represents the net present value of the aggregate utility flows between the two worlds. In practice, a maximum of one of these streams can actually be observed, and the other must be estimated in some manner. If so desired, welfare could be calculated for individuals or groups of stakeholders as well.
11 Reed, W. J., and Heras, H. E. (1992). “The conservation and exploitation of vulnerable resources.” Bulletin of Mathemati-cal Biology, 54(2-3), 185-207.
12 Barbier, E. B. (2013). “Wealth accounting, ecological capital and ecosystem services.” Environment and Development Economics, 18(02), 133-161.
Barbier, E. B. (2016). “Sustainability and development.” Annual Review of Resource Economics, 8, 261-280.13 Bond, C. A., and Loomis, J. B. (2009). “Using numerical dynamic programming to compare passive and active learning
in the adaptive management of nutrients in shallow lakes.” Canadian Journal of Agricultural Economics/Revue canadienne d’agroeconomie, 57(4), 555-573.
Bond, C. A. (2010). “On the potential use of adaptive control methods for improving adaptive natural resource management.” Optimal Control Applications and Methods, 31(1), 55-66.
26
When we apply this framework to estimate the net benefits of a resilience project over a baseline alternative, we call it the RDVM, and equation (3) is the estimate of the resilience dividend.
Next, we discuss the major elements of the model in more detail.
Elements of the Resilience Dividend Valuation Model
The inclusive wealth framework provides a production-oriented structure that can be used to represent complex systems in a dynamic context. It breaks the elements of the system into capital stocks and their evolution, the human response to changes in capital stocks (the afore-mentioned allocation mechanism), the flow of goods and services produced from these stocks, and the well-being that these flows create. Each of these elements is assumed to be functionally related, mimicking a system-of-systems approach, and can be affected either directly or indi-rectly by resilience interventions.
In this section, we expand the description of each element that enters the RDVM.
Capital Stocks
Capital stocks are a system’s “capital assets … broadly defined to include natural, human, and social forms of capital in addition to reproducible capital.”14 They are durable quantities that, when combined together with particular technologies, contribute to flows of goods and ser-vices over time. In short, they are the inputs into the production of flows that stakeholders value. Because capital stocks are assumed to be durable, they have the potential to evolve over time through both natural and man-made processes. Capital can have positive values (assets like human and man-made capital) or negative values (stocks such as pollution).
Practitioners interested in applying the RDVM will need to identify the capital stocks that characterize the system of interest and understand how they a) might evolve, and b) contribute to the production of goods and services. Given their role as inputs into the production of the flows that stakeholders value, collection of data about the capital stocks both before and after the project can be valuable as indicators of a resilience dividend, especially when a particular good or service is difficult to measure or information on values is missing. In other words, if it can be shown that a productive capital stock has increased in quality or quantity as a result of a resilience project (coupled with an assumption about productive relationships), this can be taken as evidence that a resilience dividend may have been realized.
Goods and Services
Practitioners interested in applying the RDVM will need to identify the goods and services that are expected to change, either directly or indirectly relative to the BAU baseline, as a result of a resilience project. These changes are what are valued in order to calculate the quan-titative resilience dividend. In some cases, the value of the change can be directly observed or easily estimated (e.g., change in agricultural output as a result of a development project). In other cases (e.g., changes in ecosystem service benefits), the physical and monetary values may
14 Irwin, E. G., et al. (2016). “Welfare, wealth, and sustainability.” Annual Review of Resource Economics, 8, 81.
27
come from different sources. Practitioners should identify as comprehensive a set of potentially changed goods and services as possible, including both measurable and nonmeasurable items, but ensure that each good and service fits into the conceptualization of the system. Changes in goods and services that cannot be valued quantitatively can be discussed qualitatively.
Goods and services are the tangible and intangible items that are produced within a system. The capital stocks are the durable inputs used in the production relationship, and the goods and services are assumed to be valued (either positively or negatively) by stakeholders. In the resilience context, they can include a large variety of goods and services, including private marketed goods (e.g., agricultural crops sold for income), services provided by private or public investment (e.g., storm protection services), and other public goods (e.g., ecosystem services). In some cases, individual or household income might proxy for a bundle of goods and services that an agent might produce or consume.
Goods and services provide the “physical” measure of the items that are valued in the system. Value here refers to the willingness and ability of a stakeholder to pay for an extra unit of the good or service, or the willingness to accept a payment as compensation for enduring a “bad.”15 If a stakeholder’s satisfaction increases with the production or consumption of a good or ser-vice, then this good or service is valuable.16 An individual would be willing to trade something else of lesser value (such as income) in order to obtain it and still be made better off. Some of these goods and services may only become apparent in different states of the world. For example, the value of a levee may only be realized in the face of a storm where the protection service is provided. Thus, the practitioner needs to be cognizant of external forces’ impact on the system and how they interact with capital stocks to produce other goods and services.
Production Functions and the Allocation Mechanisms
Production Functions
The logic of the RDVM suggests that practitioners should have a sense of which capital stocks are combined in order to produce which goods and services, and anticipate whether a resilience project has the potential to change these relationships relative to BAU. For example, a project that introduces new crop choices to agricultural producers essentially changes the production technologies used to generate valuable crops if these practices are adopted. A project that intro-duces new protective infrastructure for storms is a public good (affecting all newly protected stakeholders) that changes the flow of storm protective services.
15 For example, consider a service such as flood protection for a dwelling. For simplicity, assume that it is known that a particular investment would provide 100% protection (i.e., generate zero damage) against a 1-foot flood, but absent the investment, there would be $5,000 worth of damage to the home. Further assume that the probability of the 1-foot flood occurring tomorrow is 1, and there is no private or public insurance. Then the willingness to pay for the investment would be equal to the damage to the home, as the household would be indifferent between paying for the investment and the home being damaged, irrespective of what actually has to be paid. Symmetrically, if the household was already endowed with the investment, the minimum the household would be willing to accept to remove the investment would be $5,000.
16 In economic terms, satisfaction is typically referred to as “utility.”

28
Each good or service represented in the system is produced by combining assets (the capi-tal stocks) and other goods and services (called intermediate inputs). A production function describes these relationships. Examples include the production of crops, which involves the capital stocks of land (a natural capital stock), water (another natural capital stock), labor (human capital stocks), man-made capital (like tools), and intermediate inputs such as fertil-izer. In a disaster risk reduction framework, stocks of protective capital such as levees produce valuable storm protection services in a “gray infrastructure” context, while green infrastructure solutions involving natural capital can produce these services and co-benefits in the form of additional ecosystem services.
The level of specificity needed in formalizing the production functions will depend on the application. If the analysis is backward-looking (ex post) and using empirical data, then users of the model may only need to posit a functional relationship between one or more capital stocks and the goods or services that it was expected to change. The user can then use statisti-cal techniques to test this hypothesis. If, on the other hand, the analysis is forward-looking (ex ante) and using simulation modeling to generate an expected path forward in time, then a more explicit relationship (e.g., positing a functional form for the relationship) may be needed.
Allocation Mechanisms
The allocation mechanisms in the model represent the formal and informal institutional struc-tures, responses and behaviors that “determine[s] the current and future allocation” of the capital stocks and goods and services flows.17 This includes both private and public goods and services, and the prices or constraints that individuals and firms face. Figure 3.2 provides a graphical example of these changes.
Figure 3.2. Changes in Outcomes due to Changes in the Allocation Mechanism
Project Intervention
Change in Information, Institutions,
or Constraints
Change inBehavior
ChangedGoods
and Services
Changed Allocation Mechanism
SOURCE: Authors’ analysis.
17 Irwin, E. G., et al. (2016). “Welfare, wealth, and sustainability.” Annual Review of Resource Economics, 8, 84.
29
Although this concept is very broad, we offer two examples here. First, consider the case of a developing country with a large agricultural economy. For simplicity, we assume households in this economy only produce one crop. Due to a lack of fertilizer, households face a stressor in the form of declining land fertility. In this example, the allocation mechanism describes how the households will respond to this change in the quality of land, which is a capital stock. For example, at some point in the process, a given household may switch crops or abandon the land altogether, clearly influencing the flow of agricultural income. This expected behavioral change is represented in the framework by the allocation mechanism, which serves to map the decline in fertility to changes in production and ultimately to income. The allocation mechanism can be thought of as the behavioral response to different levels of all the capital stocks.
We can also suppose that there is a new way to introduce new cropping options or improve access to fertilizer. The project essentially relaxes a constraint on the behavior of the household (or, equivalently, lowers the price of accessing those technologies). This change may ultimately impact behavior of (a subset of) households, which again would be reflected in the production of goods and services (crops) and ultimately agricultural income. In a backward-looking ex post case, changes in the allocation mechanism manifest themselves empirically in changes in behavior and/or the provision of goods and services in the framework; in a forward-looking ex ante case, such behaviors and provisioning would have to be assumed.
A second example is a change in a government’s provision of public goods, such as building a storm protection system. In this case, the allocation mechanism describes how the new capi-tal serves to impact the provision of storm protection services, likely through the change in (expected) damage to life (human capital) and property (other types of capital). Because this is an example of a public good, individual agents cannot “opt out.” But, the provision of storm protection services may change the value of land protected by the system, causing changes in where production of other goods may occur. The behavioral component is linked to the dynamic and spatial relationships of other capital stocks.
However, this is not always the case. One example might be the government developing disas-ter resilience plans and training that enable particular public and private behaviors (such as operation of disaster relief sites by public agencies and private training for individuals on search and rescue operations). The benefits of this planning and training exercise are primarily limited to the period during and immediately after a disaster by changing protection services (reduc-ing overall damage), but rely in part on the behavior of the agencies and individuals involved. Such changes, relative to BAU, would have to be estimated or simulated in order to quantify the resilience dividend associated with these activities.
Social Welfare Function
The social welfare function reflects the full social value of each good and service represented in the system. This can theoretically be done by calculating the full producer and consumer surpluses associated with a good or service flow at each point in time (including all use and non-use values of both market and nonmarket goods and services), and adding them together.

30
There are many ways to measure “social value,” but in practice, full social values (either total or marginal) are rarely available, or feasible. 18 A common if imperfect way to measure this value is to use prices, which can serve as a proxy for marginal values in some cases, and a large amount of literature exists for valuing any number of nonmarket goods and services.19 Whatever values are used to represent the opportunity costs of the goods and services, practitioners should be explicit about the values used and endeavor to follow best practices in monetizing flows, as in benefit–cost analysis.20
Shocks and Stressors
Direct benefits from resilience projects are related to the ability of people to better withstand and recover from disruptions, to improve current situations, and/or to positively change the trajectory of a place and/or people’s lives. The treatment of disruption in RDVM is thus important.
From a modeling standpoint, we distinguish the ex ante and ex post cases as follows:
• Ex Ante: The project is evaluated before it is implemented using simulation modeling or a similar technique. One or more shocks are modeled probabilistically, assuming that the project is implemented in project case and the project is not implemented in the BAU case. A useful alternative, if probability information on the stocks and stressors is unavail-able, would be to estimate the resilience dividend under a set of futures independent of probability distributions (i.e., construct scenarios on the basis of the uncertain variables and parameters of the problem), and keep the results scenario-specific.
• Ex Post: The project is evaluated after it is implemented, conditional on a particular observed shock or stressor. The (quasi-monetized) resilience dividend is the difference in well-being (possibly discounted over time) between the project and base cases starting from the time of the shock (or an assumed point along the stressor path).
We note that it is possible to evaluate a project using the inclusive wealth theory even if a shock has not actually happened in the real world, since we can simulate such an event using simulation modeling as in the ex ante case. Validation of the outputs, however, would require empirical data. Furthermore, we note that in the ex post case, the resultant (partial) resilience dividend is conditional on what actually happened and thus does not include the expected value associated with all potential random events.
Project Interventions
By definition, the resilience dividend is the difference in net benefits generated between a resil-ience project and a BAU counterfactual. This implies that the resilience dividend, to the extent that it exists, is comprised of any and all changes in well-being, both positive and negative,
18 In particular, consumer and producer surplus measures require information about the marginal social benefit and cost curves over the entire span of the quantity change.
19 For a broad overview of methods for nonmarket valuation: Champ, P., Boyle, K. J., and Brown, T. C. (2003). A primer on nonmarket valuation. Netherlands: Springer. The literature on benefit transfer (or value transfer), which discusses how values appearing in the literature can be used in other contexts, can be used by practioners in lieu of primary research.
20 Farrow, S., and Zerbe, R. O. (2013). Principles and standards for benefit-cost analysis, Northhampton, MA: Edward Elgar.
31
that arise as a result of the project. We define well-being as a change in the welfare (or more formally, utility) of any stakeholder affected by the project. A change in provision of a good or service causes a change in welfare if the stakeholder is willing to pay a positive amount of some other good or service (including, but not necessarily limited to, income) to get it.21 This implies that the composition of the resilience dividend will be case- and context-specific, and depend on the types of benefits that a particular project is intended to deliver and the spillover benefits and costs that it provides.
That said, using the inclusive wealth theory to represent dynamic systems suggests the fol-lowing types of changes that practitioners may want to consider when developing a model to estimate the resilience dividend. These categories should not be considered distinct and non-overlapping, nor are they necessarily comprehensive. For additional examples organized in a slightly different manner, interested readers are referred to benefits and indicators contained in Tanner, et al. and Arup.22
• Changes in the direct provision of public or quasi-public goods. In economics, public goods are described as being non-rival in consumption (meaning that consuming the good does not affect its availability for others) and non-excludable (a lack of property rights precludes exclusion of some members of a populace). Quasi-public goods have elements of non-excludability or non-rivalry, but are not pure public goods. Public and quasi-public goods can be provided by both private individuals/firms and organizations or governments.
Because of their properties, the proper valuation of a change in the provision of a public good is to sum the benefits that accrue to every stakeholder affected. Many public goods are not traded in a market, making valuation complex. However, economists have devel-oped several methods to value nonmarket goods and services based on both stated and revealed preferences.
Major categories of public good provision that might be affected by resilience projects include, but are not limited to:
• Storm and environmental protection services
• Other environmental goods and ecosystem services
• “Social” goods and services directly provided by governments or other formal institutions (e.g., welfare systems and other transfer payments)
• Publicly available information (e.g., early warning systems, information about alterna-tive crop choices, etc.)
21 For a negative change in welfare from a “bad,” the stakeholder would be willing to accept a positive amount in order to be compensated.
22 Arup International Development (2014). City resilience index: Understanding and measuring city resilience. The Rockefeller Foundation, Arup International Development.
Tanner, T. M., et al. (2015). The triple dividend of resilience: Realising development goals through the multiple benefits of disaster risk management. London: Global Facility for Disaster Reduction and Recovery (GFDRR) at the World Bank and Overseas Development Institute (ODI).

32
We note that some of these categories can directly change welfare via changing the pro-duction or allocation of public goods or resources, while others (such as the provision of information) enable a change in behavior that can subsequently be used to alter the pro-duction or consumption of private goods.
• Changes in the quantity or quality of man-made, natural, or human capital stocks. Any changes that are made to augment quantities or qualities of capital stocks, or changes in their evolution over time, will affect the provision of the goods and services that these stocks support.23 Both public and private decisions can change these system elements, and there may be considerable overlap with the direct provision of public goods listed above. For example, the construction of infrastructure that affects the provision of storm protection services by governments changes the stock of man-made capital, which in turn affects the flow of protection services.
Indirect changes to capital stocks can be made by changing their evolution through the feedback mechanisms that run from the allocation mechanism to the stocks themselves. For example, in the case of a natural resource, a change that results in greater exploitation (in a consumptive sense) of the resource will decrease the quantities available relative to the BAU case. Similarly, an intervention may slow or reverse depreciation of a stock, such as increased maintenance of a man-made stock, or augment its quality, such as an invest-ment in education affecting human capital and augmenting overall labor productivity.
• Changes in formal or informal institutions. The institutional structure of a particular system, either formal or informal, is conceptualized as the set of “rules” under which eco-nomic actors can behave. This includes any and all constraints on behavior, the incentives that people and firms face, and other aspects that shape behavioral outcomes. Changes in institutions indirectly change the flow of goods and services through changes in behavior, reinforcing the importance of modeling behavior with the resilience dividend model via the allocation mechanism.
The following categories seem particularly important in the resilience context:
• Changes in incentives. This includes changes in relative prices in a market economy, as well as changes in any other reward or punishment system that ultimately affects behavior. This can include regulatory structures, taxes and subsidies, and other government policy.
• Changes in access to capital stocks or goods and services. Although this can be viewed as a change in incentives, any changes in access can have behavioral implications. For example, if social norms or other transaction costs precluded a particular group of people from engaging in a production activity or accessing a resource, efforts to overcome those costs might change the behavior of some individuals within this group, allowing for augmented production/consumption of certain goods and services.
23 This includes both public and private goods and services.
33
• Changes to privately available information. Some resilience projects may provide information that is not necessarily public but, because it is new or packaged in a new way, may affect behavior of particular individuals included in the project intervention going forward.
• Changes in access to technology. Changes in access to technology (methods, techniques, skills and processes used to create goods and services) can change the manner in which capital stocks are combined in order to create flows of goods and services. This change may arise from a change in the incentive structure of the system, as discussed above, or the introduction of new technologies may be a direct intervention as an activity of the resilience of the project.
• Changes in social capital. Social capital has been defined at various levels, in particular as the “trust, norms and networks that can improve the efficiency of society by facilitating coordinated actions” and also as “the institutions, relationships and norms that shape (up) the quality and quantity of a society’s social interaction.”24 It exists as a form of capital that is productive since it helps achieve certain outcomes once it is put to use. Social capital arises from social networks, and these networks themselves produce social capital. Trust and reciprocity involved in the relationships within these networks have a positive effect on a society’s wealth, primarily by reducing transaction costs, facilitating collective action, and lowering opportunistic and self-interested behavior.25
Given this definition, we see that there is considerable overlap between changes in this category and “changes in formal or informal institutions” discussed above. Practically speaking, however, by changing transactions costs and network structures, changes in social capital can facilitate alternative behaviors, thus changing the flow of goods and services along a project path.
Types of Benefits in the Resilience Dividend
Below, we discuss the division of the resilience dividend into direct benefits and co-benefits, as well as the types of benefits that might arise from changes in the allocation mechanism and the treatment of costs.
Direct Benefits
The concept of resilience is generally understood to involve changing the risk of loss in the face of threats to well-being. These threats can involve stochastic shocks (loosely defined as discrete events, such as storms or floods, that cause damage) or stressors (loosely defined as more gradual pressures on overall well-being) of a natural or man-made nature. These threats, when realized, generally cause damage, or a loss of welfare, to at least some subset of stakehold-ers. Comparing the damage that would have occurred absent the resilience project with the
24 Agampodi, T. C., et al. (2015). “Measurement of social capital in relation to health in low and middle income countries (LMIC): A systematic review.” Social Science & Medicine, 128, 95-104.
25 Dinda, S. (2008). “Social capital in the creation of human capital and economic growth: A productive consumption approach.” The Journal of Socio-Economics, 37(5), 2020-2033.
34
damages that actually occur with the project comprises the direct (net) benefits. This includes changes in absorptive capacity (the ability to withstand the shock) and changes in recovery.
Direct benefits defined in this manner suggest that the subset of goods and service flows that are affected by shocks and stressors provide the direct benefits. For producers of goods and services, the welfare losses associated with this damage are likely measured through either a) changes in profitability as a result of the disruption, or b) damage to the capital stocks that support production. Because capital stock values are determined in large part by the value of the flows of goods and services that they provide, changes in welfare flows and changes in the value of capital should not be summed to avoid double-counting.
For consumers, goods and services provide welfare through the generation of a gap between willingness to pay and what is actually paid, which is termed consumer surplus. Direct benefits from a resilience project should thus be calculated as the increase in consumer surplus from the change in damages to the flows in goods and services due to disruptions of the system.
In the cases that RAND examined, examples of direct benefits included disaster risk recovery benefits from floods in Nepal and Pakistan; agricultural profitability benefits for alfalfa and hay producers in Diamond Valley (where groundwater tables are dropping and water is getting more expensive to pump); preventing wildfire damages including burned structures, lost forest products, and erosion through a Resilient Forest Bond; as well as resilient housing construction that protects against typhoons in Vietnam. These benefits were calculated on the producer side.
Co-Benefits
The idea of the resilience dividend has much in common with the economic notion of spillover benefits, in that projects intended to address a particular shock, set of shocks, or stressor(s) may help increase benefits not immediately related to maintaining or sustaining welfare in the face of those elements. We use the term “co-benefits” for these elements of the resilience dividend. It should be noted that the distinction between direct benefits and co-benefits may not be dis-tinct, as we discuss below.
Co-benefits are generally defined as the value of the changes in the flows of goods and services that are not directly related to the external threats to well-being represented by direct benefits. Any non-direct good or service affected by a resilience project could theoretically be included in co-benefits, and given the large differences across differing types of resilience projects and different systems, a precise taxonomy of potential co-benefits that includes specific elements has the potential to be both limiting and misleading. We instead suggest that practitioners use their own judgments and the types of changes described above to consider the potential co-benefits of the projects with which they are involved.
In the cases that RAND examined, examples included co-benefits related to increased agri-cultural incomes in Nepal and Pakistan and benefits to community vitality and stability in Diamond Valley. We also have evidence of increased trust in community leadership in Nepal. There is also evidence of increased ecosystem services such as water runoff that could generate additional drinking water and water for hydroelectric production from the forest bond case. While we cannot calculate it in the case of Da Nang, we assume that households there benefit
35
from their typhoon-resilient housing in that they spend less time and money responding to disaster, which frees up more time to generate income and produce more savings.
Benefits Related to the Allocation Mechanism
Although the direct benefits and co-benefits are more or less comprehensive categories, the importance of the link between behaviors and benefits is important. In particular, some pres-ent-day changes may enable increased welfare into the future. It seems likely that changes in behavior enabled by resilience projects are particularly likely to have this effect. Changes in the structure of the allocation mechanism that enable differing behaviors—such as new institu-tional rules and norms that informally govern actions—essentially change the constraints on individuals and firms. In many cases, these changes could affect adaptive capacity to recover from disasters, as well as the capacity to transform the system and generate levels of welfare not seen prior to the project. This section discusses these issues in more detail.
All of the cases that RAND examined involved behavioral changes. For example, in one case, data showed people taking private actions to mitigate losses and engaging in new cropping practices (though confounding of data did not allow us to uncover a positive resilience divi-dend associated with this behavior). Increased trust in community leadership could also lead to future benefits, such as absorbing shocks better or faster recovery times (though we have no such evidence with the existing data). In another, farmers also changed their production prac-tices, which resulted in a positive resilience dividend for some project households.
In a third, which was a forward-looking project that has not yet been implemented, the change involved the methods by which groundwater is allocated (restricting total withdrawals over time and allowing for trading of groundwater rights). These (assumed) institutional changes are expected to change the behavior of irrigators, assuming they try to maximize their prof-its from production and trading rights under the new regime. The assumed result is was an increase in overall agricultural profitability over thirty years.
Costs of the Project
In both the project and BAU case, costs of the project (in terms of lost welfare for producers and consumers) should be netted out from any benefit calculation. Costs of project implementation that are borne outside of the system (by, e.g., federal governments for a local system, nongovern-mental organizations (NGOs) funded by philanthropies, etc.) should not be included because the costs are not borne by stakeholders operating in the system. All costs to the system should be included, including those imposed directly by the intervention and indirectly through the behavior of the system’s actors.26
26 Note that a negative benefit is treated as a cost; they are symmetric.

36
A Graphical Representation of the Framework
Figure 3.3 shows a graphical example of how one might approach the ex post evaluation of a resilience project that creates co-benefits and has experienced a shock prior to the evaluation. The well-being, or measure of social welfare, for the (observable) world with the project is labeled “partially observed path with project.” The BAU path is labeled “estimated BAU path,” and would have to be estimated using statistical techniques (see the practitioner’s guide for more information). Both the project and BAU social welfare paths are monetized measures of well-being for stakeholders in the system (i.e., the values of the flows of goods and services in each world). The resilience dividend, which in this case is conditional on the observed shock, is the net present value of the difference between the project and BAU paths. It is comprised of the co-benefits generated by the project, the increase in absorptive capacity from the project (which can be seen by the higher level of welfare with the project as opposed to the BAU case at the time of the shock), and the net benefits from improved recovery.
Figure 3.3. Valuing a Project with Co-Benefits and a Single Shock
SocialWelfare
timePresent Dayshock at time t
project creates co-benefits prior to (and
perhaps after ashock
partially-observedpath with project
estimated BAU path
Project Shock
SOURCE: Authors’ representation.
For additional archetypes, including an ex post evaluation with no co-benefits, ex post evaluation with a stressor, and ex ante evaluation, readers are referred to the practitioner’s guide.
37
Primary Challenges in Estimating the Resilience Dividend
Estimating the resilience dividend requires information about how well-being changes in two states of the world: one with the resilience project, and one with the BAU case. The difference between the two is the estimate of the resilience dividend.
The following are the primary challenges of estimating the resilience dividend:
1. We only observe one state of the world. The challenge with all evaluation methods that rely on observation “with” or “without” a given intervention is that only one of these actually happens in the real world. A community that undertakes a flood resil-ience project cannot, in retrospect, directly collect data about outcomes from a world in which that project was not implemented. As such, other means of estimating the counterfactual BAU outcomes are needed. We discuss this further in the next chapter.
2. Dealing with the universe of potential shocks and stressors is challenging. Although resilience projects can create additional co-benefits relative to an alternative, most are fundamentally related to maintaining or overcoming either a set of shocks or stressors. In the case of a backward-looking ex post analysis, the natural thing to do is use the observed shock(s) to estimate well-being for the project and BAU cases given shocks that actually happened. This approach, while practical, may ignore relevant shocks in the future, which may be different from shocks experienced in the past.
In the case of forward-looking ex ante cases, we can model how the system responds to shocks or stressors, ideally incorporating the reality that both are uncertain. The most important thing is to be clear about which shocks and stressors are being captured—or not—and analyzed.
3. Estimating the resilience dividend often requires considerable data. Calculating the resilience dividend requires that one understands the structure of complex, adaptive, and dynamic systems. Analyzing this type of system can require tremendous amounts of data, especially if the goal is to estimate the causal effect of a project on well-being.
In particular, the goal of the data collection exercise would be to capture as much of the project and BAU welfare paths as possible, or equivalently, to estimate the differential in well-being over the post-project time horizon. In practice, this will typically take the form of estimating the difference in goods and services flows that stakeholders value (including any co-benefits) and valuing the changes using either market prices or non-market values.
In many real-world cases, the amount of data about the resilience dividend will be lim-ited to a subset of the goods and services likely to change as a result of the project, and/or a limited time horizon (e.g., data at one or a few points in time). When consider-ing a data collection/evaluation plan that includes the resilience dividend, practitioners should prioritize data collection that highlights the parts of the resilience dividend that are of particular interest, recognizing that resources are scarce.

38
4. Establishing a causal relationship is difficult yet important. The resilience dividend is the difference in outcomes between a project that takes a resilience view and a coun-terfactual that does not. It is critically important that practitioners define and estimate an appropriate counterfactual, or BAU case, in order to quantify the resilience dividend (see the practitioner’s guide for more information). This means measuring or estimat-ing outcomes in both states of the world. Any analysis that relies on correlation alone will necessarily ignore common factors that may affect the system in both the project and BAU worlds, and thus might bias the resilience dividend calculation. The degree of bias will depend on the difference between the (unobservable) true BAU path and the estimated one.
For ex post settings, impact evaluation methods are a good option, but these methods are most successful when evaluation and the resilience dividend are incorporated early in the project lifecycle and where sufficient resources are available to carry out a poten-tially complex evaluation. For ex ante settings, simulation modeling can often provide estimates of the project and BAU paths.
For additional details about data collection and estimation, readers are referred to the practitioner’s guide.
39
CHAPTER 4
Case Studies using the RDVM
In this chapter, we apply the RDVM to six case studies selected for analysis by RAND, the Rockefeller Foundation, and the project’s advisory board. In each case, we applied the principles of the RDVM and attempted to quantify as many elements of the resilience divi-dend as possible.
RAND used pre-existing project documentation and data, which was not necessarily collected with the RDVM (or, for that matter, quantification of the resilience dividend) in mind. In some cases, little to no data existed, and time and resource constraints did not allow for addi-tional data collection. Nevertheless, we used these cases to explore the application of the model across a wide range of projects in the Rockefeller Foundation portfolio, in the hopes that such an exercise would lead to some understanding about the usefulness of both the theoretical and empirical approach embodied in the RDVM.
For each case presented below, we provide a preface-type statement that includes common text about the RDVM and a brief statement of the case’s perceived value, followed by a short sum-mary of the case. We then proceed with detailed analysis that generally includes some back-ground on the case, followed by a discussion of the elements of the specific system elements (e.g., capital stocks, goods and services, well-being, and other model elements and assump-tions) described in Chapter 3. We then discuss the empirical methods and data that were used (or in cases that lacked data, could be used) to generate the project and BAU paths, and present any results. We conclude each case study with some lessons learned from the case, which are compiled for further discussion in Chapter 5.
A summary of each case is provided in Table 4.1. For each, we provide a brief project descrip-tion, document if the evaluation was after project implementation (ex post) or prior to the resilience project (ex ante), the types of shocks and stressors involved, and whether or not suf-ficient data existed to estimate a partial resilience dividend. We also briefly describe the key case study results.
For more general information about the primary case archetypes that practitioners might encounter, readers are referred to the practitioner’s guide.
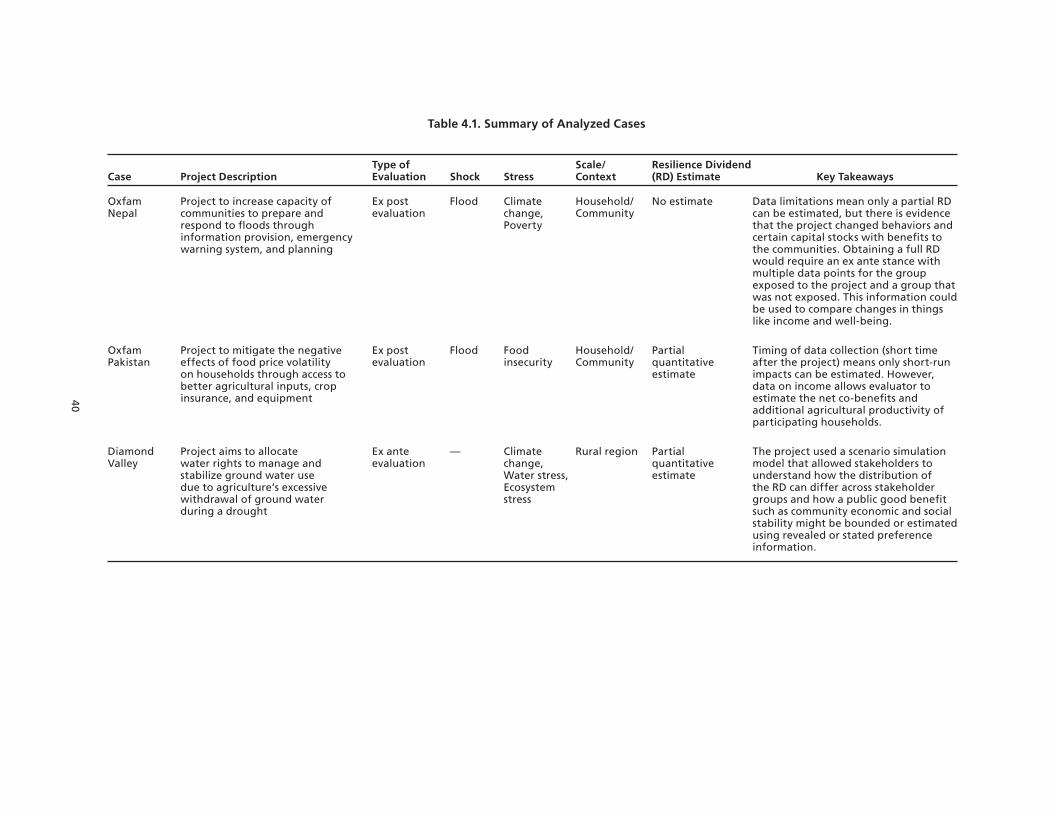
40
Table 4.1. Summary of Analyzed Cases
Case Project Description Type of Evaluation Shock Stress
Scale/ Context
Resilience Dividend (RD) Estimate Key Takeaways
Oxfam Nepal
Project to increase capacity of communities to prepare and respond to floods through information provision, emergency warning system, and planning
Ex post evaluation
Flood Climate change, Poverty
Household/ Community
No estimate Data limitations mean only a partial RD can be estimated, but there is evidence that the project changed behaviors and certain capital stocks with benefits to the communities. Obtaining a full RD would require an ex ante stance with multiple data points for the group exposed to the project and a group that was not exposed. This information could be used to compare changes in things like income and well-being.
Oxfam Pakistan
Project to mitigate the negative effects of food price volatility on households through access to better agricultural inputs, crop insurance, and equipment
Ex post evaluation
Flood Food insecurity
Household/ Community
Partial quantitative estimate
Timing of data collection (short time after the project) means only short-run impacts can be estimated. However, data on income allows evaluator to estimate the net co-benefits and additional agricultural productivity of participating households.
Diamond Valley
Project aims to allocate water rights to manage and stabilize ground water use due to agriculture’s excessive withdrawal of ground water during a drought
Ex ante evaluation
— Climate change, Water stress, Ecosystem stress
Rural region Partial quantitative estimate
The project used a scenario simulation model that allowed stakeholders to understand how the distribution of the RD can differ across stakeholder groups and how a public good benefit such as community economic and social stability might be bounded or estimated using revealed or stated preference information.

41
Table 4.1.—Continued
Case Project Description Type of Evaluation Shock Stress
Scale/ Context
Resilience Dividend (RD) Estimate Key Takeaways
Forest Bond
Project tries to shift forest restoration costs to entities that benefit from public forests
Ex ante evaluation
— Climate change, Ecosystem stress
Rural region Partial quantitative estimate
Without a defined project area, the ability to estimate an RD is limited to upper and lower bounds in changes in the ecosystem services like less severe fires, increased water runoff, and better water quality. As an ex ante case, the cost of restoration, value of forest products harvested in the restoration and change in water runoff) are part of the RD.
ISET Da Nang, Vietnam
Project implemented typhoon-resilient housing with grants, revolving loans, savings, and information and training programs
Ex post evaluation
Storm events
Climate change, Poverty
Household No estimate Without project outcome data, it is not possible to estimate the RD of a project. Therefore, data collection considerations in the project design are vital to producing an estimate.
ADB Bangladesh
Project co-finances investments in climate adaptive infrastructure and social systems
Ex -ante evaluation
Storm events
Climate change, Ecosystem stress
Urban cities No estimate To calculate the RD of a project before it is complete, it is advisable to use a pre-project estimate approach on disaster risk reduction, broad-based development for community resilience, and economic development investments, and it is important to define a counterfactual BAU case to measure the dividend against.
SOURCE: Authors’ analysis.
42
Oxfam Nepal
This case study is based on the RDVM. It provides a demonstration of how the RDVM can be applied in real-world situations. The case can be read on its own, but it is part of a broader package that includes five other case studies presented in Chapter 4 and the lessons learned from all the cases in Chapter 5. This case study is intended primarily to help readers under-stand how to apply the RDVM framework, given a set of data or information about a given project. Any estimate of the resilience dividend is provided as an example and is not necessarily a complete estimate.
The Oxfam flood mitigation project in Nepal is an example of calculating the resilience divi-dend in an ex post case with a single shock. The case highlights the role that RDVM can play in ex post analysis, the challenge of aggregating individual as well as community-level welfare, and how analyzing the resilience dividend from a single shock may be complicated by not observing the level of the shock and only its damage. This case does not provide a numerical estimate of the resilience dividend but offers some initial considerations when contemplating using the RDVM in an ex post situation.
Executive Summary
Oxfam conducted an intervention in 10 communities in Nepal from April 2011 through March 2013 in partnership with Integrated Development Society, a local non-governmental organization. The objective of the intervention was to increase the capacity of the communities to prepare and respond to disasters, especially flooding, by providing educational information to households, establishing an early warning system, and developing community planning processes to prepare for floods. RAND used the RDVM to attempt to estimate a resilience dividend to demonstrate the benefits of Oxfam’s investments compared to the status quo.
The data were collected by Oxfam as part of an effectiveness review and were not collected with RAND’s framework in mind.1 Key data collected in the household survey included information about household assets, crop production and livestock holdings for 2013 (and “recall” data for 2010 crop choice and 2010 livestock that survey respondents reported from memory); livestock holdings in 2010 (recall data) and 2013; limited loss data for a 2012 flood-ing event; limited income change data between 2010 and 2013; and information about warn-ings given and protective actions taken with regard to the 2012 flood. Data were collected for both intervention and BAU communities, akin to a treatment-and-control framework.
The resilience dividend is defined as the difference in outcomes between interventions that take a resilience view and those that do not. Outcomes are typically related to the ability of “people to better withstand disruption in the future, to improve current situations, and/or to positively change the trajectory of a place and/or people’s lives.” Thus, the resilience dividend can be broadly interpreted as the total net expected benefits of a project or portfolio designed with a resilience lens over time, as compared to a chosen baseline.
1 The Oxfam effectiveness reviews are ex post, quasi-experimental analysis to consider the effect of the program right after the project has been completed. The effectiveness reviews were not designed to collect data for the RDVM, and we have done our best to use the data collected and provided by Oxfam to estimate a portion of the resilience dividend.
43
In the case of Oxfam’s intervention in Nepal, the baseline or BAU case is no intervention. The resilience intervention consisted of four major components:
1. Form disaster management committees to develop risk management plans and increase awareness of disaster risk reduction approaches;
2. Build small-scale community-based mitigation measures such as flood protection, land-slide protection, and tree planting;
3. Provide community training on hazards, first aid, and search and rescue; and
4. Establish a community-based flood early-warning system.
Key case elements are reported in Table 4.2.
Is There Evidence of a Resilience Dividend?
We were not able to quantify a partial resilience dividend. Given the available data, we were unable to properly control for differences in risk across households in the intervention and BAU communities, which prevented us from being able to consistently quantify how changes in behavior resulted in more positive outcomes after a flood in 2012. In particular, the non-random assignment of the project to intervention communities (instead of targeting those most vulnerable) coupled with a lack of hydrological and other data about the 2012 flood resulted in a likely statistical problem that violated the “common trends” assumption used to identify causal effects in statistical models. As such, we were not able to calculate a partial resilience dividend.
However, we do have some quantitative evidence that the intervention may have generated a positive dividend: namely, that the intervention appeared to change behavior in the interven-tion communities to reduce disaster risk. Some households changed cropping patterns and were more likely to take personal actions to protect against flooding. In terms of the public good, intervention households were considerably more likely to receive early warning of the 2012 flood, communicate this information to others, help their neighbors, and engage in search-and-rescue efforts. Furthermore, we have evidence that individuals trust their community lead-ers more after the intervention, leading to increases in social capital. While we do not have the appropriate data to quantify these benefits, it seems likely that the intervention increased the absorptive and adaptive capacities of the intervention communities, enhancing their ability to withstand a shock from flooding compared to the BAU communities.
Table 4.3 provides a summary of the possible elements of the resilience dividend for this inter-vention and the evidence available for each.
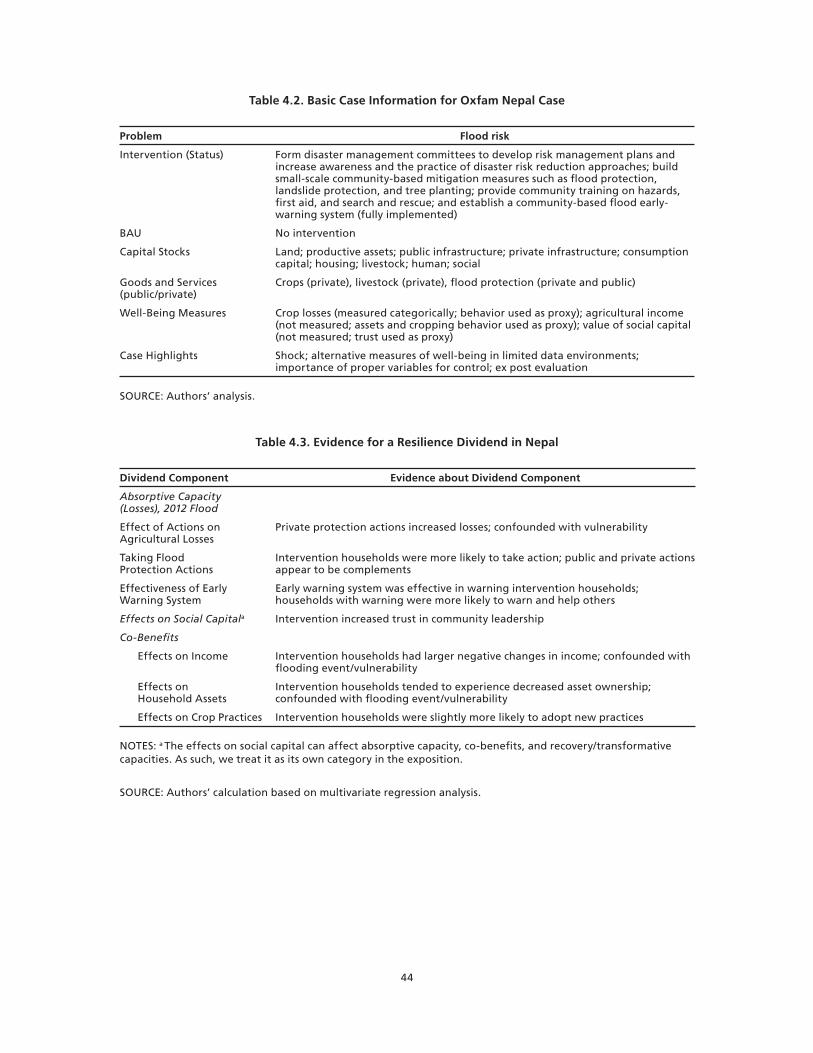
44
Table 4.2. Basic Case Information for Oxfam Nepal Case
Problem Flood risk
Intervention (Status) Form disaster management committees to develop risk management plans and increase awareness and the practice of disaster risk reduction approaches; build small-scale community-based mitigation measures such as flood protection, landslide protection, and tree planting; provide community training on hazards, first aid, and search and rescue; and establish a community-based flood early-warning system (fully implemented)
BAU No intervention
Capital Stocks Land; productive assets; public infrastructure; private infrastructure; consumption capital; housing; livestock; human; social
Goods and Services (public/private)
Crops (private), livestock (private), flood protection (private and public)
Well-Being Measures Crop losses (measured categorically; behavior used as proxy); agricultural income (not measured; assets and cropping behavior used as proxy); value of social capital (not measured; trust used as proxy)
Case Highlights Shock; alternative measures of well-being in limited data environments; importance of proper variables for control; ex post evaluation
SOURCE: Authors’ analysis.
Table 4.3. Evidence for a Resilience Dividend in Nepal
Dividend Component Evidence about Dividend Component
Absorptive Capacity (Losses), 2012 Flood
Effect of Actions on Agricultural Losses
Private protection actions increased losses; confounded with vulnerability
Taking Flood Protection Actions
Intervention households were more likely to take action; public and private actions appear to be complements
Effectiveness of Early Warning System
Early warning system was effective in warning intervention households; households with warning were more likely to warn and help others
Effects on Social Capitala Intervention increased trust in community leadership
Co-Benefits
Effects on Income Intervention households had larger negative changes in income; confounded with flooding event/vulnerability
Effects on Household Assets
Intervention households tended to experience decreased asset ownership; confounded with flooding event/vulnerability
Effects on Crop Practices Intervention households were slightly more likely to adopt new practices
NOTES: a The effects on social capital can affect absorptive capacity, co-benefits, and recovery/transformative capacities. As such, we treat it as its own category in the exposition.
SOURCE: Authors’ calculation based on multivariate regression analysis.

45
Oxfam-Nepal Intervention Background 2
Oxfam conducted an intervention in ten communities in Nepal from April 2011 through March 2013 in partnership with Integrated Development Society, a local non-governmental organization. The overarching objective was to enhance disaster risk reduction for the inter-vention communities through a combination of planning, education, and infrastructure improvements.
The four main objectives that Oxfam hoped to achieve through the intervention were to:
1. Increase the capacity of target communities to prepare for and respond to disasters;
2. Establish a community-based early-warning system;
3. Strengthen emergency-management capacity in three target districts and two municipalities in Kathmandu Valley through coordinated preparedness capacity-building at national and regional levels; and
4. Integrate disaster risk reduction into local development planning, at district and village development committee levels, with a strong institutional base.
To achieve these goals, four major categories of activities were done for treated households:
1. Formed disaster management committees to develop risk management plans and increase awareness and the practice of disaster risk reduction approaches;
2. Built small-scale community-based mitigation measures such as flood protection, landslide protection, and tree planting;
3. Provide community training on hazards, first aid, and search and rescue; and
4. Establish a community-based flood early-warning system.
Within our conceptual framework, activities 2 and 4 constitute new forms of capital stocks, and activities 1 and 3 work to change the production process3 through behavioral changes at the individual and community level. The interventions were designed to increase both absorp-tive and recovery capacities, but may have also affected transformational capacity as well, espe-cially through changes in behavior and social capital.
In September 2012, there was widespread flash flooding that affected both treatment and com-parison communities that we are partially able to use to understand the response of the system to a flooding event.
2 Information about the intervention comes from the effectiveness review published by Oxfam: Bishop, D. (2014). “Resilience in Nepal: Evaluation of mainstreaming disaster risk reduction and enhancing response capability.” Effectiveness Review Series 2013/14. London: Oxfam GB.
3 This is akin to the allocation mechanism in the inclusive wealth theory.
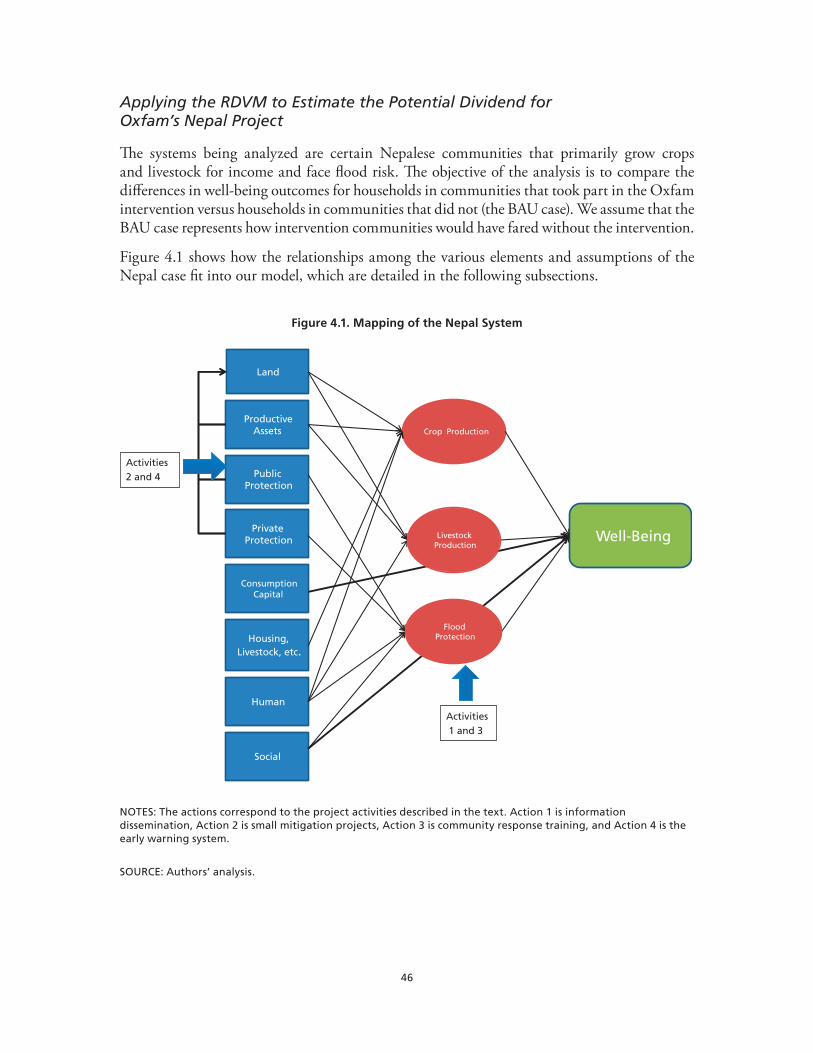
46
Applying the RDVM to Estimate the Potential Dividend for Oxfam’s Nepal Project
The systems being analyzed are certain Nepalese communities that primarily grow crops and livestock for income and face flood risk. The objective of the analysis is to compare the differences in well-being outcomes for households in communities that took part in the Oxfam intervention versus households in communities that did not (the BAU case). We assume that the BAU case represents how intervention communities would have fared without the intervention.
Figure 4.1 shows how the relationships among the various elements and assumptions of the Nepal case fit into our model, which are detailed in the following subsections.
Figure 4.1. Mapping of the Nepal System
Land
Productive Assets
Public Protection
Private Protection
Consumption Capital
Housing, Livestock, etc.
Human
Social
Crop Production
Well-BeingLivestock Production
Flood Protection
Activities1 and 3
Activities2 and 4
NOTES: The actions correspond to the project activities described in the text. Action 1 is information dissemination, Action 2 is small mitigation projects, Action 3 is community response training, and Action 4 is the early warning system.
SOURCE: Authors’ analysis.
47
Capital Stocks
There are seven main sets of capital stocks in the system (represented by the blue rectangles in Figure 4.1):
1. Land used for agricultural production;
2. Productive assets used for agricultural production;
3. Flood protection capital (public and private);
4. Consumption-based capital stocks;
5. Housing, livestock containment, and storage stocks;
6. Human capital; and
7. Social capital.
These seven capital stocks are used to produce goods and services that impact well-being; in addition to the capital stocks are consumption-based stocks, which are assumed to directly impact well-being but are not used to produce goods and services.
Land-based capital stocks are allocated to the production of crops and livestock. For our pur-poses, we consider land to be a fundamental capital stock to which a household can allocate various income-generating activities (e.g., crops and livestock) through a particular production function (especially crop choice), with land quality represented by productivity (fertility).
Productive assets—ploughs, axes, shovels, etc.—are directly used in the production of crops. It is possible that the project could (directly or indirectly) incentivize investment in productive assets; these enhancements could increase agricultural production and result in new produc-tion relationships (through new technologies or relaxed constraints).
Flood protection capital can come in two forms: community-based (public) flood protection and private flood protection that a household constructs to protect its land from floods. We assume that this infrastructure is designed to mitigate flood-related damage.
Consumption-based capital involves assets that a household values in terms of information or entertainment, such as televisions, radios, or DVD players. Additionally, households have durable capital stocks of housing, livestock containment, and storage. Essentially, increased own-ership of these assets as a result of a project intervention can be considered improvements in income/well-being, as they do not necessarily expand the household’s productive assets.
Human capital stocks take two forms: knowledge and quantity (household size). While the latter is largely outside our project’s parameters, the former is especially important in this case because a key element of the intervention is information provision. Changes in exposure to information (presumably through the intervention) can change behavior, which in turn can 1) mitigate the damages associated with flood events (disaster risk and recovery benefits), and 2) augment adaptive capacities through alternative production relationships (see the subsection on the allocation mechanism below).

48
Finally, there are both community-based social capital—best described as trust in the leader-ship—and social networks that households may call upon in times of need. The intervention’s training element helps to develop the skills and relationships necessary to enhance recovery capacity during and immediately after a flood.
Goods and Services
Goods and services in the model are represented as red ovals in Figure 4.1. The focus of the intervention is improving flood preparedness and responses to decrease harm to people’s lives and damage to property. Promoting flood protection was the primary approach. However, it is possible that the intervention would have provided additional benefits (or costs) even in the absence of flooding. For example, the intervention’s efforts to improve how farmers produce crops and livestock could help them generate greater income. Given that the Nepalese commu-nities being analyzed are agrarian, the focus on agricultural output allows us to target house-holds’ main livelihood as an additional measure of overall well-being.
Although they are formally represented in Figure 4.1 as capital stocks, consumption-based assets such as DVD players or televisions may also provide a way to measure well-being since asset ownership and income are often strongly correlated. These consumption goods provide ser-vices that can directly impact the welfare of households.
Finally, social bonds and trust also directly impact well-being. Social capital might engender new opportunities for development, or trust might enable changes in other outcomes (such as communicating early warnings to neighbors so they have time to better protect themselves and their property). So, as with consumption-based capital assets, Figure 4.1 shows social capital directly influencing household well-being.
Well-Being
Measures of well-being in the model are closely related to the good and services discussed above. Damage (including loss of crops, other property, and life) is a direct measure of well-being after a flood, though the data include only crop losses and mitigating behavior. Agricul-tural income provides another measure of overall private well-being that might be enhanced without a shock; because the data does not include this metric directly, we utilize assets own-ership and cropping behaviors as proxies. Finally, as mentioned in the previous subsection, households may value social capital in and of itself (rather than for its impact on absorptive and adaptive capacities), suggesting that it may be an element of the social welfare function. Having no direct way to quantify these values, we used data on the level of trust that house-holds have in their community leadership as a proxy.
Allocation Mechanism
The intervention attempts to change behavior, which can affect a household’s capital stocks and its allocation and production decisions. For example, the intervention establishes disaster management committees that develop disaster management plans and disseminate informa-tion; as a result, farmers may change how they allocate land to crops and livestock (i.e., rotat-ing crops or cattle grazing patterns). The intervention can also affect people’s behavior prior to
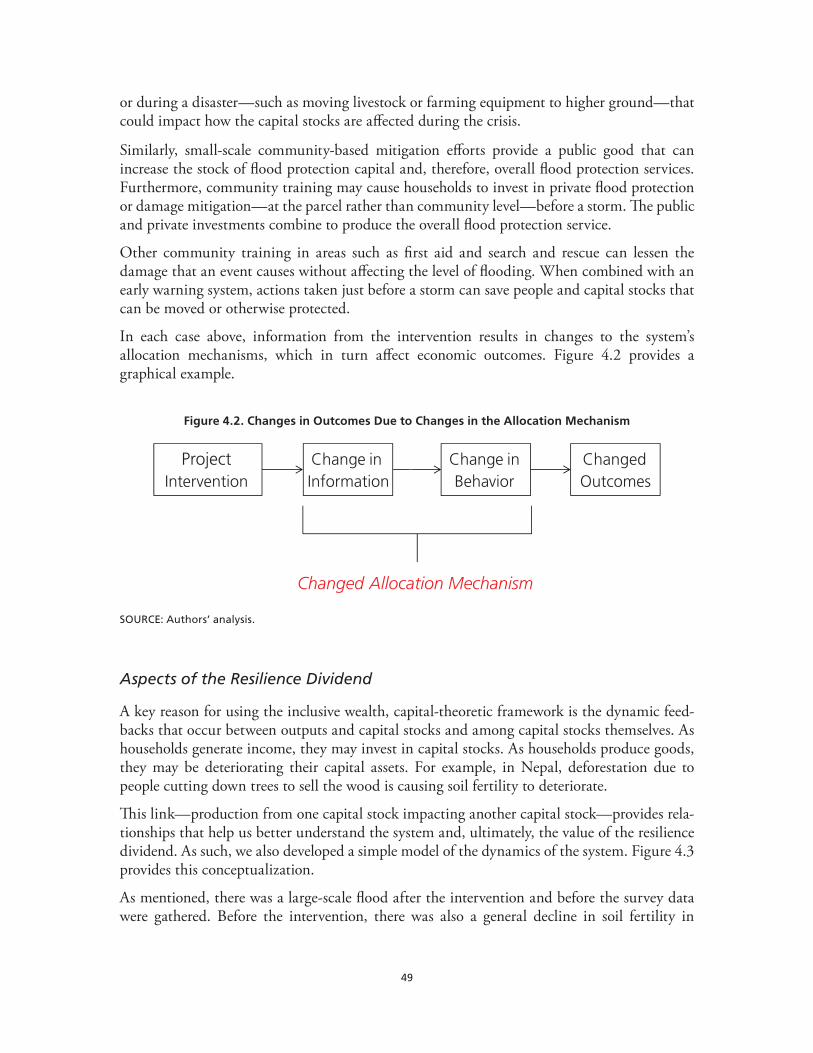
49
or during a disaster—such as moving livestock or farming equipment to higher ground—that could impact how the capital stocks are affected during the crisis.
Similarly, small-scale community-based mitigation efforts provide a public good that can increase the stock of flood protection capital and, therefore, overall flood protection services. Furthermore, community training may cause households to invest in private flood protection or damage mitigation—at the parcel rather than community level—before a storm. The public and private investments combine to produce the overall flood protection service.
Other community training in areas such as first aid and search and rescue can lessen the damage that an event causes without affecting the level of flooding. When combined with an early warning system, actions taken just before a storm can save people and capital stocks that can be moved or otherwise protected.
In each case above, information from the intervention results in changes to the system’s allocation mechanisms, which in turn affect economic outcomes. Figure 4.2 provides a graphical example.
Figure 4.2. Changes in Outcomes Due to Changes in the Allocation Mechanism
Project Intervention
Change inBehavior
Changed Allocation Mechanism
Change inInformation
ChangedOutcomes
SOURCE: Authors’ analysis.
Aspects of the Resilience Dividend
A key reason for using the inclusive wealth, capital-theoretic framework is the dynamic feed-backs that occur between outputs and capital stocks and among capital stocks themselves. As households generate income, they may invest in capital stocks. As households produce goods, they may be deteriorating their capital assets. For example, in Nepal, deforestation due to people cutting down trees to sell the wood is causing soil fertility to deteriorate.
This link—production from one capital stock impacting another capital stock—provides rela-tionships that help us better understand the system and, ultimately, the value of the resilience dividend. As such, we also developed a simple model of the dynamics of the system. Figure 4.3 provides this conceptualization.
As mentioned, there was a large-scale flood after the intervention and before the survey data were gathered. Before the intervention, there was also a general decline in soil fertility in

50
the region driven partially by deforestation (shown by the descending line on the left side of Figure 4.3). Declining fertility should reduce agricultural production and, therefore, reduce well-being.
Did the intervention have an impact? Before the flood, any divergence in the paths of the intervention and BAU communities (as shown in Figure 4.3) was likely due to the intervention and is evidence of a positive resilience dividend arising from the co-benefits associated with the project. After the flood, if the intervention were successful, well-being for both interven-tion and BAU households would decline, but less so for intervention households than for BAU households. We label this the potential “absorption” benefit from the project, in that the proj-ect was able to mitigate or absorb the damage from a shock.
Once a shock has occurred, the recovery process may be different for the intervention and BAU households. The differential includes any changes in co-benefits and in the ability of the system to recover post-shock that can be attributed to the intervention.
Figure 4.3. Notional Absorption, Recovery, and Co-Benefits from the Intervention
time
Well-Being
Control
Treatment
Data Collection
Declining Soil Fertility
AbsorptionBenefit Recovery
Benefit
Project
SOURCE: Authors’ analysis.
Empirical Methods
In general, the resilience dividend is defined as the difference in net benefits from a project developed with a resilience lens relative to the BAU. The broad idea is to isolate the effects of the “treatment” (in this case, Oxfam’s project) on outcomes of interest within the system compared to what would have happened absent that treatment, and then attributing any dif-ferences to the treatment itself. One way to perform the analysis is to split the sample into a treatment group that is exposed to a project and a control group that is not, and compare their

51
outcomes at two or more points in time. This is based on the “parallel trends” assumption that the groups would have otherwise turned out the same. However, when there is only one period of data before the treatment period (as in this case), it is impossible to verify this assumption other than through qualitative argument.
Data
The data for this analysis come from an Oxfam effectiveness review and were anonymized by the UK Data Service. A number of different aspects to the data warrant discussion.
First, Oxfam’s use of intervention and BAU communities is a quasi-experimental design, but this is not a randomized controlled trial. Instead, intervention “communities were deliberately chosen by the partners as being particularly vulnerable or particularly in need of support in building risk-reduction capacity.”4 Comparison communities were identified after the interven-tion and chosen for their proximity to the project communities. Because communities were not chosen at random, these comparison households do not necessarily represent what would have happened to the intervention households had the intervention not occurred. Oxfam deployed surveys in all 10 communities where project activities were implemented and, through its proj-ect partners, identified 10 additional comparison communities that were thought to have simi-lar characteristics based on their proximity to the intervention communities. Survey respon-dents were randomly selected (every fourth house). If no one was present at the selected house, the next house was chosen, and then the four houses after that. A total of 260 intervention households and 350 control households were surveyed for a total of 610 responses.
Second, the survey gathered data on a variety of household characteristics consistent with our conceptual model. It gathered metrics associated with:
• assets (both productive and consumptive) for 2013 and recall data for 2010;
• crop production by crop type for the 2013 season and recall data of crop choice (yes/no for 8 crops and an “others” category) in 2010;
• livestock data in 2013 and recall data in 2010;
• adoption of alternative crop production activities between 2010 and 2013;
• behavioral decisions regarding private protection measures taken by the household between 2010 and 2013;
• crop production area in 2010 and 2013;
• self-reported soil fertility change (increase or decrease) between 2010 and 2013;
• income changes between 2010 and 2013;
• knowledge of community-level activities regarding floods in 2013;
• distances to river, roads, and markets;
4 Bishop, D. (2014). “Resilience in Nepal: Evaluation of mainstreaming disaster risk reduction and enhancing response capability.” Effectiveness Review Series 2013/14. London: Oxfam GB:14.
52
• loss data from the 2012 event including:
categorical crop losses;,
livestock losses, and
damage to structures;
• access to credit and savings in 2013;
• other forms of income beyond agriculture in 2013;
• whether they received an early warning about the 2012 storm;
• what actions they took following the early warning in 2012;
• opinion data on community leaders’ ability to help in times of stress in 2013.
As the list of metrics suggests, there is considerable household-level data, but baseline commu-nity characteristics associated with flooding are lacking. In particular, forest management is usually performed at the community level, but data regarding differences in the use of forests and therefore the potential for mitigating activities are not available. Although there is con-siderable detail about 2013 crop production, the limited recall data do not allow us to fully compare crop production before and after the intervention.5 In an ideal data world, we could exploit the treatment and control differences as well as differences between those that expe-rienced the flood in 2012 and those that did not for both intervention and BAU households. This would allow us to estimate the project and control paths post-project and pre-shock in Figure 4.3, as well as the difference in damage at the time of the shock and the intervention and in control paths post-shock. However, the data structure associated with this case does not allow us to do this analysis.
Finally, the quasi-experimental strategy relies on using the data on non-intervention house-holds to estimate the likely path of the intervention group if it had not participated in Oxfam’s project, holding everything else constant. This works well if the intervention and BAU groups are either very similar or if we can control for differences in attributes.6 If, however, there are systemic differences across the intervention and control households that cannot be represented
5 The other limitation of recall data is that it is often less accurate than asking individuals about their current situation. An individual’s inability to remember what choices they made or what things they consumed months or years prior can introduce measurement error or bias to the data, which can affect the analysis. For this reason, an ideal evaluation approach is to collect baseline data prior to the evaluation and later conduct a follow-up survey (or surveys) after the intervention.
6 We estimate the effect of the treatment using a nearest neighbor matching approach as well as a multivariate regression approach. The nearest neighbor approach matches households from treatment to control households based on a set of matching variables that are closest to each other in the matching variables space. Our set of matching variables are household’s size; number of adults in the household; whether the head of the household was female; whether the household received remittances in 2010; whether the household engaged in casual employment in 2010; whether the household engaged in formal employment in 2010; whether the household owned a business in 2010; whether the household engaged in crop production in 2010; whether the household owned livestock in 2010; total cropping area in 2010; proportion of land vulnerable to erosion; proportion of land vulnerable to sanding and siltification; proportion of the land close to the river; distance to the river; distance to the nearest road; and distance to the nearest market.

53
with the data, then the claim that the intervention caused the differences in results may be questioned, and estimates of the effect of the intervention may be biased.
Unfortunately, this appears to be the case for the Nepal study. We have limited recall data pre-project (in 2010) and more detailed data post-project and post-shock (2013) for the interven-tion and BAU groups. Abstracting away from the differences in detail, we note that the two years span both the project and the flood, so differences in the treatment and control groups in 2013 reflect a) inherent differences between intervention and BAU groups; b) co-benefits (or costs) resulting from the project; and c) increases (or decreases) in absorptive capacity and asso-ciated recovery paths. The inherited data structure is not well-suited for disentangling these effects. Especially troubling is that it is likely that households in the intervention communities experienced losses of greater magnitude since they were more vulnerable to flooding, resulting in statistical issues that complicate the establishment of causality.
Resilience Dividend Results
Below, we provide empirical evidence related to the elements of the model that could, in theory, produce a resilience dividend for the Oxfam–Nepal project. We split our results into two major sections: one about the potential change in absorptive capacity in the intervention group and one about co-benefits of the project. Readers should keep in mind the inherent data limitations associated with this case.
Potential Change in Absorptive Capacity for Intervention Households
The following sections provide evidence for an absorptive capacity-related resilience dividend conditional on the 2012 flood.
Agricultural Losses Following the 2012 Flood
The survey asked respondents to categorize their crop loss during the 2012 storm in one of five ways: (1) No crop loss, (2) a small proportion was lost, (3) less than half was lost, (4) more than half was lost, and (5) almost everything was lost. Given that all communities participating in the intervention may have been exposed to new production actions but not all would necessar-ily adopt them, we first estimated the impact of public and private mitigation actions on the categories of crop losses (controlling for observed differences in households and not exploiting the treatment/control group structure).
As shown in the second column of Table 4.4, results demonstrated the counterintuitive result that only private flood protection has a significant impact on crop losses7—but households that installed private protection were more likely to experience larger losses. The result was the same when we restricted this exercise to only intervention households. Coupled with the fact that Oxfam chose to intervene in communities that were more likely to be vulnerable (and thus more likely to sustain crop losses), these results suggest a confounding effect that may bias the empirical models. In particular, an unobserved vulnerability such as hydrological risk is likely
7 We report results at the 5% significance level.

54
contaminating the estimates of the impact of mitigating behaviors.8 Furthermore, the results suggest that the scale of the protection measures was too small compared to the severity of the flood to adequately protect the community or individual households from crop losses.
Table 4.4. Impact of Behavioral Actions on Crop Loss
Behavioral ActionCoefficient on Crop Loss
Change in Probability of Action from Project Exposure
Private Protection 0.28*** 16%***
Change Crop Patterns 0.07 -3%
Move Livestock 0.34* -8%***
Move Goods 0.28 -8%***
Improve Livestock Area -0.11 -6%***
Move House -0.18 -5%**
Improve House 0.12 -4%
Public Flood Protection 0.49 n/a
Public Landslide Protection -0.37 n/a
Public Tree Planting -0.03 n/a
Interaction Public/Private Protection -0.11 n/a
NOTES: *, **, and *** represent significance at the 10%, 5%, and 1%, respectively. Individuals had no choice to make with respect to public actions. The first results column shows the marginal effect of adopting a behavioral action on agricultural losses. The second results column shows the marginal effect of the intervention on the probability of taking the behavioral action. So, for example, taking private protection actions is estimated to increase crop loss, but intervention households are more likely to take private protection actions.
SOURCE: Authors’ analysis.
Taking Flood Protection Actions
Given these statistical issues, we next ask whether the intervention changed the probability that households took additional mitigating measures. In essence, this procedure can help over-come conditioning on a single (perhaps overwhelming) shock and provide evidence of a poten-tial resilience dividend driven by behavioral changes as a direct result of the intervention.
However, comparison households were more likely than intervention households to adopt all actions except private flood protection, as shown in the third column of Table 4.4. One hypothesis to explain this result is that intervention households believe that both private and public protection measures are substitutes for other actions (like changing crop patterns, moving livestock, etc.) and that public and private protections are complements to each other. That is, if the community takes public protective actions, a household is more likely to take private protection actions as well.
8 Formally, in a regression context, there is an endogeneity problem.
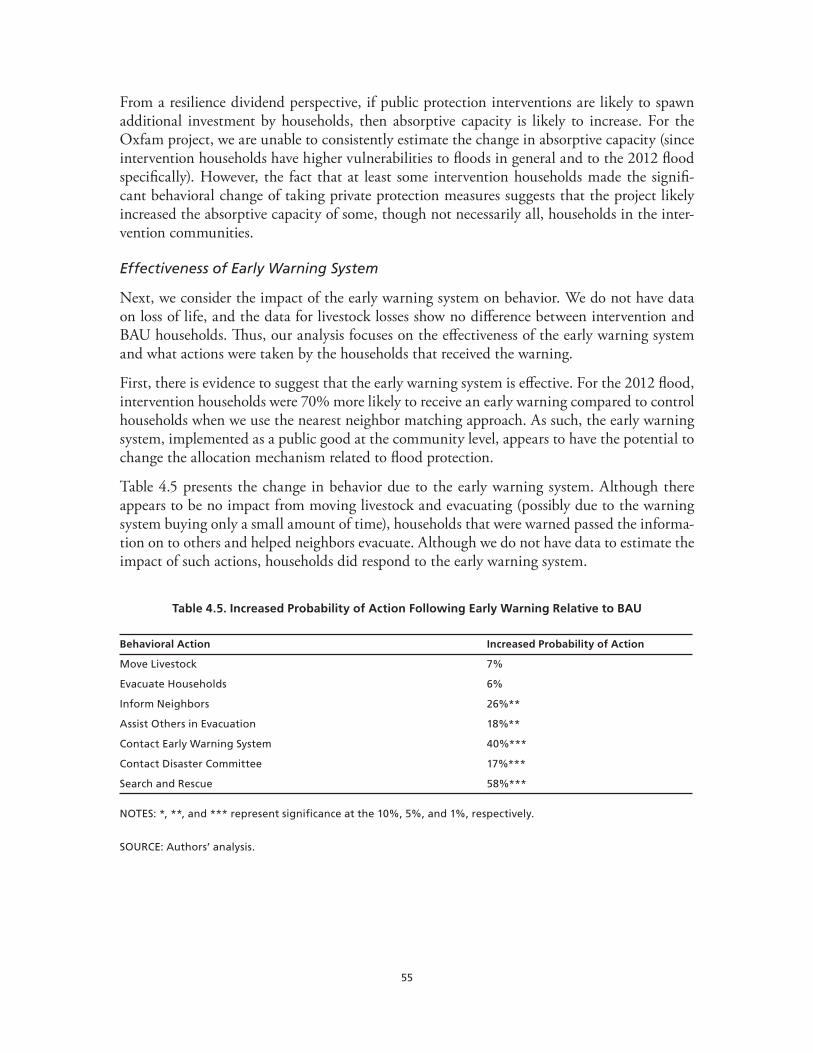
55
From a resilience dividend perspective, if public protection interventions are likely to spawn additional investment by households, then absorptive capacity is likely to increase. For the Oxfam project, we are unable to consistently estimate the change in absorptive capacity (since intervention households have higher vulnerabilities to floods in general and to the 2012 flood specifically). However, the fact that at least some intervention households made the signifi-cant behavioral change of taking private protection measures suggests that the project likely increased the absorptive capacity of some, though not necessarily all, households in the inter-vention communities.
Effectiveness of Early Warning System
Next, we consider the impact of the early warning system on behavior. We do not have data on loss of life, and the data for livestock losses show no difference between intervention and BAU households. Thus, our analysis focuses on the effectiveness of the early warning system and what actions were taken by the households that received the warning.
First, there is evidence to suggest that the early warning system is effective. For the 2012 flood, intervention households were 70% more likely to receive an early warning compared to control households when we use the nearest neighbor matching approach. As such, the early warning system, implemented as a public good at the community level, appears to have the potential to change the allocation mechanism related to flood protection.
Table 4.5 presents the change in behavior due to the early warning system. Although there appears to be no impact from moving livestock and evacuating (possibly due to the warning system buying only a small amount of time), households that were warned passed the informa-tion on to others and helped neighbors evacuate. Although we do not have data to estimate the impact of such actions, households did respond to the early warning system.
Table 4.5. Increased Probability of Action Following Early Warning Relative to BAU
Behavioral Action Increased Probability of Action
Move Livestock 7%
Evacuate Households 6%
Inform Neighbors 26%**
Assist Others in Evacuation 18%**
Contact Early Warning System 40%***
Contact Disaster Committee 17%***
Search and Rescue 58%***
NOTES: *, **, and *** represent significance at the 10%, 5%, and 1%, respectively.
SOURCE: Authors’ analysis.
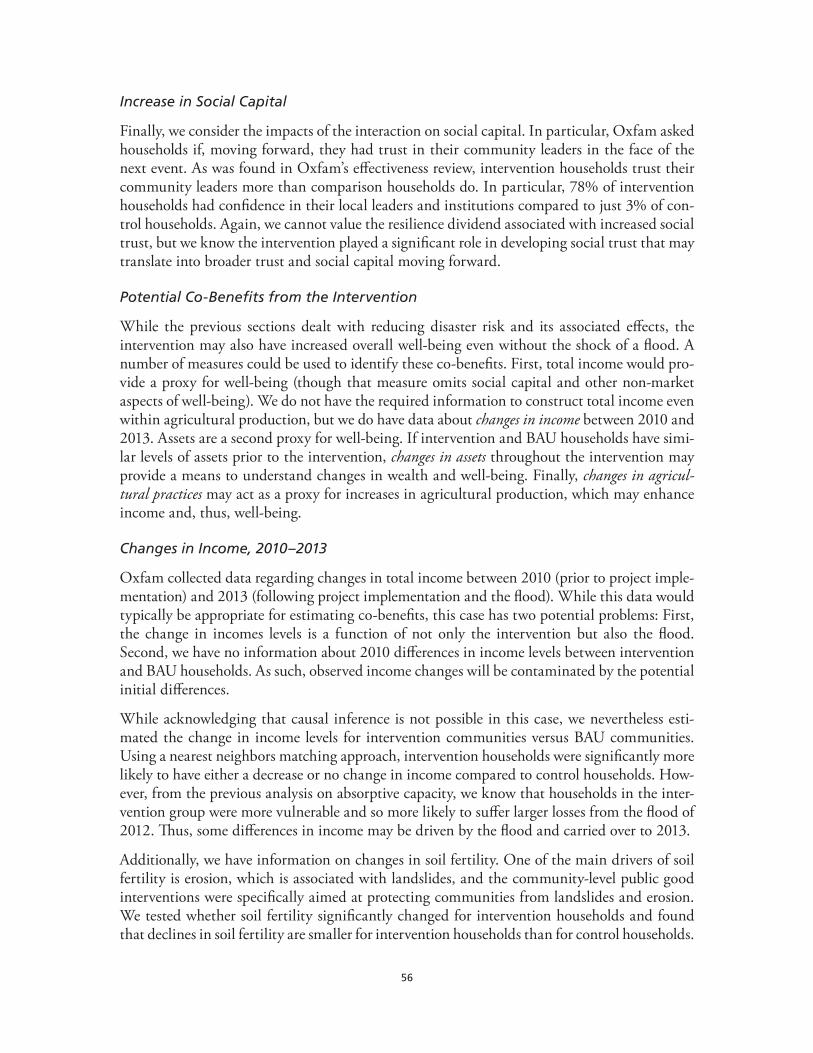
56
Increase in Social Capital
Finally, we consider the impacts of the interaction on social capital. In particular, Oxfam asked households if, moving forward, they had trust in their community leaders in the face of the next event. As was found in Oxfam’s effectiveness review, intervention households trust their community leaders more than comparison households do. In particular, 78% of intervention households had confidence in their local leaders and institutions compared to just 3% of con-trol households. Again, we cannot value the resilience dividend associated with increased social trust, but we know the intervention played a significant role in developing social trust that may translate into broader trust and social capital moving forward.
Potential Co-Benefits from the Intervention
While the previous sections dealt with reducing disaster risk and its associated effects, the intervention may also have increased overall well-being even without the shock of a flood. A number of measures could be used to identify these co-benefits. First, total income would pro-vide a proxy for well-being (though that measure omits social capital and other non-market aspects of well-being). We do not have the required information to construct total income even within agricultural production, but we do have data about changes in income between 2010 and 2013. Assets are a second proxy for well-being. If intervention and BAU households have simi-lar levels of assets prior to the intervention, changes in assets throughout the intervention may provide a means to understand changes in wealth and well-being. Finally, changes in agricul-tural practices may act as a proxy for increases in agricultural production, which may enhance income and, thus, well-being.
Changes in Income, 2010–2013
Oxfam collected data regarding changes in total income between 2010 (prior to project imple-mentation) and 2013 (following project implementation and the flood). While this data would typically be appropriate for estimating co-benefits, this case has two potential problems: First, the change in incomes levels is a function of not only the intervention but also the flood. Second, we have no information about 2010 differences in income levels between intervention and BAU households. As such, observed income changes will be contaminated by the potential initial differences.
While acknowledging that causal inference is not possible in this case, we nevertheless esti-mated the change in income levels for intervention communities versus BAU communities. Using a nearest neighbors matching approach, intervention households were significantly more likely to have either a decrease or no change in income compared to control households. How-ever, from the previous analysis on absorptive capacity, we know that households in the inter-vention group were more vulnerable and so more likely to suffer larger losses from the flood of 2012. Thus, some differences in income may be driven by the flood and carried over to 2013.
Additionally, we have information on changes in soil fertility. One of the main drivers of soil fertility is erosion, which is associated with landslides, and the community-level public good interventions were specifically aimed at protecting communities from landslides and erosion. We tested whether soil fertility significantly changed for intervention households and found that declines in soil fertility are smaller for intervention households than for control households.
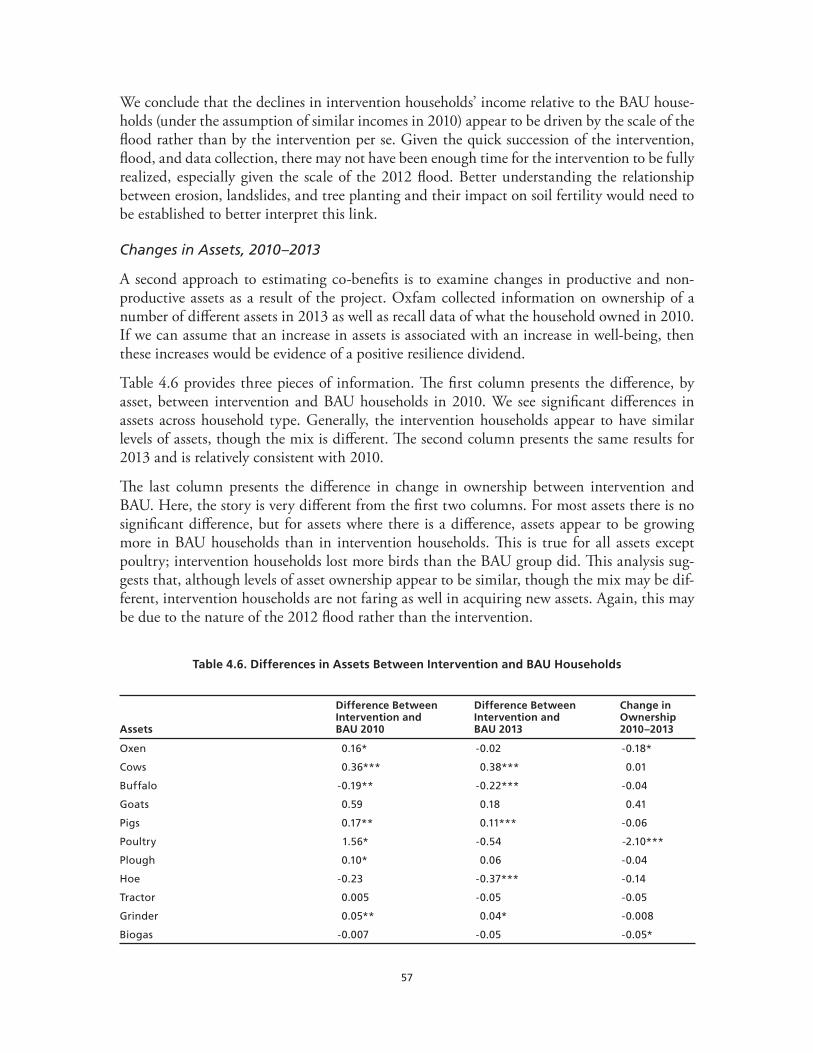
57
We conclude that the declines in intervention households’ income relative to the BAU house-holds (under the assumption of similar incomes in 2010) appear to be driven by the scale of the flood rather than by the intervention per se. Given the quick succession of the intervention, flood, and data collection, there may not have been enough time for the intervention to be fully realized, especially given the scale of the 2012 flood. Better understanding the relationship between erosion, landslides, and tree planting and their impact on soil fertility would need to be established to better interpret this link.
Changes in Assets, 2010–2013
A second approach to estimating co-benefits is to examine changes in productive and non-productive assets as a result of the project. Oxfam collected information on ownership of a number of different assets in 2013 as well as recall data of what the household owned in 2010. If we can assume that an increase in assets is associated with an increase in well-being, then these increases would be evidence of a positive resilience dividend.
Table 4.6 provides three pieces of information. The first column presents the difference, by asset, between intervention and BAU households in 2010. We see significant differences in assets across household type. Generally, the intervention households appear to have similar levels of assets, though the mix is different. The second column presents the same results for 2013 and is relatively consistent with 2010.
The last column presents the difference in change in ownership between intervention and BAU. Here, the story is very different from the first two columns. For most assets there is no significant difference, but for assets where there is a difference, assets appear to be growing more in BAU households than in intervention households. This is true for all assets except poultry; intervention households lost more birds than the BAU group did. This analysis sug-gests that, although levels of asset ownership appear to be similar, though the mix may be dif-ferent, intervention households are not faring as well in acquiring new assets. Again, this may be due to the nature of the 2012 flood rather than the intervention.
Table 4.6. Differences in Assets Between Intervention and BAU Households
Assets
Difference Between Intervention and BAU 2010
Difference Between Intervention and BAU 2013
Change in Ownership 2010–2013
Oxen 0.16* -0.02 -0.18*
Cows 0.36*** 0.38*** 0.01
Buffalo -0.19** -0.22*** -0.04
Goats 0.59 0.18 0.41
Pigs 0.17** 0.11*** -0.06
Poultry 1.56* -0.54 -2.10***
Plough 0.10* 0.06 -0.04
Hoe -0.23 -0.37*** -0.14
Tractor 0.005 -0.05 -0.05
Grinder 0.05** 0.04* -0.008
Biogas -0.007 -0.05 -0.05*
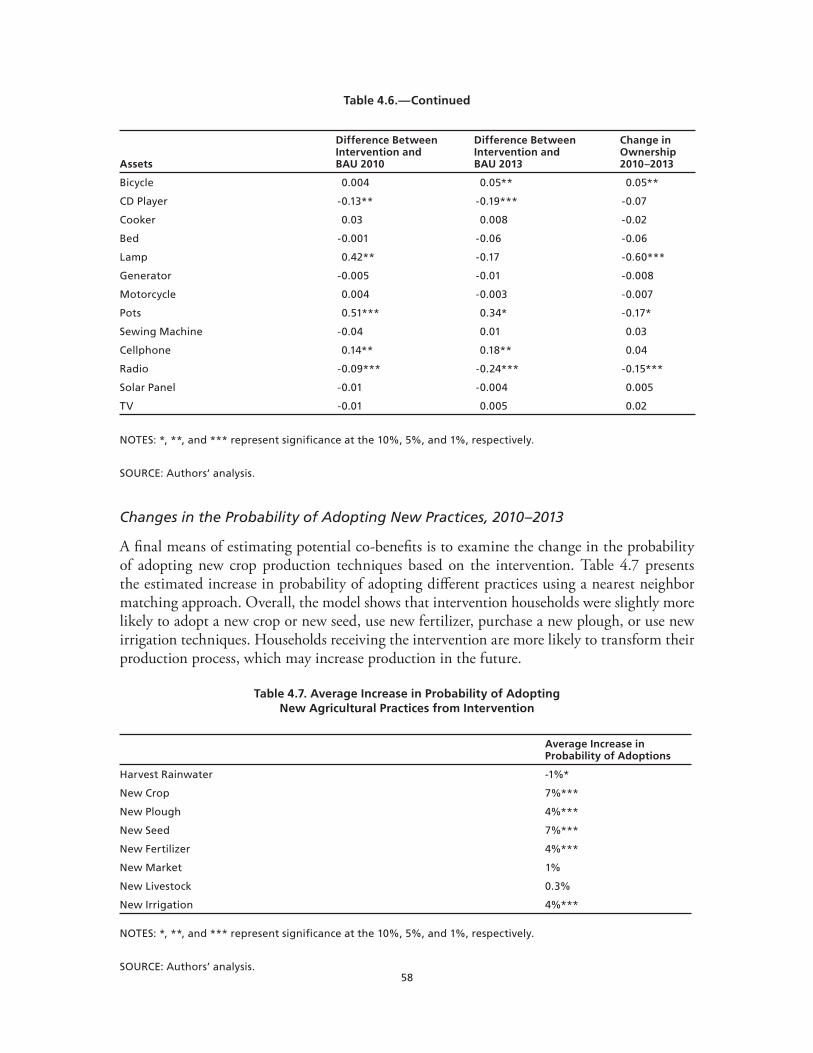
58
Table 4.6.—Continued
Assets
Difference Between Intervention and BAU 2010
Difference Between Intervention and BAU 2013
Change in Ownership 2010–2013
Bicycle 0.004 0.05** 0.05**
CD Player -0.13** -0.19*** -0.07
Cooker 0.03 0.008 -0.02
Bed -0.001 -0.06 -0.06
Lamp 0.42** -0.17 -0.60***
Generator -0.005 -0.01 -0.008
Motorcycle 0.004 -0.003 -0.007
Pots 0.51*** 0.34* -0.17*
Sewing Machine -0.04 0.01 0.03
Cellphone 0.14** 0.18** 0.04
Radio -0.09*** -0.24*** -0.15***
Solar Panel -0.01 -0.004 0.005
TV -0.01 0.005 0.02
NOTES: *, **, and *** represent significance at the 10%, 5%, and 1%, respectively.
SOURCE: Authors’ analysis.
Changes in the Probability of Adopting New Practices, 2010–2013
A final means of estimating potential co-benefits is to examine the change in the probability of adopting new crop production techniques based on the intervention. Table 4.7 presents the estimated increase in probability of adopting different practices using a nearest neighbor matching approach. Overall, the model shows that intervention households were slightly more likely to adopt a new crop or new seed, use new fertilizer, purchase a new plough, or use new irrigation techniques. Households receiving the intervention are more likely to transform their production process, which may increase production in the future.
Table 4.7. Average Increase in Probability of Adopting New Agricultural Practices from Intervention
Average Increase in Probability of Adoptions
Harvest Rainwater -1%*
New Crop 7%***
New Plough 4%***
New Seed 7%***
New Fertilizer 4%***
New Market 1%
New Livestock 0.3%
New Irrigation 4%***
NOTES: *, **, and *** represent significance at the 10%, 5%, and 1%, respectively.
SOURCE: Authors’ analysis.
59
Lessons Learned
Oxfam–Nepal is an ex post case that illustrates the data challenges in estimating the resilience dividend, but it can be used to show how a combination of pre-existing data and assumptions can be brought to bear on the existence of the dividend. It also helps illustrate the importance of behavior on resilience dividend outcomes and how interventions may help to increase social capital. Next we discuss the major lessons learned.
Resilience is dynamic, so quantifying the resilience dividend requires repeated measure-ments over time. Ideally, analysts would be able to estimate both the treatment and the con-trol path at any point after a project, but this requires a large amount of data that is likely not feasible for many projects. Indeed, for any large-scale project with implications that stretch into the future, such data cannot be compiled ex post. Future research (and data collection) might be better served to identify those parts of the resilience dividend (e.g., co-benefits, absorptive capacities, etc.) that could be measured or estimated by any one set of data, or if sufficient project resources were available, to create a data plan that involves multiple observations of the same unit. In any case, data collection strategies should be geared toward collecting metrics related to capital stocks, production relationships (including any posited changes in behavior), and changes in desired outcomes.
An ex post stance is likely not sufficient to adequately characterize the entirety of the resilience dividend. Part of the problem with using post-project, post-shock data is that we are not able to fully capture the dynamic nature of change. For example, in the Nepal case, we have strong evidence that behaviors changed for both agricultural practices and response to the early warning system, but truly understanding how that plays out in the long run is difficult to tackle with short-run data. Similarly, there may be transformative changes in production stemming from changed agricultural practices, project-induced trust in leadership, or other changes that we cannot capture given the limited time horizon following both the interven-tion and the shock.
Providing information to households has the potential to change behavior through changes in the processes that create valuable goods and services, and this can contribute to the resilience dividend. Information provision can change actions related to disaster risk, as well as other productive relationships such as how and which crops are planted.
Relying on data from a single shock may not provide good estimates of the value of resil-ience investments. Looking at one shock lets us assess how the system responded to a particu-lar magnitude of shock and not to the distribution of shocks that could impact the community where the investments were made. By having only a single shock, it is difficult to estimate the absorptive capacity of the protection that was put into place. That estimate would be easier if communities had been exposed to different shocks or if we knew the scale and characteris-tics of the flood at different locations rather than simply if communities or households took an action. In the case of Nepal, it may be that the observed shock was larger than planners had anticipated, and the investments for protection were too small compared to the scale of the shock. Alternatively, a small shock may overestimate the value of the investments made. Protection measures are typically designed for either an entire distribution or geared toward a particular threshold, making ex ante analysis valuable moving forward.
60
Ideal ex post data structures should include data for at least four points in time: prior to the intervention, after the intervention and before a shock, after a shock, and at some post-shock period when the intervention has been fully realized. This data would need to be collected for both intervention and BAU households. These four time periods are important because they allow us to isolate the effects of the intervention from the shock and to identify the impact of the intervention on the different resilience capacities.
Scenario planning may play a critical role in understanding the scale of shocks that can be absorbed or from which recovery is quick. Given that most investments will take place in areas that are highly vulnerable, care needs to be taken in evaluating the BAU case to fully uncover the value of the resilience dividend. This has important implications for data col-lection to avoid the assigning benefits of investments, something that we encountered in the Nepal case.
There may be alternative ways to provide evidence of a resilience dividend and/or the cor-responding changes in capacities. In the case of Nepal, we could, in theory, examine changes in total income (a direct welfare measure), calculate changes in asset ownership (assumed to be positively correlated with welfare), and calculate changes in behavior (assumed to be welfare-enhancing) to illustrate changes in adaptive capacities. When valuing the resilience dividend, it is important not to double-count these effects, but a combination of data and assumptions can provide alternative means of measuring them.
Social capital is fundamentally different than other types of capital stocks. It is harder to understand the role of trust in leaders and institutions in the production, allocation, and investment embedded within any system. Similarly, the role of building social capital through encouraging behaviors that help community members in times of distress (e.g., search and rescue) may have a transformative effect, but given the long-term nature of such changes, it may be very difficult to assign causality or quantify the effects. Greater trust may cause greater innovation by individuals, but they may also rely on the institutions. Changing institutions is much different than changing how production or allocations occur because the rules of the game may have changed. Moving forward, understanding the role of institutions and social norms in creating incentives that change behavior is likely critical to understanding long-run dividend outcomes.
Oxfam Pakistan
This case study is based on the RDVM. It provides a demonstration of how RDVM can be applied in real-world situations. The case can be read on its own, but it is part of a broader package that includes five other case studies presented in Chapter 4 and the lessons learned from all the cases in Chapter 5. This case study is intended primarily to help readers under-stand how to apply the RDVM framework given a set of data or information about a given project. Any estimate of the resilience dividend is provided as an example and is not necessarily a complete estimate.
The Oxfam food security project in Pakistan is an example of calculating the resilience divi-dend in an ex post case with a flood (though we were unable to uncover disaster-related divi-dends). The Oxfam Pakistan case highlights the difficulties in aggregating individual welfare
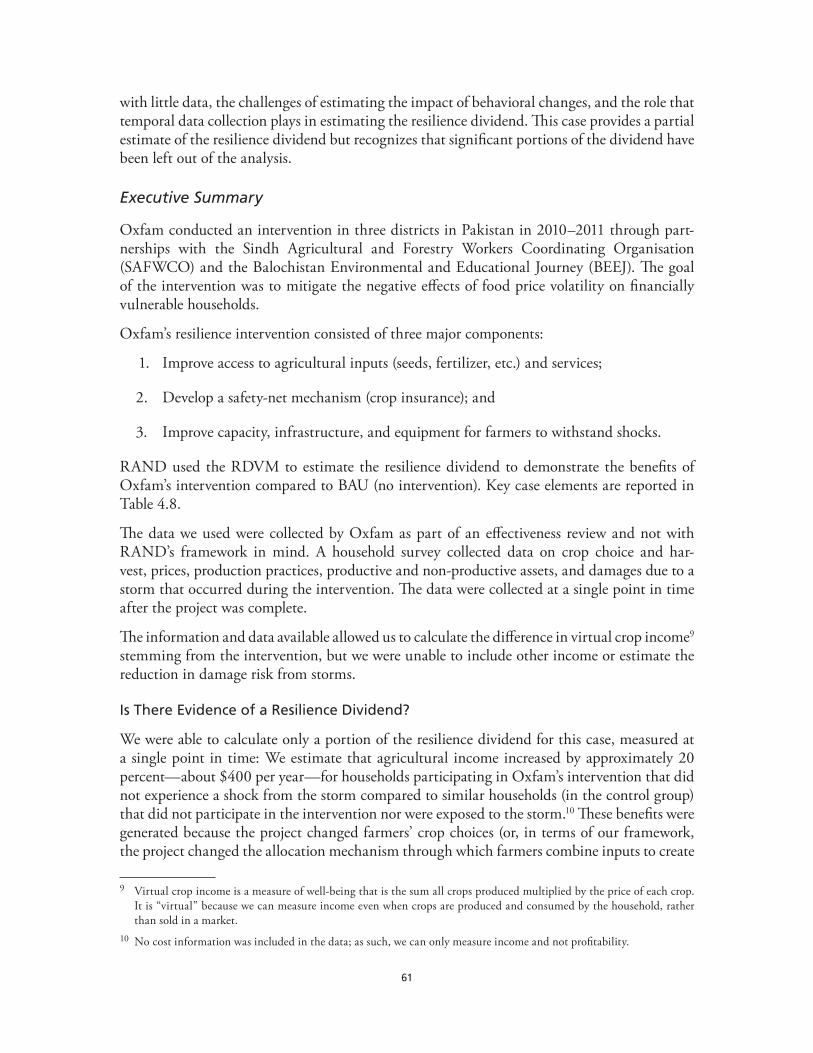
61
with little data, the challenges of estimating the impact of behavioral changes, and the role that temporal data collection plays in estimating the resilience dividend. This case provides a partial estimate of the resilience dividend but recognizes that significant portions of the dividend have been left out of the analysis.
Executive Summary
Oxfam conducted an intervention in three districts in Pakistan in 2010–2011 through part-nerships with the Sindh Agricultural and Forestry Workers Coordinating Organisation (SAFWCO) and the Balochistan Environmental and Educational Journey (BEEJ). The goal of the intervention was to mitigate the negative effects of food price volatility on financially vulnerable households.
Oxfam’s resilience intervention consisted of three major components:
1. Improve access to agricultural inputs (seeds, fertilizer, etc.) and services;
2. Develop a safety-net mechanism (crop insurance); and
3. Improve capacity, infrastructure, and equipment for farmers to withstand shocks.
RAND used the RDVM to estimate the resilience dividend to demonstrate the benefits of Oxfam’s intervention compared to BAU (no intervention). Key case elements are reported in Table 4.8.
The data we used were collected by Oxfam as part of an effectiveness review and not with RAND’s framework in mind. A household survey collected data on crop choice and har-vest, prices, production practices, productive and non-productive assets, and damages due to a storm that occurred during the intervention. The data were collected at a single point in time after the project was complete.
The information and data available allowed us to calculate the difference in virtual crop income9 stemming from the intervention, but we were unable to include other income or estimate the reduction in damage risk from storms.
Is There Evidence of a Resilience Dividend?
We were able to calculate only a portion of the resilience dividend for this case, measured at a single point in time: We estimate that agricultural income increased by approximately 20 percent—about $400 per year—for households participating in Oxfam’s intervention that did not experience a shock from the storm compared to similar households (in the control group) that did not participate in the intervention nor were exposed to the storm.10 These benefits were generated because the project changed farmers’ crop choices (or, in terms of our framework, the project changed the allocation mechanism through which farmers combine inputs to create
9 Virtual crop income is a measure of well-being that is the sum all crops produced multiplied by the price of each crop. It is “virtual” because we can measure income even when crops are produced and consumed by the household, rather than sold in a market.
10 No cost information was included in the data; as such, we can only measure income and not profitability.

62
outputs). In terms of the overall model, these changes can best be viewed as either changes in co-benefits (benefits that arise absent a shock) or changes in transformative capacity that per-manently alter the well-being of individuals exposed to the intervention. This is a partial esti-mation in that we only include crop income and not all potential sources of income.
There is little evidence that the intervention helped reduce disaster risk. For households that were exposed to the storm, self-reported crop loss was the only measure of the magnitude of their exposure. Using this measure, we estimate that treatment and control households fared similarly in both crop losses attributed to the storm and agricultural income in the year after the storm. That there was little difference between the two groups suggests that this project had no damage risk reduction benefits (or increases in absorptive capacity).
Treatment households exposed to the storm are subject to the same co-benefits and transfor-mative capacity changes as treatment households not exposed to the storm, though the changes may be smaller due to the presence of the shock. In addition to receiving co-benefits, house-holds affected by the storm also suffered at least some damage. This makes calculating a net benefit appropriate. We estimate that the partial net resilience dividend post-shock is $0–$500 per household for 2012.
Table 4.8. Basic Case Information for Oxfam Pakistan
Problem Agricultural price volatility
Intervention (Status) Improve access to agricultural inputs (seeds, fertilizer, etc.) and services; develop a safety-net mechanism (crop insurance); improve capacity, infrastructure, and equipment for farmers to withstand external shocks (fully implemented)
Business as Usual No intervention
Capital Stocks Land, agriculturally productive assets, human, social
Goods and Services (public/ private)
Crops, livestock
Well-Being Measures (measured/ not measured)
Virtual crop income (measured); crop damage (measured)
Case Highlights Ex post valuation, behavioral response to changes in capital stocks, behavioral response to information
SOURCE: Authors’ analysis.
Oxfam Pakistan Intervention Background 11
Oxfam conducted an intervention in three districts in Pakistan in 2010–2011 through part-nerships with the Sindh Agricultural and Forestry Workers Coordinating Organisation (SAFWCO) and the Balochistan Environmental and Educational Journey (BEEJ). The goal of the intervention was to mitigate the negative effects of food price volatility on financially
11 All of the information for the Oxfam intervention comes from an effectiveness review published by Oxfam: Fuller, R. (2015). Resilience in Pakistan: Evaluation of enhancing food security and resilience of small-scale farmers. London: Oxfam, GB.
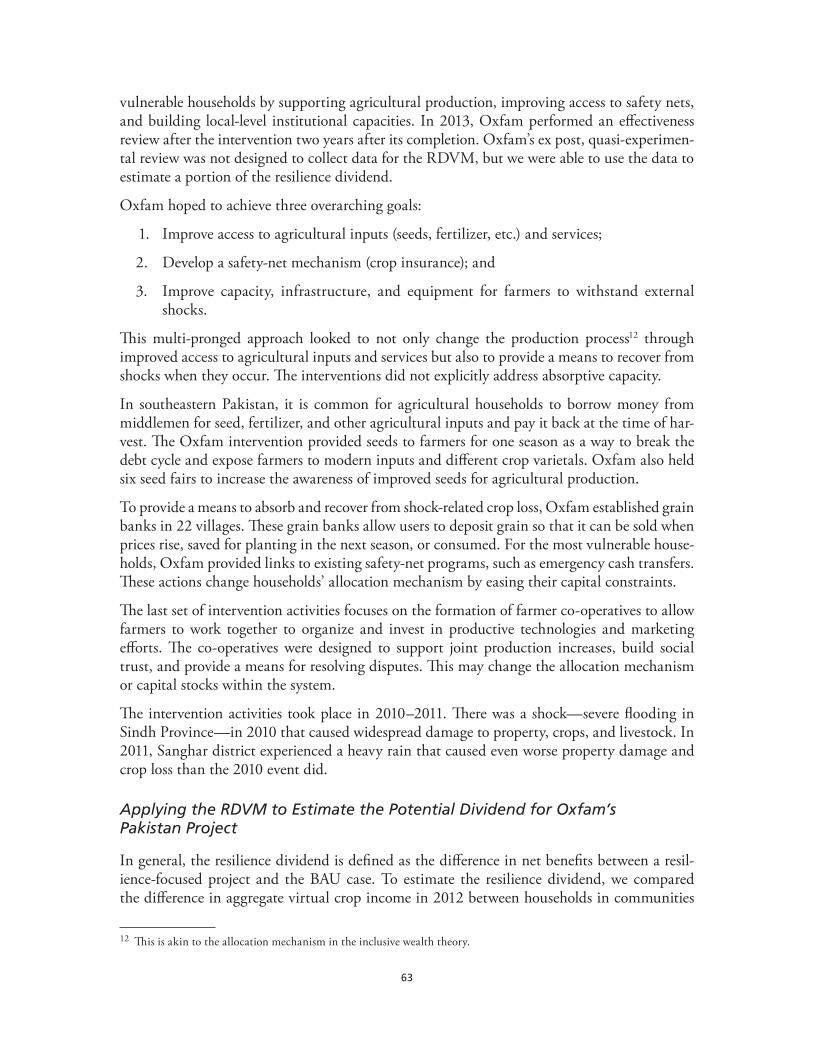
63
vulnerable households by supporting agricultural production, improving access to safety nets, and building local-level institutional capacities. In 2013, Oxfam performed an effectiveness review after the intervention two years after its completion. Oxfam’s ex post, quasi-experimen-tal review was not designed to collect data for the RDVM, but we were able to use the data to estimate a portion of the resilience dividend.
Oxfam hoped to achieve three overarching goals:
1. Improve access to agricultural inputs (seeds, fertilizer, etc.) and services;
2. Develop a safety-net mechanism (crop insurance); and
3. Improve capacity, infrastructure, and equipment for farmers to withstand external shocks.
This multi-pronged approach looked to not only change the production process12 through improved access to agricultural inputs and services but also to provide a means to recover from shocks when they occur. The interventions did not explicitly address absorptive capacity.
In southeastern Pakistan, it is common for agricultural households to borrow money from middlemen for seed, fertilizer, and other agricultural inputs and pay it back at the time of har-vest. The Oxfam intervention provided seeds to farmers for one season as a way to break the debt cycle and expose farmers to modern inputs and different crop varietals. Oxfam also held six seed fairs to increase the awareness of improved seeds for agricultural production.
To provide a means to absorb and recover from shock-related crop loss, Oxfam established grain banks in 22 villages. These grain banks allow users to deposit grain so that it can be sold when prices rise, saved for planting in the next season, or consumed. For the most vulnerable house-holds, Oxfam provided links to existing safety-net programs, such as emergency cash transfers. These actions change households’ allocation mechanism by easing their capital constraints.
The last set of intervention activities focuses on the formation of farmer co-operatives to allow farmers to work together to organize and invest in productive technologies and marketing efforts. The co-operatives were designed to support joint production increases, build social trust, and provide a means for resolving disputes. This may change the allocation mechanism or capital stocks within the system.
The intervention activities took place in 2010–2011. There was a shock—severe flooding in Sindh Province—in 2010 that caused widespread damage to property, crops, and livestock. In 2011, Sanghar district experienced a heavy rain that caused even worse property damage and crop loss than the 2010 event did.
Applying the RDVM to Estimate the Potential Dividend for Oxfam’s Pakistan Project
In general, the resilience dividend is defined as the difference in net benefits between a resil-ience-focused project and the BAU case. To estimate the resilience dividend, we compared the difference in aggregate virtual crop income in 2012 between households in communities
12 This is akin to the allocation mechanism in the inclusive wealth theory.
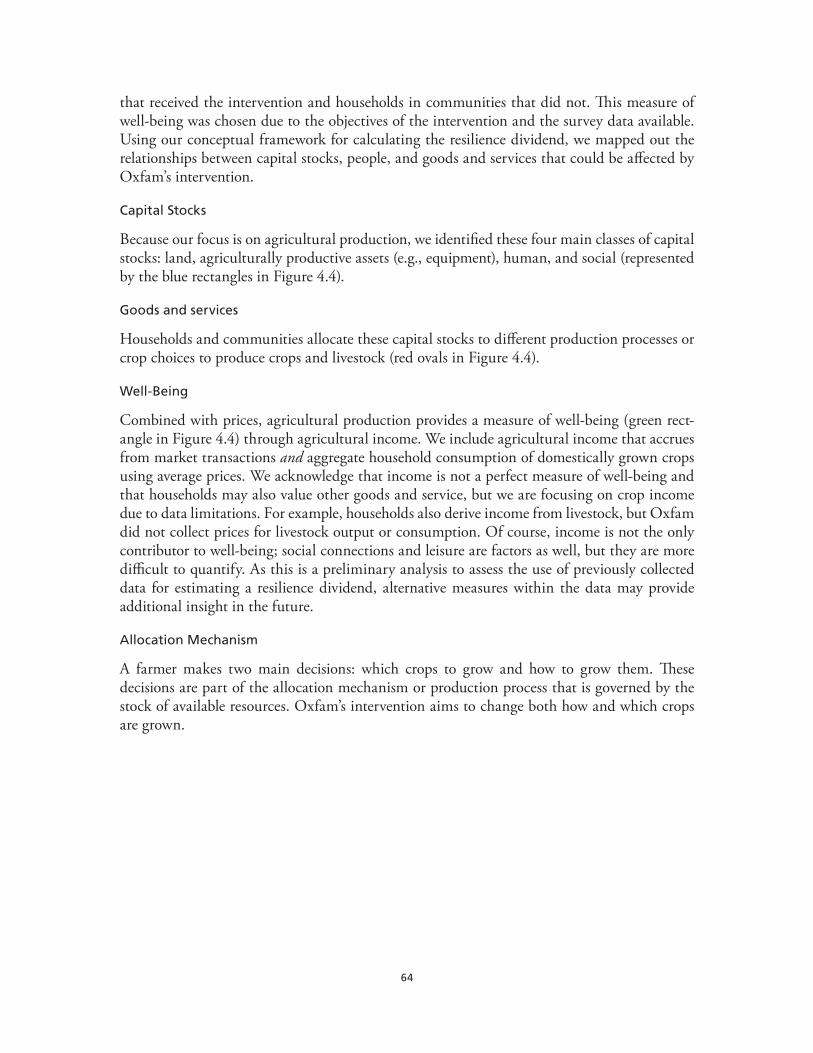
64
that received the intervention and households in communities that did not. This measure of well-being was chosen due to the objectives of the intervention and the survey data available. Using our conceptual framework for calculating the resilience dividend, we mapped out the relationships between capital stocks, people, and goods and services that could be affected by Oxfam’s intervention.
Capital Stocks
Because our focus is on agricultural production, we identified these four main classes of capital stocks: land, agriculturally productive assets (e.g., equipment), human, and social (represented by the blue rectangles in Figure 4.4).
Goods and services
Households and communities allocate these capital stocks to different production processes or crop choices to produce crops and livestock (red ovals in Figure 4.4).
Well-Being
Combined with prices, agricultural production provides a measure of well-being (green rect-angle in Figure 4.4) through agricultural income. We include agricultural income that accrues from market transactions and aggregate household consumption of domestically grown crops using average prices. We acknowledge that income is not a perfect measure of well-being and that households may also value other goods and service, but we are focusing on crop income due to data limitations. For example, households also derive income from livestock, but Oxfam did not collect prices for livestock output or consumption. Of course, income is not the only contributor to well-being; social connections and leisure are factors as well, but they are more difficult to quantify. As this is a preliminary analysis to assess the use of previously collected data for estimating a resilience dividend, alternative measures within the data may provide additional insight in the future.
Allocation Mechanism
A farmer makes two main decisions: which crops to grow and how to grow them. These decisions are part of the allocation mechanism or production process that is governed by the stock of available resources. Oxfam’s intervention aims to change both how and which crops are grown.
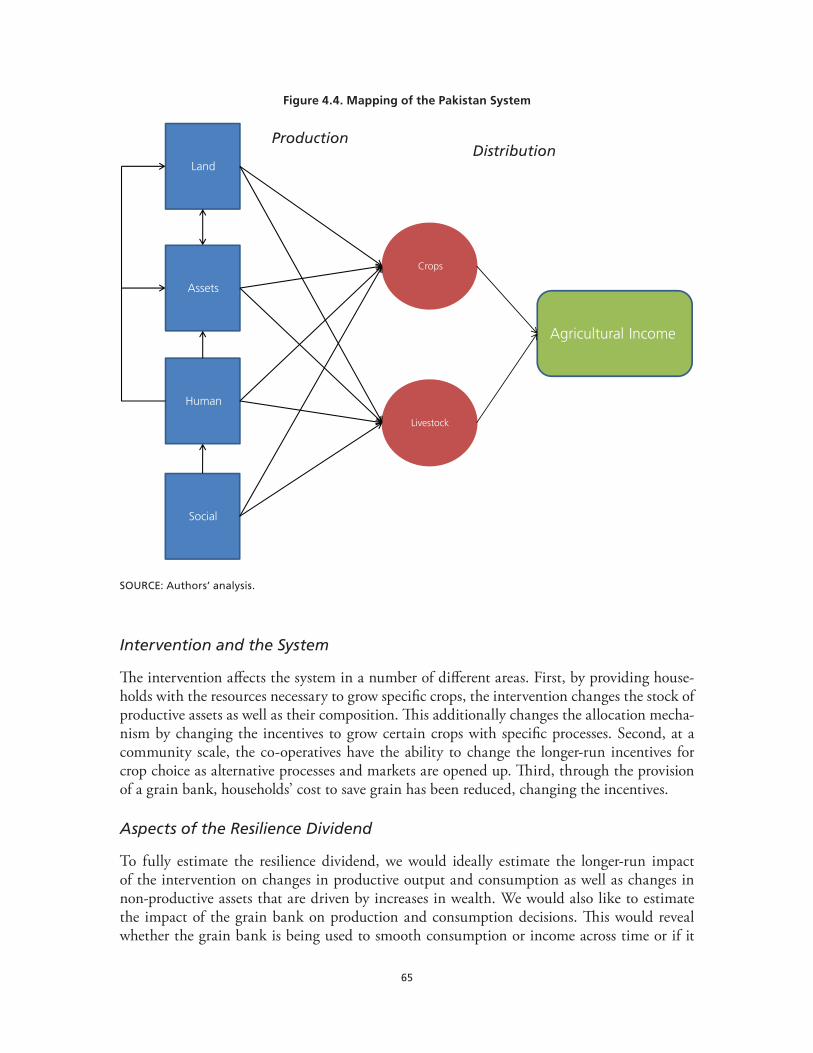
65
Figure 4.4. Mapping of the Pakistan System
Land
Assets
Human
Crops
Livestock
Agricultural Income
Production Distribution
Social
SOURCE: Authors’ analysis.
Intervention and the System
The intervention affects the system in a number of different areas. First, by providing house-holds with the resources necessary to grow specific crops, the intervention changes the stock of productive assets as well as their composition. This additionally changes the allocation mecha-nism by changing the incentives to grow certain crops with specific processes. Second, at a community scale, the co-operatives have the ability to change the longer-run incentives for crop choice as alternative processes and markets are opened up. Third, through the provision of a grain bank, households’ cost to save grain has been reduced, changing the incentives.
Aspects of the Resilience Dividend
To fully estimate the resilience dividend, we would ideally estimate the longer-run impact of the intervention on changes in productive output and consumption as well as changes in non-productive assets that are driven by increases in wealth. We would also like to estimate the impact of the grain bank on production and consumption decisions. This would reveal whether the grain bank is being used to smooth consumption or income across time or if it
66
is being used as a means of credit in that the seeds in the grain bank are used as inputs the next season.
Given that the data collection occurred after only one post-intervention growing season, these longer-run impacts cannot be calculated, so we must estimate the intervention’s short-run impacts on output. Additionally, given data limitations, we are unable to identify households that use safety net services and how they use the grain banks, other than the existence of con-tributions or withdrawals. As a result, we estimated a partial resilience dividend that includes net benefits to households due to changes in the crops grown and production techniques used to grow them (the allocation mechanism) and in productive capital stocks. A positive partial resilience dividend means that households are more productive or producing high-value goods that allow them to earn more agricultural income at a given point in time.
Empirical Methods
To estimate the resilience dividend, we rely on a survey fielded by Oxfam in 2013 that was designed to estimate the impact of the intervention. Oxfam chose 157 communities in Paki-stan to implement the project and surveyed households in 23 of them.13 This is the treatment group. Oxfam also surveyed households in 44 other communities to provide a comparison group for the intervention. These “control” communities were chosen based on their proximity to the treatment communities.
This survey design allows us to estimate the partial net resilience dividend of the interven-tion by comparing treatment and control households. Importantly, the treatment and control households had the same important attributes before the intervention, so differences between them after the intervention can be causally linked to the intervention (assuming no additional systemic changes other than the project).
This case uses causal inference techniques and difference-in-difference statistical estimation. In general, the resilience dividend is defined as the difference in net benefits between a resilience-focused project and the BAU case. Here, we exploit the data collection design and use the control households as an approximation to BAU since the treatment and control households are statistically similar. The difference between the treatment group’s actual outcomes and the BAU outcomes gives us the average treatment effect on the treated, which represents the resil-ience dividend.
We exploit both the differences that arise due to the intervention as well as the differences that arise from the fact that not all households were affected by the 2011 storm. This results in esti-mating the resilience dividend for a particular cropping year for four groups: those not affected by the flood (and thus not subject to the shock), and those affected by the flood together with treatment and control households. The dividend for those affected is a net measure that con-tains 1) any co-benefit/transformative capacity changes from the group not affected by the flood event, plus 2) any changes in absorptive capacity, and 3) partial recovery benefits. In real-ity, all households were exposed to the shock, but some had no damage. Because we only have data on damage—not exposure—this complicates the analysis.
13 These villages were randomly chosen to cover the six Union Council areas.

67
In an ideal data setting, we would have information at four points in time: prior to the inter-vention, after the intervention and before a shock, after a shock, and at some later time when the intervention had been fully realized post-shock. This data would need to be collected for both treatment and control households. These four time periods are important because they allow us to isolate the effects of the intervention from the shock and to identify the impact of the intervention on the different resilience capacities.
Oxfam only collected data at a single point in time but did collect limited “recall” data that survey participants cited from memory.14 We use the data collection structure as a proxy for other time periods by exploiting the facts that Oxfam collected data from both treatment and control households and that the 2011 event did not affect all households. This allows us to esti-mate the annual partial resilience dividend for households not affected by the flood and those that were, since treatment and control households are similar prior to the intervention.
Our approach, coupled with the available data, allows for deeper insight into the relationships between the intervention and the outcomes through an understanding of how the intervention changed behavior. This behavioral change manifests itself though the allocation mechanism within the conceptual framework. Thus, we are able to estimate the net resilience dividend for two groups of households and explore how it, the allocation mechanism, changed.
Data
The data for this analysis were part of Oxfam’s evaluation of the program, collected via a household survey.15 Survey respondents were chosen at random from selected communities in both intervention and control communities. A total of 787 households responded to the survey—287 treatment and 500 control households. For each treatment community, two con-trol groups were chosen from nearby communities with approximately the same size, ethnic composition, livelihood activities, and distance to major roads as the intervention communi-ties. Based on our analysis of the two groups, the groups had similar agricultural practices, asset ownership, and socio-demographic characteristics before the intervention.
Our measure of well-being is constructed by combining crop output in 2012 with prices. When a household sells a crop, we use the self-reported price. When households do not sell a crop (i.e., they produce for consumption rather than the market), we use the average price received in the data to construct crop-level revenue. Crop prices allow us to combine produc-tion of different crops into a single measure of virtual crop income (as previously defined). Ideally, we would combine this measure with other sources of income, but the survey did not collect this type of data.
14 The collection of recall data by Oxfam was for use in propensity score matching in order to better control for treatment and control household characteristics. Again, we are using this data outside of how it was meant to be used.
15 The anonymized survey data were obtained through the UK Data Services with special permission provided by Oxfam: University of Essex University of Manchester and Jisc. (2017). “UK Data Service”.
68
Limited data on 2009 crop production
Oxfam collected prices received for crops in 2012.16 This allows us to construct a virtual agri-cultural income for all treatment and control households for one year (as a measure of well-being), rather than estimating potential changes in production practices. However, prices are only available for crop sales, not livestock sales, so we focus on crop production but acknowl-edge that livestock—and in particular dairy production—was an important focus of Oxfam’s intervention. Additionally, we know that households obtain income that is not related to farm-ing but not the amount.17 This is why we believe we are only estimating a portion of the resilience dividend.
Though Oxfam’s design appears to have a good data environment (including treatment and control groups suitable for causal inference), the survey is limited in that is focuses on current rather than past production. The survey did collect recall data on production practices and crop choice but not on agricultural output. As such, we cannot rely on pre/post data for the treat-ment group in order to identify the resilience dividend. Instead, we assume that the control group’s income is a good approximation of what would have happened absent the intervention, and represent the difference as the net resilience dividend.
Limited time between intervention and data collection
The project was implemented in 2010 and 2011, and data was collected in September 2013 for the previous 12 months of production. Coupled with a single observed shock in 2010 (and with limited data relating to it), this data structure does not provide the opportunity to estimate the full resilience dividend related to flooding, for either the observed flood or potential ones. Results should be interpreted as being conditional on the actual flood that occurred.
No exposure data
To understand how households and communities respond to shocks, it is necessary to observe the scale of the shock that they experience. However, Oxfam collected data on the scale of damages but not the scale of the events for different households. For example, they did not collect the stream level or rainfall amount that different households experienced. As such, we are unable to calculate pure absorptive capacity changes. It should be noted, however, that the intervention was focused on recovery rather than enhanced absorptive capacity.
No data on input costs
Ideally, a well-being measure should be the net of any new costs that households incurred. However, input cost data was not available. As such, only virtual agricultural revenue is used in the analysis. If households incurred new costs, the overall magnitude of the partial resil-ience dividend would be reduced. The intervention is treated as though there are no costs to the household or community since it is funded outside of the system. If the intervention were internally funded, this would significantly reduce the resilience dividend.
16 We use the price received by the household when the household reports a price and the average of all other households when households do not sell the crop.
17 This is important since more than 45% of households engage in casual labor and more than 20% have a household business. These incomes may be significant compared to crop income.
69
Results
We divide our presentation of the results into two broad sections. First, using a partial measure of well-being (agricultural income), we estimate the net annual value in 2012 of the resilience dividend for different groups depending on their exposure to the 2011 storm. Results are split into households that did not experience damage from the flood and those that did. For the group that had no damage, any differences from the group that did can be attributed to the intervention changing agricultural production activities (or, in the model, changes in the allo-cation mechanism).18
For the group that suffered damage from the flood, the resilience dividend (again measured for 2012) includes the net changes in crop income due to changes in the allocation mechanism, less residual net damage from the 2011 flood, plus any recovery benefit over the following year. We cannot disaggregate these differential effects with data collected for a single point in time.
Our second approach attempts to better understand the causal mechanisms to link the inter-vention to changes in agricultural output. While the resilience dividend estimates quantify the magnitude of the (gross) benefits that accrued to households in 2012 as a result of the project, additional data in Oxfam’s survey can be used to show the casual mechanisms through which the intervention had an effect. In particular, we use information on the changes in production practices that can be attributed to the project in conjunction with an estimate of each practice’s effect on average income to empirically show the change in the allocation mechanism attribut-able to the project. Given the nature of the intervention, behavioral change arising as a result of the project is the key driver of the resilience dividend.
Resilience Dividend for Households Not Exposed to the Flood
Our first step is to estimate the resilience dividend in 2012 for those households that did not experience the shock of the 2011 flood; we identified these households as not being exposed because they had no self-reported storm damage. If we compare these households that partici-pated in the intervention to those that did not, the difference in crop incomes in 2012 repre-sents the “co-benefit” effect of the intervention (i.e., benefits that accrue in the absence of a shock). That is, the intervention changed behaviors that led to differing outcomes, meaning that the intervention changed the allocation mechanism for intervention households.
If these changes are permanent and are expected to persist, grow, or spread, one could argue that the change in the allocation mechanism could be a change in transformative capacity within the system. However, we have no longer-term data to test this hypothesis. Figure 4.5 shows how we have conceptualized the development path between treatment and control households without a shock. Alternatively, the intervention may be a level shift up rather than a growth curve.
18 Because Oxfam only collected flood damage data, we have no physical measure of flood exposure. While we assume that a lack of damage is due to no exposure, it might also be the case that a no-damage household was exposed, but was associated with a large absorptive capacity. Given the nature of the shock, this seems unlikely.
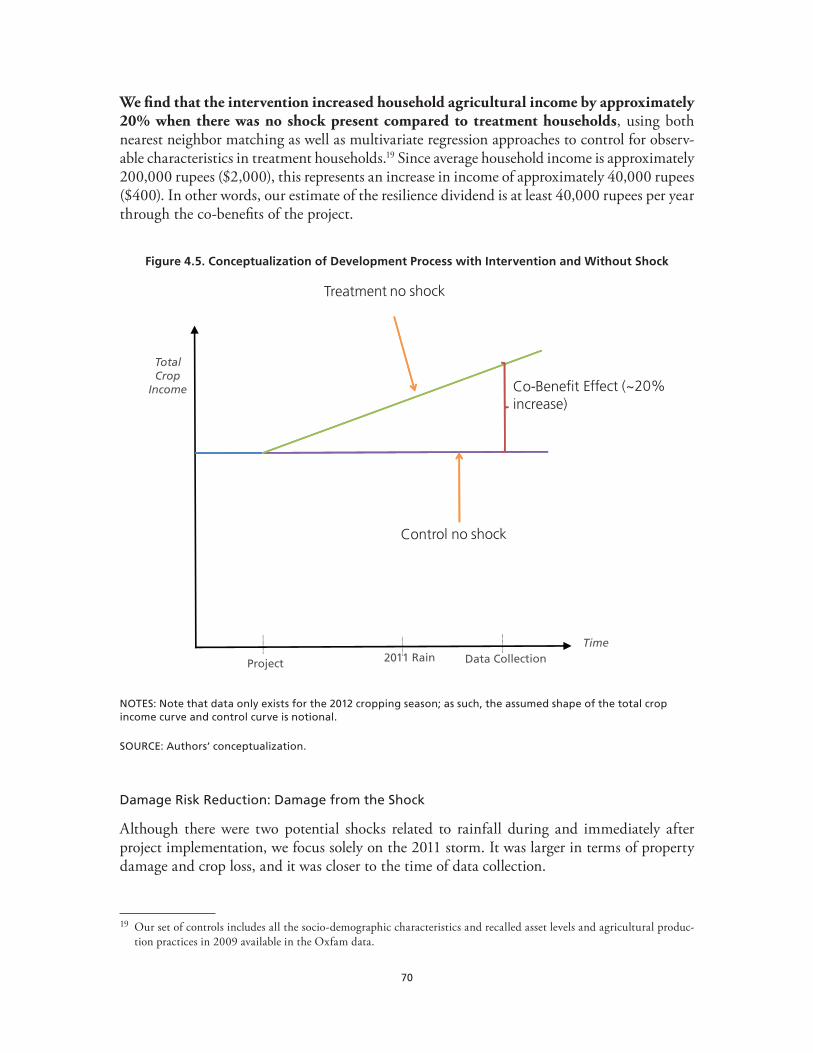
70
We find that the intervention increased household agricultural income by approximately 20% when there was no shock present compared to treatment households, using both nearest neighbor matching as well as multivariate regression approaches to control for observ-able characteristics in treatment households.19 Since average household income is approximately 200,000 rupees ($2,000), this represents an increase in income of approximately 40,000 rupees ($400). In other words, our estimate of the resilience dividend is at least 40,000 rupees per year through the co-benefits of the project.
Figure 4.5. Conceptualization of Development Process with Intervention and Without Shock
Time
Total Crop
Income
Project 2011 Rain Data Collection
Treatment no shock
Control no shock
Co-Benefit Effect (~20% increase)
NOTES: Note that data only exists for the 2012 cropping season; as such, the assumed shape of the total crop income curve and control curve is notional.
SOURCE: Authors’ conceptualization.
Damage Risk Reduction: Damage from the Shock
Although there were two potential shocks related to rainfall during and immediately after project implementation, we focus solely on the 2011 storm. It was larger in terms of property damage and crop loss, and it was closer to the time of data collection.
19 Our set of controls includes all the socio-demographic characteristics and recalled asset levels and agricultural produc-tion practices in 2009 available in the Oxfam data.

71
Data on the impacts of the flooding and storms are limited.20 We do not have values of lost or damaged property, and the best information is on the proportion of crops lost—but not which crops were lost. The aim of the intervention was not necessarily to protect against crop damage but to recover production once a shock had taken place. Importantly, though, there is no dif-ference between any of our treatment and control households in proportion of crop losses in terms of both magnitude and statistical significance.21 Thus, we estimate that the change in damage risk reduction is zero for the intervention.
Resilience Dividend for Households Exposed to the Flood
Similar to our strategy for estimating the resilience dividend without a shock, we compare par-tial agricultural incomes in 2012 in both treatment and control communities for those that did experience the 2011 storm, as measured by a positive self-reported crop loss. Figure 4.6 presents our conceptualization for this analysis. With only one year of data (2012), the estimate of the resilience dividend for those households affected by the shock includes the total benefits from the change in the allocation mechanism, plus any changes in absorptive capacity and recovery one year following the storm.
Using a similar approach to the no-shock analysis, we estimate that agricultural income in 2012 for treatment households is roughly 24% higher compared to control households (approximately 50,000 rupees, or $500 per household), though this result is not statistically significantly different from zero. One explanation for this imprecise estimate is that we have not distinguished the degree to which households were affected, so there is considerable noise in the estimate. Exposure plays a critical role in estimating the disaster risk reduction in an ex post analysis, as we need to understand not only what damages were realized but also the scale of the disaster. Simply knowing that there were more damages does not mean that they were exposed to a larger event. Absorptive capacity plays a critical role that we are unable to estimate.
Although we lack sufficient power to precisely estimate the differences in income, we can examine several interpretations of the estimate:
There might be a recovery component to the resilience dividend. If our estimate of a 24% increase in agricultural income for treatment households was approximately correct (or at least greater than 20%), if treatment and control households had the same exposure to the flood, and if the benefits of the project to treatment households that experienced the shock prior to it were similar to treatment households that did not experience the shock, then we can conclude that there was an additional component of the resilience dividend related to recovery.
The recovery benefit might be negative even if the net resilience dividend is positive. If the true magnitude of increased agricultural income is less than 20% but still positive, then the overall net resilience dividend in 2012 for treatment households was positive relative to the
20 Importantly, we do not know which households were exposed to the flood compared to those that suffered damages. Ideally, we would have information on both damages and exposure to be able to consider household level investments in absorptive capacity.
21 Oxfam’s effectiveness review finds a small and significant difference. The difference between the two analyses is that Oxfam used the ordinal nature of the data on losses with cardinality properties. We segment the data in two ways: (1) those that received damages and those that did not and (2) those that received greater than 50% damage and those that did not. In both of the approaches, we find no significant difference between treatment and control.
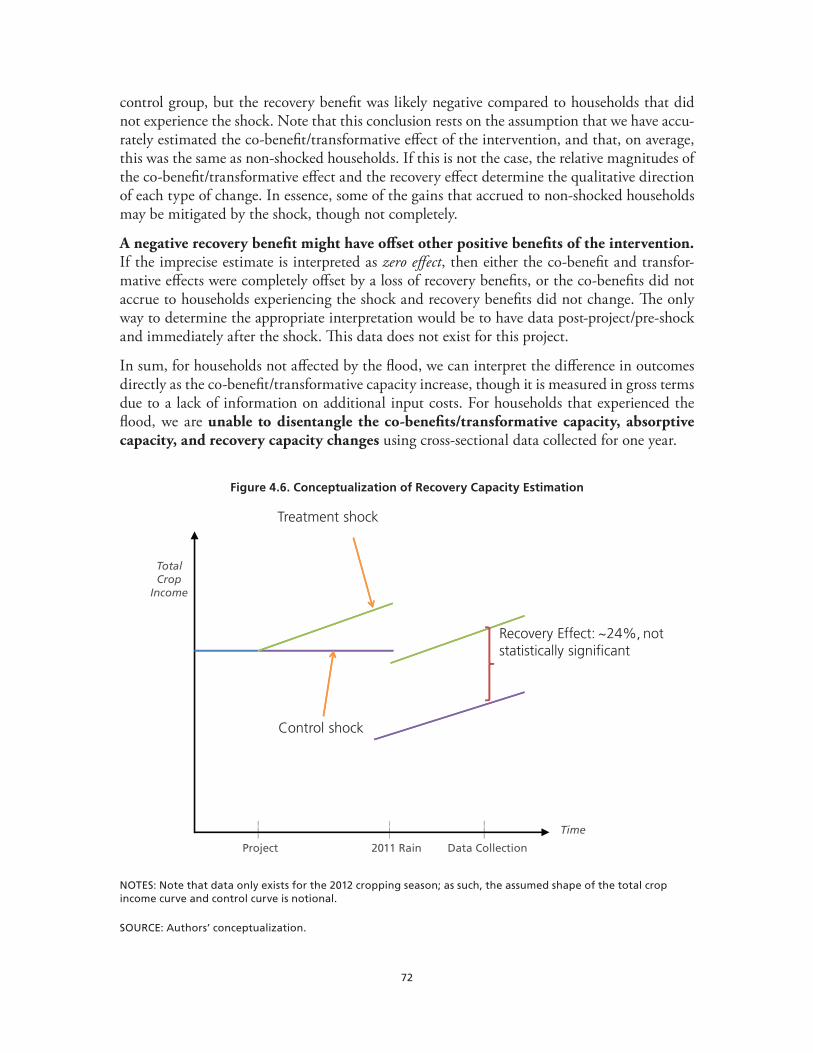
72
control group, but the recovery benefit was likely negative compared to households that did not experience the shock. Note that this conclusion rests on the assumption that we have accu-rately estimated the co-benefit/transformative effect of the intervention, and that, on average, this was the same as non-shocked households. If this is not the case, the relative magnitudes of the co-benefit/transformative effect and the recovery effect determine the qualitative direction of each type of change. In essence, some of the gains that accrued to non-shocked households may be mitigated by the shock, though not completely.
A negative recovery benefit might have offset other positive benefits of the intervention. If the imprecise estimate is interpreted as zero effect, then either the co-benefit and transfor-mative effects were completely offset by a loss of recovery benefits, or the co-benefits did not accrue to households experiencing the shock and recovery benefits did not change. The only way to determine the appropriate interpretation would be to have data post-project/pre-shock and immediately after the shock. This data does not exist for this project.
In sum, for households not affected by the flood, we can interpret the difference in outcomes directly as the co-benefit/transformative capacity increase, though it is measured in gross terms due to a lack of information on additional input costs. For households that experienced the flood, we are unable to disentangle the co-benefits/transformative capacity, absorptive capacity, and recovery capacity changes using cross-sectional data collected for one year.
Figure 4.6. Conceptualization of Recovery Capacity Estimation
Time
Total Crop
Income
Project 2011 Rain Data Collection
Treatment shock
Control shock
Recovery Effect: ~24%, not statistically significant
NOTES: Note that data only exists for the 2012 cropping season; as such, the assumed shape of the total crop income curve and control curve is notional.
SOURCE: Authors’ conceptualization.
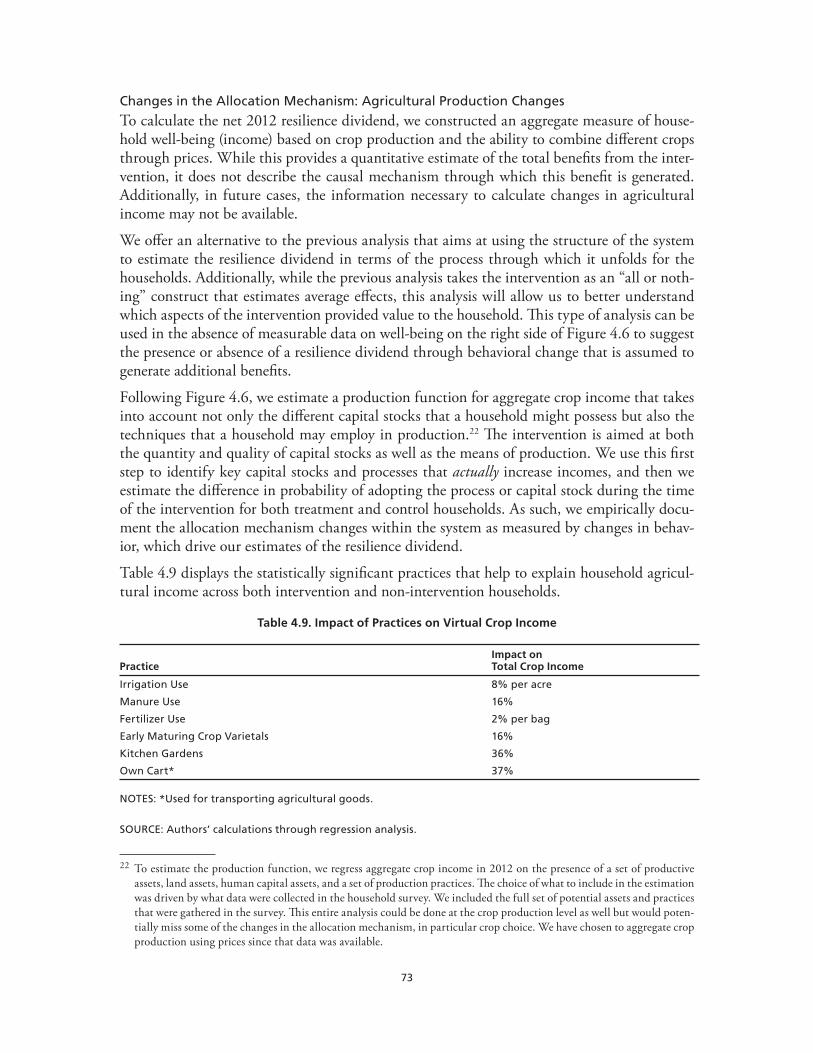
73
Changes in the Allocation Mechanism: Agricultural Production Changes
To calculate the net 2012 resilience dividend, we constructed an aggregate measure of house-hold well-being (income) based on crop production and the ability to combine different crops through prices. While this provides a quantitative estimate of the total benefits from the inter-vention, it does not describe the causal mechanism through which this benefit is generated. Additionally, in future cases, the information necessary to calculate changes in agricultural income may not be available.
We offer an alternative to the previous analysis that aims at using the structure of the system to estimate the resilience dividend in terms of the process through which it unfolds for the households. Additionally, while the previous analysis takes the intervention as an “all or noth-ing” construct that estimates average effects, this analysis will allow us to better understand which aspects of the intervention provided value to the household. This type of analysis can be used in the absence of measurable data on well-being on the right side of Figure 4.6 to suggest the presence or absence of a resilience dividend through behavioral change that is assumed to generate additional benefits.
Following Figure 4.6, we estimate a production function for aggregate crop income that takes into account not only the different capital stocks that a household might possess but also the techniques that a household may employ in production.22 The intervention is aimed at both the quantity and quality of capital stocks as well as the means of production. We use this first step to identify key capital stocks and processes that actually increase incomes, and then we estimate the difference in probability of adopting the process or capital stock during the time of the intervention for both treatment and control households. As such, we empirically docu-ment the allocation mechanism changes within the system as measured by changes in behav-ior, which drive our estimates of the resilience dividend.
Table 4.9 displays the statistically significant practices that help to explain household agricul-tural income across both intervention and non-intervention households.
Table 4.9. Impact of Practices on Virtual Crop Income
PracticeImpact on Total Crop Income
Irrigation Use 8% per acre
Manure Use 16%
Fertilizer Use 2% per bag
Early Maturing Crop Varietals 16%
Kitchen Gardens 36%
Own Cart* 37%
NOTES: *Used for transporting agricultural goods.
SOURCE: Authors’ calculations through regression analysis.
22 To estimate the production function, we regress aggregate crop income in 2012 on the presence of a set of productive assets, land assets, human capital assets, and a set of production practices. The choice of what to include in the estimation was driven by what data were collected in the household survey. We included the full set of potential assets and practices that were gathered in the survey. This entire analysis could be done at the crop production level as well but would poten-tially miss some of the changes in the allocation mechanism, in particular crop choice. We have chosen to aggregate crop production using prices since that data was available.
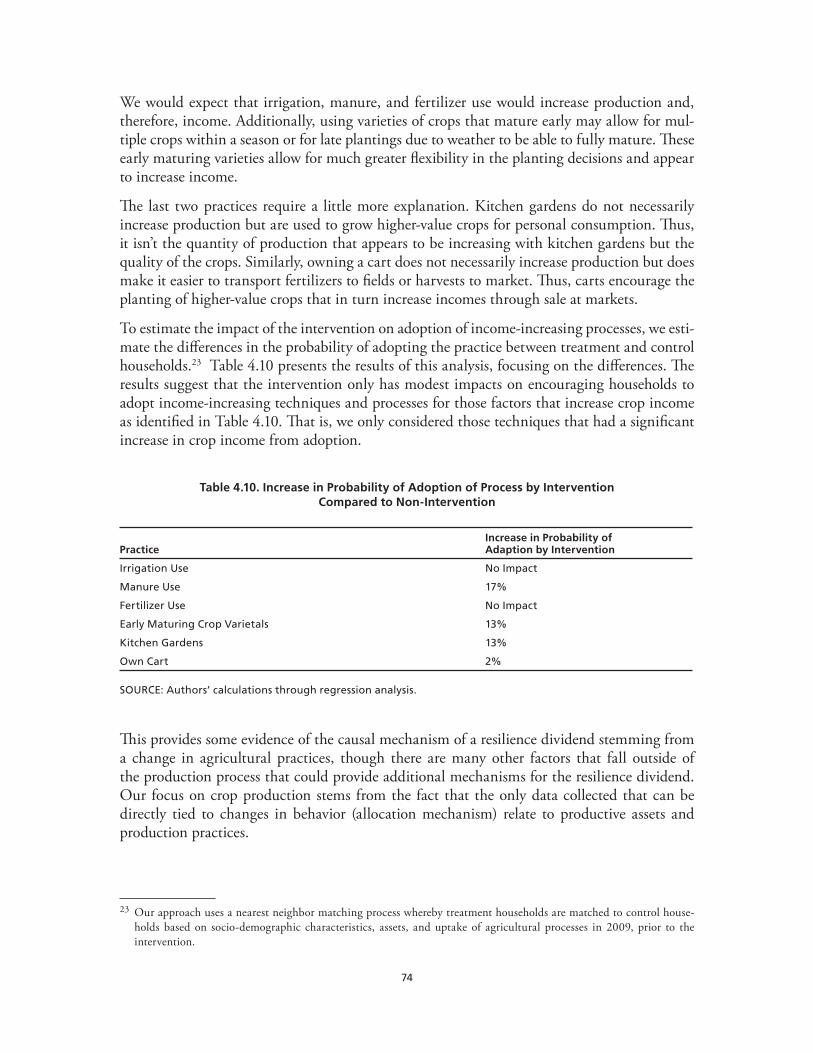
74
We would expect that irrigation, manure, and fertilizer use would increase production and, therefore, income. Additionally, using varieties of crops that mature early may allow for mul-tiple crops within a season or for late plantings due to weather to be able to fully mature. These early maturing varieties allow for much greater flexibility in the planting decisions and appear to increase income.
The last two practices require a little more explanation. Kitchen gardens do not necessarily increase production but are used to grow higher-value crops for personal consumption. Thus, it isn’t the quantity of production that appears to be increasing with kitchen gardens but the quality of the crops. Similarly, owning a cart does not necessarily increase production but does make it easier to transport fertilizers to fields or harvests to market. Thus, carts encourage the planting of higher-value crops that in turn increase incomes through sale at markets.
To estimate the impact of the intervention on adoption of income-increasing processes, we esti-mate the differences in the probability of adopting the practice between treatment and control households.23 Table 4.10 presents the results of this analysis, focusing on the differences. The results suggest that the intervention only has modest impacts on encouraging households to adopt income-increasing techniques and processes for those factors that increase crop income as identified in Table 4.10. That is, we only considered those techniques that had a significant increase in crop income from adoption.
Table 4.10. Increase in Probability of Adoption of Process by Intervention Compared to Non-Intervention
PracticeIncrease in Probability of Adaption by Intervention
Irrigation Use No Impact
Manure Use 17%
Fertilizer Use No Impact
Early Maturing Crop Varietals 13%
Kitchen Gardens 13%
Own Cart 2%
SOURCE: Authors’ calculations through regression analysis.
This provides some evidence of the causal mechanism of a resilience dividend stemming from a change in agricultural practices, though there are many other factors that fall outside of the production process that could provide additional mechanisms for the resilience dividend. Our focus on crop production stems from the fact that the only data collected that can be directly tied to changes in behavior (allocation mechanism) relate to productive assets and production practices.
23 Our approach uses a nearest neighbor matching process whereby treatment households are matched to control house-holds based on socio-demographic characteristics, assets, and uptake of agricultural processes in 2009, prior to the intervention.

75
For other aspects of the intervention, data do not exist to explicitly estimate the causal mecha-nism that stems from our conceptualization of the system in Figure 4.6. Importantly though, there are additional aspects to the intervention that have not been explicitly incorporated that may be important and were excluded solely based on data availability.
The approach used in the previous section assumes that the intervention is constant across households and communities. The present analysis allows us to know which of the dimen-sions of the intervention produced a positive resilience dividend. We are able to identify which aspects of the intervention increased income as well as which aspects were successfully incor-porated into behavior.
Conclusions and Lessons Learned
The Oxfam–Pakistan case shows that it is feasible to estimate elements of the resilience divi-dend using one year of post-project survey data. The structure of the data allowed us to esti-mate the per-household partial resilience dividend in 2012 using a treatment/control group data structure, in which the households are comparable in most pre-intervention characteris-tics. The control group provides us with the BAU case necessary to use the RDVM. Addition-ally, because the comparison communities were selected based not only on community charac-teristics but also on their geography, there should be correlation between treatment and control households and the impact of shocks. The treatment households were no more or less likely to experience a flooding or rainfall event than the control households.
By using prices collected for some agricultural goods, we are able to aggregate production across a variety of crops so that they are comparable. We can then construct a simple measure of what is a complex well-being construct. In the absence of knowledge of preferences, prices provide a way to aggregate based on social rather than individual tradeoffs.
While successful in these respects, we note several limitations that might be overcome in the future. First, the data’s temporal resolution and content were not optimal for calculating the full resilience dividend. While the available data provided enough information to esti-mate partial agricultural incomes in 2012, it did not include information sufficient to estimate virtual income related to livestock, nor was cost information collected. Furthermore, we lacked information on the behavior of households with respect to the safety net and insurance aspects of the intervention, and overall levels of flood exposure were not measured. Finally, no data was collected on other potentially transformative dimensions that might have been affected by the intervention, such as social trust and income unrelated to agriculture.
To fully document the temporal dimensions and associated capacities that contribute to a resil-ience dividend in an ex post setting, we need information collected prior to the project (a base-line) and information collect a short time after project completion but before a shock (to esti-mate potential co-benefits), immediately following a shock (to estimate changes in absorptive capacity), and some chosen length of time post-shock (to allow for recovery). Ideally, we would like to estimate the resilience dividend in terms of adaptive, absorptive, and recovery capacities, but because we only have a single observation for each household, this cannot be done.
76
Another challenge with estimating the resilience dividend for those that experience the shock is that we must condition on the observed event. Estimating the resilience dividend associated with a particular shock is difficult, since the shock may completely overwhelm a household or community’s absorptive capacity, even if that capacity has expanded as part of the interven-tion and we may falsely assume that the value of the investments is zero. Alternatively, a system may completely absorb a shock if the absorptive capacity is greater than the size of a shock. In this case it may appear that no shock has occurred, and we may estimate that the value is zero since we no longer observe the shock. Between these two extremes, the intervention may have reduced but not eliminated the impacts of the shock. Furthermore, an ex post stance does not allow us to estimate outcomes across multiple potential shocks, which is often a key objective of projects designed with a resilience lens.
Post-project, post-shock estimation of the resilience dividend is complicated by the length of time between project/shock and data collection. From our agricultural practices analysis, we know that there are differences in adoption by household that drive significant changes in income in the absence of a shock. But the shocks occurred during the implementation of the project and may simply have mitigated some of the effects of the shocks. That is, since the project was ongoing at the time of the shock, the project may have acted as a recovery mecha-nism and not changed the structure of the system either through the allocation mechanism or capital stocks.
In terms of transformative capacity, the Oxfam–Pakistan intervention is attempting to change how households behave in the long run. A single growing season may not be long enough for households to fully learn behavioral changes instigated by the intervention, and effects may grow or be more widely distributed across a community or region over time. While additional data over the longer term could help shed light on this process, the ability to determine a casual effect from the intervention versus other interventions or circumstances is complicated the further removed one is from project completion.
The key lesson learned from the Oxfam–Pakistan case is that the joint development of a conceptual model of the system and the development of an evaluation and data collec-tion mechanism are important when the goal is to estimate the resilience dividend of an investment in a quantitative manner. While we recognize that scarcity of resources often limit what data can be collected, future researchers facing such limitations should prioritize data collection for the elements of the dividend that are most important, in a manner that allows for the recovery of the resilience dividend elements of interest.
Diamond Valley
This case study is based on the RDVM. It provides a demonstration of how RDVM can be applied in real-world situations. The case can be read on its own, but it is part of the broader package that includes five other case studies presented in Chapter 4 and the lessons learned from all the cases in Chapter 5. This case study is intended primarily to help readers under-stand how to apply the RDVM framework given a set of data and information about a given project. Any estimate of the resilience dividend is provided as an example and is not necessarily a complete estimate.

77
This study highlights how to calculate the resilience dividend in an ex ante case involving a stressor—in this case, the drop in the water table caused by over-extraction of groundwater. Based on existing analyses, we calculate the benefit (in terms of agricultural profits) of a grad-ual change in allowable water withdrawals over 30 years compared to a sudden curtailment in year 10. We also discuss the public good aspects of the case and how these benefits might be quantified. Because a pre-existing hydroeconomic model and related analysis exists yet no information is provided on the public good benefits of community viability and cohesion, we report only a partial resilience dividend quantitatively. The public good benefits are qualita-tively discussed.
Executive Summary
The Diamond Valley groundwater basin in Nevada is a largely agricultural region character-ized by a system of water rights to extract and use groundwater. The rights are over-allocated, and water usage far exceeds the rate at which groundwater can be extracted without the overall groundwater level declining. As a result of many years of over-withdrawal, the Nevada State Engineer (NSE) declared the basin a Critical Management Area and gave the region 10 years to develop a groundwater management plan that stabilizes groundwater levels before pumping becomes uneconomical for all. If such a plan is not developed, the NSE is legally required to curtail the legal right of junior rightholders to groundwater in order to bring long-run con-sumption in line with supply.24
The Rockefeller Foundation provided support to Duke University’s Nicholas Institute for Environmental Policy Solutions and Professor Mike Young to do the following:
1. provide technical assistance to help inform the development of a groundwater management plan, and
2. complete a quantitative assessment of the expected benefits of a curtailed and decoupled (share-based, rather than quantity-based) rights system in the region using a hydro-economic model of the agricultural system.
A report on the quantitative assessment was delivered to the Rockefeller Foundation,25 and we use this information in this case study to assess the resilience dividend that may result from imposing a share-based rights system. As such, the proposed intervention is an institutional change (water rights structure and enforcement), which in turn changes behavior of agricul-tural producers (allocation mechanism), which in turn changes the values associated with the production of crops and the values associated with overall community vitality and stability. Key case elements are reported in Table 4.11.
24 Doing nothing at all would result in continued exploitation of the resource as restricted common property, depleting groundwater and raising pumping costs to unsustainable levels.
25 Young, M., et al. (2015). Unbundling water rights: A blueprint for development of robust water allocation systems in the western United States. Duke Nicholas Institute for Environmental Policy Solutions.
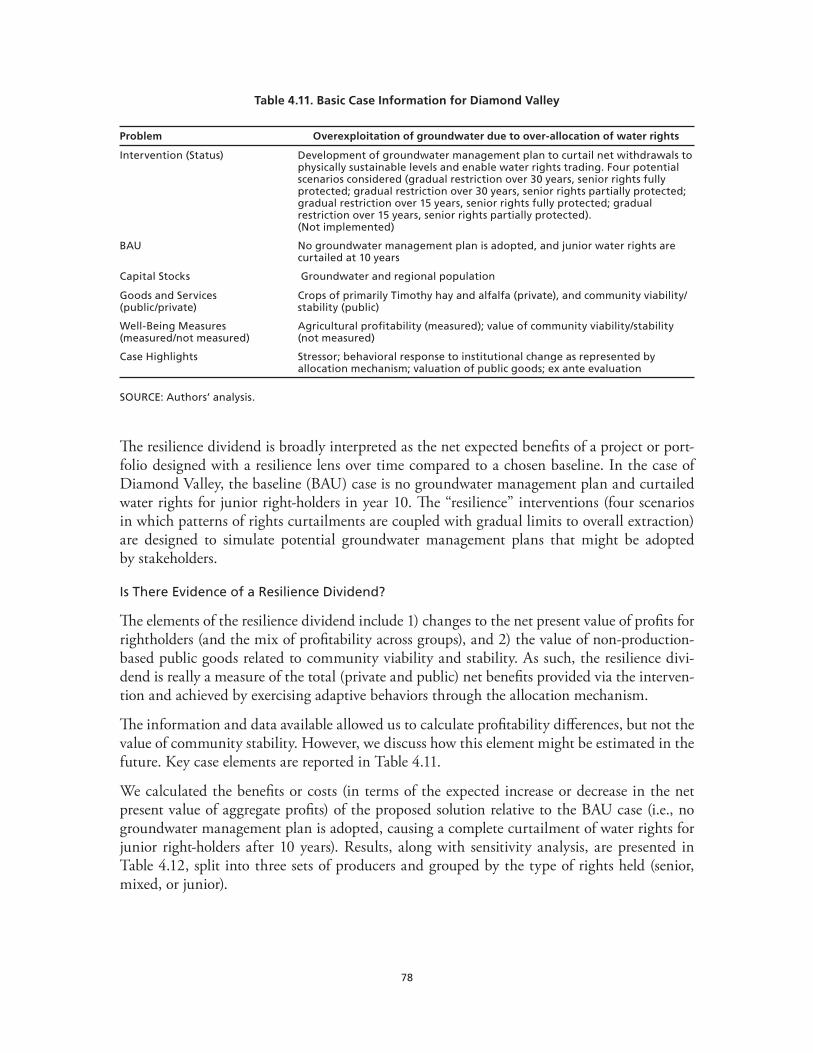
78
Table 4.11. Basic Case Information for Diamond Valley
Problem Overexploitation of groundwater due to over-allocation of water rights
Intervention (Status) Development of groundwater management plan to curtail net withdrawals to physically sustainable levels and enable water rights trading. Four potential scenarios considered (gradual restriction over 30 years, senior rights fully protected; gradual restriction over 30 years, senior rights partially protected; gradual restriction over 15 years, senior rights fully protected; gradual restriction over 15 years, senior rights partially protected). (Not implemented)
BAU No groundwater management plan is adopted, and junior water rights are curtailed at 10 years
Capital Stocks Groundwater and regional population
Goods and Services (public/private)
Crops of primarily Timothy hay and alfalfa (private), and community viability/stability (public)
Well-Being Measures (measured/not measured)
Agricultural profitability (measured); value of community viability/stability (not measured)
Case Highlights Stressor; behavioral response to institutional change as represented by allocation mechanism; valuation of public goods; ex ante evaluation
SOURCE: Authors’ analysis.
The resilience dividend is broadly interpreted as the net expected benefits of a project or port-folio designed with a resilience lens over time compared to a chosen baseline. In the case of Diamond Valley, the baseline (BAU) case is no groundwater management plan and curtailed water rights for junior right-holders in year 10. The “resilience” interventions (four scenarios in which patterns of rights curtailments are coupled with gradual limits to overall extraction) are designed to simulate potential groundwater management plans that might be adopted by stakeholders.
Is There Evidence of a Resilience Dividend?
The elements of the resilience dividend include 1) changes to the net present value of profits for rightholders (and the mix of profitability across groups), and 2) the value of non-production-based public goods related to community viability and stability. As such, the resilience divi-dend is really a measure of the total (private and public) net benefits provided via the interven-tion and achieved by exercising adaptive behaviors through the allocation mechanism.
The information and data available allowed us to calculate profitability differences, but not the value of community stability. However, we discuss how this element might be estimated in the future. Key case elements are reported in Table 4.11.
We calculated the benefits or costs (in terms of the expected increase or decrease in the net present value of aggregate profits) of the proposed solution relative to the BAU case (i.e., no groundwater management plan is adopted, causing a complete curtailment of water rights for junior right-holders after 10 years). Results, along with sensitivity analysis, are presented in Table 4.12, split into three sets of producers and grouped by the type of rights held (senior, mixed, or junior).
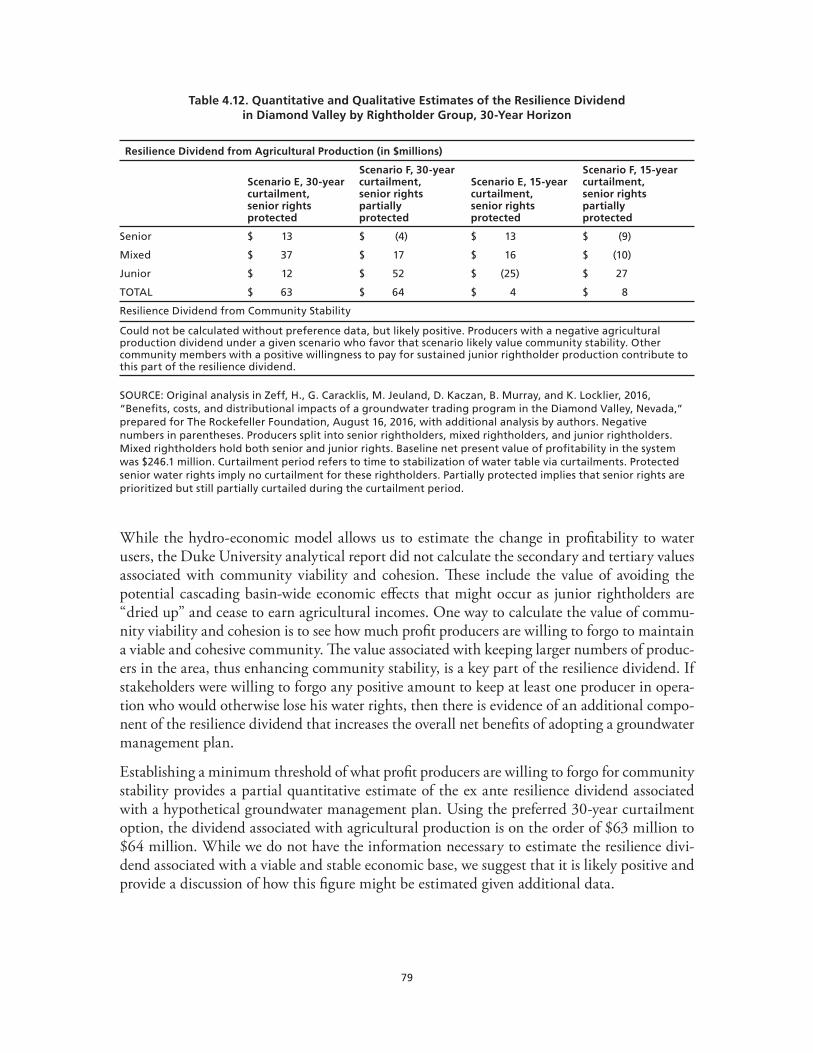
79
Table 4.12. Quantitative and Qualitative Estimates of the Resilience Dividend in Diamond Valley by Rightholder Group, 30-Year Horizon
Resilience Dividend from Agricultural Production (in $millions)
Scenario E, 30-year curtailment,senior rights protected
Scenario F, 30-year curtailment,senior rights partially protected
Scenario E, 15-year curtailment,senior rights protected
Scenario F, 15-year curtailment,senior rights partially protected
Senior $ 13 $ (4) $ 13 $ (9)
Mixed $ 37 $ 17 $ 16 $ (10)
Junior $ 12 $ 52 $ (25) $ 27
TOTAL $ 63 $ 64 $ 4 $ 8
Resilience Dividend from Community Stability
Could not be calculated without preference data, but likely positive. Producers with a negative agricultural production dividend under a given scenario who favor that scenario likely value community stability. Other community members with a positive willingness to pay for sustained junior rightholder production contribute to this part of the resilience dividend.
SOURCE: Original analysis in Zeff, H., G. Caracklis, M. Jeuland, D. Kaczan, B. Murray, and K. Locklier, 2016, “Benefits, costs, and distributional impacts of a groundwater trading program in the Diamond Valley, Nevada,” prepared for The Rockefeller Foundation, August 16, 2016, with additional analysis by authors. Negative numbers in parentheses. Producers split into senior rightholders, mixed rightholders, and junior rightholders. Mixed rightholders hold both senior and junior rights. Baseline net present value of profitability in the system was $246.1 million. Curtailment period refers to time to stabilization of water table via curtailments. Protected senior water rights imply no curtailment for these rightholders. Partially protected implies that senior rights are prioritized but still partially curtailed during the curtailment period.
While the hydro-economic model allows us to estimate the change in profitability to water users, the Duke University analytical report did not calculate the secondary and tertiary values associated with community viability and cohesion. These include the value of avoiding the potential cascading basin-wide economic effects that might occur as junior rightholders are “dried up” and cease to earn agricultural incomes. One way to calculate the value of commu-nity viability and cohesion is to see how much profit producers are willing to forgo to maintain a viable and cohesive community. The value associated with keeping larger numbers of produc-ers in the area, thus enhancing community stability, is a key part of the resilience dividend. If stakeholders were willing to forgo any positive amount to keep at least one producer in opera-tion who would otherwise lose his water rights, then there is evidence of an additional compo-nent of the resilience dividend that increases the overall net benefits of adopting a groundwater management plan.
Establishing a minimum threshold of what profit producers are willing to forgo for community stability provides a partial quantitative estimate of the ex ante resilience dividend associated with a hypothetical groundwater management plan. Using the preferred 30-year curtailment option, the dividend associated with agricultural production is on the order of $63 million to $64 million. While we do not have the information necessary to estimate the resilience divi-dend associated with a viable and stable economic base, we suggest that it is likely positive and provide a discussion of how this figure might be estimated given additional data.

80
Diamond Valley Background
Diamond Valley is a 752-square-mile, largely agricultural, groundwater hydrologic area in north-central Nevada (largely Eureka County). Timothy hay and alfalfa are the primary irri-gated crops, grown on 20,000–26,000 acres and irrigated using groundwater, which is allo-cated under a rights structure known as the prior appropriation doctrine. Under this system, a rightholder is granted a legal right by the state (via the Nevada State Engineer, or NSE) to extract a certain quantity of water for “beneficial use.” Rights are ordered by seniority, with rights established earlier in time taking precedence over junior rights if sufficient water is unavailable.
Approximately 95 percent of committed rights are for irrigation, with the rest split among domestic, municipal, mining, and livestock uses. The town of Eureka pumps approximately 179 acre-feet per year from two wells in the Diamond Valley, domestic wells pump approxi-mately 250 acre-feet, and the mining industry pumps 600-800 acre-feet. In addition, livestock rights total 850 acre-feet per year, and commercial use totals 109 acre-feet/ year.
Groundwater in the Diamond Valley has been over-appropriated by a factor of about 4 ½ when considering all water rights in the basin (see Figure 4.7). Perennial yield, defined as the maxi-mum amount of groundwater that can be consumed in the long run without depleting the reservoir, is estimated at approximately 30,000–35,000 acre-feet/year, while total committed underground water rights total 130,748–134,152 acre feet/year.26 However, it is estimated that some of these rights are not being exercised, resulting in about 75,000 acre-feet of consumptive use. As a result of over-extraction, water levels have dropped significantly since the 1960s, with areas near the most pumping activity declining by over 100 feet. Water levels are dropping from 1 to 3 feet/ year across the valley (with some significant intra-year variation).
Figure 4.7. 2016 Annual Allocated Water Rights vs. Estimated Consumptive Use vs. Perennial Yield
Commited Rights121,000 – 134,000 af
Estimated Use~ 75,000 af
Perennial Yield30,000 – 35,000 af
NOTES: af = acre-feet. Figure is to scale. Perennial yield is level of maximum sustainable consumptive use for which groundwater levels are not projected to decline over time.
SOURCE: Derived from data in Eureka County Water Resources Master Plan, September, 2016.
26 Eureka County. (2016). Eureka County Water Resources Master Plan. Eureka, NV.
81
Largely in response to this issue, Diamond Valley was designated a critical management area (CMA) by the NSE on August 25, 2015. This legal status (NRS 534.100(7)) compels local rightholders to develop and implement a groundwater management plan (GMP) within 10 years to bring consumption in line with perennial yields. This plan would set the conditions for the basin’s CMA designation to be removed. The GMP must be approved by a majority of the rightholders as well as the NSE. Failure to do so would result in the NSE curtailing water rights on the basis of seniority, resulting in approximately 60 percent less pumping in the region. The ability (or inability) of the community to agree on such a plan reflects the inte-grated character (or lack thereof) of the system in terms of the ability to collectively solve a self-induced stressor.
The GMP in Diamond Valley is currently being developed, so thus far, there has been no change in the structure of water rights. The Rockefeller Foundation provided support to Duke University’s Nicholas Institute for Environmental Policy Solutions and Professor Mike Young to 1) provide technical assistance to help inform the development of the GMP, and 2) complete a quantitative assessment of the expected benefits of a share-based, rather than quantity-based, rights system in the region. As such, this case is a forward-looking, ex ante analysis of the resil-ience dividend associated with the implementation of a hypothetical GMP in response to the (man-made) stressor of over-withdrawal of groundwater.
Applying the Resilience Dividend Model to Estimate the Potential Dividend for the Diamond Valley
The system under consideration is the quantity-based agricultural-hydrological system. The GMP is the hypothetical intervention. The objective of the analysis is to compare the differ-ences in well-being outcomes for stakeholders in the region with and without a GMP. We assume that the BAU case, without the intervention, would be a scenario in which the NSE curtails water rights on the basis of seniority so that long-run water balance in the region is achieved.
The following subsections detail the elements and assumptions of the model, which is graphically illustrated in Figure 4.8.

82
Figure 4.8. Mapping of the Basic Diamond Valley System
* Includes farm profits and saleof water rights (for trading
scenarios)
AgriculturalProfits*• Senior• Junior• MixedWTP forStability ofBase
Groundwater
Population
Timothy Hay
Alfalfa
Stability ofEconomicand Social
Base
NOTES: WTP = willingness to pay.
SOURCE: Authors’ analysis.
Capital Stocks
The primary capital stock in the Diamond Valley system is the supply of groundwater in the aquifer (represented by the blue rectangles in Figure 4.8). Groundwater is currently allocated based on prior appropriations, and the intervention considers an alternative to the mecha-nism.27 Both the project scenarios and the BAU scenario result in a long-run equilibrium in which net aquifer recharge equals net aquifer withdrawals.
Land, human capital, and man-made capital are additional capital stocks in the model, which are used together to grow crops. While changing the water rights structure is not expected to increase the agricultural productive capacities of these assets, it is possible that the population (quantity of human capital) could either increase (due to in-migration) or decrease (due to out-migration) as a result of the policy change. This has the potential to impact overall regional economic development in the long run. We discuss this further in the next subsection.
While man–made capital, such as residential housing and irrigation equipment, and land could be included as explicit productive assets in the model, we do not expect the intervention to affect how those assets evolve, except perhaps in the case of ceasing production. We assume that the evolution of population acts as a proxy for the evolution of these assets as well.
Goods and Services
Given the agricultural nature of the basin, the primary goods and services in the model are two crops; Timothy hay and alfalfa, which are sold for profit (represented as red circles in
27 Although this natural capital stock is officially owned by the people of the state of Nevada, it is not, strictly speaking, an open access resource given the prior appropriation rights structure that requires a permit or certificate to withdraw water for purposes other than domestic use.
83
Figure 4.8). Historically, irrigators in the basin have grown Timothy hay and alfalfa on an 11-year rotation. While there may be some potential for a producer whose water rights are curtailed to switch to a less water-intensive crop, specific information on the likelihood of this crop substitution is unavailable. We assume that land and water are perfect complements in agricultural production.
Previous analytical efforts have not modeled the underlying development dynamics and community viability/stability of the Diamond Valley. Zeffet et al. explicitly did not model these dynamics, and the Eureka County Water Resources Master Plan used linear regression techniques to extrapolate population through 2050. Neither of these assumptions takes into account the effect of available water through water rights structures on in- or out-migration patterns, though theory suggests that there may be a relationship.28
While estimating such a relationship is beyond the scope of this study,29 we posit that the economic viability of the Diamond Valley, including the town of Eureka, is likely a public good for many residents, in that they would be willing to pay some amount to ensure it. The link between this economic vitality and water resources is stated directly in the Eureka County Code:
Eureka County will continue to work to maintain its water resources in a condition that will render it useable by future generations for the full range of beneficial uses that further a viable and stable economic and social base for its citizens.30
In the absence of additional analytical information, we assume that the collective vitality, sta-bility, and health of the overall economic base in Diamond Valley is an unobservable public good that is collectively produced within the system. It is represented by the stock of popu-lation that remains in agricultural production. Below, we discuss how changes in this stock translate into potential changes in the value of the system.
Well-Being
There are two primary measures of well-being in this model. The first is agricultural profits, which arise from producing the two crops and, potentially, buying and selling water rights within the system. We defined three groups of producers in terms of the seniority of water rights they hold: senior, junior and mixed rightholders. We assume that profitability is deter-mined largely by the executable water right held by each rightholder.
The second measure of well-being is the overall benefit of the “viable and stable economic and social base” to Diamond Valley residents. This is a catch-all category for any quasi-public good generated through the exploitation of the resource (which includes any and all use and non-use benefits, such as economic opportunity, sense of place, expected general equilibrium
28 Zeff, H., et al. (2016). Benefits, costs, and distributional impacts of a groundwater trading program in the Diamond Valley, Nevada. New York: Rockefeller Foundation.
29 Possibilities for future analysis include a survey-based contingent behavior study of basin residents, though this would not necessarily provide any insight into future in-migration behavior.
30 Eureka County. (2016). Eureka County Water Resources Master Plan, 1-2. Eureka, NV.

84
effects from supply chain effects, support of any ecosystem services, etc.).31 We assume that these values are related to the overall long-term viability of current agricultural producers in the region and that these values would be negatively affected by the inability of current right-holders’ to use groundwater for production into the future.
Other Model Elements and Assumptions
The primary intervention in this case is institutional in nature. Changing the structure of property rights to a groundwater resource changes the rules of the game under which agri-cultural producers operate, and their decisions affect the regional economy. Once this change occurs, producers are assumed to maximize their profits (by extracting the groundwater legally allowed under the new regime, buying and selling their water rights, and/or ceasing produc-tion), though it is likely that both overall production and profitability will change. Given that the new regime is specifically designed to limit aggregate groundwater consumption, the natu-ral capital stock of groundwater will be affected by new pumping and production rates, and the potential economic development path of the region might be impacted (as represented by changes in population as regional economic conditions change). However, as we have no infor-mation about future development paths, we assume that the number of potential irrigators is unchanged.
We refer to the relationships described above as the allocation mechanism in the resilience dividend model. The allocation mechanism represents how agents operate given the capital stocks available to them and the various constraints on their behavior. For example, changing the water rights structures in the Diamond Valley system does not directly change the level of groundwater in the aquifer, but it does change the behavior of the agricultural producers in the region (e.g., pumping at different rates, producing different quantities of crops, and differential migration patterns of irrigators). This, in turn, indirectly affects the evolution of the groundwa-ter resource (in fact, this is the goal of both the hypothetical intervention and the BAU case). The assumed allocation mechanism, and the behavior it represents, can thus be seen as an important element of the resilience dividend model, with direct bearing on the calculation of the resilience dividend.
There are several elements that are not included in the model due to a lack of data. First, we do not include bankruptcies, monitoring costs, legal costs, or other financial costs that might be associated with a change of the system.32 We also do not include the potential for lower transac-tion costs of trading water rights compared to the current system and the corresponding costs associated with any “water banking” system.33 Because trading is assumed to be transaction-cost free in the analytics and no new administrative costs are modeled, it is implicitly assumed that these savings and costs offset each other in the calculation of the resilience dividend. Furthermore, for simplicity, it is assumed that there are no shocks or stressors (man-made or natural) related to the other factors of production.
31 We do not have enough information in the data to clearly define the sub-elements of this category of benefits, and argue later in the case that use of a broad category can, in theory, capture heterogeneity of preferences across individuals.
32 This and the lack of (modeling banking) is an inherited assumption from Zeff et al. (2016) on which the analysis is based.
33 Young, M., et al. (2015). Unbundling water rights: A blueprint for development of robust water allocation systems in the western United States. Duke Nicholas Institute for Environmental Policy Solutions.

85
Second, the analysis does not assess the benefits that come from the ability to bank unused water in any given year for use in a subsequent year. However, we suspect that modeling trad-ing activity as costless would likely mitigate any bias that might come from this exclusion.
Third, the original modeling effort did not include future climatic or other risks. Changing environmental conditions could affect the analysis, though this is likely less important for groundwater than for surface water allocation issues. Future research could extend the analysis to incorporate climate risk if average recharge rates are expected to change over time.
Fourth, we assume that a lack of available water leads to plot abandonment and a lack of addi-tional economic opportunity (either on-farm or off-farm) for these producers. If substitute eco-nomic activities are available, including the possibility of alternative crops or increases in the technical efficiency of irrigation, then the resilience dividend may be overestimated.34
Finally, it is assumed that any new system of water rights can be enforced cost-free. This is an assumption made in the original analysis, but it does have implications for the resilience divi-dend. In particular, if monitoring and enforcement costs were positive, then the resilience divi-dend would be overstated by the net present value of these costs over the assumed time horizon. In addition, “cheating” by irrigators (i.e., overdrawing water relative to their allotment) would lead to increased private profitability at the expense of others.
Empirical Methods
As mentioned earlier, a quantitative assessment of the expected benefits of a share-based, rather than quantity-based water rights system in the region was performed by researchers at Duke’s Nicholas School and Professor Mike Young.35 The authors developed a hydro-economic model that simulated groundwater pumping and levels, agricultural profits, and water rights transfers in the Diamond Valley over 30 years for 401 current water permits or certificates. These results form the basis for calculating the portion of the resilience dividend related to agricultural production.
The authors investigated six scenarios that varied in how water rights would be restricted rela-tive to the status quo (prior appropriation or proportional shares), in whether curtailed water rights would be sudden or gradual, and in whether water rights could be traded. Data on cur-rent rights, current production practices (center pivot irrigation systems), estimated depth to groundwater at each wellhead, crop budgets, and crop prices were used as parameters in the model. The model determined water rights prices, where applicable, in accordance with the value of the marginal acre-foot used in each scenario.
Irrigators are assumed to maximize their total profit by choosing optimal pumping levels for each well/plot that they own, subject to covering the fixed costs of operating that plot and the variable costs associated with pumping, which depends on the aquifer level. They can also buy or sell rights/shares in accordance with market-clearing prices and can choose to extend their
34 If the change in rights structures, however, provided additional information to irrigators that enhanced profitability, the resilience dividend may be augmented.
35 Zeff, H., et al. (2016). Benefits, costs, and distributional impacts of a groundwater trading program in the Diamond Valley, Nevada. New York: Rockefeller Foundation.
86
wells (at a cost) to a maximum depth of 300 feet.36 Decisions are made annually. All markets (including the water market where trading is allowable) clear each year. Irrigators are not for-ward-looking, and the model is deterministic (no random variations in precipitation, recharge, or input use). Rightholders differ in terms of seniority and quantity of right and depth to water table at each well, but face the same market prices and obtain the same yields per unit of land irrigated. Producers are assumed to operate independently and to have no additional economic opportunities to generate income outside of agriculture.37 In terms of system characteristics, it is assumed that producers know the depth of the water table for their plots (awareness) and that water is essential for production (lack of system diversity or available substitutes). Readers interested in additional technical details are referred to the original analysis.38
For the purposes of this case study, we assume that modeling scenario (B), “sudden curtailment based on prior appropriation without trading”—is the BAU (baseline without a GMP) sce-nario. Under this scenario, reflecting current law, the current water rights regime persists for 10 years, followed by immediate cancellation of the most junior rights until net extraction equals 35,000 acre-feet per year. After 10 years, 79% of current water right parcels (318 out of 401) are curtailed as a result of the nullification of all groundwater rights appropriated since 1960.
To account for uncertainty in the actual GMP, we examine the agricultural production resil-ience dividend associated with two “project” scenarios: (E) “Shared-based trading with gradual curtailment and protection for senior rightholders” and (F) “Shared-based trading with grad-ual curtailment for all rightholders.”
In scenario (E), the most senior rightholders whose allocations total a combined 35,000 acre-feet per year (the rate at which groundwater replenishes) have their current rights protected.39 All other (junior) rights are converted to shares of the balance of unprotected assignable water, with the most junior converted into a 70% share of the total acre-feet associated with that right and the most senior converted to a 100% share. The total quantity of assignable water is gradu-ally reduced by 3 or 6 percent per year for 30 years until net allowable extraction is 35,000 acre-feet per year. Thereafter, all shares convert to zero and only senior water rights remain. Irrigators have the right to trade allocations.
Scenario (F) is identical to Scenario (E), except that it assumes that all rights (both junior and senior) are converted to shares based on priority date, with the most junior at 70% and the most senior at 100%. A summary is provided in Table 4.13.
36 It is assumed that pumping ceases at any well where the water table falls beyond 300 feet, the estimated bottom of the effective aquifer. Market clearing refers to a situation where quantity demanded is equal to quantity supplied. The associ-ated price is the market clearing price.
37 This is akin to assuming that lack of production causes a producer to leave the region.38 Zeff, H., et al. (2016).39 These are the rightholders in scenario B that would continue to produce.
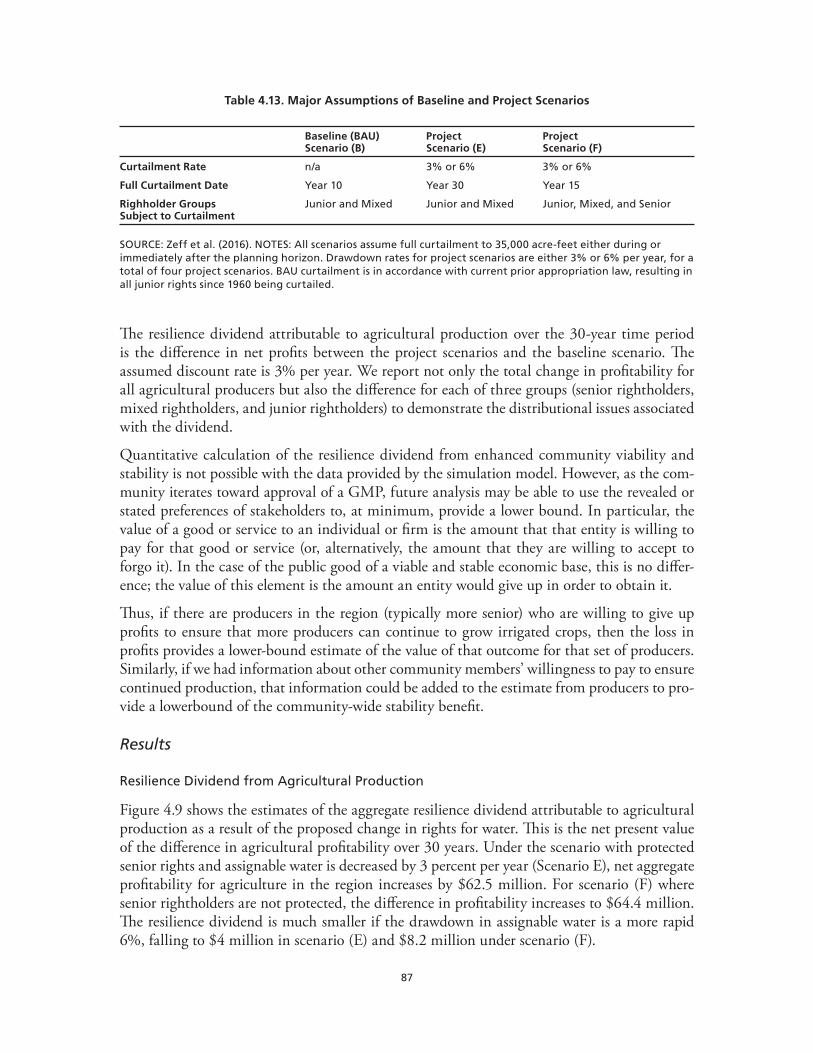
87
Table 4.13. Major Assumptions of Baseline and Project Scenarios
Baseline (BAU) Scenario (B)
Project Scenario (E)
Project Scenario (F)
Curtailment Rate n/a 3% or 6% 3% or 6%
Full Curtailment Date Year 10 Year 30 Year 15
Righholder Groups Subject to Curtailment
Junior and Mixed Junior and Mixed Junior, Mixed, and Senior
SOURCE: Zeff et al. (2016). NOTES: All scenarios assume full curtailment to 35,000 acre-feet either during or immediately after the planning horizon. Drawdown rates for project scenarios are either 3% or 6% per year, for a total of four project scenarios. BAU curtailment is in accordance with current prior appropriation law, resulting in all junior rights since 1960 being curtailed.
The resilience dividend attributable to agricultural production over the 30-year time period is the difference in net profits between the project scenarios and the baseline scenario. The assumed discount rate is 3% per year. We report not only the total change in profitability for all agricultural producers but also the difference for each of three groups (senior rightholders, mixed rightholders, and junior rightholders) to demonstrate the distributional issues associated with the dividend.
Quantitative calculation of the resilience dividend from enhanced community viability and stability is not possible with the data provided by the simulation model. However, as the com-munity iterates toward approval of a GMP, future analysis may be able to use the revealed or stated preferences of stakeholders to, at minimum, provide a lower bound. In particular, the value of a good or service to an individual or firm is the amount that that entity is willing to pay for that good or service (or, alternatively, the amount that they are willing to accept to forgo it). In the case of the public good of a viable and stable economic base, this is no differ-ence; the value of this element is the amount an entity would give up in order to obtain it.
Thus, if there are producers in the region (typically more senior) who are willing to give up profits to ensure that more producers can continue to grow irrigated crops, then the loss in profits provides a lower-bound estimate of the value of that outcome for that set of producers. Similarly, if we had information about other community members’ willingness to pay to ensure continued production, that information could be added to the estimate from producers to pro-vide a lowerbound of the community-wide stability benefit.
Results
Resilience Dividend from Agricultural Production
Figure 4.9 shows the estimates of the aggregate resilience dividend attributable to agricultural production as a result of the proposed change in rights for water. This is the net present value of the difference in agricultural profitability over 30 years. Under the scenario with protected senior rights and assignable water is decreased by 3 percent per year (Scenario E), net aggregate profitability for agriculture in the region increases by $62.5 million. For scenario (F) where senior rightholders are not protected, the difference in profitability increases to $64.4 million. The resilience dividend is much smaller if the drawdown in assignable water is a more rapid 6%, falling to $4 million in scenario (E) and $8.2 million under scenario (F).

88
Figure 4.9. Estimated Resilience Dividend from Agricultural Production, Net Present Value, 30-Year Time Horizon
$ -
$10
$20
$30
$40
$50
$60
$70
Scenario E, 3% Scenario F, 3% Scenario E, 6% Scenario F, 6%
Mill
ion
s $2
016
Scenario
NOTES: Scenario E protects all senior rights, with junior rights converting to shares and older rights keeping more water. Scenario F converts all rights to shares, with older rights keeping more water. 3% and 6% refer to assumed rate of decline of assignable water due to curtailment. Baseline net present value of profitability in the system was $246.1 million.
SOURCE: Original simulations in Zeff et al. (2016).
The magnitude of the resilience dividend is primarily governed by the speed of curtailment rather than how the allocation is determined. In particular, if rights are gradually curtailed under prior appropriation rather than shares as in Scenarios (E) and (F), then this component of the resilience dividend is estimated to be $57.4 million, or over 90% of the total dividend. The remainder is due to conversion to shares and trading.
In addition to splitting the agricultural production benefit between curtailment and rights structures, this analysis also highlights the importance of the counterfactual assumption. If, for example, the BAU case is a more gradual (3%) curtailment of groundwater pumping under current appropriation law, then the estimated resilience dividend shrinks considerably, to between $5 million and $7 million.
Although there is a positive resilience dividend in each case, the dividend is not positive for every group of rightholders. Figure 4.10 shows the resilience dividend for each group under the various drawdown rates and scenarios. Under scenario (E), protected senior right-holders gain $13 million as a result of the increased profitability stemming from the increased water table and the ability to trade water rights. Mixed rightholders gain under this scenario as well, though the gains under a 3% drawdown rate ($37.4 million) are slightly more than two times the gains under a 6% drawdown rate ($16.2 million). Despite leaving production entirely at some point in the planning horizon, junior rightholders gain $21.1 million at 3% but lose $25.2 million at 6% due to the rapid drawdown of assignable water and corresponding aban-donment of production.
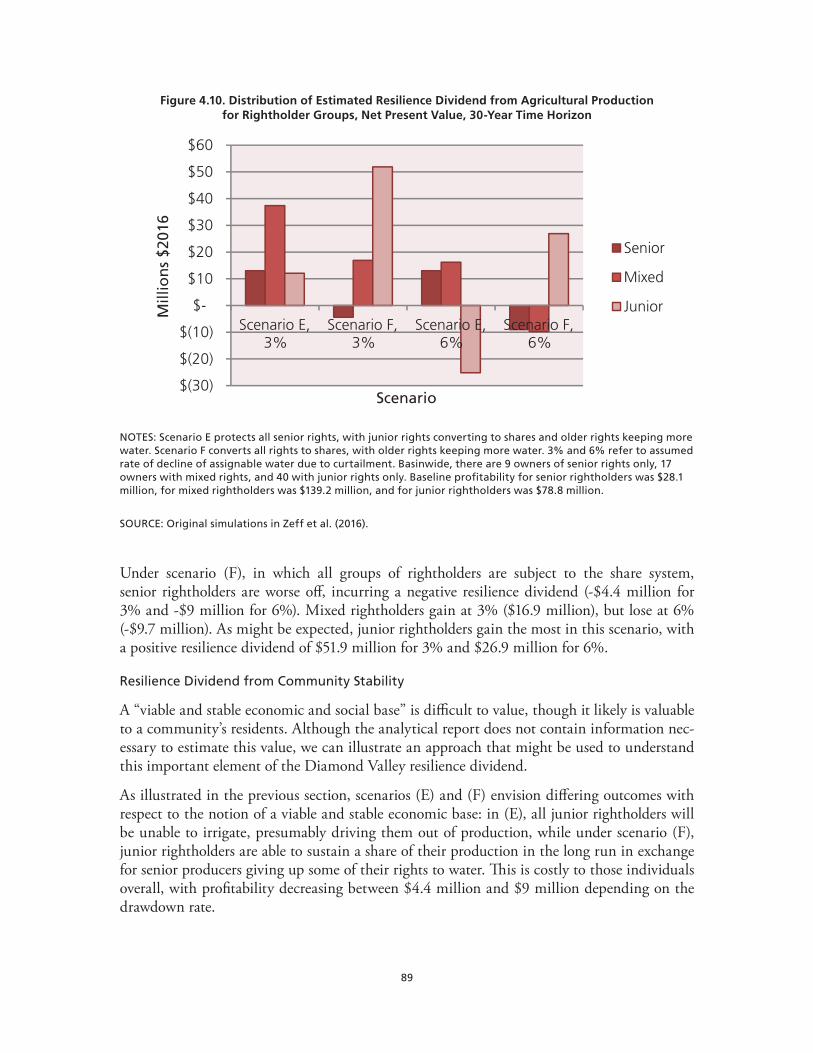
89
Figure 4.10. Distribution of Estimated Resilience Dividend from Agricultural Production for Rightholder Groups, Net Present Value, 30-Year Time Horizon
$(30)
$(20)
$(10)
$-
$10
$20
$30
$40
$50
$60
Scenario E,3%
Scenario F,3%
Scenario E,6%
Scenario F,6%
Mill
ion
s $2
016
Scenario
Senior
Mixed
Junior
NOTES: Scenario E protects all senior rights, with junior rights converting to shares and older rights keeping more water. Scenario F converts all rights to shares, with older rights keeping more water. 3% and 6% refer to assumed rate of decline of assignable water due to curtailment. Basinwide, there are 9 owners of senior rights only, 17 owners with mixed rights, and 40 with junior rights only. Baseline profitability for senior rightholders was $28.1 million, for mixed rightholders was $139.2 million, and for junior rightholders was $78.8 million.
SOURCE: Original simulations in Zeff et al. (2016).
Under scenario (F), in which all groups of rightholders are subject to the share system, senior rightholders are worse off, incurring a negative resilience dividend (-$4.4 million for 3% and -$9 million for 6%). Mixed rightholders gain at 3% ($16.9 million), but lose at 6% (-$9.7 million). As might be expected, junior rightholders gain the most in this scenario, with a positive resilience dividend of $51.9 million for 3% and $26.9 million for 6%.
Resilience Dividend from Community Stability
A “viable and stable economic and social base” is difficult to value, though it likely is valuable to a community’s residents. Although the analytical report does not contain information nec-essary to estimate this value, we can illustrate an approach that might be used to understand this important element of the Diamond Valley resilience dividend.
As illustrated in the previous section, scenarios (E) and (F) envision differing outcomes with respect to the notion of a viable and stable economic base: in (E), all junior rightholders will be unable to irrigate, presumably driving them out of production, while under scenario (F), junior rightholders are able to sustain a share of their production in the long run in exchange for senior producers giving up some of their rights to water. This is costly to those individuals overall, with profitability decreasing between $4.4 million and $9 million depending on the drawdown rate.

90
If we assume that the difference in the sustainability of some portion of junior rightholders is a proxy for a viable and stable economic base, and we had information about the willingness of senior producers to accept the plan associated with scenario (F), then we would be able to at least bound the benefits associated with the public good. For example, if none of the nine senior rightholders supported scenario (F) over scenario (E), then there is no evidence that these rightholders value community stability (though this does not necessarily imply a zero valuation). However, if every rightholder supported scenario F, then we could assume that this group would value community stability at a value of at least $4.4 million in aggregate. In real-ity, we suspect that the value of community stability likely lies between these figures for most senior rightholders, though it is impossible to say exactly where this value may lie without them revealing or stating their choice. However, as the actual groundwater management plan is developed in the region, there would be evidence of a community stability resilience dividend if any particular producer is willing to accept less profitability in exchange for keeping junior rightholders in production.
Similarly, there were a total of 836 households in Eureka County (the valley’s predominate county), all of whom might conceivably value community stability in some manner. In theory, a stated preference exercise could be used to estimate each household’s willingness to pay for the outcomes associated with scenario (F) over scenario (E), with the sum equaling the total community stability benefit associated with scenario (F).40 In this exercise, researchers would use an experimentally designed survey to ask stakeholders about their willingness to pay for some proxy of community stability. The proxy could be their preference for a particular groundwater management plan or for the number of junior rightholders allowed to continue producing. These proxies would need to be identified as part of the research.
Next, we discuss an alternative estimate of the resilience dividend that further highlights the trade-offs between agricultural production and community stability and vitality.
Resilience Dividend Using a BAU Case
Given that the resilience dividend is an increment in net benefits over a baseline BAU case, it follows that the choice of baseline is critical. While the current situation in Diamond Valley (namely, its designation as a CMA and the associated legal obligations of the NSE) suggests that sudden curtailment of junior water rights in year 10 is obligated under the law, it is pos-sible that the system will continue to operate without further restrictions on water rights as it has in the past.
If this “no-action” scenario is used as a baseline, net present value of profits in the region over a 30-year horizon would be $397.5 million, compared to $246.1 million for a baseline in which rights were suddenly curtailed and $308.6 million–$310.5 million if rights were gradually cur-tailed over 30 years (scenarios E and F). Calculated this way, the resilience dividend related to agricultural production is a negative $87 million to $89 million.
40 Champ, P., et al. (2003). A primer on nonmarket valuation. Netherlands: Springer.

91
The difference in this particular baseline is that agricultural producers are assumed to continue extraction in accordance with their rights without curtailment—and continue to destabilize the water table. This ultimately increases pumping costs and extinguishes the resource. This maximizes the net present value of profits over the 30-year time horizon but destroys any long-run agricultural production due to the depletion of the aquifer. Relative to the status quo, any management plan is likely to cost producers in terms of profitability and is also likely to impair community stability and vitality.
Consideration of this alternative baseline highlights the short-run/long-run trade-offs between profitability and the long-term sustainability of the community as it exists today. It also pro-vides evidence that the portion of the resilience dividend related to the community public good is positive, as the NSE, presumably acting as an agent of the community, took action (via the critical management area designation) to deviate from the status quo. Because this action is likely to be costly to society (and agricultural producers in particular) relative to the status quo baseline, and assuming that the NSE was 1) a rational agent acting in the best interests of the community and 2) free to choose between operating according to that status quo and making the designation, one can deduce that there are additional positive social benefits in the form of community stability and vitality to the CMA designation. In present value terms, this value would be at least as large as the lost profitability of $87 to $89 million under the preferred 30-year gradual curtailment scenarios.
Resilience Dividend Summary
The fact that the NSE designated the Diamond Valley as a CMA and that stakeholders are currently engaging in a process to develop a groundwater management plan strongly suggests that at least some stakeholders see a path forward that is preferable to the baseline scenario of immediately curtailing junior water rights. The results presented here suggest that the net pres-ent value of profits would be increased relative to a sudden curtailment baseline if restriction of rights leading to long-run stabilization of groundwater levels occurred gradually. However, not all rightholder groups would necessarily benefit under all scenarios, and the overall magnitude of the profitability benefit is sensitive to the discount rate.41 Given the information available, we are unable to quantitatively estimate the benefits from community stability, but note that to the extent that stakeholders are willing to pay for this public good, then it should be included in the calculation of the full resilience dividend. There is evidence, based on the NSE designat-ing the region as a CAM, that this benefit is positive.
For decisionmakers, the possible existence of a public good benefit from community viability and stability suggests that making decisions on the basis of profitability alone may be mislead-ing (and result in underestimating the resilience dividend). For example, although the calcu-lated partial (profitability) dividend is very similar between scenarios (E) and (F), the long-run outcomes associated with scenario (E) after 30 years are identical to the baseline scenario. In scenario (F), however, some junior rightholders remain in production, and we assume this is
41 The discount rate is used in net present value calculations to enable comparison of monetary flows at different points in time. A positive discount rate suggests less weight on future flows. So, for example, the net present value of $100 next year with a discount rate of 10% would be $90. Note that discounting is the inverse of compounding, since $90 received today earning 10% interest over a year would be worth $100 in the next year.
92
associated with enhanced community stability benefits. If these are valuable, then the resil-ience dividend associated with scenario (F) is potentially much greater than that of (E), and may even outweigh the negative profitability effects for more senior rightholders. Furthermore, the very decision to begin taking action to stabilize the groundwater level (and thus give up profits in the shorter term to sustain longer-term production) provides evidence of a positive public good benefit related to community stability and vitality.
Lessons Learned
The ex ante Diamond Valley case illustrates 1) how parts of the resilience dividend can be estimated using a simulation model, 2) how the distribution of the resilience dividend can differ across stakeholder groups, and 3) how a public good benefit such as community eco-nomic and social stability might be bounded or estimated using revealed or stated preference information. It also highlights the importance of the allocation mechanism in determining the resilience dividend, and the feedbacks between the behavior it represents, the goods and services produced in the system, and the capital stocks that support that production. Further-more, it shows how we might conceptualize and estimate the resilience dividend in the case of a stressor, rather than a more discrete shock event or set of effects. We discuss the major lessons learned below.
Simulation modeling can be used to represent behavioral changes when institutions change or are predicted to change. The hydro-economic simulation model provided a means to value the difference in net profitability of agricultural producers in the region, allowing for different representations of water rights structures, and the distribution of the profit dif-ferential across three groups of water rightholders. Importantly, in this ex ante case in which a policy to address the groundwater stressor has not been enacted, there is no data available to empirically estimate changes in producer behavior when institutional structures (such as water rights) change. The outcomes of the hydro-economic simulation model, which links the natural (groundwater) and human (agricultural production) subsystems, represent one way in which the allocation mechanism, or behavioral responses to the change, can be esti-mated, especially for ex ante cases. We recommend that practitioners deciding between project options use appropriate methods to detail the expected behavioral changes associated with any project intervention.
Calculation of the resilience dividend may be highly dependent on assumptions made about adaptive and transformative capacities of the agents in the system. In cases where an institutional change is the primary intervention to deal with a shock or stressor, predicting behavior with and without the intervention is the key to the analysis. It is this behavior—and the aggregate patterns of system development that result—that ultimately drive the resilience dividend. This behavior in large part reflects the adaptive and (in the long run) transformative capacities of individuals and firms in the system. Particularly important in this regard are the abilities of agents to substitute one good or service for another (and at what cost), subject to the institutional rules of the system and the available capital stocks.
In the Diamond Valley case, the analysis made some very strict assumptions about the adaptive capacity of agricultural producers in the system. In particular, the analysis from the hydro-economic model assumed that groundwater was necessary in order to produce the two crops
93
grown in the region, that these crops would be fully irrigated when possible, and that water restrictions would result in less cultivated acreage. Agents, in the form of agricultural produc-ers, had choices involving 1) buying or selling water rights; 2) extending the depth of their wells based on the state of the groundwater capital stock; and 3) ceasing production entirely. The hydro-economic model captured this behavior using standard economic assumptions about rational economic behavior at the microeconomic level.
However, if the model failed to capture some relevant aspects of substitution within the system (e.g., using different irrigation strategies other than full irrigation for alfalfa, alterna-tive employment or entrepreneurship opportunities in the region, etc.), then the estimate of the resilience dividend (i.e., the aggregate net benefits of the intervention over time) is likely misstated. While this is a feature of structural modeling more broadly, it is a critically impor-tant aspect of modeling resilience outcomes when interventions involve information provision, changes in institutions that govern access to capital stocks or production possibilities, or other similar changes. We recommend that practitioners recognize and attempt to understand the likely behavioral modifications that any resilience project might be reasonably expected to induce, and how those changes map to changes in the goods and services that are ultimately consumed by stakeholders.
A positive resilience dividend does not necessarily imply positive net benefits for all stake-holders. Results showed that despite an overall positive resilience dividend for each of the four scenarios examined, there were both “winners” and “losers” in terms of profitability. Thus, an overall social net benefit, when aggregated, does not necessarily imply that everyone wins. We recommend that practitioners estimating a potential resilience dividend fully document, to the greatest extent possible, the distribution of net benefits across different stakeholder groups.
Timing of an intervention can affect the quantitative and qualitative magnitude of the resilience dividend. Just as there might be different qualitative impacts on differing stake-holders within a system (i.e., winners and losers as noted above), temporal dimensions of an intervention also may play a role. In this case, even though the long-run outcome between scenario (E) and the baseline case are identical (i.e., the complete drying up of junior rights within 30 years), the distribution of production possibilities across time drives the majority of the resilience dividend associated with profitability. In the baseline case, water levels stabilize at a higher level due to the curtailment of rights after 10 years, while the more gradual reduc-tions associated with scenarios (E) and (F) result in greater aggregate profitability over time (due in large part to extraction of more water in years 11–30). This changes overall levels of the net present value of profitability over the 30-year horizon. We recommend that practitio-ners understand that resilience interventions may not only result in differential outputs and outcomes over time, but also that the timing of interventions can affect the overall dividend.
Public good benefits (like community viability and stability) can be an important part of the resilience dividend. The value of any public or private good or service is the willingness to pay to obtain it (or, alternatively, the willingness to accept to forgo it). As such, evidence that any individual, firm, or group is willing to sacrifice one valuable good or service to obtain another is sufficient to determine that the other service is valuable. If public good benefits are valued by stakeholders, then the overall resilience dividend is underestimated by only using the difference in private benefits (i.e., profitability) between intervention scenarios and the
94
baseline. This can potentially lead to sub-optimal decisions and a lack of “apples-to-apples” comparison of benefits and costs.
In this case, the additional resilience dividend element is the value of a viable and stable eco-nomic base. We argued that if information existed that suggested some producers (or the general public) favored a management plan that would decrease their own profitability (or for which they would be willing to pay at least some amount), then this would be evidence of a community stability element to the resilience dividend. Although we currently lack such information, any realized management plan that results in decreased net profitability for senior rightholders relative to the baseline, but for which there is support from this group, will be evidence that this part of the resilience dividend is positive. We recommend that practitioners use the resilience dividend model to clearly map out the private and public outcomes that con-tribute to overall welfare of stakeholders.
Additional data on revealed or stated choices is sometimes needed to estimate the values associated with public good benefits. In some cases, the literature may have examples of secondary marginal or average values associated with public goods (such as ecosystem service benefits, which have been widely studied and documented). In others, such as this case, the overall value of community vitality and stability may be context-specific, unknown, or both. If researchers and decisionmakers are unable to transfer values from other studies, then infor-mation on preferred choices can be used as evidence for these components of the resilience dividend. Economists have developed a number of stated preference methods that could be used to estimate such values. We recommend that practitioners use values established in the literature to estimate public good benefits where possible, and consider collecting preference or choice data as part of ex post or ex ante project evaluation to fill in perceived gaps where no such information currently exists.
Even in the absence of preference data, observed actions suggest a positive resilience divi-dend related to community stability/viability. The actions of the NSE to designate the region as a critical management area and the resultant restriction of current water rights (either through gradual or sudden curtailment) implies that future profitability will be decreased rela-tive to the status quo over a 30-year horizon. A decision was made to incur this cost, implying that a corresponding benefit must exist to at least offset it. This provides evidence of a public good benefit that we assume is related to community stability and vitality, as stated in the Eureka Master Water Plan.
The components of this benefit are uncertain and likely different for different individuals but may include elements such as the avoidance of the transaction costs associated with potential relocation, the value of a sense of place, and option values related to future economic activity. Without additional information from stakeholders, we cannot say for sure which particular elements are predominant in the public good bundle; rather, we can use revealed behavior to argue only that some bundle exists and is valuable.
This illustrates a practical lesson for practitioners: while it may be desirable to try to identify each and every element of the resilience dividend at a detailed level, limited information and data may preclude doing so. In these cases, aggregating a set of (perhaps ill-defined) benefits into a broader category (like the benefits from community stability and vitality) and using revealed or stated choices that exploit variability across those outcomes can 1) provide evidence

95
for or against the existence of co-benefits of this type, and 2) accommodate differences in pref-erences across individuals or firms. Relying on the economic notions of willingness to pay (and willingness to accept) is theoretically attractive, consistent with the capital-theoretic approach to the resilience dividend, and can often be implemented using the threshold-type analysis we explored in this case.
The resilience dividend for a stressor alone does not involve disaster risk reduction ben-efits; rather, it is calculated as the net present value of the differential in welfare over a particular time horizon. Unlike many resilience projects that deal with preparation for a discrete shock or set of shocks, this case shows that a dividend can at least be partially esti-mated by looking at the difference in agricultural profitability (augmented by community sta-bility benefits if available) over time. This means that the dividend is similar to what might be termed a “co-benefit” in a disaster risk reduction framework, though the dynamic nature of the system and the original intent of the intervention result in a confounding of primary benefit, co-benefits, and recovery benefits. We recommend that practitioners who are intervening to address a stressor characterize the resilience dividend as the net present value of the difference in aggregate net benefits as a result of the intervention.
Conclusions
The reallocation of water rights from a prior appropriation system to one of water shares and trading has been shown to have a positive resilience dividend over a 30-year horizon compared to the most likely BAU scenario. Of the 66 rightholders identified in the Diamond Valley, all would prefer some version of a gradual drawdown (3 percent per year) of assignable water, with senior and mixed rightholders preferring to protect senior rights (scenario E), and junior rightholders preferring all rights be subject to curtailment (scenario F).
The ex ante resilience dividend was split into two elements: one attributable to agricultural production and associated profitability, and one attributable to a preference for economic and social stability and vitality. The resilience dividend associated with agricultural production was valued at $63 million–$64 million over a 30-year horizon regardless of whether senior rightholders were exempt from curtailment. This part of the dividend is determined largely by the speed of curtailment, and not the type of rights system in place (e.g., prior appropriation versus a shares-based system). However, the distribution of the dividend varied significantly, with mixed rightholders accounting for nearly 60 percent of the overall gain for scenario (E), but junior rightholders accounting for over 80 percent of the dividend for scenario (F). In this scenario, senior rightholders suffer a negative resilience dividend.
We were unable to quantify the dividend associated with the stability and vitality of the eco-nomic and social base in the region given the information available. However, we examined how using stated or revealed preference information for those who were willing to give up something of value in return for continued junior rightholder production could be used as evi-dence in favor of an additional positive resilience dividend component of this sort. As the real-world GMP in the Diamond Valley finishes development and is presented to the NSE, using the preferences of producers and/or other stakeholders over various plans could help bound the value of this important concept.
96
Forest Bond
This case study is based on the RDVM. It provides a demonstration of how the RDVM can be applied in real-world situations. The case can be read on its own, but it is part of a broader package that includes five other case studies presented in Chapter 4 and the lessons learned from all the cases in Chapter 5. This case study is intended primarily to help readers under-stand how to apply the RDVM framework given a set of data and information about a given project. Any estimate of the resilience dividend is provided as an example and is not necessarily a complete estimate.
This case study of the Blue Forest Conservation Forest Resilience Bond is an example of cal-culating the resilience bond in an ex ante analysis without a shock or stressor. This analysis of restoring forests highlights the role that co-benefits can play in designing resilience projects and the importance of systems thinking in estimating a resilience dividend. The case provides a range of estimates for many parts of the resilience dividend but does not have estimates for others as they are site specific.
Executive Summary
The United States Forest Service (USFS) has identified 60 million acres of public forest in need of restoration. USFS provides much of the funding for forest restoration, but its budget is shrinking while the cost of fire suppression is growing, so alternative financing mechanisms are being considered. In this case study, RAND tries to calculate a resilience dividend to dem-onstrate the benefits of a proposed “resilience bond” to finance public forest restoration.
The goal of the pilot Blue Forest Conservation Forest Resilience Bond is to shift some restora-tion costs to entities that benefit from public forests. In addition to estimating a resilience divi-dend of forest restoration, we discuss some of the estimation and policy challenges that may arise in the development of a forest resilience bond.
For this case study, the resilience dividend would be the difference in various outcomes over 10 years for a forest that has experienced restoration and the same forest untouched (the BAU, or baseline, case). Table 4.14 provides an overview of the key elements of the case study as it relates to the RDVM.
Is There Evidence of a Resilience Dividend?
Because there is not yet a specific project area, our focus is on providing upper and lower bounds for the changes in “ecosystem services”—less severe fires, increased water quantity and quality—and monetary values for those ecosystem services where possible.
Table 4.15 provides an overview of the estimates for each of the goods and services valued in the RDVM. The three most important contributors to the resilience dividend are the restora-tion costs, the value of forest products derived from restoration (such as lumber from clear-ing trees), and the change in water runoff. Fire-related aspects are considerably less valuable because they arise only when a fire occurs. Since fires on a particular plot are relatively rare, the expected benefits arising from fires is relatively small.
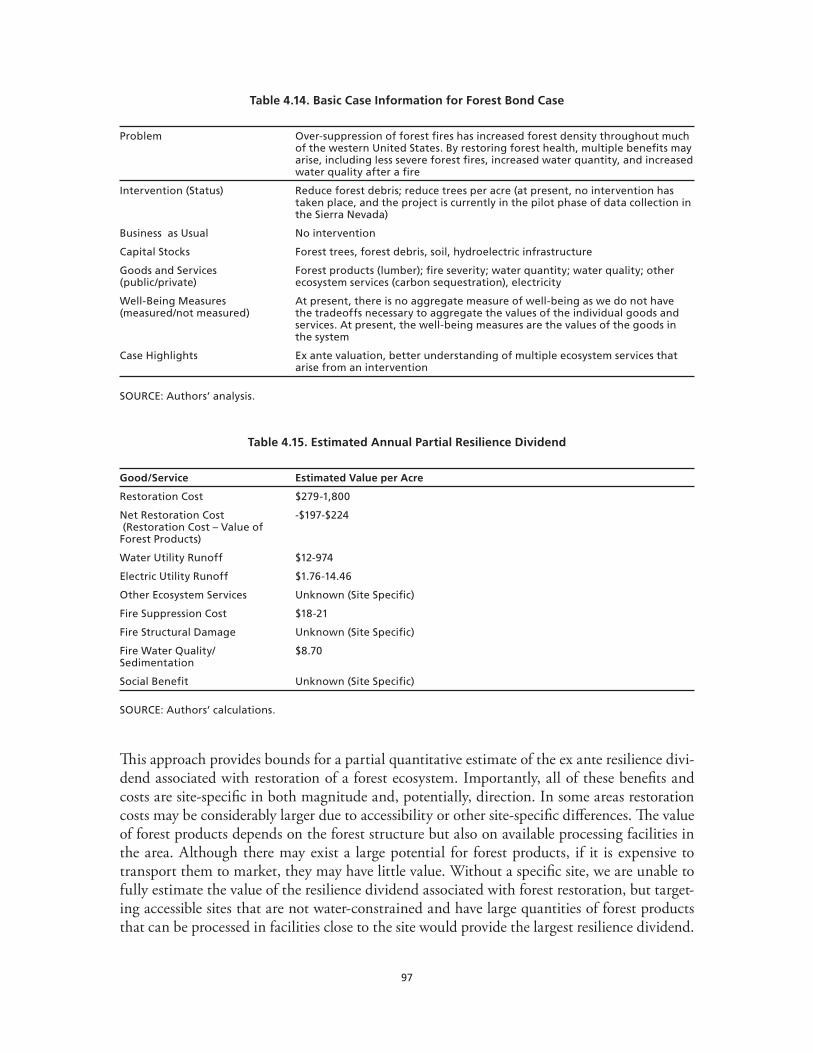
97
Table 4.14. Basic Case Information for Forest Bond Case
Problem Over-suppression of forest fires has increased forest density throughout much of the western United States. By restoring forest health, multiple benefits may arise, including less severe forest fires, increased water quantity, and increased water quality after a fire
Intervention (Status) Reduce forest debris; reduce trees per acre (at present, no intervention has taken place, and the project is currently in the pilot phase of data collection in the Sierra Nevada)
Business as Usual No intervention
Capital Stocks Forest trees, forest debris, soil, hydroelectric infrastructure
Goods and Services (public/private)
Forest products (lumber); fire severity; water quantity; water quality; other ecosystem services (carbon sequestration), electricity
Well-Being Measures (measured/not measured)
At present, there is no aggregate measure of well-being as we do not have the tradeoffs necessary to aggregate the values of the individual goods and services. At present, the well-being measures are the values of the goods in the system
Case Highlights Ex ante valuation, better understanding of multiple ecosystem services that arise from an intervention
SOURCE: Authors’ analysis.
Table 4.15. Estimated Annual Partial Resilience Dividend
Good/Service Estimated Value per Acre
Restoration Cost $279-1,800
Net Restoration Cost (Restoration Cost – Value of Forest Products)
-$197-$224
Water Utility Runoff $12-974
Electric Utility Runoff $1.76-14.46
Other Ecosystem Services Unknown (Site Specific)
Fire Suppression Cost $18-21
Fire Structural Damage Unknown (Site Specific)
Fire Water Quality/ Sedimentation
$8.70
Social Benefit Unknown (Site Specific)
SOURCE: Authors’ calculations.
This approach provides bounds for a partial quantitative estimate of the ex ante resilience divi-dend associated with restoration of a forest ecosystem. Importantly, all of these benefits and costs are site-specific in both magnitude and, potentially, direction. In some areas restoration costs may be considerably larger due to accessibility or other site-specific differences. The value of forest products depends on the forest structure but also on available processing facilities in the area. Although there may exist a large potential for forest products, if it is expensive to transport them to market, they may have little value. Without a specific site, we are unable to fully estimate the value of the resilience dividend associated with forest restoration, but target-ing accessible sites that are not water-constrained and have large quantities of forest products that can be processed in facilities close to the site would provide the largest resilience dividend.
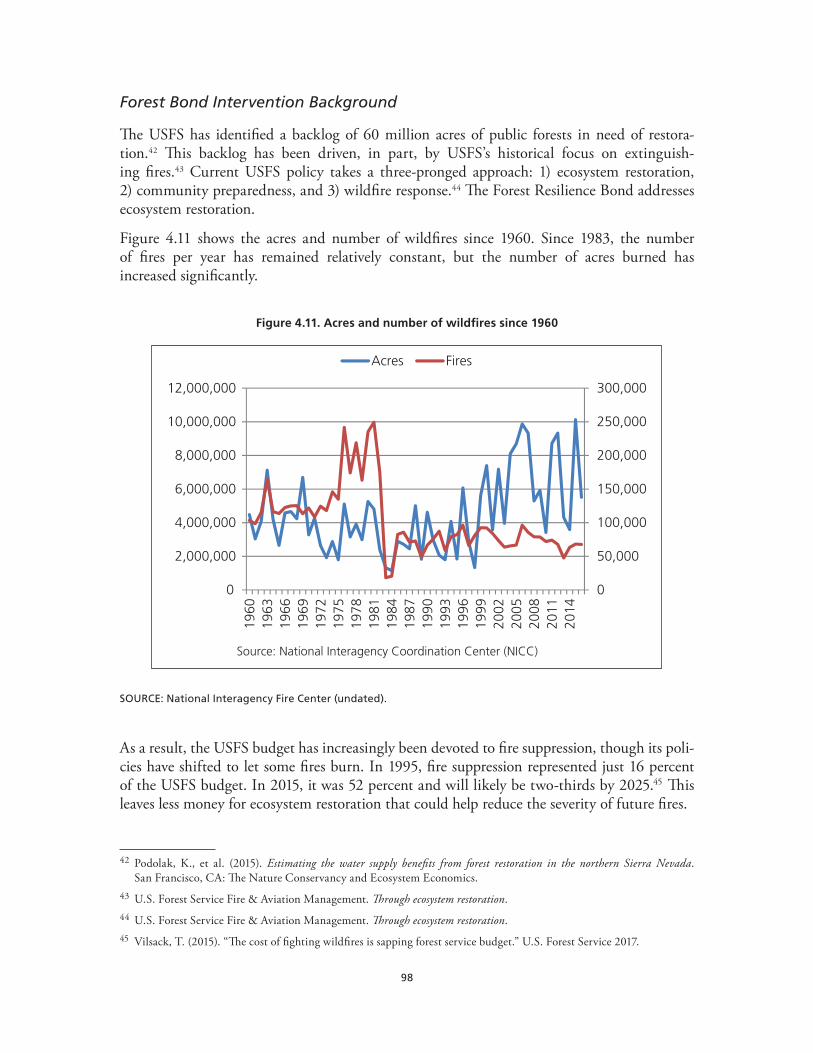
98
Forest Bond Intervention Background
The USFS has identified a backlog of 60 million acres of public forests in need of restora-tion.42 This backlog has been driven, in part, by USFS’s historical focus on extinguish-ing fires.43 Current USFS policy takes a three-pronged approach: 1) ecosystem restoration, 2) community preparedness, and 3) wildfire response.44 The Forest Resilience Bond addresses ecosystem restoration.
Figure 4.11 shows the acres and number of wildfires since 1960. Since 1983, the number of fires per year has remained relatively constant, but the number of acres burned has increased significantly.
Figure 4.11. Acres and number of wildfires since 1960
Source: National Interagency Coordination Center (NICC)
0
50,000
100,000
150,000
200,000
250,000
300,000
0
2,000,000
4,000,000
6,000,000
8,000,000
10,000,000
12,000,000
1960
1963
1966
1969
1972
1975
1978
1981
1984
1987
1990
1993
1996
1999
2002
2005
2008
2011
2014
Acres Fires
SOURCE: National Interagency Fire Center (undated).
As a result, the USFS budget has increasingly been devoted to fire suppression, though its poli-cies have shifted to let some fires burn. In 1995, fire suppression represented just 16 percent of the USFS budget. In 2015, it was 52 percent and will likely be two-thirds by 2025.45 This leaves less money for ecosystem restoration that could help reduce the severity of future fires.
42 Podolak, K., et al. (2015). Estimating the water supply benefits from forest restoration in the northern Sierra Nevada. San Francisco, CA: The Nature Conservancy and Ecosystem Economics.
43 U.S. Forest Service Fire & Aviation Management. Through ecosystem restoration. 44 U.S. Forest Service Fire & Aviation Management. Through ecosystem restoration.45 Vilsack, T. (2015). “The cost of fighting wildfires is sapping forest service budget.” U.S. Forest Service 2017.
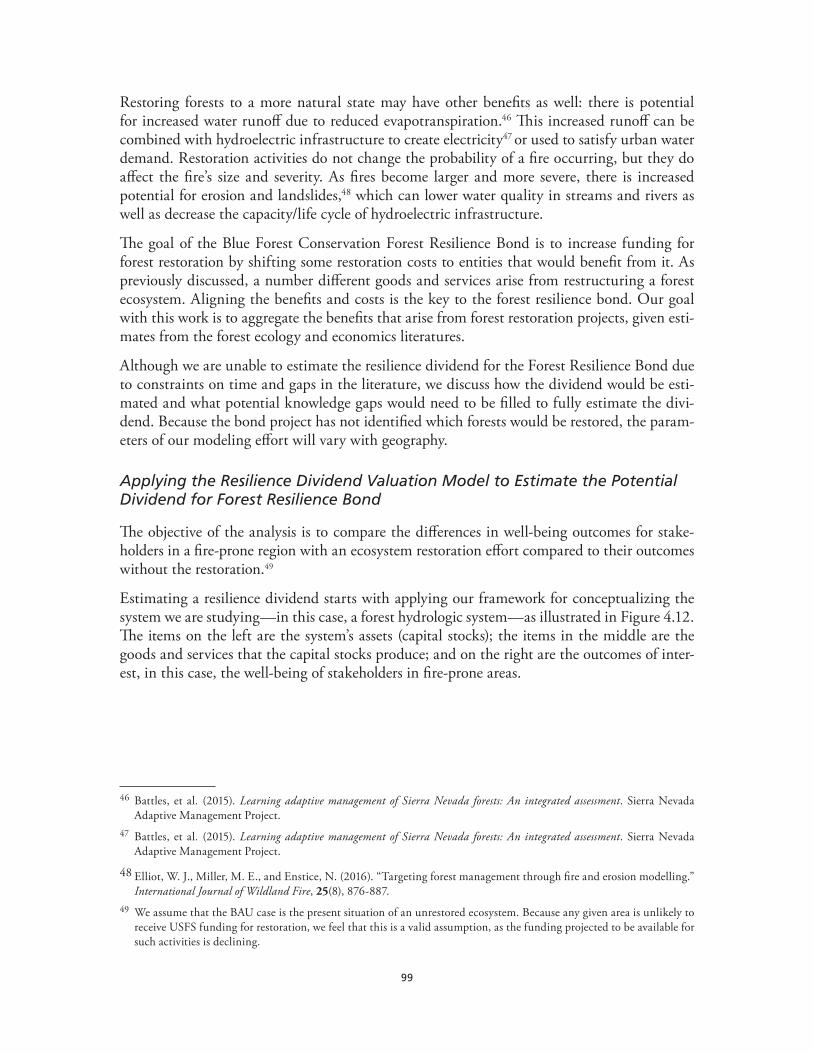
99
Restoring forests to a more natural state may have other benefits as well: there is potential for increased water runoff due to reduced evapotranspiration.46 This increased runoff can be combined with hydroelectric infrastructure to create electricity47 or used to satisfy urban water demand. Restoration activities do not change the probability of a fire occurring, but they do affect the fire’s size and severity. As fires become larger and more severe, there is increased potential for erosion and landslides,48 which can lower water quality in streams and rivers as well as decrease the capacity/life cycle of hydroelectric infrastructure.
The goal of the Blue Forest Conservation Forest Resilience Bond is to increase funding for forest restoration by shifting some restoration costs to entities that would benefit from it. As previously discussed, a number different goods and services arise from restructuring a forest ecosystem. Aligning the benefits and costs is the key to the forest resilience bond. Our goal with this work is to aggregate the benefits that arise from forest restoration projects, given esti-mates from the forest ecology and economics literatures.
Although we are unable to estimate the resilience dividend for the Forest Resilience Bond due to constraints on time and gaps in the literature, we discuss how the dividend would be esti-mated and what potential knowledge gaps would need to be filled to fully estimate the divi-dend. Because the bond project has not identified which forests would be restored, the param-eters of our modeling effort will vary with geography.
Applying the Resilience Dividend Valuation Model to Estimate the Potential Dividend for Forest Resilience Bond
The objective of the analysis is to compare the differences in well-being outcomes for stake-holders in a fire-prone region with an ecosystem restoration effort compared to their outcomes without the restoration.49
Estimating a resilience dividend starts with applying our framework for conceptualizing the system we are studying—in this case, a forest hydrologic system—as illustrated in Figure 4.12. The items on the left are the system’s assets (capital stocks); the items in the middle are the goods and services that the capital stocks produce; and on the right are the outcomes of inter-est, in this case, the well-being of stakeholders in fire-prone areas.
46 Battles, et al. (2015). Learning adaptive management of Sierra Nevada forests: An integrated assessment. Sierra Nevada Adaptive Management Project.
47 Battles, et al. (2015). Learning adaptive management of Sierra Nevada forests: An integrated assessment. Sierra Nevada Adaptive Management Project.
48 Elliot, W. J., Miller, M. E., and Enstice, N. (2016). “Targeting forest management through fire and erosion modelling.” International Journal of Wildland Fire, 25(8), 876-887.
49 We assume that the BAU case is the present situation of an unrestored ecosystem. Because any given area is unlikely to receive USFS funding for restoration, we feel that this is a valid assumption, as the funding projected to be available for such activities is declining.

100
Figure 4.12. Mapping a Forest Ecosystem
Living Trees
Forest Debris
Soil
Forest Products
Fire Severity Well-Being
Production Distribution
Hydroelectric Infrastructure
Water Runoff
Electricity
Ecosystem Services
NOTES: This model is based on an Inclusive Wealth Theory.
SOURCE: Authors’ analysis.
Capital Stocks
There are four main capital stocks that need to be considered in an ecosystem intervention of a forest (represented by the blue rectangles in Figure 4.12). First, there are living trees. In its sim-plest form, we can think of it as a stock of trees, though it may be more helpful to think of it as a set of tree stocks of different ages, having different water demands (evapotranspiration rates), and producing products of different qualities. The stock of trees grows over time depending on soil characteristics, fire events, and the stock of trees itself. If more trees are present, they may crowd out younger trees, changing the age structure of the forest in the process.
As trees die off, they become forest debris, joining any leaves, limbs, or other litter that falls from living trees. This debris together with the stock of trees represents fuel for fire, and the more debris there is, the more severe the fire is likely to be.
101
The soil plays an integral part in the forest ecosystem in that it provides nutrients to trees. Of course, soil can also be enhanced or deteriorated by trees and debris, so the interplay among these three capital stocks is dynamic. Additionally, they are influenced by fire and interven-tions that change the structure of forest cover.
The final capital stock is hydroelectric infrastructure to produce electricity from runoff. Blue Forest Conservation has made power generation a selling point of the bond issue, so we explic-itly included it in our model, though we do not think hydroelectric infrastructure would be affected by any intervention. However, if hydroelectric infrastructure is not present, it may reduce the resilience dividend.50
Goods and services
A number of goods and services (represented by red ovals in Figure 4.12) arise from forest ecosystems that are important to consider in relation to ecosystem restoration. First, lumber, wood pulp for paper, and other products can be derived from living trees and forest debris. These products can arise through management of the forest either as a commercial forest or through ecosystem restoration that selectively harvests different ages of trees depending on the restoration’s goals.
Second, fires are a result of the fuel provided by trees and forest debris. We treat fire severity as “bad” because, while fires prevent more severe blazes in the long run by clearing out dead trees and debris, they may be a negative for social well-being. Thus, fire may provide long-term benefits at the expense of short-term harm if the severity is “not too high.”
Runoff is the third consideration. When rain falls, some of it is absorbed by trees and other plants, and some runs off or replenishes an aquifer. Changing the structure of a forest can change the quantity of runoff and aquifer replenishment. Better-managed forest systems have the ability to change the water quality, though the relationship is unclear. Thus, there are potentially water quality and quantity aspects to forest restoration.
Fourth, additional water runoff can produce electricity if combined with hydroelectric infra-structure. However, if runoff causes soil erosion, it may degrade the hydroelectric infrastruc-ture and depreciate this capital stock.
Finally, forest restoration could affect a large number of potential ecosystem services—though whether they are positive or negative may generally be difficult to determine. Carbon seques-tration and storage will be affected because restoration involves removing trees and debris. Habitat for native and non-native species will change. Recreational benefits may also change as the structure of the forest shifts. Whether these ecosystem services enhance the value of the system will depend on the community; some may prefer native habitat and others recreation.
50 Although we have not explicitly included it in this analysis, endemic species such as bark beetles may influence the transi-tion dynamics of trees to debris. This would be an important secondary benefit that may arise when considering a forest restoration project. Additionally, we are considering precipitation as an exogenous force to the system that is outside of the control of the ecosystem or management of the ecosystem but that affects the system. The structure of precipitation could be modified by climate change, which could modify the system dynamics going forward. The interaction between precipitation and endemic species may be important as well.
102
Well-Being
All the factors discussed above intersect to have an effect on the well-being of various stake-holders. The underlying idea behind well-being in an “inclusive wealth theory” like the one we are using is to establish a metric for aggregating different goods and services and using that metric to value outcomes. In a traditional economic model, that metric would be prices, which reflect society’s willingness to pay for different goods and services. In an ideal approach, we would know what stakeholders are willing to pay for each of the goods and services provided by a forest, and could then estimate the value of the individual capital stocks and, in aggregate, the forest as a whole. Because we do not know where forest restoration would be carried out, we do not know the specific parameters of the capital stocks, goods, and services. As a result, the analysis below provides values only where they are available for forest goods and services. Where no value exists, we discuss how a value could be calculated or estimated.
Other Aspects of the System
The allocation mechanism in this case is how the management of the forest responds to the different capital stocks. In this case, we consider two different allocation mechanisms. The first is an intervention whereby the forest structure is changed to some more desirable state. The second is not intervening at all and letting the forest follow its natural course. (We will discuss how the intervention affects the system in the next section.)
To fully estimate the resilience dividend, we need to know how each capital stock evolves over time and how the different stocks combine to produce goods and services. We know that the growth rate of trees is a function of the stocks of trees, soil, and, potentially, debris. We need to know how the forest dynamics change as a function of both the capital stocks and the alloca-tion mechanism.
The capital stocks have value because they provide goods and services. However, we need to understand how these capital stocks generate the goods and services. This is relatively simple for forest products in that they are marketed goods and services, with associated prices. The other ecosystem services that arise from the forest are not marketable and do not have readily observable prices. In order to fully value the forest, then, we need relationships between the levels of the capital stocks and the flow of ecosystem services that arise, as well as the value of those underlying services.
In addition to the primary ecosystem services that arise directly from the capital stocks, there are additional goods and services that arise from sources outside the system. For example, we have mentioned fire severity as a service that arises from the combined capital stocks of trees and forest debris. This only gives us the potentiality for severity. In order for a fire to arise, we need a shock to create a fire of a particular severity. Once this fire has occurred it directly impacts the provision of other ecosystem services and water quality and quantity, which feed-back on all of the natural capital stocks. As resilience is a dynamic concept it is important to understand these feedback loops to understand how the system is affected by both the alloca-tion mechanism as well as the shocks to the system.

103
There are two important outside forces—forest fires and precipitation—that we have not explicitly described in Figure 4.12. First, from the data presented in Figure 4.11, it appears that forest fires are determined outside the system, and the probability of their occurring is random. The intervention does not affect the probability that a fire will occur, only its sever-ity. The intervention does affect how precipitation is allocated within the system, whether to evapotranspiration, runoff, or groundwater replenishment. Thus, the effects of the intervention are dependent upon a random outcome of precipitation.
Intervention and the System
An intervention meant to reduce the severity of fires would affect two of the capital stocks directly: living trees and forest debris. Clearing debris and cutting down older trees affects the production functions, which in turn change the ecosystem services that arise. Blue Forest Conservation envisions a one-time intervention whose impacts can be seen for approximately 10years,51 so we estimated the benefits and costs to the system over a 10-year horizon.
Aspects of the Resilience Dividend
There are a number of aspects of the resilience dividend for this case that should be highlighted.
Net cost of restoration: In particular, we would like to value, over a 10-year horizon, the change in the ecosystem services that arise from a change in the natural capital stocks. In the BAU case, no forest products will be harvested and no management costs would be incurred. Once an intervention takes place, restoration costs are incurred and the stocks of forest debris and living trees are affected. Removing trees and debris produces forest products that can be sold to mills and other processors as valuable commodities. Going forward, we will refer to the net restoration costs together with the value of the harvested products as the net cost of restoration. At present, the USFS bears the net cost and not the total cost of restoration because contractors bid on these projects with the intention of selling what they harvest.
Ecosystem services can be hard to value: Once a restoration project has been completed, the struc-ture of the forest has changed, along with the services that the structure produces. As such, we want to compare the levels of the ecosystem services that arise from a restored forest to those of an unrestored forest. One of those services is the change in water runoff since one goal of the forest resilience bond is to use increased water runoff to benefit hydroelectric producers and water consumers. Other ecosystem services such as wildlife habitat and carbon sequestra-tion will be much harder to quantify and value but are potentially important. In addition, the magnitude and direction of the change in these other ecosystem services may be more difficult to estimate and may be geographically dependent.
The impacts of fire suppression: The main focus of the restoration is not necessarily ecosystem services but fire suppression costs. There are two sets of impacts to consider: First, what is the difference in suppression costs for restored and unrestored forests? Second, fire changes the
51 Wobbrock, N. (2017).

104
stock of trees and forest debris, which also changes the levels of ecosystem services that they provide. In particular, if fire reduces the forest cover, increased runoff can interact with the soil stock to increase erosion. This affects both the soil stock and, as mentioned earlier, can deterio-rate the stock of hydroelectric infrastructure.
Empirical Estimates
Our approach to estimating the resilience dividend for the Forest Resilience Bond interven-tion was to search the forest ecology and fire science literature to estimate the impact of forest restoration on different ecosystem services. The next step was to use estimates from economics literature, when available, to gauge the value of the changes in ecosystem services. So that we can compare the analyses across a wide variety of forests and contexts, we translate the results as much as possible to a per acre basis and to 2015 dollars (for urban areas). We use average per acre changes, per acre benefits, and per acre costs as a means to normalize and to readily compare them across study areas.
Restoration Costs
Our first step in the analysis is to estimate the net implementation costs for forest restoration activities. Lynch (2001)52 estimated both the costs and revenue from the restoration of five ponderosa pine plots in southwestern Colorado. He estimates the revenue and costs per ton of product removed across these five plots but also the profit (revenue minus cost) per plot and acre. The estimates range from a loss of $197 per acre to a profit of $224, with per acre costs ranging from $665 to $1,569.53 Daniels et al. estimated restoration costs of Seattle’s urban wildlands at an average $540 per acre based on a range of $279 to $1,800 depending on the structure of the plot being restored.54 As noted by Podolak, USFS targets areas where timber sales offset some of the costs of restoration,55 so the choice of USFS sites for restoration may not be consistent with the average net cost from USFS contracts. These estimates for the restoration costs are upfront costs that either produce a benefit at the time of restoration (forest products) or have a stream of benefits and costs that occur over 10 years.
52 Lynch, D. L. (2001). “Financial results of ponderosa pine forest restoration in southwestern Colorado.” In R. K. E. Vance, B. Carleton, W. W. Covington, J. A. Blake (Eds.), Ponderosa pine ecosystems restoration and conservation: Steps toward stewardship. Flagstaff, AZ: U.S. Department of Agriculture, Forest Service, Rocky Mountain Research Station. pp. 141–148.
53 Lynch, D. L., and Mackes, K. (2003). Costs for reducing fuels in Colorado forest restoration projects. U. F. Service, USDA Forest Service Proceedings.
54 Daniels, J. M., et al. (2016). Urban forest restoration cost modeling: a Seattle natural areas case study. USFS Pacific North-west Research Station.
55 Podolak, K., et al. (2015). Estimating the water supply benefits from forest restoration in the northern Sierra Nevada. San Francisco, CA: The Nature Conservancy and Ecosystem Economics.
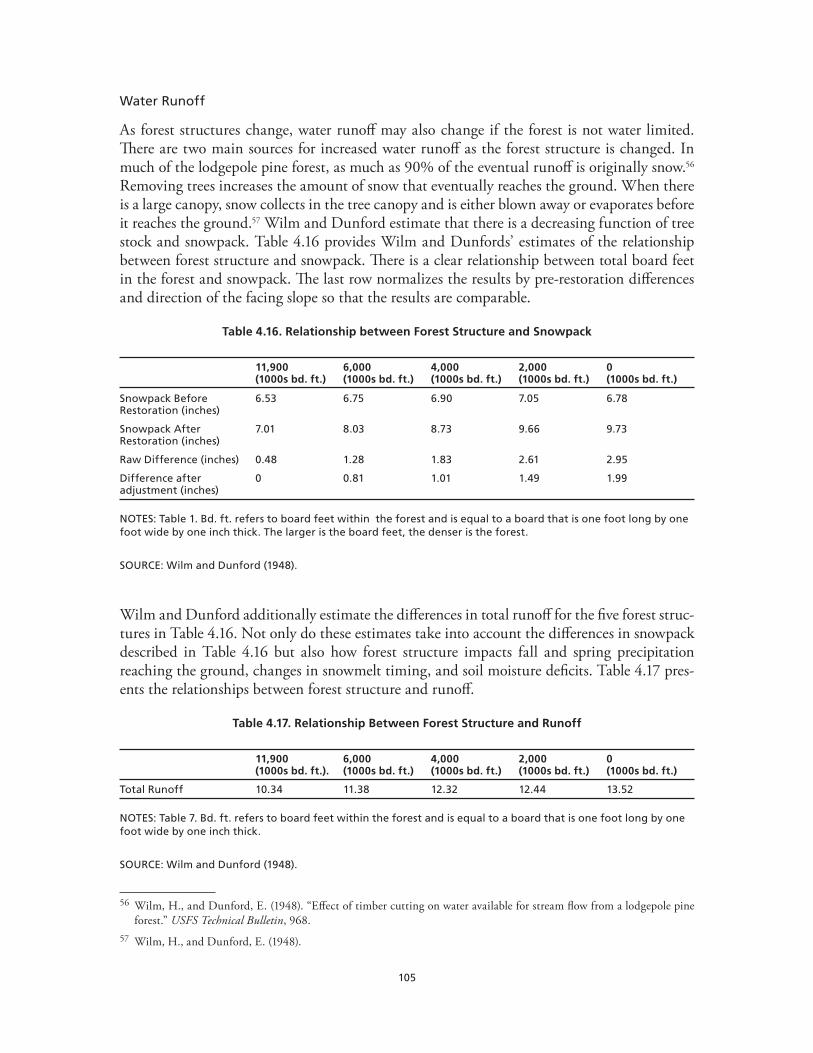
105
Water Runoff
As forest structures change, water runoff may also change if the forest is not water limited. There are two main sources for increased water runoff as the forest structure is changed. In much of the lodgepole pine forest, as much as 90% of the eventual runoff is originally snow.56 Removing trees increases the amount of snow that eventually reaches the ground. When there is a large canopy, snow collects in the tree canopy and is either blown away or evaporates before it reaches the ground.57 Wilm and Dunford estimate that there is a decreasing function of tree stock and snowpack. Table 4.16 provides Wilm and Dunfords’ estimates of the relationship between forest structure and snowpack. There is a clear relationship between total board feet in the forest and snowpack. The last row normalizes the results by pre-restoration differences and direction of the facing slope so that the results are comparable.
Table 4.16. Relationship between Forest Structure and Snowpack
11,900 (1000s bd. ft.)
6,000 (1000s bd. ft.)
4,000 (1000s bd. ft.)
2,000 (1000s bd. ft.)
0 (1000s bd. ft.)
Snowpack Before Restoration (inches)
6.53 6.75 6.90 7.05 6.78
Snowpack After Restoration (inches)
7.01 8.03 8.73 9.66 9.73
Raw Difference (inches) 0.48 1.28 1.83 2.61 2.95
Difference after adjustment (inches)
0 0.81 1.01 1.49 1.99
NOTES: Table 1. Bd. ft. refers to board feet within the forest and is equal to a board that is one foot long by one foot wide by one inch thick. The larger is the board feet, the denser is the forest.
SOURCE: Wilm and Dunford (1948).
Wilm and Dunford additionally estimate the differences in total runoff for the five forest struc-tures in Table 4.16. Not only do these estimates take into account the differences in snowpack described in Table 4.16 but also how forest structure impacts fall and spring precipitation reaching the ground, changes in snowmelt timing, and soil moisture deficits. Table 4.17 pres-ents the relationships between forest structure and runoff.
Table 4.17. Relationship Between Forest Structure and Runoff
11,900 (1000s bd. ft.).
6,000 (1000s bd. ft.)
4,000 (1000s bd. ft.)
2,000 (1000s bd. ft.)
0 (1000s bd. ft.)
Total Runoff 10.34 11.38 12.32 12.44 13.52
NOTES: Table 7. Bd. ft. refers to board feet within the forest and is equal to a board that is one foot long by one foot wide by one inch thick.
SOURCE: Wilm and Dunford (1948).
56 Wilm, H., and Dunford, E. (1948). “Effect of timber cutting on water available for stream flow from a lodgepole pine forest.” USFS Technical Bulletin, 968.
57 Wilm, H., and Dunford, E. (1948).
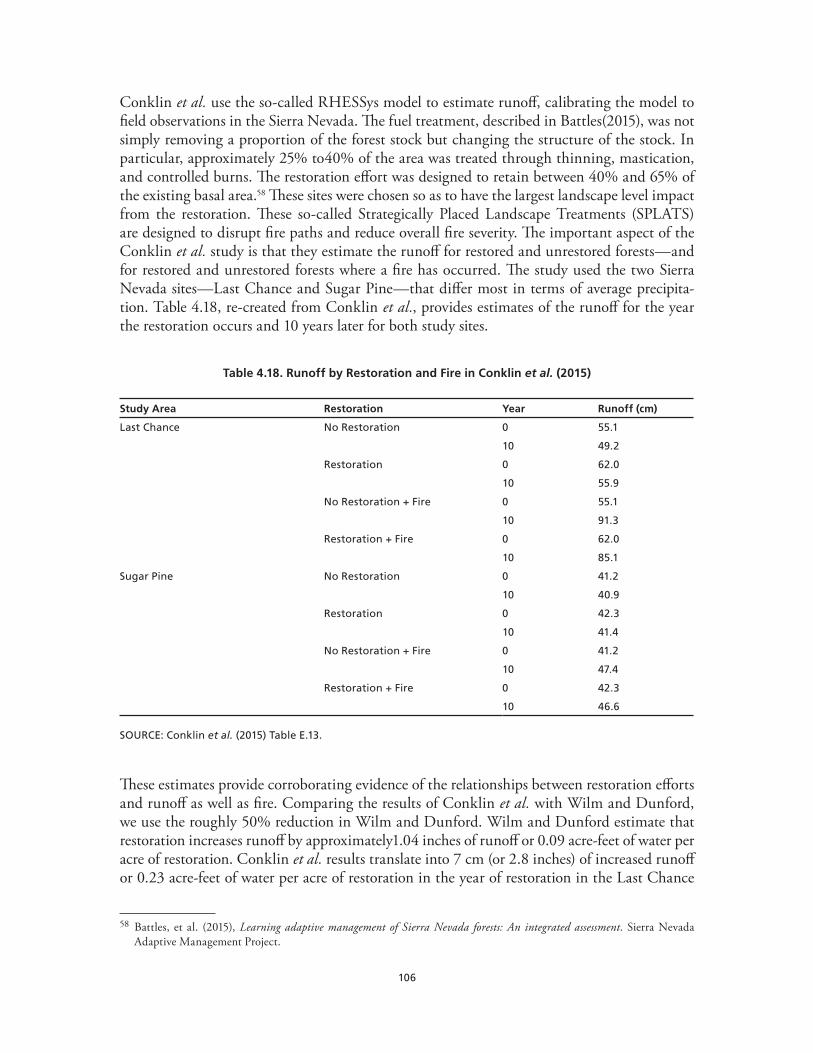
106
Conklin et al. use the so-called RHESSys model to estimate runoff, calibrating the model to field observations in the Sierra Nevada. The fuel treatment, described in Battles(2015), was not simply removing a proportion of the forest stock but changing the structure of the stock. In particular, approximately 25% to40% of the area was treated through thinning, mastication, and controlled burns. The restoration effort was designed to retain between 40% and 65% of the existing basal area.58 These sites were chosen so as to have the largest landscape level impact from the restoration. These so-called Strategically Placed Landscape Treatments (SPLATS) are designed to disrupt fire paths and reduce overall fire severity. The important aspect of the Conklin et al. study is that they estimate the runoff for restored and unrestored forests—and for restored and unrestored forests where a fire has occurred. The study used the two Sierra Nevada sites—Last Chance and Sugar Pine—that differ most in terms of average precipita-tion. Table 4.18, re-created from Conklin et al., provides estimates of the runoff for the year the restoration occurs and 10 years later for both study sites.
Table 4.18. Runoff by Restoration and Fire in Conklin et al. (2015)
Study Area Restoration Year Runoff (cm)
Last Chance No Restoration 0 55.1
10 49.2
Restoration 0 62.0
10 55.9
No Restoration + Fire 0 55.1
10 91.3
Restoration + Fire 0 62.0
10 85.1
Sugar Pine No Restoration 0 41.2
10 40.9
Restoration 0 42.3
10 41.4
No Restoration + Fire 0 41.2
10 47.4
Restoration + Fire 0 42.3
10 46.6
SOURCE: Conklin et al. (2015) Table E.13.
These estimates provide corroborating evidence of the relationships between restoration efforts and runoff as well as fire. Comparing the results of Conklin et al. with Wilm and Dunford, we use the roughly 50% reduction in Wilm and Dunford. Wilm and Dunford estimate that restoration increases runoff by approximately1.04 inches of runoff or 0.09 acre-feet of water per acre of restoration. Conklin et al. results translate into 7 cm (or 2.8 inches) of increased runoff or 0.23 acre-feet of water per acre of restoration in the year of restoration in the Last Chance
58 Battles, et al. (2015), Learning adaptive management of Sierra Nevada forests: An integrated assessment. Sierra Nevada Adaptive Management Project.

107
study area. This number drops to about 6 cm (or 2.4 inches) 10 years after the restoration. The Sugar Pine study suggests less optimistic results on the order of between 2 cm just after restora-tion to 0.5 cm 10 years out (2 cm of increased runoff translates into 0.06 acre-feet of water per acre of restoration and 0.5 cm translates into 0.01 acre-feet).
Other studies have also estimated the impact of changes in forest structure on runoff. Table 4.19 summarizes the results from a number of studies that only provide a single point estimate.
Table 4.19. Other Studies That Estimate the Relationship Between Restoration and Runoff
Paper Location Percent forest removed Runoff impact
Troendle et al. (2001) Wyoming 23.7% 7.6 cm (17%)
Burton (1997) Utah 25% 14.7 cm (52%)
Troendle and King (1985) Colorado 40% 8.2 cm (28%)
SOURCE: Authors’ Aggregation.
Combining all these estimates, forest restoration will produce between 0.01 and 0.23 acre-feet of additional runoff for every acre of restoration. Rental prices of water in California in 2014 have been on the order of $250-500 per acre-foot with outliers as high as $1,000-$2,000 per acre-foot.59 60 These high prices are, in part, driven by the drought that was occurring in 2014; heavy rains in 2016-2017 that helped ease the drought may drive prices down into the future. Water rental prices prior to the drought were on the order of $30-100 per acre-foot.61 We use two different prices to estimate the value of this additional runoff. First, we use the highest non-outlier price of $500 observed in 2014. Additionally, we use the average inflation-adjusted price of $53 for transfers that occurred between 1987 and 2009. Additionally, we use a 5% discount factor to discount future savings back to the time of the restoration. Finally, from the Conklin et al. study, we know the increases in runoff immediately and 10 years out. We use linear interpolation to estimate the runoff for the years between 0 and 10. As the Conklin et al. study provides rough bounds for the increase in runoff, we use the Last Chance and Sugar Pine study areas to bound the estimates of the value of the increased water runoff. Table 4.20 presents these results. From a water consumption standpoint, the value of increased runoff ranges from $12 to $974 depending on how water-limited the ecosystem is and the prevailing water price.
59 Vekshin, A. (2014). “California water prices soar for farmers as drought grows.”60 Maven (2014). “The future of water transfers after the 2014 drought.” Maven’s Notebook.61 California Water Transfer Records (2010). Santa Barbara, CA: Bren School of Environmental Science & Management.
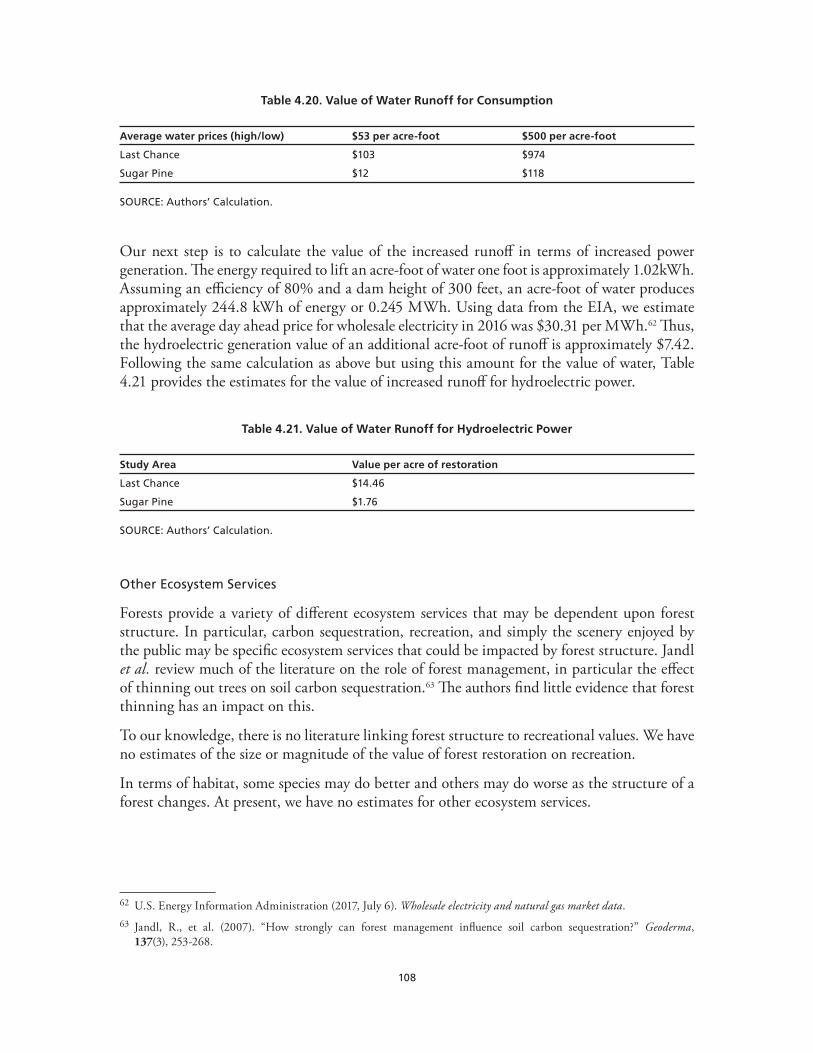
108
Table 4.20. Value of Water Runoff for Consumption
Average water prices (high/low) $53 per acre-foot $500 per acre-foot
Last Chance $103 $974
Sugar Pine $12 $118
SOURCE: Authors’ Calculation.
Our next step is to calculate the value of the increased runoff in terms of increased power generation. The energy required to lift an acre-foot of water one foot is approximately 1.02kWh. Assuming an efficiency of 80% and a dam height of 300 feet, an acre-foot of water produces approximately 244.8 kWh of energy or 0.245 MWh. Using data from the EIA, we estimate that the average day ahead price for wholesale electricity in 2016 was $30.31 per MWh.62 Thus, the hydroelectric generation value of an additional acre-foot of runoff is approximately $7.42. Following the same calculation as above but using this amount for the value of water, Table 4.21 provides the estimates for the value of increased runoff for hydroelectric power.
Table 4.21. Value of Water Runoff for Hydroelectric Power
Study Area Value per acre of restoration
Last Chance $14.46
Sugar Pine $1.76
SOURCE: Authors’ Calculation.
Other Ecosystem Services
Forests provide a variety of different ecosystem services that may be dependent upon forest structure. In particular, carbon sequestration, recreation, and simply the scenery enjoyed by the public may be specific ecosystem services that could be impacted by forest structure. Jandl et al. review much of the literature on the role of forest management, in particular the effect of thinning out trees on soil carbon sequestration.63 The authors find little evidence that forest thinning has an impact on this.
To our knowledge, there is no literature linking forest structure to recreational values. We have no estimates of the size or magnitude of the value of forest restoration on recreation.
In terms of habitat, some species may do better and others may do worse as the structure of a forest changes. At present, we have no estimates for other ecosystem services.
62 U.S. Energy Information Administration (2017, July 6). Wholesale electricity and natural gas market data.63 Jandl, R., et al. (2007). “How strongly can forest management influence soil carbon sequestration?” Geoderma,
137(3), 253-268.

109
Fire Suppression Costs
One of the main drivers for forest restoration efforts is to reduce the severity and size of fires that occur. As previously discussed, forest restoration does not affect the probability that a fire will occur, but it may reduce its size and severity. This should result in lower suppression costs when fires occur. Fitch et al. estimate the change in per acre costs of fire suppression in Arizona using FlamMa and ArcFuels within ArcGIS.64 The authors suggest that unrestored forests have a per acre fire suppression cost of $706–$825. When these same areas have been restored, fire suppression costs decline to $287–$327 per acre. These estimates depend on the characteristics of the fire, not on the restoration. Thus, fire suppression savings are on the order of $420–$498.
California has approximately 33 million acres of forest across a range of owners.65 Over the past five years, fires have burned an average of 165,000 acres per year.66 Assuming that all forest is equally likely to burn in California, this implies that the annual probability of an acre of forest burning in California is approximately 0.5 percent. If these forests were restored, the expected savings in fire suppression costs are $2.10–$2.50 per acre of fire in any given year or $18-$21 over 10 years. These results provide a lower bound in that Fitch et al. assume that the restora-tion affects severity but not size. If restoration affects size, as is the case of SPLATs, then the impact on fire suppression costs would be larger because of smaller fires.
Fire Structural Damage Costs
Because restoration activities typically reduce fire severity, fewer structures may be lost. Since the aim of the forest resilience bond is to restore forests where it will do the most good, the bond issue would most likely affect areas where low-density development and wildlands inter-sect (known as wildland urban interface, or WUI). However, any savings from restoration in WUI depend very much on context and location, so we do not try to estimate their value.
Fire-Water Quality Impacts
Because fire severity and intensity can impact soil erosion and water quality,this translates into the potential for greater exposed soil in areas with more severe or intense wildfires. Elliot et al. (2016) estimate the impacts that thinning forest debris has on soil erosion. Their estimates suggest that removing debris reduces soil erosion rates to 26 Mg/ha in treated forests versus 46 Mg/ha in untreated forests. These increased soil erosion rates have the potential to impact nearby aquatic ecosystems and increase the siltification rates for hydroelectric infrastructure. Although we do not have estimates for the social cost of increased erosion, these impacts are sensitive to water infrastructure and hydroelectric infrastructure that may be present in a fire-affected area.
64 Fitch, R. A., et al. (2013). “Forest restoration treatments: Their effect on wildland fire suppression costs.” Ecological Restoration Institute white paper.
65 University of California, Division of Agriculture and Natural Resources (2017). California forests.66 State of California (2012). Incident Information.
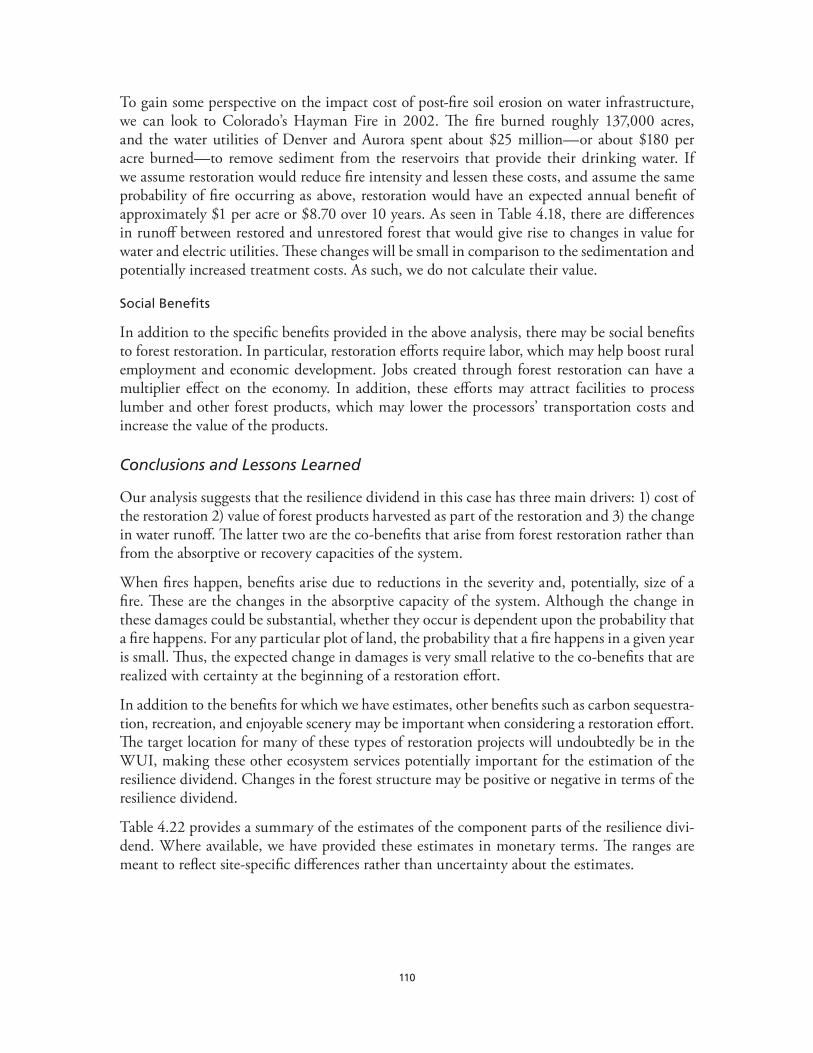
110
To gain some perspective on the impact cost of post-fire soil erosion on water infrastructure, we can look to Colorado’s Hayman Fire in 2002. The fire burned roughly 137,000 acres, and the water utilities of Denver and Aurora spent about $25 million—or about $180 per acre burned—to remove sediment from the reservoirs that provide their drinking water. If we assume restoration would reduce fire intensity and lessen these costs, and assume the same probability of fire occurring as above, restoration would have an expected annual benefit of approximately $1 per acre or $8.70 over 10 years. As seen in Table 4.18, there are differences in runoff between restored and unrestored forest that would give rise to changes in value for water and electric utilities. These changes will be small in comparison to the sedimentation and potentially increased treatment costs. As such, we do not calculate their value.
Social Benefits
In addition to the specific benefits provided in the above analysis, there may be social benefits to forest restoration. In particular, restoration efforts require labor, which may help boost rural employment and economic development. Jobs created through forest restoration can have a multiplier effect on the economy. In addition, these efforts may attract facilities to process lumber and other forest products, which may lower the processors’ transportation costs and increase the value of the products.
Conclusions and Lessons Learned
Our analysis suggests that the resilience dividend in this case has three main drivers: 1) cost of the restoration 2) value of forest products harvested as part of the restoration and 3) the change in water runoff. The latter two are the co-benefits that arise from forest restoration rather than from the absorptive or recovery capacities of the system.
When fires happen, benefits arise due to reductions in the severity and, potentially, size of a fire. These are the changes in the absorptive capacity of the system. Although the change in these damages could be substantial, whether they occur is dependent upon the probability that a fire happens. For any particular plot of land, the probability that a fire happens in a given year is small. Thus, the expected change in damages is very small relative to the co-benefits that are realized with certainty at the beginning of a restoration effort.
In addition to the benefits for which we have estimates, other benefits such as carbon sequestra-tion, recreation, and enjoyable scenery may be important when considering a restoration effort. The target location for many of these types of restoration projects will undoubtedly be in the WUI, making these other ecosystem services potentially important for the estimation of the resilience dividend. Changes in the forest structure may be positive or negative in terms of the resilience dividend.
Table 4.22 provides a summary of the estimates of the component parts of the resilience divi-dend. Where available, we have provided these estimates in monetary terms. The ranges are meant to reflect site-specific differences rather than uncertainty about the estimates.
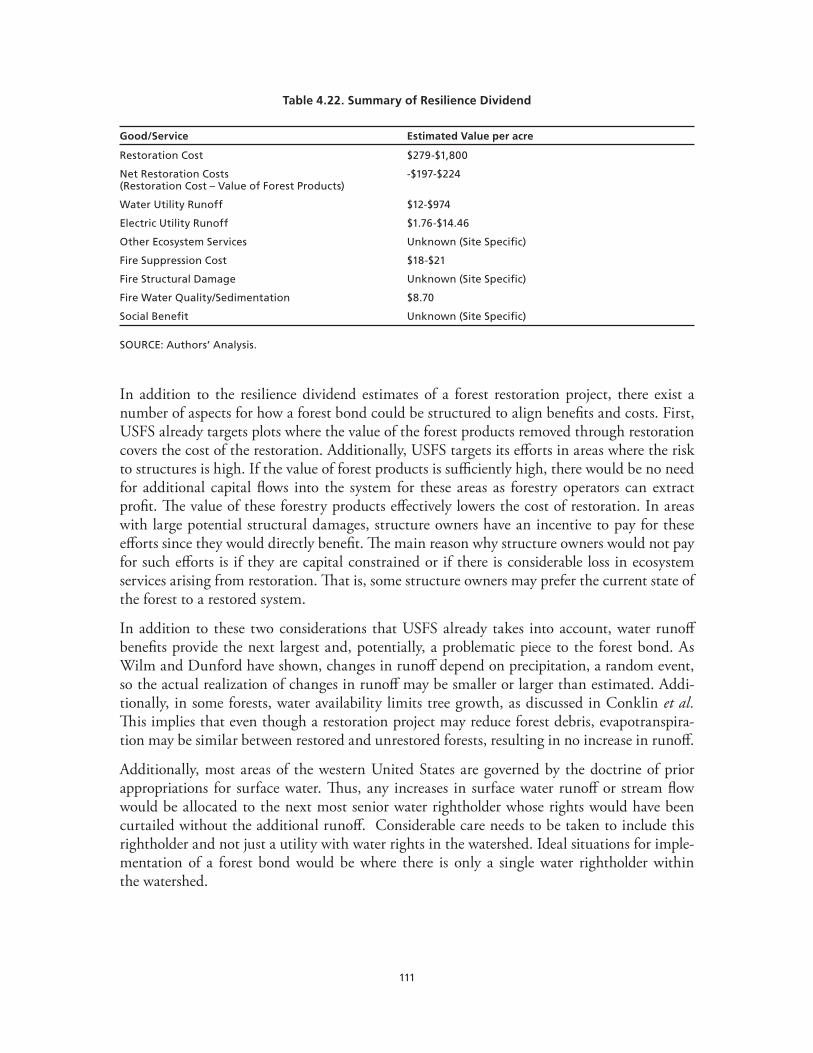
111
Table 4.22. Summary of Resilience Dividend
Good/Service Estimated Value per acre
Restoration Cost $279-$1,800
Net Restoration Costs (Restoration Cost – Value of Forest Products)
-$197-$224
Water Utility Runoff $12-$974
Electric Utility Runoff $1.76-$14.46
Other Ecosystem Services Unknown (Site Specific)
Fire Suppression Cost $18-$21
Fire Structural Damage Unknown (Site Specific)
Fire Water Quality/Sedimentation $8.70
Social Benefit Unknown (Site Specific)
SOURCE: Authors’ Analysis.
In addition to the resilience dividend estimates of a forest restoration project, there exist a number of aspects for how a forest bond could be structured to align benefits and costs. First, USFS already targets plots where the value of the forest products removed through restoration covers the cost of the restoration. Additionally, USFS targets its efforts in areas where the risk to structures is high. If the value of forest products is sufficiently high, there would be no need for additional capital flows into the system for these areas as forestry operators can extract profit. The value of these forestry products effectively lowers the cost of restoration. In areas with large potential structural damages, structure owners have an incentive to pay for these efforts since they would directly benefit. The main reason why structure owners would not pay for such efforts is if they are capital constrained or if there is considerable loss in ecosystem services arising from restoration. That is, some structure owners may prefer the current state of the forest to a restored system.
In addition to these two considerations that USFS already takes into account, water runoff benefits provide the next largest and, potentially, a problematic piece to the forest bond. As Wilm and Dunford have shown, changes in runoff depend on precipitation, a random event, so the actual realization of changes in runoff may be smaller or larger than estimated. Addi-tionally, in some forests, water availability limits tree growth, as discussed in Conklin et al. This implies that even though a restoration project may reduce forest debris, evapotranspira-tion may be similar between restored and unrestored forests, resulting in no increase in runoff.
Additionally, most areas of the western United States are governed by the doctrine of prior appropriations for surface water. Thus, any increases in surface water runoff or stream flow would be allocated to the next most senior water rightholder whose rights would have been curtailed without the additional runoff. Considerable care needs to be taken to include this rightholder and not just a utility with water rights in the watershed. Ideal situations for imple-mentation of a forest bond would be where there is only a single water rightholder within the watershed.
112
Finally, the current landscape of land ownership with forested areas includes federal and state agencies as well as private land holders. As we learn from SPLATs, there may be potential to target specific locations to have an effect on the size rather than severity of fires. Thus, spillover benefits may arise from a reduction in fire suppression costs, as significantly less area would need to be suppressed. Additionally, some work suggests that to realize these estimated ben-efits, 20%-30% of the landscape would need to be restored.
ISET Da Nang, Vietnam
This case study is based on the RDVM. It provides a demonstration of how the RDVM can be applied in real-world situations. The case can be read on its own, but it is part of a broader package that includes five other case studies presented in Chapter 4 and the lessons learned from all the cases in Chapter 5.. This case study is intended primarily to help readers under-stand how to apply the RDVM framework given a set of data or information about a given project. Any estimate of the resilience dividend is provided as an example, and is not necessar-ily a complete estimate.
The ISET-Vietnam project in the Da Nang case study is an example of calculating the resil-ience dividend in an ex post case without a shock or stressor. This case highlights consider-ations for future pre- and post-resilience project data collection to be able to capture more social co-benefits and a true resilience dividend. The case does not provide a numerical esti-mate of the resilience dividend for this project, but it will be useful for practitioners trying to apply the RDVM to household-level resilience investments.
Executive Summary
For typhoon-prone Da Nang city, the Institute for Social and Environmental Transition-Viet-nam (ISET) conducted a cost-benefit analysis to understand the benefits of alternate housing that is more typhoon resilient.67 After the analysis found that there is a positive return on investment if a typhoon occurs early in the lifespan of the house,68 ISET implemented a revolv-ing loan and savings program for typhoon resilient housing69 construction with a local partner, the Da Nang Women’s Union, from 2011 to 2014. Loans were provided to 377 low-income households, and grants were made to 20 extremely poor households. During the intervention, Typhoon Nari struck on October 14, 2013, with level 12 winds (120 kph or 75 mph). An assess-
67 The major elements of typhoon resilient/storm resistant housing include the following elements; simple building forms, appropriate pitched roofs (30-45º), stronger structure, safe failure using a solid room in a house, and secure connections between roofs and the main structure. From: Phong, T. V. G. (2013). Lessons from Typhoon Nari Storm Resistant Housing Shown to be Effective. Hanoi, Institute for Social and Environmental Transition-International Vietnam.
The term “non-resilient housing” used throughout refers to houses assumed to have only some or none of these features (e.g., no concrete or iron support columns) and therefore would not withstand a typhoon at level 12 on the Beaufort Scale.
68 Tuan, T. H., et al. (2015). “Quantitative cost-benefit analysis for typhoon resilient housing in Danang city, Vietnam.” Urban Climate, 12, 85.
69 Throughout this analysis we use the term typhoon-resilient housing, as ISET-Vietnam did in its cost-benefit analysis. ISET also used the term storm-resistant housing in its housing intervention. We chose to use typhoon-resilient, although ISET used the two terms interchangeably.
113
ment immediately after the typhoon found that none of the typhoon-resilient dwellings built at that point had been harmed, while over 4,000 other houses70 that were assessed suffered damage.
Data made available for RAND’s analysis were a 2012 needs assessment of households that experienced a typhoon in 2009 and 2006 to estimate the damage costs expected for an average household that is not connected to any particular intervention. ISET also provided household-level descriptive data on loan payments, savings, and average household monthly income for households in the 2011–2014 resilient housing project. No other data on a control group to identify comparison repayments were available. Also 16 of almost 400 participants in the inter-vention had additional loans unrelated to the intervention. There was also no data to calculate if incomes and savings increased over time with the typhoon-resilient housing intervention. No data on the damage, cost of repair, or community response to Typhoon Nari in 2013 were available to RAND for analysis. Pre-intervention data from 2016-2017 on household needs assessment were also provided for ISET’s current work to analyze the incentives needed for resilient housing in Da Nang.
With the information available, RAND mapped elements of this system to the RDVM frame-work and provided considerations on how to estimate the resilience dividend to demonstrate the benefits of ISET’s intervention compared to BAU. In this case study, ISET’s resilient hous-ing program is the intervention, and the baseline or BAU case is no resilient housing program. ISET’s intervention consisted of four major activities:
1. Development of a typhoon-resilient housing design for low-income households;
2. A grant and revolving loan program to subsidize repairs to and replacement of existing homes with the typhoon-resilient model;
3. A savings program and savings group formation and training; and
4. Information and training on typhoons and disaster preparation and response (community resilience, resilient housing construction, climate change, etc.).
Table 4.23 provides an overview of the key elements of the case study as it relates to the RDVM.
Is There Evidence of a Resilience Dividend?
Given the limited quantitative project outcome information available, we were not able to quantify a resilience dividend. However, two available metrics indicate the intervention may have improved resilience: The 377 low-income households that received revolving loans had a zero default rate as of June 2015, and each intervention household also had some savings. In addition, ISET’s pre-intervention feasibility study found that households are willing to take loans to invest in resilient housing,71 suggesting that poor and near poor households found
70 ISET indicated in their assessment that some private actions were taken to reinforce the houses, but they provided no further details. Phong, T. V. G. (2013). Lessons from Typhoon Nari Storm Resistant Housing Shown to be Effective. Hanoi, Institute for Social and Environmental Transition-International Vietnam: 4.
71 Mai, N. T. L. (2014). Storm resistant housing for a resilient Da Nang City. Da Nang, Vietnam: ISET.
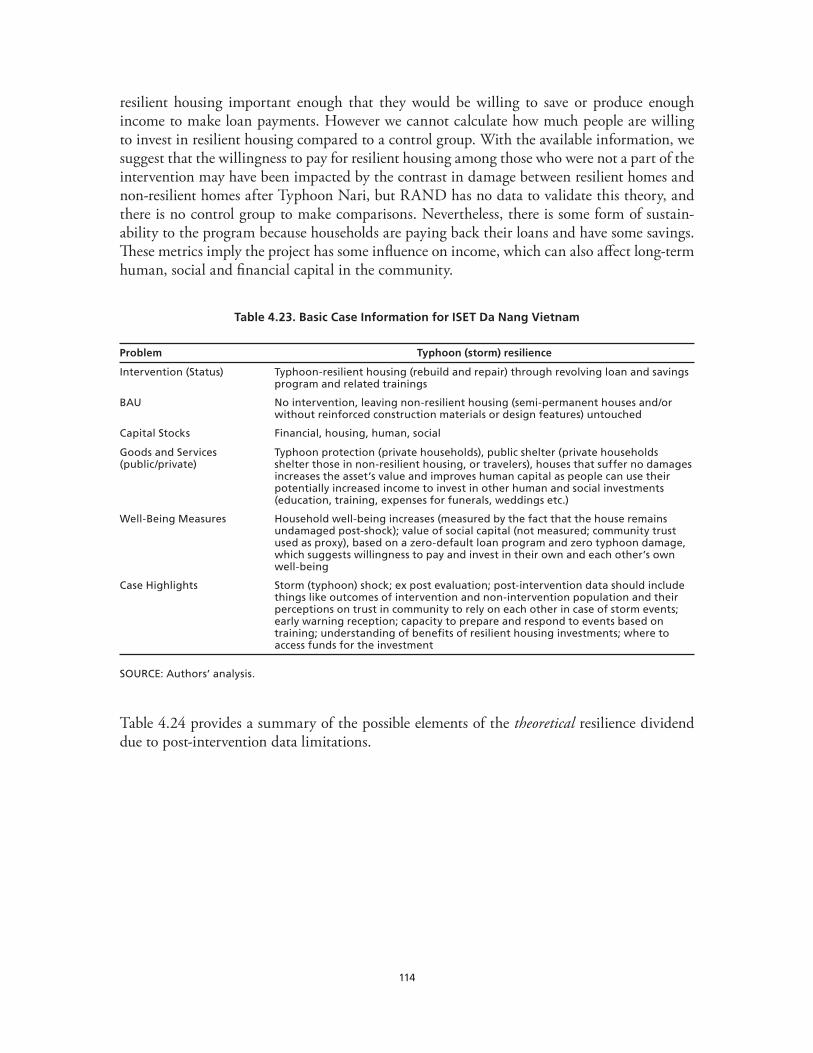
114
resilient housing important enough that they would be willing to save or produce enough income to make loan payments. However we cannot calculate how much people are willing to invest in resilient housing compared to a control group. With the available information, we suggest that the willingness to pay for resilient housing among those who were not a part of the intervention may have been impacted by the contrast in damage between resilient homes and non-resilient homes after Typhoon Nari, but RAND has no data to validate this theory, and there is no control group to make comparisons. Nevertheless, there is some form of sustain-ability to the program because households are paying back their loans and have some savings. These metrics imply the project has some influence on income, which can also affect long-term human, social and financial capital in the community.
Table 4.23. Basic Case Information for ISET Da Nang Vietnam
Problem Typhoon (storm) resilience
Intervention (Status) Typhoon-resilient housing (rebuild and repair) through revolving loan and savings program and related trainings
BAU No intervention, leaving non-resilient housing (semi-permanent houses and/or without reinforced construction materials or design features) untouched
Capital Stocks Financial, housing, human, social
Goods and Services (public/private)
Typhoon protection (private households), public shelter (private households shelter those in non-resilient housing, or travelers), houses that suffer no damages increases the asset’s value and improves human capital as people can use their potentially increased income to invest in other human and social investments (education, training, expenses for funerals, weddings etc.)
Well-Being Measures Household well-being increases (measured by the fact that the house remains undamaged post-shock); value of social capital (not measured; community trust used as proxy), based on a zero-default loan program and zero typhoon damage, which suggests willingness to pay and invest in their own and each other’s own well-being
Case Highlights Storm (typhoon) shock; ex post evaluation; post-intervention data should include things like outcomes of intervention and non-intervention population and their perceptions on trust in community to rely on each other in case of storm events; early warning reception; capacity to prepare and respond to events based on training; understanding of benefits of resilient housing investments; where to access funds for the investment
SOURCE: Authors’ analysis.
Table 4.24 provides a summary of the possible elements of the theoretical resilience dividend due to post-intervention data limitations.
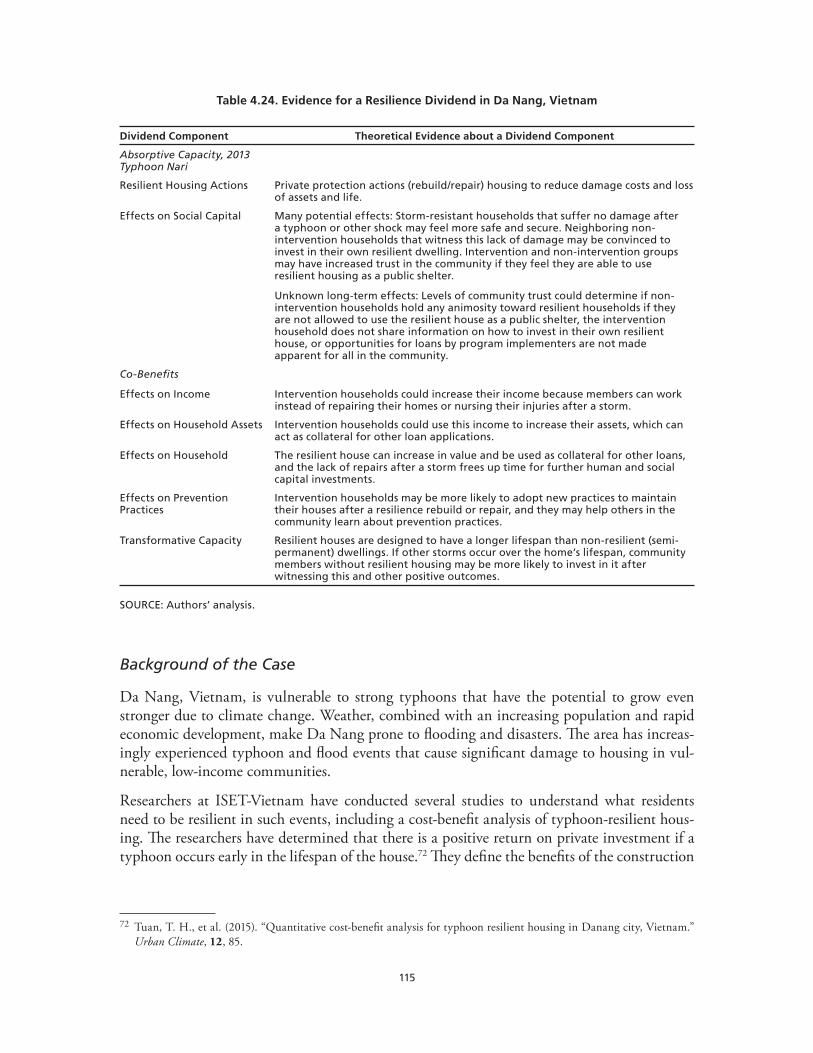
115
Table 4.24. Evidence for a Resilience Dividend in Da Nang, Vietnam
Dividend Component Theoretical Evidence about a Dividend Component
Absorptive Capacity, 2013 Typhoon Nari
Resilient Housing Actions Private protection actions (rebuild/repair) housing to reduce damage costs and loss of assets and life.
Effects on Social Capital Many potential effects: Storm-resistant households that suffer no damage after a typhoon or other shock may feel more safe and secure. Neighboring non-intervention households that witness this lack of damage may be convinced to invest in their own resilient dwelling. Intervention and non-intervention groups may have increased trust in the community if they feel they are able to use resilient housing as a public shelter.
Unknown long-term effects: Levels of community trust could determine if non-intervention households hold any animosity toward resilient households if they are not allowed to use the resilient house as a public shelter, the intervention household does not share information on how to invest in their own resilient house, or opportunities for loans by program implementers are not made apparent for all in the community.
Co-Benefits
Effects on Income Intervention households could increase their income because members can work instead of repairing their homes or nursing their injuries after a storm.
Effects on Household Assets Intervention households could use this income to increase their assets, which can act as collateral for other loan applications.
Effects on Household The resilient house can increase in value and be used as collateral for other loans, and the lack of repairs after a storm frees up time for further human and social capital investments.
Effects on Prevention Practices
Intervention households may be more likely to adopt new practices to maintain their houses after a resilience rebuild or repair, and they may help others in the community learn about prevention practices.
Transformative Capacity Resilient houses are designed to have a longer lifespan than non-resilient (semi-permanent) dwellings. If other storms occur over the home’s lifespan, community members without resilient housing may be more likely to invest in it after witnessing this and other positive outcomes.
SOURCE: Authors’ analysis.
Background of the Case
Da Nang, Vietnam, is vulnerable to strong typhoons that have the potential to grow even stronger due to climate change. Weather, combined with an increasing population and rapid economic development, make Da Nang prone to flooding and disasters. The area has increas-ingly experienced typhoon and flood events that cause significant damage to housing in vul-nerable, low-income communities.
Researchers at ISET-Vietnam have conducted several studies to understand what residents need to be resilient in such events, including a cost-benefit analysis of typhoon-resilient hous-ing. The researchers have determined that there is a positive return on private investment if a typhoon occurs early in the lifespan of the house.72 They define the benefits of the construction
72 Tuan, T. H., et al. (2015). “Quantitative cost-benefit analysis for typhoon resilient housing in Danang city, Vietnam.” Urban Climate, 12, 85.

116
intervention as avoided damage and loss,73 if proper materials and construction practices are implemented in typhoon-resilient housing. This finding was informed by a housing design competition (funded by the Climate Development and Knowledge Network) that the research team implemented to determine which housing model would work best in the wards in Da Nang that are most vulnerable. The housing designs considered site planning; building plan-ning and construction technology; and physical, social, and administrative factors that were appropriate in the local context.74 The housing was designed to withstand a level 12 typhoon with winds of approximately 120 kph (75 mph).75
ISET also conducted a survey of households in three wards76 to identify the damage costs to the average household from two past storms—Ketsana (2009) and Xangsane (2006). The damage costs—converted into 2012 rates and adjusted for inflation—provided a BAU scenario with no climate change and a future scenario with climate change (i.e., increased storm fre-quency or intensity) to understand the cost and benefits of investing in resilient housing. These analyses considering future economic impacts found that there are positive economic returns on investing in typhoon-resilient housing.
Based on ISET’s findings from that cost-benefit analysis, and the understanding that it is expensive for locals to buy the materials and hire the skilled technical labor for resilient hous-ing construction, ISET implemented a revolving loan and savings program for resilient hous-ing construction from 2011 to 2014. Funded in part by the Rockefeller Foundation to enhance the resilience of those most vulnerable to storms and floods, ISET provided technical support and training to the Da Nang Women’s Union for climate change responses, community-based disaster resilience management, interpersonal communication, and credit management.77 The Women’s Union took its members’ skills into the community and implemented technical training for local builders and financial savings training for households, hosted community risk management workshops, and created savings groups aimed at building good savings habits and trust among participants. The objective was for program participants to become experts on storm-resistant housing and “change agents” for safer practices in their communities.78 There are four main components to the intervention.
1. Development of a typhoon-resilient housing design for low-income households;
2. A grant and loan program to subsidize repairs to and replacement of existing homes with the typhoon-resistant model;
73 Moench, M., and The Sheltering Team. (2014). Sheltering from a gathering storm: Synthesis report.74 Moench, M., and The Sheltering Team. (2014). Sheltering from a gathering storm: Synthesis report.75 As ISET explained this is level 12 on the Beaufort Scale, which is the highest level of the scale. More information on each
level can be found at: “Beaufort Wind Scale.”76 The three wards were Man Thai (Son Tra district), Hoa Quy (Ngu Hanh Son district), and Hoa Hiep Bac (Lien Chieu
district). Tuan, T. H., et al. (2015). “Quantitative cost-benefit analysis for typhoon resilient housing in Danang City, Vietnam.” Urban Climate, 12, 88.
77 Mai, N. T. L. (2014). Storm resistant housing for a resilient Da Nang City. Da Nang, Vietnam: ISET.78 Mai, N. T. L. (2014). Storm resistant housing for a resilient Da Nang City. Da Nang, Vietnam: ISET.

117
3. A savings program and savings group formation and training; and
4. Information and training on typhoons and disaster preparation and response (community resilience, resilient housing construction, climate change, etc.).
The revolving credit loans and savings programs helped 377 low-income (near poor and poor) households rebuild or renovate their homes at an average cost of $4,12079 or 89,944,984 VND to be more typhoon resistant using the blueprints from the design competition. Most of these investments went to households with semi-permanent structures with an average loan of almost $1,000 or 22,997,347 VND80 over 40 months.81 Though the loans have not yet been completely paid off, currently no borrowers have defaulted on their loans. Given the program’s success, ISET, the Da Nang Women’s Union, and other organizations are attempting to rep-licate it elsewhere with support from the Asian Development Bank (ADB). ADB’s funding is being used to analyze the incentives needed to encourage key stakeholders to invest in building resilient housing.82
ISET’s progress reports included project outcome numbers on certain training activities, but the level of detail was limited, and no data related to the broader impact of changes in housing on household well-being were available for analysis. However, a number of potentially broader social impacts have been assessed. For example, 702 Women’s Union staff trained in commu-nity-based disaster risk management and climate change, and at least 644 people in the target beneficiary group (not specified in documentation) joined in awareness-raising workshops and sessions on storm-resistant housing techniques. But these output measures without further detail do not provide a better understanding of the broader household and social impacts that the program may be having. Given this limitation, our analysis focuses more on the resil-ient housing itself and identifies considerations for human and social capital in the system where possible. The needs assessments that have been completed focus on these broader goals, but no assessments have been implemented among the intervention households to understand whether the goals have been realized.
Evidence of Resilience
The continued investment in resilience housing is also due to evidence of the absorptive capac-ity of the community due to a shock that occurred during the intervention. On October 14, 2013, Da Nang was hit by Typhoon Nari, with level 12 winds (the maximum capacity that the resilient housing was designed to withstand). Nari passed through areas where resilient houses and regularly constructed houses stood side by side. Immediately after the storm, ISET and the Women’s Union assessed the damage and reported no damage to any of the 244 resilient dwell-ings. In contrast, among non-resilient homes, 122 had collapsed roofs and 4,200 others were
79 89,944,984 VND converted to US dollars on June 30, 2015 using the OANDA currency converter. Details provided by ISET research staff in one of their project narrative reports for October 2014–June 2015.
80 22,997,347 VND converted to US dollars on June 30, 2015 using the OANDA currency converter. Details provided by ISET research staff in one of their project narrative reports for October 2014–June 2015.
81 Details provided by ISET research staff in one of their project narrative reports for October 2014–June 201582 Details provided by ISET research staff in one of their project narrative reports for October 2014–June 2015

118
severely damaged.83 The assessment also found that investment in preparation for typhoons is more effective than spending on post-disaster recovery based on the understanding that local investment in prevention is very limited and more resources are spent on response and recovery for those without resilient houses.84 In other words, the benefits of resilient housing are avoid-ing damage and the costs of repair, preventing assets from losing value, and protecting house-hold members. The intervention was designed to increase the capacity of households to absorb a shock, but it also may have affected recovery and transformational capacities in the broader community. We cannot directly measure these aspects but understand there are changes in behavior that may affect social capital, which is discussed in the following sections.
Applying the RDVM to Estimate the Potential Dividend for Da Nang
To apply the resilience dividend to Da Nang, we use the framework we developed to map the “system” of resilient housing. Da Nang has various capital stocks (people, housing, money) that contribute goods and services that, in turn, affect overall community well-being. Our focus is on households recognizing that some benefits of increasing the quality of private hous-ing may spill over into the broader community. The objective of the analysis is to map how decisionmakers could compare the differences in well-being for areas with resilient housing and related trainings (the intervention case) versus areas without resilient housing (the BAU case). Non-resilient housing includes structures that may be semi-permanent; lack appropri-ate pitched roofs and angles; and lack construction materials and methods such as reinforced concrete, increased wall thickness, or safe rooms in case other walls fail.85 These households do not engage in storm prevention activities like community-based disaster response and manage-ment, do not apply for and use loans, or do not practice good savings habits. BAU would mean households respond to a storm rather than trying to proactively reduce a storm’s impact.
The following subsections detail the elements and assumptions of the model, which is graphi-cally illustrated in Figure 4.13.
83 Phong, T. V. G. (2013). Lessons from Typhoon Nari storm resistant housing shown to be effective. Hanoi: Institute for Social and Environmental Transition-International Vietnam, 4.
84 Phong, T. V. G. (2013). Lessons from Typhoon Nari storm resistant housing shown to be effective. Hanoi: Institute for Social and Environmental Transition-International Vietnam, 11.
85 Moench, M., and The Sheltering Team. (2014). Sheltering from a gathering storm: Synthesis report.

119
Figure 4.13. Mapping of the Resilience System
Incomeetc.
TyphoonProtection
StormShelter(Public)
HumanCapital
HousingCapital
FinancialCapital
SocialCapital
Well-Being
SOURCE: Authors’ analysis.
Capital Stocks
There are four main sets of capital stocks (represented as blue rectangles in Figure 4.13) in this system:
1. Financial capital supports resilient housing construction, loans, and savings programs;
2. Housing capital through resilient structures provides a higher value asset;
3. Human capital; and
4. Social capital.
The “allocation mechanism” of each stock—that is, how resources, goods, and services are distributed among producers and consumers—represents how the stocks act as change agents and encourage certain resilient behaviors. Financial capital plays a critical role both in the provision of housing capital and in the recovery process after a typhoon occurs. As ISET has shown, investing in typhoon-resistant housing is cost-effective, but households may lack the financial resources to build it. Additionally, savings act as a form of self-insurance in the event of a storm.
Investments in resilient housing capital increase the value of reinforced or rebuilt structures over the home’s lifespan. The improved quality of the house itself frees up time for residents to spend on more enriching activities. This assumes that those with non-resilient houses spend more time fixing their house after shocks. The higher-value house itself can act as collateral for other loans, which again could free up more time for other activities that might enhance well-being. This creates a linkage between the housing and financial capital stocks: as housing capital increases, so might access to financing.
120
Human capital stocks refer to not only the household’s size and its members’ work availability but also the knowledge that members possess. Homeowners’ knowledge increases as they are exposed to technical assistance training and community workshops, and as they gain more awareness of behaviors or investments that improve disaster prevention and lessen damage. Human capital, through its allocation mechanism, informs people’s behavioral choices, such as how to prepare for a typhoon through immediate actions or long-term housing investments that ultimately can mitigate storm damage. Human capital is also the increased number of indi-viduals receiving intervention training, which may make the larger community more resilient.
Social capital in this analysis refers to Da Nang’s broader social dynamics in which neighbors and community members trust and help each other with prevention, response, and recovery activities. Assistance may include financial help but also advice on community resilience train-ing opportunities, early warning of an approaching storm, offers of shelter in a storm-resistant house, or information on the benefits of resilient houses. This social capital may also have long-term impacts, which are discussed below.
Goods and Services86
Well-being in the typhoon resilience system can encompass a wide range of goods and services provided through the capital stocks. However, data limitations at the household level pre-vented us from aggregating well-being. Instead we include a list of goods and services as a part of the overall household well-being based on the information available.
The goods and services (represented as red ovals) in Figure 4.13 illustrate that the housing intervention serves to mitigate potential damage to houses and assets and disruptions to peo-ple’s lives. A primary service of the housing stock associated with the absorptive capacities is typhoon protection. Resilient houses protect household members but can also shelter members of the public (e.g., neighbors, travelers, fishermen) who lack resilient housing, which may build community trust. The public shelter and protection provided by the private household means that the larger community (local government, neighbors, etc.) would have to financially sup-port fewer damaged households, which increases overall well-being. Access to improved hous-ing stocks may increase the ability of the household to earn income both before and after a storm given that the homes require less preparation to do before a storm, less cleanup after-ward, and less maintenance overall. The dynamic nature and durability of the capital stocks play an important role in the resilience dividend through the allocation mechanism.
Well-Being
Because of the project’s short timeline, the intervention’s effects on household well-being were unobservable, but we assume that resilient households will experience an increasingly stable economic and social base with greater income and savings. Resilient housing allows these households to avoid storm-related damage and costs, as well as losses of life, property, and assets, and enables households to spend income and time on other activities such as work or education. They may also buy more assets if they believe their house is safe and secure, attend more social activities, and share resilience information with others if they are proud of their
86 Some of the goods and services and well-being items in our resilience mapping were informed by benefits listed in Moench, M., and The Sheltering Team. (2014). Sheltering from a gathering storm: Synthesis report, 16 Table 5.

121
homes. Those who have paid off their home loans and implemented effective savings programs may gain easier access to credit and loans to pay for new assets or things like health care, edu-cation, and training.
Other Model Elements and Assumptions
This analysis assumes that the majority of Da Nang’s population in storm-prone areas will remain in their locations and continue to invest in resilient housing. Considering the elements discussed in the conceptual model, Figure 4.14 illustrates the notional mapping of the typhoon resilience system and project benefits over time after a storm.
Figure 4.14. Notional Absorption, Recovery, and Co-Benefits from the Intervention
Time
Typhoon
partially-observedpath with project
Project Shock
RecoveryBenefit (NotMeasured)
HouseholdWell-Being
Estimated “businessas usual” (BAU) path
SOURCE: Authors’ analysis.
Data
Three main data sources are available for analysis: 1) a 2012 housing needs assessment, 2) a 2016 housing needs assessment, and 3) an outcomes assessment for program participants.
1) ISET, along with Hue University, conducted a random selection household assessment87 from May to June 2012 that included demographic and economic conditions information, construction conditions of homes, household assets, and historical information regarding a household’s experience, if any, with Typhoon Xangsane (2006) and Typhoon Ketsana (2009). Most useful to understanding resilience are survey questions about household knowledge of and response to typhoons as well as the costs of typhoons.
87 This survey was discussed in two reports, Sheltering from a Gathering Storm; Typhoon Resilience in Da Nang, Vietnam, and Quantitative cost-benefit analysis for typhoon resilient housing in Da Nang city, Vietnam. The survey included 98 participants that were randomly selected based on the knowledge of if they were affected by Typhoons Xangsane (2006) and Ketsana (2009).

122
2) Limited outcome data for beneficiary households of resilient housing construction and loans and savings program from 2011 to 2014 were provided by ISET. The data contain some descrip-tive information on household members and information such as the condition of houses before rebuild or repair, loan and savings amounts, and whether construction was completed. Data indicate that all houses were completed and that all households had savings, and a prog-ress report indicates that no borrowers have defaulted so far on their loans. However, we do not have pre-intervention data on savings and income amounts for comparison.
3) Pre-intervention data from 2016–2017 on household needs assessment were also provided for ISET’s current work with the Women’s Union to analyze the incentives needed to scale up resilient housing in Da Nang. The assessment includes household demographics, socio-economic conditions, current housing quality and storm-resistant features, information on damage and costs from past storms, any renovations made to the house specifically for storms, and questions about life satisfaction, social interactions, and perceptions of resilience capacity.
These data provide considerable information about the housing needs of Da Nang’s low-income community but limited data regarding the outputs and outcomes of the intervention.
Empirical Methods
A key effort of this analysis is to suggest types of data that should be collected to inform the resilience dividend valuation since actual data were not available to do so. Our approach was to use the information collected in the needs assessment to inform data collection for post-inter-vention assessment. This effort would allow for a better understanding of the broader impacts of the program on household well-being. To fully estimate the resilience dividend and recovery or transformative benefit, we would ideally estimate the impact of the intervention on the long-term changes at the community and household levels. These estimates would include things like increased economic wealth due to increased income associated with the well-being of resilient households. They would include other human and social capital estimates at the com-munity level to understand if and how resilient housing may increase the overall social welfare of Da Nang: whether people are spending more time working, increasing income, investing in personal growth (education, training, etc.), and participating in social activities that increase trust among community members. However, the data available from ISET were limited to pre-intervention household needs assessments from 2012 and 2016. This is not something that could be used for ex post analysis, and no data on a control group were available.
The major outcome available from post-intervention data, as mentioned, was the zero defaults among the 377 households that received loans for resilient housing. Based on this fact as well as ISET’s pre-intervention feasibility study, we assume that poor and near poor households found resilient housing important enough to be able to save or produce enough income to make their loan payments. Also, based on the zero damage assessment after Typhoon Nari, ISET has already estimated that resilient housing indicates a greater capacity to absorb a shock.
While purely theoretical, we can assume that some transformative capacity may be taking place in that households with resilient dwellings that withstand typhoons over a lifespan have the ability to spend less on repairing damage and to invest in longer-term savings and income as a part of the socioeconomic benefits of a more resilient lifestyle. However, we are not able to measure this because we do not have data to compare income or savings levels before and after the intervention.

123
Based on the available data, Table 4.25 lists specific questions used by ISET that touch on elements of the resilience conceptual mapping that could inform how to value the resilience dividend within this system.
Table 4.25. ISET Pre-intervention questions to consider for inclusion in post-intervention data collection—mapped to the conceptual model.
Question Category Example Questions in (A) Element of the conceptual model
Social and Economic Costs of Damage
What was the value and type of damages to the house?
Housing & Financial Capital
Were your assets damaged and what was the value?
Housing & Financial Capital
Was anyone in your family injured or ill because of the storm, what were the costs of treatment?
Human Capital, household well-being
Did the storm cause interruptions to or missed days of work (how many) or school due to illness or injury?
Human, Financial & Social Capital
How many days of clean up after the storm?
Human, Financial & Social Capital
Were your utilities interrupted? Housing, & Human Capital (No electricity or internet reduces access to information)
Disaster Response & Preparedness
Method alerted of storm/s (TV, Newspaper, Radio, neighbors etc.)
Human & Social Capital
Did you move due to past storms (2009 & 2006?) How much time did it take and what were costs for the move?
Household, Financial & Human Capital (informed choice for move)
Did you take preventative measures to protect household and assets against storm damage? If not, why not?
Financial & Human Capital (informed choice of prevention behaviors) Typhoon protection
Do you think storms like Xangsane (2006) will happen in the future? *Data indicated most respondents thought they are very likely to occur.
Human Capital determines perceptions on the need for absorptive, and recovery capacity in case of a shock
Do you think you can do something to protect your family and assets from similar storms?
Human Capital (informed choice of prevention behaviors)
Do you have strategies to protect your family, assets and livelihood from future disasters, storms, or floods in the future?
Financial & Human Capital, Typhoon protection
Willingness to Pay **Hypothetically, if you have the opportunity to invest in something that would eliminate all potential damages from a storm like Xangsane, how much of your annual income would you be willing to give up?
Human Capital informs the potential Co-Benefit (Effect on prevention investment) and expected absorptive capacity, Income etc.

124
Table 4.25.—Continued
Intervention Outcome Example Data reference (B)
Household has rebuilt/upgraded house after disbursement (Yes/No)
Housing Capital (allocation mechanism to free up household time for other investments) Expected increase in household in well-being, Typhoon protection
Example Questions in (C)
Social and Economic Factors/Costs
Expenditures on certain items including -medications, health care services, internet, electricity, and traditional social gatherings (e.g. funerals, weddings, etc.)
Financial, Human (informed choice for well-being items), & Social capital (willingness to pay for activities that promote community support)
Does household have previous loans, and if you could receive more loans, what would be their purpose? (choice includes build, renovate, and repair house, health care services, among others)
Financial & Human Capital
If house was affected by previous storms, estimated cost of damages to household, and household members who died, were hurt or ill
Financial, Housing & Human Capital
If you have done renovations or repairs to protect the household against storms, how much time spent (days) and how much money have you spent on that?
Household, Financial & Human Capital (willingness to pay for resilient housing) may be determined by historical outcomes on past investments, typhoon protection
Resilience and Social Factors
What is your satisfaction on as scale of 1-5 (very satisfied) with things like the following: success in your life, safety during storms and floods, feeling that you are part of the community, future security
Human & Social Capital, well-being as it relates to the community
If you needed to borrow a small amount of money for household activities, is there anyone (not a family member) willing and able to provide you with the money?
Social & Financial Capital
In the past 12 months, how many people have asked you to provide some support for personal reasons?
Social Capital
On a 5 point scale, 1 = strongly agree:
1) If a storm such as Nari were to occur in my area tomorrow, my house would be safe, my family would be able to recover from the damages caused by the storm within 6 months
2) If the quantity and severity of storms were to increase significantly in the next 5 years, my family has the ability to successfully adapt to threats caused by storms, even if this requires us to change our way of life
3) If a storm such as Nari from 2013 were to occur in my area tomorrow, my family has the financial resources to guarantee that we can completely recover from the effects of the storm.
Household well-being through:1 & 2) Social & Human Capital (informed choice of prevention behaviors based on perceptions of absorptive & transformative capacity within household and the community support)
3) Financial & Human Capital
4) Social Capital (trust in community support, access to a Storm Shelter (public good)
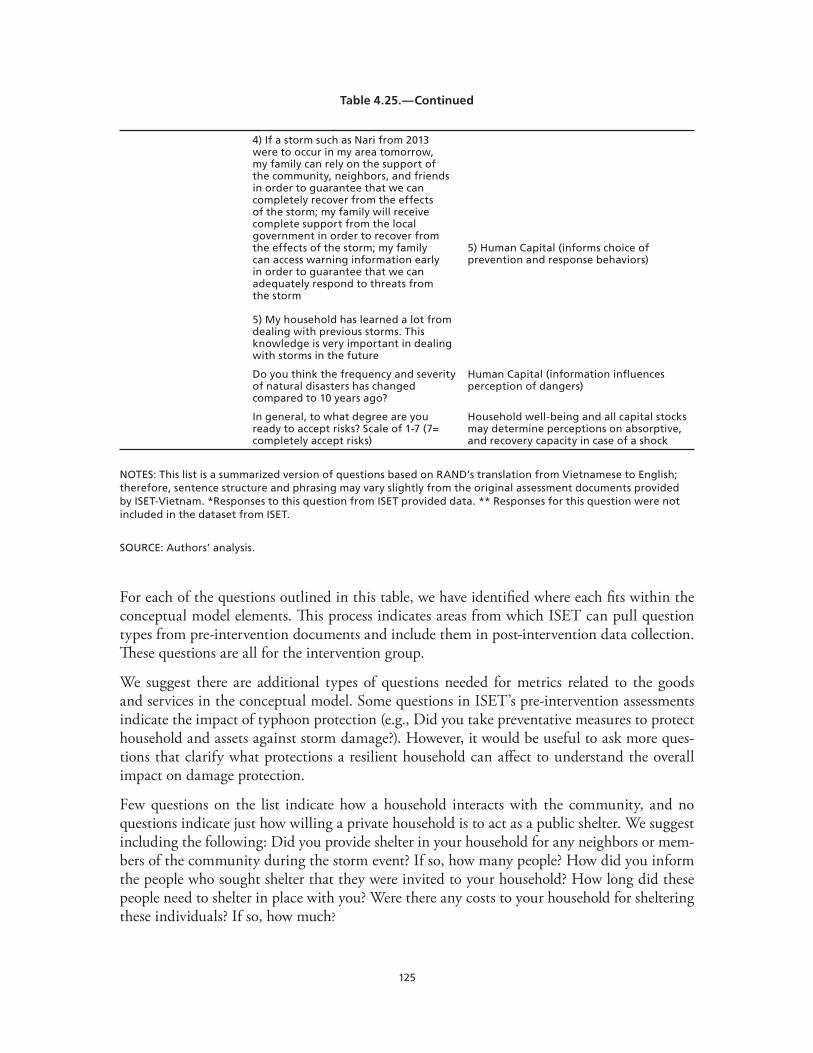
125
Table 4.25.—Continued
4) If a storm such as Nari from 2013 were to occur in my area tomorrow, my family can rely on the support of the community, neighbors, and friends in order to guarantee that we can completely recover from the effects of the storm; my family will receive complete support from the local government in order to recover from the effects of the storm; my family can access warning information early in order to guarantee that we can adequately respond to threats from the storm
5) My household has learned a lot from dealing with previous storms. This knowledge is very important in dealing with storms in the future
5) Human Capital (informs choice of prevention and response behaviors)
Do you think the frequency and severity of natural disasters has changed compared to 10 years ago?
Human Capital (information influences perception of dangers)
In general, to what degree are you ready to accept risks? Scale of 1-7 (7= completely accept risks)
Household well-being and all capital stocks may determine perceptions on absorptive, and recovery capacity in case of a shock
NOTES: This list is a summarized version of questions based on RAND’s translation from Vietnamese to English; therefore, sentence structure and phrasing may vary slightly from the original assessment documents provided by ISET-Vietnam. *Responses to this question from ISET provided data. ** Responses for this question were not included in the dataset from ISET.
SOURCE: Authors’ analysis.
For each of the questions outlined in this table, we have identified where each fits within the conceptual model elements. This process indicates areas from which ISET can pull question types from pre-intervention documents and include them in post-intervention data collection. These questions are all for the intervention group.
We suggest there are additional types of questions needed for metrics related to the goods and services in the conceptual model. Some questions in ISET’s pre-intervention assessments indicate the impact of typhoon protection (e.g., Did you take preventative measures to protect household and assets against storm damage?). However, it would be useful to ask more ques-tions that clarify what protections a resilient household can affect to understand the overall impact on damage protection.
Few questions on the list indicate how a household interacts with the community, and no questions indicate just how willing a private household is to act as a public shelter. We suggest including the following: Did you provide shelter in your household for any neighbors or mem-bers of the community during the storm event? If so, how many people? How did you inform the people who sought shelter that they were invited to your household? How long did these people need to shelter in place with you? Were there any costs to your household for sheltering these individuals? If so, how much?

126
Additionally, many questions could be asked to understand the service that additional or decreased income can provide for decisions related to household well-being: In the past X time frame, since your resilient house was built, have you been able to increase your income or savings? If so, what have you done with this income? (Possible targeted answers could include “spent money on education or professional trainings, health care services for household mem-bers or community members”). How much more are you able to pay per month on these types of expenditures?
We also suggest that future projects include data collection on a control group to be able to understand the business-as -usual path compared to the path for the intervention group. This data could inform if there are any positive or negative perceptions associated with non-inter-vention households and if any tensions between the two groups were created, which could inform equity considerations that need to be considered in future intervention designs.
Several questions could reveal the amount of trust between households and their community and local government to further inform how social networks contribute to a resilience divi-dend in an inclusive wealth theory. For example, a question in the needs assessment asks if the respondent can rely on the community for support in an event like Typhoon Nari; a follow-up question could ask how much and what types of support they would anticipate receiving.
Finally, several questions could be asked about the household perception of their well-being, For example, provide a list of some things that may affect household well-being and ask partici-pants to rate them on a scale from no effect to a very strong effect. This may inform why they are willing or unwilling to invest in certain activities.
Results
Resilience Dividend Summary
Given the data limitations of this case, we are unable to estimate a resilience dividend. However, we do know that zero intervention households suffered damage following Typhoon Nari, so there is at least some resilience and absorptive capacity to shocks.
Lessons Learned
Da Nang, Vietnam, is an ex post case that illustrates the challenges of project data collection design in estimating the resilience dividend. Still, this case can be used to illustrate how needs assessments can be applied to post-intervention data collection efforts to understand not only households’ desires for resilient housing, but also the increased or decreased social capital out-comes in order to calculate the existence of a resilience dividend. It also illustrates how inter-ventions may help increase social capital. We discuss the major lessons learned below.
Ideal ex post analysis will include data for at least four points in time: prior to the inter-vention, after the intervention and before a shock, after a shock, and at some later post-shock period when the intervention had been fully realized. This data would need to be collected for both intervention and BAU households. These four time periods are important because they allow us to isolate the effects of the intervention from the effects of the shock and to identify the impact of the intervention on the different resilience capacities.
127
Review of existing and implemented household needs assessments can inform post-intervention data collection design. Practitioners can conduct a mapping exercise using pre-intervention needs assessments and available data to identify things that point to resil-ience aspects within the conceptual model. This exercise can inform post-intervention data collection design and considerations for future projects with the same intervention population. It also highlights the importance of post-intervention data which is needed to inform and value a resilience dividend.
Analyzing data over a longer period of time can inform resilience mapping and post-intervention data collection design. Because ISET-Vietnam has a large set of pre-intervention data that informs the resilience story of Da Nang starting in 2012, we were able to understand and inform the conceptual mapping of how multiple future projects with the same objective can contribute to household well-being in a typhoon resilience system. The steps identified in this analysis can be used to consider similar analysis in future projects.
Socioeconomic data should be collected. More detailed information on the socioeconomic dynamics of households in Da Nang within the typhoon resilience system are crucial to under-standing not only the absorptive capacity of intervention households and the community but also the long-term impacts that contribute to recovery/transformative capacity. This data will help inform the value of the resilience dividend and the difference in the value between the intervention and BAU scenarios.
Conclusions
This report documented RAND’s efforts to calculate the resilience dividend for an ISET- Viet-nam-led project in Da Nang. The major objective of the project was to increase the capacity of the Women’s Union, builders, and low-income households in the community to prepare for and respond to disasters through investing in resilient housing construction and a revolv-ing loan and savings program to mitigate expected costs after a storm. The project was imple-mented from 2011 through 2014, with Typhoon Nari occuring in 2013.
Based on the available descriptive data and project reports, RAND developed a community-based typhoon resilience conceptual model of the system consistent with the inclusive wealth theory. Four major capital stocks associated with resilient housing were identified (including financial capital, housing capital, human capital, and social capital), which are used to provide goods and services, and which are allocated on the basis of individual and community behav-iors. The primary measures of household well-being could not be calculated, but if appropriate data were collected, the measures could indicate the level of well-being compared to BAU. The resilience divided could not be calculated, but this analysis provides suggestions on what data to collect in a future project that could inform the potential value of the resilience dividend.

128
Asian Development Bank–Bangladesh
This case study is based on the RDVM. It provides a demonstration of how the RDVM can be applied in real-world situations. The case can be read on its own, but it is part of a broader package that includes five other case studies presented in Chapter 4 and the lessons learned from all the cases in Chapter 5. This case study is intended primarily to help readers under-stand how to apply the RDVM framework given a set of data and information about a given project. Any estimate of the resilience dividend is provided as an example and is not necessarily a complete estimate. This case study summarizes investments made by the Asian Development Bank in the coastal town of Mathbaria, Bangladesh. The case highlights the opportunities and challenges of both pre-project and post-project approaches for estimating the resilience divi-dend. It is a good example of a large-scale, broad-based resilience project, but the project design also makes calculating the resilience dividend challenging.
Executive Summary
The Asian Development Bank is co-financing investments in climate adaptive infrastructure and social systems in eight towns in Bangladesh, with the goal of improving long-term outcomes related to natural disasters. This case study looks at one of those towns, Mathbaria, where ADB is investing in physical infrastructure, supporting community decisionmaking, and enhanc-ing municipal government capacity through a multi-year project. Because the project is not yet complete, this case focuses on ex ante, or pre-project, estimates of the resilience dividend. However, we also discuss the challenges and opportunities for ex post (post-project) estimates.
Applying our capital theoretic framework to the Mathbaria case, we map out a system of physi-cal, human, social, and financial capital that will be affected by ADB’s project. This system produces a set of goods and services, ranging from water quality and flood protection to gen-eral economic activity and municipal services.88 The ADB project may also change the alloca-tion mechanisms for goods and services by promoting gender-inclusive decisionmaking and by enabling households to make different investment choices. To capture the value provided by the ADB investments, we suggest three complementary measures of well-being: household income, employment, and health quality. Table 4.26 summarizes the basic case details.
88 Details for the investment components can be found in Asian Development Bank (2014). Coastal Towns Environmental Infrastructure Project: Project Administration Manual. Metro Manila, Philippines, Asian Development Bank: Table 1.

129
Table 4.26. Basic Case Information for ADB–Bangladesh Case
Problem ADB is investing in eight coastal towns in Bangladesh to mitigate disaster risk and improve climate adaptation; we focused on the city of Mathbaria.
Intervention (Status) In progress. The intervention was started in 2016 and will be completed in 2017.
Business as Usual No ADB-driven investment.
Capital Stocks Physical capitalPiped waterDrainageRoadsBridgesCyclone sheltersHuman capitalSocial capitalFinancial capital
Goods and Services (public/private)
Water qualityFlood protectionEconomic activityMunicipal services
Well-Being Measures (measured/not measured)
Household incomeEmploymentHealth quality
Case Highlights This case emphasizes the challenges and opportunities of a large-scale investment in resilience and the benefits and the limitations of conducting extensive pre-program estimates of returns to physical infrastructure investments.
SOURCE: Authors’ analysis.
For our empirical approach, we present two strategies for estimating the resilience dividend, one based on a pre-project perspective and one that looks forward to a post-project period when it may be feasible to measure the realized benefits if data are collected to support measurement and analysis. Both perspectives require specifying a counterfactual against which one can esti-mate the net benefits of the project, which is the resilience dividend. In the pre-project (ex ante) approach, we assume a no investment counterfactual and no resilience investment counterfac-tual, while in the post-project (ex post) setting we recommend comparing Mathbaria to other towns that did not receive ADB investment or where investment was delayed.
We can provide limited data on benefits from infrastructure investments, which would con-tribute to the resilience dividend for this case. However, available data are not sufficiently disaggregated to allow us to construct even a partial resilience dividend estimate. In addition, ADB has done extensive rate of return analysis for the physical infrastructure components of the project, but there are no existing estimates for investments that target social or human capi-tal. We discuss options for expanding the estimates to be more inclusive, including how the post-project approach could be used to account for changes in non-physical capital.
130
ADB–Bangladesh Intervention Background 89
This case focuses on the Asian Development Bank’s (ADB) climate adaptation investments in eight coastal towns in Bangladesh, and more specifically on the town of Mathbaria. Between 2013 and 2020 ADB will invest approximately $20 million in loans and $10 million in grants to promote coastal resilience through a combination of infrastructure and human capacity improvements. The goal of the project is to improve well-being through improved climate and disaster resilience, with an emphasis on low-income households and women.
Mathbaria, which is a “batch 1” town, will receive upgrades to physical infrastructure and human capital between 2013 and 2017.90 The physical infrastructure upgrades include roads, bridges, drainage systems, water supply systems, and cyclone shelters. Improvements to human capital include strengthened municipal finance systems, increased citizen participation in deci-sionmaking, and improved capacity and institutional strength around public service provision. ADB investment will provide additional support for urban planning, water safety plans, and disaster management committees to reduce disaster risk exacerbated by climate change.91
Applying the Resilience Dividend Model to Establish a Dividend for ADB’s Bangladesh Project
The timing of ADB’s project in Mathbaria means this is an ex ante case in which we apply the RDVM from a planning and predictive perspective. The timeline established for the Math-baria project includes planning, preparation, and procurement in 2013–2015 and infrastruc-ture construction in 2016–2017. Data collection for the Mathbaria project—especially the output assessment at the household and community level—has not been completed. However, ADB has conducted extensive pre-project benefit-cost analysis (BCA) that can be used to support our resilience dividend model analysis. The timing means we are not able to observe shocks that could provide a test of the efficacy of ADB’s resilience investment.
Although the investment has not been completed, project planning is finished and implemen-tation has begun. Given this timing, we also use the case to discuss data collection require-ments and analytic approaches for estimating the resilience dividend in an ex post setting once investment is complete and potential benefits have been realized. The large scale of the Math-baria project combined with the multiple intervention components, including improvement to physical and non-physical capital, makes this a challenging case to analyze, especially in terms of identifying a valid counterfactual against which to compare observed changes and improve-ments. We discuss these challenges below.
89 The information for the ADB Bangladesh intervention comes from a series of program documents provided by ADB and accessible online at: Asian Development Bank (2014). “Coastal Towns Environmental Infrastructure Project.” Reports and Recommendations of the President.
90 There are two batches or tranches of investment in ADB’s project, with four towns in each batch. The second batch is being funded in part by a trust fund, to which the Rockefeller Foundation is a contributor.
91 A final component will provide administrative and management support and capacity, which is primarily associated with procurement, management, and oversight of the ADB project.
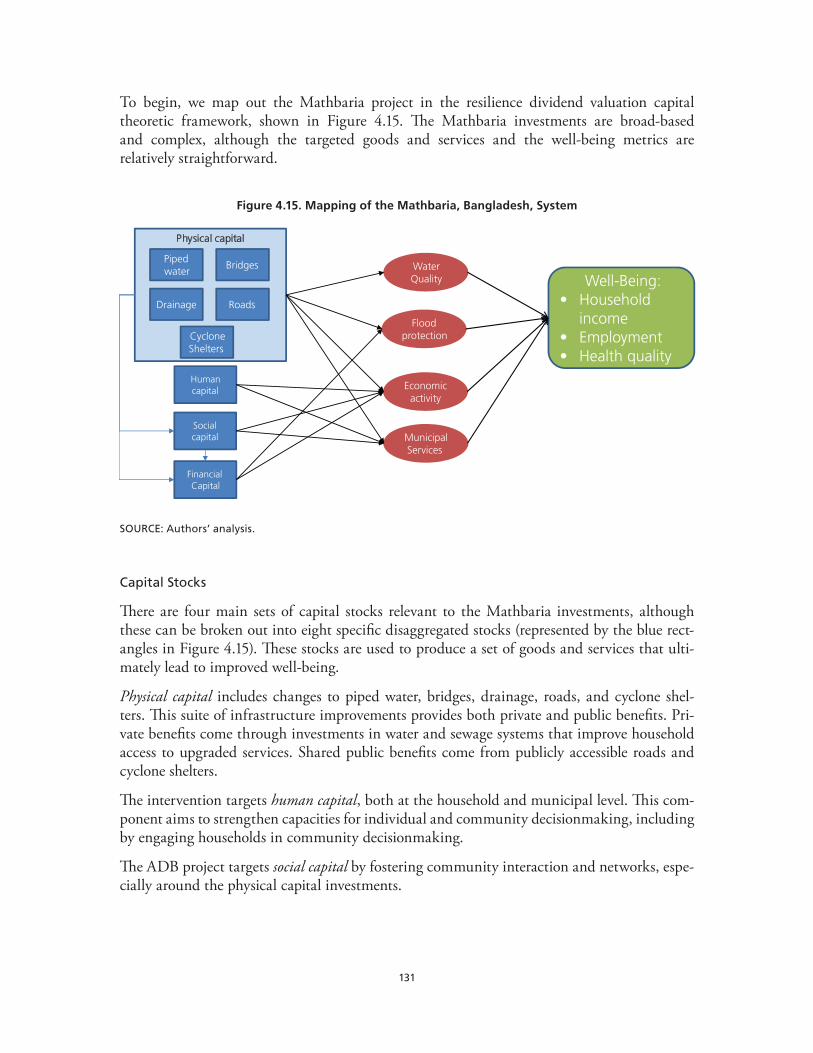
131
To begin, we map out the Mathbaria project in the resilience dividend valuation capital theoretic framework, shown in Figure 4.15. The Mathbaria investments are broad-based and complex, although the targeted goods and services and the well-being metrics are relatively straightforward.
Figure 4.15. Mapping of the Mathbaria, Bangladesh, System
Physical capital
Piped water
Drainage Roads
Bridges
Cyclone Shelters
Economic activity
Flood protection
Water Quality Well-Being:
• Household income
• Employment• Health quality
Municipal Services
Social capital
Financial Capital
Human capital
SOURCE: Authors’ analysis.
Capital Stocks
There are four main sets of capital stocks relevant to the Mathbaria investments, although these can be broken out into eight specific disaggregated stocks (represented by the blue rect-angles in Figure 4.15). These stocks are used to produce a set of goods and services that ulti-mately lead to improved well-being.
Physical capital includes changes to piped water, bridges, drainage, roads, and cyclone shel-ters. This suite of infrastructure improvements provides both private and public benefits. Pri-vate benefits come through investments in water and sewage systems that improve household access to upgraded services. Shared public benefits come from publicly accessible roads and cyclone shelters.
The intervention targets human capital, both at the household and municipal level. This com-ponent aims to strengthen capacities for individual and community decisionmaking, including by engaging households in community decisionmaking.
The ADB project targets social capital by fostering community interaction and networks, espe-cially around the physical capital investments.

132
Finally, the ADB project aims to generate additional financial capital both directly through investment and indirectly through longer-run changes to physical capital stocks. Although we do not show it in Figure 4.15, potential changes to physical capital could come from increased financial capital, especially at the municipal level.
Goods and Services
ADB’s Bangladesh investments are broadly oriented around climate adaptation, including disaster risk mitigation, and the Mathbaria investments produce a set of complementary goods and services in line with these goals (represented as red ovals in Figure 4.15). The investments in water and drainage systems combine to achieve improvements in water quality. Upgraded infrastructure is designed to be more robust in future flooding, which supports general flood protection and also provides co-benefits to households.
The remaining physical capital investment along with financial capital improvements support increased flood protection, either by directly mitigating flood risk (e.g., cyclone shelters) or by avoiding damage and supporting flood response (e.g., roads and bridges).
We include economic activity as a good or service that flows from enhancements to all capi-tal stocks. Economic activity is a broad term for improved services such as access to markets, increased productivity, and enhanced trade. Improvements to economic activity come through direct changes in physical stocks, such as roads, and through indirect mechanisms, like a more integrated, capable workforce with greater access to financial resources.
Finally, ADB is targeting improvements to services produced by the city of Mathbaria, which we capture through municipal services. Enhanced municipal services arise directly through improved infrastructure systems, changes in human capital within the municipal government, and better-functioning social systems, including decisionmaking.
Well-Being
We represent improvement to well-being in this system through three measures that flow out of changes to goods and services: household income, employment, and health quality. Income is a measurable proxy for household utility, capturing changes in earnings that drive other aspects of welfare. At the household level, employment will be correlated with income, but at a community level it is a broad measure of economic well-being that may be easier to measure than changes in income. Finally, health quality, while also correlated with employment and income, captures distinct concepts like mortality, morbidity, and disease incidence that flow directly from the Mathbaria investments and are important to capture separately. Given the overlap between these measures, double counting is a risk and should be addressed concur-rently with empirical measurement efforts.
Allocation Mechanism
Given the broad-based Mathbaria investments, these interventions could have a range of effects on allocation mechanisms. At a household level, individuals and households make deci-sions about investments in income-generating activities and other livelihood choices based on available resources and the public goods to which they have access, including transportation infrastructure. The ADB investments could shift household choices about work or investments

133
(e.g., buying a vehicle) to support their employment choices. ADB’s investments in private and public infrastructure that reduces risk—whether from cyclones or health impacts—could free up private capital at the household level for alternative investments.
The community-level infrastructure investments may allow the municipality to reallocate resources or reduce long-term operations and maintenance costs associated with disasters. The accompanying investments in human and social capital could improve municipal decision-making, leading to changes in resource allocation or resource efficiency.
Intervention and the System
The ADB investments could have potentially significant effects on the system, although by targeting a large system those effects will necessarily be harder to achieve at scale. The mul-tiple intervention mechanisms target both household and community-level capital and their associated goods and services. As designed, the portfolio of investments should be complemen-tary, and improvements in infrastructure, human capital, and social capital combined with improved decisionmaking and management systems could lead to large-scale changes in the system’s goods and services output. This could improve well-being, especially in households that benefit not only from economy-wide investments but also from targeted investments at the household level.
Aspects of the Resilience Dividend
ADB’s investments, which are focused on climate adaptation, include components that explic-itly target disaster risk reduction and mitigation and components that produce co-benefits that are part of a resilience dividend. The components can be divided into three broad catego-ries. The first set is investments that target disaster risk reduction and are unlikely to produce co-benefits, such as community cyclone shelters. The second set is investments designed to produce broad-based development benefits that may also contribute to community resilience, such as economic infrastructure development and municipal capacity building. The third set includes those that have clear economic development and resilience benefits, such as improved road, water, and sanitation systems. The second and third investment categories are those that could contribute to a resilience dividend.
Defining the BAU path and measuring the dividend against it will be critical if we are to value the dividend accurately. For example, if no road improvements is the BAU path used to com-pare the benefits of elevating roads, then the ADB Mathbaria intervention will likely generate a positive resilience dividend. In addition to being less susceptible to future storms, elevated roads could reduce congestion and support economic growth. If, however, the proper counter-factual is roads that are improved but not elevated, then the resilience dividend will be less and could be zero. A non-elevated road would provide the same congestion and economic benefits as an elevated road—and at lower cost up front—even though it would not perform as well as an elevated road in a future storm.
134
Empirical Methods
We divide this section and the subsequent data section into two parts: 1) the approach to cata-loging the estimated resilience dividend using program planning data, and 2) a summary of how the resilience dividend could be measured using data that will be and could be collected for Mathbaria. These two approaches reflect the ex ante and ex post approaches, respectively, to calculating the resilience dividend.
Both approaches present challenges to identifying a valid BAU case against which to judge ADB-supported investments. For the pre-project approach, we follow ADB’s analysis and con-sider two relevant BAUs: one that has no investment and a second that has investment but without components that support climate resilience.
Pre-Project Estimate Approach
ADB has conducted an extensive economic analysis of its Bangladesh project to support spe-cific investment decisions, and we use this analysis to support a pre-project approach to esti-mating a partial resilience dividend. We classify this as partial for two reasons: 1) at the time of this writing, ADB had only conducted estimates for physical infrastructure investments, and 2) the ADB estimates do not capture all aspects of the system—capital stocks, good and services, and well-being measures—that constitute the dividend. In addition, disaggregated data are not available, which limits our ability to calculate numerical estimates of the resilience dividend.
Our approach using ADB-generated rate of return estimates is straightforward: we would categorize estimated net benefits according to the resilience dividend components for the Mathbaria case. Where feasible, we associate those estimates with the mapped goods and services and the relevant value components: co-benefits, absorptive capacity, and post-disaster recovery.
An ideal pre-project estimate of the resilience dividend would also capture the co-benefits that accrue from changes in non-physical capital, such as social or human capital. These types of calculations are harder, but the approach would be to augment ADB’s physical infrastruc-ture calculations with estimates based on the expected changes in outputs and then, where feasible, apply values to those estimates to arrive at monetary estimates that contribute to the resilience dividend.
For example, consider improvements in gender-inclusive decisionmaking, which involves changes to human and social capital. Based on the mapping in Figure 4.15, we expect improved decisionmaking to affect economic activity and municipal services. Specifically, we might think that gender-inclusive decisionmaking would improve long-term employment and income opportunities for woman and lead to better quality public investment decisions and high net benefits from public investment.92
92 Gender-inclusive decisionmaking may be a desirable end in itself. This suggests predicting changes in gender participa-tion directly, and those changes—relative to counterfactual decisionmaking processes—could be part of a resilience dividend. This type of approach is consistent with our framework, but 1) valuing outputs rather than outcomes should be carefully justified, and 2) the estimated effects of a resilience project should still be carefully compared against valid counterfactual scenarios.
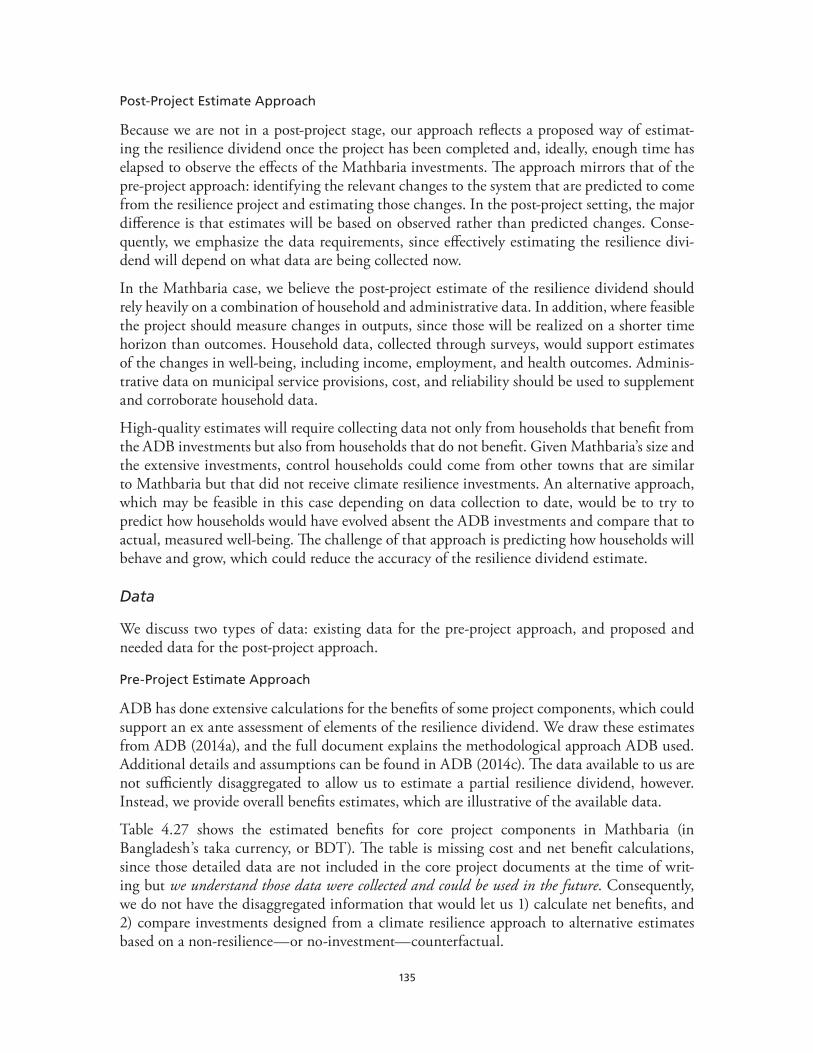
135
Post-Project Estimate Approach
Because we are not in a post-project stage, our approach reflects a proposed way of estimat-ing the resilience dividend once the project has been completed and, ideally, enough time has elapsed to observe the effects of the Mathbaria investments. The approach mirrors that of the pre-project approach: identifying the relevant changes to the system that are predicted to come from the resilience project and estimating those changes. In the post-project setting, the major difference is that estimates will be based on observed rather than predicted changes. Conse-quently, we emphasize the data requirements, since effectively estimating the resilience divi-dend will depend on what data are being collected now.
In the Mathbaria case, we believe the post-project estimate of the resilience dividend should rely heavily on a combination of household and administrative data. In addition, where feasible the project should measure changes in outputs, since those will be realized on a shorter time horizon than outcomes. Household data, collected through surveys, would support estimates of the changes in well-being, including income, employment, and health outcomes. Adminis-trative data on municipal service provisions, cost, and reliability should be used to supplement and corroborate household data.
High-quality estimates will require collecting data not only from households that benefit from the ADB investments but also from households that do not benefit. Given Mathbaria’s size and the extensive investments, control households could come from other towns that are similar to Mathbaria but that did not receive climate resilience investments. An alternative approach, which may be feasible in this case depending on data collection to date, would be to try to predict how households would have evolved absent the ADB investments and compare that to actual, measured well-being. The challenge of that approach is predicting how households will behave and grow, which could reduce the accuracy of the resilience dividend estimate.
Data
We discuss two types of data: existing data for the pre-project approach, and proposed and needed data for the post-project approach.
Pre-Project Estimate Approach
ADB has done extensive calculations for the benefits of some project components, which could support an ex ante assessment of elements of the resilience dividend. We draw these estimates from ADB (2014a), and the full document explains the methodological approach ADB used. Additional details and assumptions can be found in ADB (2014c). The data available to us are not sufficiently disaggregated to allow us to estimate a partial resilience dividend, however. Instead, we provide overall benefits estimates, which are illustrative of the available data.
Table 4.27 shows the estimated benefits for core project components in Mathbaria (in Bangladesh’s taka currency, or BDT). The table is missing cost and net benefit calculations, since those detailed data are not included in the core project documents at the time of writ-ing but we understand those data were collected and could be used in the future. Consequently, we do not have the disaggregated information that would let us 1) calculate net benefits, and 2) compare investments designed from a climate resilience approach to alternative estimates based on a non-resilience—or no-investment—counterfactual.

136
Table 4.27. Summary of Mathbaria Investment Benefits
Present value of benefits with climate-resilient investment (million BDT)
Present value of benefits without climate-resilient investment (million BDT)
Cost (million BDT)
Net benefit (million BDT)
Piped water 343.9 TBD TBD TBD
Drainage 342.6 TBD TBD TBD
Sanitation 78.8 TBD TBD TBD
Roads 181.1 TBD TBD TBD
Bridges 41.2 TBD TBD TBD
Cyclone shelters 69.9 TBD TBD TBD
Total 1,057.5
NOTES: Benefits estimates from ADB 2014(a) and component summaries from ADB 2014(b). TBD indicates that these estimates are to be determined given existing data that the RAND team did not have access to at the time of writing.
Piper water benefits are based on avoided market and non-market costs of alternative water acquisition by households.
Drainage benefits are based on avoided structure, health, and agricultural losses from improved flood impacts.
Sanitation projects provide benefits through increased income and reduced medical costs from avoided illness and associated loss of work.
Road benefits are based on decreased vehicle maintenance and reduced commuting time (increased income), along with reduced future flood damage.
Bridges benefits are based on decreased vehicle maintenance and reduced commuting time (increased income), along with reduced future flood damage.
Cyclone shelters provide benefits in the form of increased income and reduced medical costs from avoided illness.
SOURCE: ADB 2014a.
To estimate the partial resilience dividend, we need net present benefit estimates for each project and the three scenarios, from climate-resilient investment to no investment. We would further break down estimates by project component into benefits that accrue in the event of a shock and co-benefits that are expected to accrue to households and municipalities indepen-dent of the shock. The estimate would be the sum of these components, though the estimate would be partial because we lack complete data on the benefits from all forms of capital.
Post-project Estimate Approach
To calculate a complete resilience dividend for the Mathbaria ADB investments, we would need data on a range of outcomes and outputs. Outcomes (e.g., economic benefits and avoided losses) are the most important to collect. However, because some outcomes will be difficult to measure accurately and some won’t be realized until a shock occurs, collecting data on outputs (e.g., people trained, share of female participation in decisionmaking) is also important.
Table 4.28 provides a concise list of the outputs and outcomes that should be measured for each type of capital and the goods/services affected by the ADB investments. The table is meant to be complete—it provides core metrics for each capital or good/service—but it is not meant to be comprehensive. For example, given the project’s gender equity theme, many of these metrics will need to be captured and broken down by sex, and we have not indicated that level of detail here. The point this table makes is that to calculate the resilience dividend, data col-lection needs to cover the relevant dividend components through a complete set of metrics.
137
Table 4.28. Outputs and Outcomes to Measure to Calculate Post-Project Resilience Dividend
Type of capital or good/service Outputs to measure Outcomes to measure
Physical capital Infrastructure built Avoided damageAvoided mortality/morbidity
Human capital Residents trained Municipal workers trained
Worker productivity
Social capital Female participation in decisionmaking processes
Satisfaction with decisionmaking processesViews of the role of women in society and decisionmaking
Financial capital Changes in municipal financial systems
Municipal finances
Water quality Households with piped water (connections)
Avoided mortality/morbidity
Flood protection N/A Avoided mortality/morbidity
Economic activity CongestionTypes of jobs held
Travel timeEmploymentHousehold income
Municipal services Service connectionsService disruptions
Costs of acquiring servicesCosts of services
SOURCE: Authors’ Interpretation.
Conclusions and Lessons Learned
The ADB investments in Mathbaria, Bangladesh, provide a good example of a resilience proj-ect where it is feasible to estimate at least a partial resilience dividend using the pre-project approach. We do not currently have the necessary data to calculate the partial resilience divi-dend, but we outlined the components and the process. Using a pre-project approach and existing data and analysis from ADB, the resilience dividend will be partial because it would not include complete estimates for changes in social and human capital, which are expected to improve gender inclusivity, improve municipal decisionmaking and services, and expand economic activity.
The Mathbaria case also provides a good setting for a post-project analysis, although the quality of a post-project resilience dividend estimate will depend on data collection plans and timing. The ADB project has collected baseline data, and if baseline data cover relevant outputs and outcomes and can be used to identify an effective counterfactual, then the baseline data can support high-quality analysis in the future. Whether a post-project resilience dividend project can be estimated will also depend on future data collection plans, both at the completion of the project and at later intervals, as the long-term effects of the resilience project begin to manifest. One challenge will be that some effects may take many years to emerge, which will make them harder to measure and delay calculating the resilience dividend. For this reason we recommend collecting careful data on outputs. Output data should not be over-interpreted, but they can help indicate whether the project is having the intended effects and whether there is initial evi-dence that supports future changes in well-being.
We highlight the following lessons learned from the Mathbaria case.
138
High-quality pre-project economic estimate can form the basis of estimating a resilience dividend. These estimates need to be done not only for the resilience project but also for the relevant BAU cases, whether they are for alternative investment or no investment.
Non-physical capital is difficult to incorporate. Economic analysis of infrastructure projects is unlikely to address changes in human or social capital that may flow from complementary investment, like training, or from the way an infrastructure project is implemented, like gen-der-inclusive decisionmaking. Estimating how changes in non-physical capital will affect well-being is challenging but important if the goal is to calculate a full resilience dividend.
Large-scale investments are challenging to analyze. The Mathbaria investments are large and broadly targeted. This may enhance project success, but it makes estimating the resilience dividend in a post-project setting more challenging because finding a valid counterfactual is harder. Options include estimating the development path for households in Mathbaria with-out the ADB investment or using a comparable town as a counterfactual. From an analytical perspective, these types of large-scale investments are also problematic because it is difficult to conduct high-quality statistical analysis at a municipal level.

139
CHAPTER 5
The Resilience Dividend Valuation Model: Lessons Learned and Next Steps
This chapter highlights some of the key lessons learned from RDVM development and the initial case studies presented in Chapter 4. RAND attempted to apply the model to six case studies (with diverse project archetypes that took place in Bangladesh, Nepal, Pakistan, Viet-nam, and the United States) jointly selected with the Rockefeller Foundation and our project advisory board, using publicly available data and information about each case. Readers inter-ested in case details may refer to the analyses of each case provided in Chapter 4.
To compile these lessons, RAND researchers categorized each of the individual case study recommendations into general topic areas (quantifying the dividend, the role of behavior, data and evidence, and model limitations), aggregated where possible, and augmented the list with additional insights generated over the course of the project.
Lessons Learned about Quantifying the Dividend
In this section, we discuss several of the key themes that emerged over the course of the project about quantification of the resilience dividend.
The BAU scenario used as a counterfactual is critically important when quantifying the resilience dividend. This is because the definition of the resilience dividend involves compar-ing the same system under two different realities, only one of which is actually observable. This fundamental issue of causal analysis is well-known in statistical applications and applies equally as well when estimating resilience dividend elements. There are a number of differ-ent BAU scenarios that can be used. For instance, with the forest bond project, the BAU case could have been either “do nothing” or the opposite extreme of clear cutting the entire forest. In fact, any alternative forest management strategy could be used as a BAU depending on the circumstances of a particular project in a particular location. Care needs to be taken to choose the appropriate counterfactual so that the resilience dividend truly reflects what benefits would have accrued in the absence of a resilience project.
A positive resilience dividend does not necessarily imply positive net benefits for all stakeholders. While the social welfare representation of well-being in the RDVM provides a means of aggregating benefits and costs across all stakeholders, distributional effects may also be important. For example, in Diamond Valley, results showed that despite an overall positive resilience dividend for each of the four cases examined, there were both “winners” and “losers” in terms of profitability, with senior rightholders bearing many of the costs of change in some cases. That is, an overall social net benefit, when aggregated, does not necessarily imply that everyone wins. Importantly, knowing who the winners and losers are, especially in an ex ante case, may provide a way to expand the project to consider these losses in a system sense.

140
Timing of an intervention can affect the quantitative and qualitative magnitude of the resilience dividend. Just as there might be different qualitative impacts on differing stake-holders within a system (i.e., winners and losers as noted above), when benefits and costs accrue from an intervention may also play a role. For example, in some Diamond Valley scenarios, the long-run (30-year) state of the system, was identical under both the project and BAU paths. A positive resilience dividend related to agricultural profitability was possible, however, because the project scenario gradually curtailed water rights over the 30-year horizon, while the BAU scenario suddenly curtailed junior water rights at year ten. Despite identical long-run outcomes, profitability was higher under the project scenario, implying a positive resilience dividend.
A positive resilience dividend during a single disaster does not necessarily imply the same for all potential disasters. Similarly, finding no resilience dividend in a specific disaster does not necessarily imply the same for all potential disasters. For example, in the cases of Nepal and Pakistan, both analyses involved single, observed floods and found no conclusive evidence of a benefit in absorptive capacity. This does not infer that no benefits will be found during future floods; it means that having only observations about a single shock, we can only assess the ability of the system to absorb that magnitude. In Nepal’s case, the lack of a benefit may be because the shock was larger than what had been planned for and the investment in protection was too small compared to the shock that was observed. Protection measures are typically designed for either an entire distribution or geared toward a particular threshold, making ex ante analysis valuable. There can also be empirical difficulties associated with a lack of geo-physical information about the shock when project and control communities are differentially affected.
Given an appropriate logic model and a set of data, there may be multiple ways to provide evidence of a resilience dividend. Given a clear, causal representation of the capital stocks, production functions and allocation mechanisms, and flows of goods and services of a system using the inclusive wealth theory, there are several potential ways to provide evidence of a resilience dividend, each of which uses a different mix of empirical evidence and assumptions. Here, we focus on backward-looking cases for completed projects.
First, it is ideal to directly value changes in the flows of goods and services as given by the social welfare function. In some cases, this is relatively easy; for example, in Nepal and Pakistan, Oxfam surveyed families about changes in total income for project and control communities, which is a direct welfare measure that can be used if the quasi-experiment is properly executed. In Diamond Valley, the quantifiable portion of the resilience dividend was agricultural income for irrigated producers, which is relevant given that the intervention was a change in the struc-ture of groundwater rights. We also argued that “community stability” may directly enter into some stakeholders’ social welfare functions and suggested that this public-good-type benefit might be valued using stated preference methods.
Data limitations may preclude this type of exercise, however. If this is the case, a combination of data and assumptions might be used to provide evidence for or against the existence of a resil-ience dividend, though the quantification of it may not be possible. For example, the inclusive wealth theory assumes that a combination of capital stocks generate goods and services, so that changes in quantities or qualities of stocks, or changes in the access to them, might reason-ably be assumed to change the flow of goods and services. We may have data about the capital stocks but not the relationships or production of goods and services that flow from them. For

141
example, in Nepal and Pakistan, data were available to calculate changes in asset ownership, which is assumed to be positively correlated with welfare.
Institutional and informational changes, as well as changes in the level or quality of social capital, can also induce behavioral changes as a result of a resilience project. Enabling behavior to shift to something new—perhaps relaxing a constraint or introducing new opportunities—can be an indicator of changes in resilience capacities, and is also directly linked to the pro-duction or consumption of goods and services. In Nepal and Pakistan, we had some evidence that the interventions caused a change in cropping patterns, which suggests the existence of a dividend but not the quantification.
The resilience dividend can involve changes in both private and public goods and ser-vices. Across the cases we investigated, the resilience dividend involved net benefits stem-ming from changes in the provision of both private and public goods. In economics, private goods are described as being rival in consumption (meaning that consuming the good leaves it unavailable for others) and excludable (property rights allow a user to exclude others). Exam-ples in our cases are crops grown to generate income (Diamond Valley, Nepal, and Pakistan), increased housing quality to provide better living conditions (Da Nang), and increased water runoff for water rightholders (Forest Bond).
Public goods, on the other hand, are non-excludable and non-rival in consumption, meaning they generally will accrue to entire communities. Examples include protective infrastructure that serves an entire community (as in Nepal), the benefits enjoyed from a sense of “community stability” (Diamond Valley), grain banks to provide storage (Pakistan), increased fire protec-tion (Forest Bond), and the ability of a house to function as a community shelter (Da Nang).
It should also be noted that changes in the provisions of private and public goods can directly stem from changes in behavior due to changes in the overall allocation mechanism. It is to these lessons we now turn.
Lessons Learned about the Role of Behavior
In this section, we discuss a few of the lessons learned about the role of behavior (as represented by the allocation mechanism in the inclusive wealth theory) in driving the resilience dividend. Many of the characteristics of resilient systems are related to behavior (see Appendix A).
Changes in the flows of private goods and services to stakeholders depend on the actions of key players. Consumption and production of private goods and services are conscious activities by individuals and firms. Often, the public provision of capital investment or knowl-edge alters these activities. As such, virtually all resilience dividend benefits that involve public goods are explicitly related to the decisions that these individuals and firms make. These deci-sions must be modeled in both the project and BAU cases in order to properly estimate the resilience dividend.
For example, in Nepal and Pakistan, the interventions provided information about reacting to potential imminent flooding and taking protective actions to reduce damage. This informa-tion likely changed people’s behavior by encouraging them to take private mitigation actions, but not all households in the interventions will take action. In the case of these households, the resilience dividend associated with this sort of information provision may be zero, even

142
though the household was exposed to the intervention. The spatial nature of interventions may also impact some households more than others; for example, providing flooding infrastructure affects different households differently simply due to space. This may encourage or discourage the actions of individuals and firms through the provision of a public good.
Absorptive, adaptive, and transformative capacities can be measured by observing substitution patterns between goods or services. Resilience interventions can directly pro-vide capital stocks to increase absorptive capacity, such as barriers to decrease flooding (see, e.g., the Nepal case). However, several of the interventions we studied (e.g., Nepal and Paki-stan) took advantage of additional opportunities provided by the project to train individuals to act in a different way or to build institutional structures that directly fed into their substituting one behavior for another. Examples include introducing alternative crops, taking private miti-gating actions to protect a household’s own property, training households in search-and-rescue techniques, and establishing an early warning system for flooding.
In each of these cases, the intervention enabled behaviors that were different than BAU.1 In other words, there is evidence that the actions of individuals in dealing with the stochas-tic shock had changed, as compared to a control group. Presumably, then, the intervention changed some underlying capacity in dealing with the event. When faced with future events, it seems natural to view the intervention as changing at least absorptive and adaptive capaci-ties—the former from behavior in dealing with the immediate risks from flooding and the latter from taking actions following the flood to enable recovery.
If there were network effects or other types of causal links between behaviors, one could easily imagine a case in which a community could be transformed at some level. For example, the Oxfam–Pakistan intervention attempted to change how households behave in the long run. Since we only had access to a single growing season’s worth of data, we could not test if longer-term changes to, say, income occurred as a result of the project, nor be sure if households’ new-found information was fully integrated into any behavioral changes. Nevertheless, it is possible that the effects may grow or be more widely distributed across a community or region over time. Additional data over the longer term could help shed light on this process, but the ability to determine a casual effect from the intervention versus other interventions or circumstances is complicated the further removed one is from project completion.
Regardless of data limitations, the key point is that absorptive, adaptive, and transformative capacities are generally described by the ability of firms and individuals to take behavioral action before, during, and after a shock or in response to a stressor. In the RDVM, this is captured by the allocation mechanism that describes the behavioral response of agents within the system to changes in the capital stocks, and to the formal and informal institutional rules, constraints, and norms (including, but not limited to, budgets, access to resources, and information) that govern behavior. As a result of an interaction that changes this mechanism, actions taken by agents then alter the flows of goods and services, serving to change the overall welfare path with the project relative to the BAU case. This naturally affects the resilience dividend as defined.
1 While we found evidence that the early warning system was effective for information provision and that many households in project communities in Nepal warned their neighbors more than in the control group, we were unable to find significant changes in damages, likely due to heterogeneity in the impact of the flood across project and BAU communities.

143
Calculation of the resilience dividend may be highly dependent on assumptions made about adaptive and transformative capacities of individuals and firms. Above, we already discussed the role of the counterfactual, BAU path in quantifying the resilience dividend. Here, we highlight that in cases where an institutional change is the primary intervention to deal with a shock or stressor, predicting behavior with and without the intervention is the key to the analysis. It is this behavior, and the aggregate patterns of system development that result, that ultimately drive the resilience dividend.
This behavior is in large part reflective of the adaptive and (in the long run) transformative capacities of individuals and firms in the system. Particularly important in this regard are the abilities of firms and individuals to substitute one good or service for another (and at what cost), subject to the institutional rules of the system and the available capital stocks.
In the Diamond Valley case, the analysis made some very strict assumptions about the adaptive capacity of agricultural producers in the system. In particular, the analysis from the hydro-economic model assumed that groundwater was necessary to produce the two crops grown in the region, that these crops would be fully irrigated when possible, and that water restrictions would result in less cultivated acreage. Agricultural producers had choices of 1) buying or sell-ing water rights; 2) extending the depth of their wells based on the state of the groundwater capital stock; and 3) ceasing production entirely. The hydro-economic model captured this behavior using standard economic assumptions about rational economic behavior at the micro-economic level.
However, if the model failed to capture some relevant aspects of substitution within the system (e.g., limited irrigation possibilities associated with alfalfa, alternative employment or entrepre-neurship opportunities in the region, etc.), then the estimate of the resilience dividend is likely misstated. While this is a feature of structural modeling more broadly, it is a critically impor-tant aspect of modeling resilience outcomes when interventions involve information provi-sions, changes in institutions that govern access to capital stocks or production possibilities, or other similar changes. We recommend that practitioners recognize and attempt to understand the likely behavioral modifications that any resilience project might be reasonably expected to induce, and how those changes map to changes in the goods and services that are ultimately consumed by stakeholders.
Lessons Learned about Data and Evidence
Resilience is a dynamic concept, and as such, requires repeated measurements over time to quantify the resilience dividend accurately. Ideally, analysts would be able to estimate both the treatment and the control path at any point following the implementation of a resil-ience project, but this requires a large amount of data that is likely not feasible in many cases. Indeed, for any large-scale project with implications that stretch into the future, a full set of data stretching into the infinite future cannot be compiled.
Part of the problem with using post-project, post-shock data at only one point in time is that we are not fully able to capture the dynamic nature of change. For example, in the Nepal case, we have strong evidence of behavioral change for both the agricultural practices and response to the early warning system, but truly understanding how that plays out in the long run is difficult to tackle with short-run data. Similarly, there may be transformative changes in

144
production stemming from changed agricultural practices, project-induced trust in leadership, or other changes that we are not able to capture given the limited time horizon following both the intervention and the shock.
For resilience projects dealing with shocks, ideal ex post data structures should include data for at least four points in time: prior to the intervention, after the intervention and before a shock, after a shock, and at some later time period when the intervention had been fully realized post-shock. This data would need to be collected for both project and BAU stakeholders if a casual inference approach was to be used, or simulated in the case of a forward-looking project that has not yet been implemented.
These four time periods are important because they allow us to isolate the effects of the inter-vention from the shock and to identify the impact of the intervention on the different resilience capacities and types of benefits. For example, data collected prior to the intervention allows the analyst to control for differences in the initial stages of the project and the BAU group, which is important in order to avoid confounding those differences with the impact of the intervention. Data collected after an intervention and before a shock can provide evidence of the existence of co-benefits unrelated to the shock (though as mentioned above, there is no guarantee that the co-benefits would be fully realized at the time of measurement). Data collected immediately after the shock can provide evidence of a change in absorptive capacity in the system, either through changes in capital or changes in behavior. Finally, information about the path of recovery post-shock for both the project and BAU cases can help shed light on the capacity to recover, and in some cases, transform system elements.
When designing a data collection mechanism, practitioners may wish to collect data on prioritized capital stocks, goods and services, and behaviors related to their conceptual-ization of the system. In a world of scarce resources, practitioners are unlikely to have access to all the data they would desire in order to estimate the resilience dividend. The RDVM, however, can be used to prioritize data collection efforts related to the capital stocks, goods and services, and behaviors that are likely to be affected by an intervention. Indeed, the joint development of a conceptual inclusive wealth model of the system and the development of an evaluation and data collection mechanism are important when the goal is to estimate the resil-ience dividend of an investment in a quantitative manner.
A single resilience intervention may be associated with multiple activities and objectives that affect a large number of stakeholder groups. For quantification purposes, inclusive wealth models should be as simple as possible while still representing the salient elements of the system expected to be directly affected by interventions, and the models should pay particular atten-tion to how stakeholders may behave with a resilience project as opposed to without one. Issues of quantification and measurement should be addressed early in the development of an empiri-cal strategy, and care should be taken to identify the public and private goods and services, capital stocks, and behavioral changes that are anticipated as a result of the project.
In some cases, aggregation of various components of the resilience dividend into broad categories of goods and services may be an effective empirical strategy. As noted through-out this document, changes in the flows of valuable goods and services are the “physical” quan-tities that can, in theory, be monetized to estimate a resilience dividend. Ideally, evidence about changes in these flows could be collected or simulated when estimating the dividend.

145
However, in some cases with limited data, this may not be possible. One alternative might be to use information about particular choices and behaviors to infer that a particular hard-to-define concept is valued by stakeholders. For example, in Diamond Valley, we inferred that the Nevada State Engineer’s decision to designate the area as a critical management area (acting as an agent of the public), in conjunction with water planning documents that suggested an emphasis on community stability and vitality, was evidence of at least some sort of public good benefit perceived by (at least some) area stakeholders. While we were unable to quantify the value of this public good, we suggested that if any stakeholder was willing to give up something of value (like, say, profits from irrigation) in order to keep a greater number of farmers in pro-duction, then that provides evidence of a partial resilience dividend.
Costs as a result of the project should not be ignored in calculating the resilience divi-dend. The resilience dividend measures the net benefits that accrue over time as a result of a resilience project. As such, any costs—either financial or due to a decline in the value of flows of specific goods and services—should be included in the calculation. Care should be taken to include only those costs that accrue to the system under consideration, and not include costs that originate from outside of it.
Review of already available and implemented household needs assessments can inform post-intervention data collection design. Practitioners can conduct a mapping exercise using pre-intervention needs assessments and available data to identify things that point to resilience aspects within the conceptual model that can be used to inform post-intervention data collec-tion design and considerations for future projects with the same intervention population. This exercise highlights the importance of post-intervention data which is needed to inform and value a resilience dividend.
Lessons Learned about Model Limitations
In this section, we discuss a few of the lessons learned about the limitations of the RDVM.
The model may be complex even for simple systems. The RDVM explicitly maps factors of production to goods and services to the welfare of stakeholders filtered through a behavioral context, using principles of economic theory. All of these elements are necessary to create a consistent model of a system. However, the relationships between these model elements are complex and, in some cases, not well understood. Examples include how changes in institu-tions will ultimately change human behavior, and the role of social capital in promoting overall welfare development. For larger systems with greater numbers of subsystems, actors, and linkages (such as cities) and projects with multiple objectives, the complexity can exponentially increase.
This problem is not unique to the RDVM and is endemic in the program evaluation literature. We believe, however, that the benefits of a specific, theoretically consistent representation of a system and potential interventions can provide valuable insights not only about the value of the resilience dividend, but also about developing testable hypotheses about uncertainties in key relationships of system elements and the data required to test these hypotheses. Furthermore, as with all models, real-world system complexity forces model developers and users to focus on fundamental system elements and causal relationships. This is important to avoid drawing incorrect conclusions and ensuring they are focusing on real, measurable relationships.

146
The data needed to quantify the resilience dividend are extensive. As documented above, backward-looking estimation of the complete theoretical resilience dividend would require an almost infinite amount of data about every potentially affected relationship at virtually every point post-project, as well as considerable information on all possible risks and stochastic events after project completion. Clearly, this is not feasible for most evaluations and suggests another reason for focusing on key causal relationships within the system.
Even an incomplete evaluation of the dividend can be quite data intensive given the dynamic nature of disaster risk and recovery and other processes within systems. Co-benefits, which are often non-market in nature, provide additional data challenges due to a lack of observ-able prices, and estimating behavioral changes in response to institutional and social relations change can be especially challenging. Differences in preferences and overall uncertainty exac-erbate the difficulty. Finally, the use of causal inference methods for evaluation and simulation models for forward-looking projects requires highly skilled modelers. There are no good solu-tions to this issue in a world of scarce resources, but keeping the representation of the system as simple as possible, quantifying where one can, and using qualitative arguments when estima-tion is not possible are likely best practices.
Some stakeholders may be uncomfortable with the underlying assumptions of the model. With roots in macroeconomic growth models and bioeconomics, the inclusive wealth founda-tion of the RDVM relies heavily on theories of value that predominate modern economics. In particular, we assume that something (i.e., a good, service, policy, or action) is valuable if and only if an individual would be willing to give something up in order to get it. This notion, and the representation of it in the social welfare function, may be unfamiliar to many practitioners, especially in the context of non-market goods and services (such as those related to the envi-ronment). Furthermore, the internal valuation of capital stocks being derived from the flows of value from the goods and services it supports, while well-known in the economics field, may not be as well known outside of it. Finally, a focus on quantification might lead to a focus on measurable components of the dividend, while some practitioners may believe that those ele-ments that are less easily quantified are actually the most valuable. Efforts toward testing this hypothesis are a promising area for future research.
Conclusions and Further Research
The RDVM is a capital-theoretic, dynamic conceptualization of a system that can be used in conjunction with causal inference and simulation modeling across a wide variety of circum-stances to quantitatively and qualitatively estimate and describe the resilience dividend. It combines elements of project evaluation with economic valuation to estimate the net benefits of implementing projects designed with resilience outcomes in mind versus a BAU counter-factual. Project interventions directly or indirectly affect capital stocks, production technolo-gies, or the institutions and norms that govern consumer and producer behavior. The model is designed to compel researchers and practitioners to engage in a process of “thinking through the tortuous pathways along which a successful [project] has to travel.”2
2 Pawson, R. (2003). “Nothing as practical as a good theory.” Evaluation, 9(4), 488.

147
The value added of the model comes from this clear and transparent conceptualization of the causal linkages between system elements (including behavior), and the guidance it provides for empirical estimation of the resilience dividend and for qualitative discussion of elements that cannot be quantified. The model itself is consistent with many of the other resilience frame-works that have been described in the literature and the practitioner community, as well as with economic theory.
Over the course of the six-month project in which the model was developed, RAND applied the model to various cases in Bangladesh, Nepal, Pakistan, Vietnam, and the United States using pre-existing data, project designs, and models not necessarily designed for use with the RDVM. Through the course of this exercise, we learned a number of lessons about the use of the model over a variety of archetypes, the data structures that can best suit quantification of the dividend, the importance of behavior in generating a resilience dividend, and the limita-tions of the model. While we believe that the inclusive wealth conceptualization of systems for evaluating resilience projects is a promising way forward, the need to generate and use exten-sive quantities of data in complex ways does provide some barriers to adoption.
Looking forward, there is considerable opportunity for more research into the quantification of the resilience dividend. A key first step stemming directly from one of our lessons learned is to jointly design the data collection mechanism and RDVM for a number of well-funded archetypal cases at the outset of a project or program to begin to build more intuition about the art of the possible in resilience evaluation (and the trade-offs in terms of costs). Building on this work with subsequent cases and projects can help to build a portfolio of evidence about the resilience dividend, as well as the development of best practices in terms of empirical strategies, simulation modeling, and data collection.
Of particular interest is research into understanding and quantifying the behavioral impli-cations of changing institutions, social norms, and social relations (social capital), and how these elements relate individually and together to the resilience dividend. This is no small task and will require multi-disciplinary investigations into any number of cases, as well as creative empirical and data collection strategies.
Cataloguing this information in an easily accessible public manner is also needed. The envi-ronmental and ecosystem service communities have done this with regard to environmental non-market values, providing opportunities for researchers and practitioners to share informa-tion, use a methodological technique known as benefit transfer, and perform meta-analysis over multiple studies to gain insight into differences in values across contexts. Because every system is different, research into this aspect of variation in the resilience dividend could be quite useful to both researchers and practitioners.
The case studies used to this point have focused on specific projects. Moving away from proj-ects and toward portfolio design will allow for better understanding of the complementary and substitutability of different projects. Additionally, knowing the winners and losers of specific projects will allow for the construction of portfolios that can, potentially, make all stakeholders winners with the appropriate choices of projects with portfolios. The budget constraints that arise in portfolio analysis provide additional constraints that this approach is designed to be able to handle.

149
Appendix A. Characteristics of Resilient Systems and the Allocation Mechanism
In documents provided to the RAND research team, the Rockefeller Foundation has defined five characteristics of resilient systems.1 The following reproduces those characteristics and their definitions:
• Aware: knowing your strengths, assets, liabilities and vulnerabilities you have, and what threats and risks you face
• Diverse: having surplus capacity to successfully operate under diverse circumstances, beyond every-day functioning (redundancy)
• Self-Regulating: continue functioning without extreme malfunction, catastrophic collapse, or cascading disruptions (islanding/safe failure)
• Integrated: individuals, groups, and organizations can bring together disparate thoughts and elements into cohesive solutions and actions
• Adaptive: adjusts to changing circumstances with new plans, new actions, or modified behaviors, particularly when it is not possible or wise to go back to the way things were before
We note that in the inclusive wealth framework defined herein, changes in awareness, diversity, integration, and adaptability are directly related to changes in the allocation mechanism, either through changes in individual behavior or changes in the institutional structures that govern that behavior.2
For example, an increase in awareness generally implies that individuals and firms within a system have more accurate information about stocks, probabilities, and/or potential behavioral mechanisms to mitigate against negative shocks or stressors (or, alternatively, the ability to exploit opportunities more efficiently). Presumably, if the value of this information is positive, then overall welfare could be expected to increase with the change in awareness.
Diversity suggests a particular degree of substitutability in the production functions repre-sented by the system, with an increase in diversity resulting in relatively less impact on the human system when faced with a shock or a stressor. This is similar in spirit to the work of
1 Resilience concepts and the resilience dividend, handout from project inception meeting, September 28, 2016, New York City, New York.
2 Self-regulation, on the other hand, appears to be more of an emergent system-level property that depends on all of the productive relationships within the system, including the allocation mechanism. This is not to say, however, that changes in the allocation mechanism or other relationships in the system cannot affect self-regulation; in fact, this is precisely the case.
150
Adam Rose,3 who has suggested that economic resilience at various scales is related to the substitutability between factors of production. Interestingly, this notion is at the center of the strong versus weak sustainability debate.4
Changes in integration can similarly change behaviors and institutions, resulting in either direct or indirect behavioral change. One channel through which these changes might be made is informational (as with awareness), as exposure to differing ideas or strategies may result in private or public actions that are different than that which would have been taken other-wise. Another channel might be through changes in the institutional structure of the system through policy changes that alter the incentives and opportunities of individuals and firms.
Finally, adaptability refers to the ability of individuals and firms to change their behaviors in response to changes in capital stocks, the aforementioned characteristics, or other perceived changes in system elements. This is an important behavioral link, as there is no particular guarantee that, say, the provision of information will necessarily result in changed behavior. In other words, using the language of program evaluation, the provision of outputs does not necessarily lead to changes in outcomes, nor it is certain that the same information provided to heterogeneous agents will results in the adoption of the same behaviors, and thus the outcomes may differ.
From the perspective of the RAND research team, it appears that many of the resilience portfolio projects of the Rockefeller Foundation have, at their core, changes in the allocation mechanism as a primary project output objective, with the hopes that these outputs will trans-late into improved societal outcomes.
3 Rose, A. (1999). “Defining and measuring economic resilience to earthquakes.” Overarching Center-wide Cross Program Research Activities. Buffalo, NY: University of Buffalo NSF Earthquake Engineering Research Center, 41-54.
Rose, A. (2004). “Defining and measuring economic resilience to disasters.” Disaster Prevention and Management: An International Journal, 13(4), 307-314.
4 Dasgupta, P., and Heal, G. (1974). “The optimal depletion of exhaustible resources.” The Review of Economic Studies, 41, 3-28.
Solow, R. M. (1974). “Intergenerational equity and exhaustible resources.” The Review of Economic Studies, 41, 29-45. Hartwick, J. M. (1977). “Intergenerational equity and the investing of rents from exhaustible resources.” The American
Economic Review, 67(5), 972-974.

151
Appendix B. Key Definitions Used in this Report
Table B.1 provides a list of key definitions used throughout this report.
Table B.1. Definitions of Key Terms Used in this Report
Resilience The capacity of a system—a household, a community, an organization, or a coupled natural-human system—to prepare for disruptions from outside of the system, to recover from shocks and stresses, and to adapt and grow from a disruptive experience.
Resilience Project An intervention that, at least in part, targets improved ability to manage, respond to, or recover from a shock or stress outside of a system that (with some probability) might result in a loss of well-being, and that has the potential to produce other benefits not directly related to the shock or stressor
Resilience Lens An approach to project and portfolio development that better accounts for system interdependencies and potential co-benefits, with the ultimate objective of maximizing the overall net social benefits of the associated actions
Resilience Dividend The differential in net benefits between outcomes resulting from a resilience project and a BAU alternative
Partial Resilience Dividend An estimate of the resilience dividend that, due primarily to data limitations, does not include every possible net benefit change
Resilience Dividend Valuation Model (RDVM) A dynamic, systems-based approach to estimating the resilience dividend that maps changes in the flow of goods and services from a resilience project into changes in well-being, and provides guidance on the data needed to estimate the resilience dividend
Social Welfare The overall level of well-being of all stakeholders within a system, usually measured in terms of utility or in monetized units
Co-benefits The additional benefits (costs) associated with a resilience project other than those relating to withstanding or recovery from shocks and stressors. These are similar to “spillover” benefits (costs)
Direct Benefits The benefits (costs) provided by a resilience project and related to withstanding or recovery from shocks and stressors.
Indirect Benefits Synonym for co-benefits
Capital Stocks A system’s capital assets, broadly defined to include natural, human, and social forms of capital in addition to reproducible capital
Goods and Services The tangible and intangible items that are produced within a system
Production Functions A representation of the process of combining assets and goods and services to produce other goods and services
Social Welfare Function A representation of the aggregate social welfare within a system
Allocation Mechanisms Formal representations of behavioral response in the RDVM
Shocks A discrete, probabilistic event exogenous to a system
Stresses A long-term trend in one or more capital stocks within the system (endogenous depreciation)
SOURCE: RAND Authors.


153
References
Adger, W. (2000). Social and ecological resilience: Are they related? Progress in Human Geography, 24, 347-364.
Agampodi, T. C., Agampodi, S. B., Glozier, N., and Siribaddana, S. (2015). “Measurement of social capital in relation to health in low and middle income countries (LMIC): A systematic review.” Social Science & Medicine, 128, 95-104.
Ahmed, R., Seedat, M., van Niekerk, A., and Bulbulia, S. (2004). Discerning community resilience in disadvantaged communities in the context of violence and injury prevention. South African Journal of Psychology, 34, 386-408.
Alexander, D. E. (2013). “Resilience and disaster risk reduction: An etymological journey.” Natural Hazards and Earth System Science, 13(11), 2707-2716.
Anderies, J., Folke, C., Walker, B., and Ostrom, E. (2013). “Aligning key concepts for global change policy: Robustness, resilience, and sustainability.” Ecology and Society, 18(2), 8.
Arrow, K. J., Dasgupta, P., and Mäler, K.-G. (2003). “Evaluating projects and assessing sustainable development in imperfect economies.” Environmental and Resource Economics, 26(4), 647-685.
Arup International Development (2014). City resilience index: Understanding and measuring city resilience. The Rockefeller Foundation, Arup International Development.
Asian Development Bank (2014). “Coastal Towns Environmental Infrastructure Project.” Reports and Recommendations of the President.
Asian Development Bank (2014). Coastal Towns Environmental Infrastructure Project: Economic Analysis. Metro Manila, Philippines, Asian Development Bank.
Asian Development Bank (2014). Coastal Towns Environmental Infrastructure Project: Project Administration Manual. Metro Manila, Philippines, Asian Development Bank.
Asian Development Bank (2014). Coastal Towns Environmental Infrastructure Project: Supplementary Economic Appendix. Metro Manila, Philippines, Asian Development Bank.
Barbier, E. B. (2013). “Wealth accounting, ecological capital and ecosystem services.” Environment and Development Economics, 18(02), 133-161.
Barbier, E. B. (2016). “Sustainability and development.” Annual Review of Resource Economics, 8, 261-280.
Battles, J. J., Bales, R. C., Conklin, M. H., Guo, Q., Gutierrez, R. J., Huntsinger, L., et al (2015), Learning adaptive management of Sierra Nevada forests: An integrated assessment. Sierra Nevada Adaptive Management Project.
Beatley, T. (2012). Planning for coastal resilience: Best practices for calamitous times, Washington, D.C.: Island Press.
154
“Beaufort Wind Scale.” Retrieved July 18, 2017 from http://www.spc.noaa.gov/faq/tornado/beaufort.html
Berke, P., and Smith, G. (2009). “Hazard mitigation, planning, and disaster resiliency: Challenges and Strategic choices for the 21st century.” in U. Fra Paleo (Ed.), Building Safer Communities: Risk Governance, Spatial Planning and Responses to Natural Hazards (pp. 1-20).
Bishop, D. (2014). “Resilience in Nepal: Evaluation of mainstreaming disaster risk reduction and enhancing response capability.” Effectiveness Review Series 2013/14. London: Oxfam GB.
Bodin, P., and Wiman, B. (2004). “Resilience and other stability concepts in ecology: Notes on their origin, validity, and usefulness.” ESS bulletin, 2(2), 33-43.
Bond, C. A. (2010). “On the potential use of adaptive control methods for improving adaptive natural resource management.” Optimal Control Applications and Methods, 31(1), 55-66.
Bond, C. A., and Loomis, J. B. (2009). “Using numerical dynamic programming to compare passive and active learning in the adaptive management of nutrients in shallow lakes.” Canadian Journal of Agricultural Economics/Revue canadienne d’agroeconomie, 57(4), 555-573.
Brown, D., & Kulig, J. (1996/97). The concept of resiliency: Theoretical lessons from community research. Health and Canadian Society, 4, 29–52.
Bruneau, M., Chang, S., Eguchi, R., Lee, G., O’Rourke, T., Reinhorn, A., et al. (2003). “A framework to quantitatively assess and enhance the seismic resilience of communities.” Earthquake Spectra, 19(4), 733–752.
Butler L., Morland L., & Leskin, G. (2007). Psychological resilience in the face of terrorism. In B. Bongar, L. Brown, L. Beutler, J. Breckenridge, & P. Zimbardo (Eds.), Psychology of terrorism (pp. 400–417). NY: Oxford University Press.
California Water Transfer Records (2010). Santa Barbara, CA: Bren School of Environmental Science & Management.
Carpenter, S., and Brock, W. (2008). “Adaptive capacity and traps.” Ecology and Society, 13(2).
Champ, P., Boyle, K. J., and Brown, T. C. (2003). A primer on nonmarket valuation. Dordrecht, The Netherlands: Kluwer Academic Press.
Coles, E., and Buckle, P. (2004). Developing community resilience as a foundation for effective disaster recovery. The Australian Journal of Emergency Management, 19, 6-15.
Cutter, S. L., Barnes, L., Berry, M., Burton, C., Evans, E., Tate, E., et al. (2008). “A place-based model for understanding community resilience to natural disasters.” Global Environmental Change, 18(4), 598-606.
Cutter, S. L., Boruff, B. J., and Shirley, W. L. (2003). “Social vulnerability to environmental hazards.” Social Science Quarterly, 84(2), 242-261.
155
Daniels, J. M., Brinkley, W., and Paruszkiewicz, M. D. (2016). Urban forest restoration cost modeling: A Seattle natural areas case study. Gen. Tech. Rep. PNW-GTR-921. Portland, OR: U.S. Department of Agriculture, Forest Service, Pacific Northwest Research Station.
Dasgupta, P. (2001). “Valuing objects and evaluating policies in imperfect economies.” The Economic Journal, 111(471), 1-29.
Dasgupta, P. (2009). “The welfare economic theory of green national accounts.” Environmental and Resource Economics, 42(1), 3.
Dasgupta, P., and Heal, G. (1974). “The optimal depletion of exhaustible resources.” The review of economic studies, 41, 3-28.
Dasgupta, P., and Mäler, K.-G. (2000). “Net national product, wealth, and social well-being.” Environment and Development Economics, 5(01), 69-93.
Dinda, S. (2008). “Social capital in the creation of human capital and economic growth: A productive consumption approach.” The Journal of Socio-Economics, 37(5), 2020-2033.
Division of Agriculture and Natural Resources (2017). California forests. Retrieved March 30, 2017.
Egeland, B., Carlson, E., and Sroufe, L. (1993). Resilience as process. Development and Psychopathology, 5, 517–528.
Elliot, W. J., Miller, M. E., and Enstice, N. (2016). “Targeting forest management through fire and erosion modelling.” International Journal of Wildland Fire, 25(8), 876-887.
Eureka County (2016, September). Eureka County Water Resources Master Plan. Eureka, NV.
Farrow, S., and Zerbe, R. O. (2013). Principles and standards for benefit-cost analysis, Northhampton, MA: Edward Elgar.
Fitch, R. A., Kim, Y.-S., and Waltz, A. E. M. (2013). “Forest restoration treatments: Their effect on wildland fire suppression costs.” Ecological Restoration Institute white paper.
Francis, R., and Bekera, B. (2014). “A metric and frameworks for resilience analysis of engineered and infrastructure systems.” Reliability Engineering & System Safety, 121, 90-103.
Fuller, R. (2015). Resilience in Pakistan: Evaluation of enhancing food security and resilience of small-scale farmers. London: Oxfam, GB.
Ganor, M., and Ben-Lavy, Y. (2003). Community resilience: Lessons derived from Gilo under fire. Journal of Jewish Communal Service, Winter/Spring, 105-108.
Godschalk, D. R. (2003). “Urban hazard mitigation: Creating resilient cities.” Natural Hazards Review, 4(3), 136-143.
Gordon, J. E. (1978) Structures: Or Why Things Don’t Fall Down, Da Capo Press, Cambridge, Massachusetts.
Haimes, Y. Y. (2009). “On the definition of resilience in systems.” Risk Analysis, 29(4), 498-501.

156
Hartwick, J. M. (1977). “Intergenerational equity and the investing of rents from exhaustible resources.” The American Economic Review, 67(5), 972-974.
Holling, C. S. (1973). “Resilience and stability of ecological systems.” Annual Review of Ecology and Systematics, 1-23.
Irwin, E. G., Gopalakrishnan, S., and Randall, A. (2016). “Welfare, wealth, and sustainability.” Annual Review of Resource Economics, 8, 77-98.
Iyer, S., Kitson, M., and Toh, B. (2005). “Social capital, economic growth and regional development.” Regional Studies, 39(8), 1015-1040.
Jandl, R., Lindner, M., Vesterdahl, L., Bauwens, B., Baritz, R., Hagedon, F., et al. (2007). “How strongly can forest management influence soil carbon sequestration?” Geoderma, 137(3), 253-268.
Kahan, J. H., Allen, A. C., and George, J. K. (2009). “An operational framework for resilience.” Journal of Homeland Security and Emergency Management, 6(1), 1-48.
Kimhi, S., and Shamai, M. (2004). Community resilience and the impact of stress: Adult response to Israel’s withdrawal from Lebanon. Journal of Community Psychology, 32, 439–451.
Klein, R., Robert, J. T., Nicholls, J., and Thomalla F. “Resilience to Natural Hazards: How Useful Is This Concept?” Global Environmental Change, Part B: Environmental Hazards, Vol. 5, No. 1-2, 2003, pp. 35-45.
Lei, Y., Wang, J., Yue, Y., and Yin, W. (2014). “Rethinking the relationships of vulnerability, resilience, and adaptation from a disaster risk perspective.” Natural Hazards, 70(1), 609-627.
Longstaff, P. H., Security, Resilience, and Communication in Unpredictable Environments Such as Terrorism, Natural Disasters, and Complex Technology, Cambridge, Mass.: Center for Information Policy Research, Harvard University, November 2005.
Lynch, D. L. (2001). “Financial results of ponderosa pine forest restoration in southwestern Colorado.” In: R. K. E. Vance, B. Carleton, W. W. Covington, J. A. Blake (Eds.), Ponderosa pine ecosystems restoration and conservation: Steps toward stewardship (pp. 141-148). Flagstaff, AZ: U.S. Department of Agriculture, Forest Service, Rocky Mountain Research Station.
Lynch, D. L., and Mackes, K. (2003). Costs for reducing fuels in Colorado forest restoration projects. U. F. Service, USDA Forest Service Proceedings.
Mai, N. T. L. (2014). Storm resistant housing for a resilient Da Nang City. Da Nang, Vietnam: ISET.
Mäler, K.-G. (2008). “Sustainable development and resilience in ecosystems.” Environmental and Resource Economics, 39(1), 17-24.
Mäler, K.-G., and Li, C.-Z. (2010). “Measuring sustainability under regime shift uncertainty: a resilience pricing approach.” Environment and Development Economics, 15(06), 707-719.
157
Mäler, K.-G, et al. (2007). “Pricing resilience in a dynamic economy environment system: A capital theoretical approach.” The Beijer Institute of Ecological Economics Discussion Paper (208).
Masten, A., Best, K., and Garmezy, N. (1990). Resilience and development: Contributions from the study of children who overcome adversity. Development & Psychopathology, 2, 425-444.
Maven (2014). “The future of water transfers after the 2014 drought.” (2015, January 14) Maven’s Notebook.
Mayunga, J. S. (2007). “Understanding and applying the concept of community disaster resilience: A capital-based approach.” Summer Academy for Social Vulnerability and Resilience Building.
Miller, F., Osbahr, H., Boyd, E., Thomalla, F., Bharwani, S., Ziervogel, G., et al. (2010). “Resilience and vulnerability: complementary or conflicting concepts?” Ecology and Society, 15(3), 1-25.
Moench, M., and The Sheltering Team. (2014). Sheltering from a gathering storm: Synthesis report.
National Academies of Science, Engineering and Medicine (2012). Disaster resilience: A national imperative, Washington D.C.: The National Academies Press.
National Interagency Fire Center (undated). “Total Wildland Fires and Acres (1960-2015).” Retrieved August 15, 2017 from https://www.nifc.gov/fireInfo/fireInfo_stats_totalFires.html
NIST (2015). Disaster resilience framework.
Norris, F. H., Stevens, S. P., Pfefferbaum, B., Wyche, K. F., and Pfefferbaum, R. L. (2008). “Community resilience as a metaphor, theory, set of capacities, and strategy for disaster readiness.” American Journal of Community Psychology, 41(1-2), 127-150.
Paton, D., and Johnston, D. (2001). Disasters and communities: Vulnerability, resilience, and preparedness. Disaster Prevention and Management, 10, 270-277.
Pawson, R. (2003). “Nothing as practical as a good theory.” Evaluation, 9(4), 471-490.
Pearce, D. W., and Atkinson, G. D. (1993). “Capital theory and the measurement of sustainable development: an indicator of 'weak' sustainability.” Ecological Economics, 8(2), 103-108.
Pfefferbaum, B., Reissman, D., Pfefferbaum, R., Klomp, R., and Gurwitch, R. (2005). Building resilience to mass trauma events. In L. Doll, S. Bonzo, J. Mercy, and D. Sleet (Eds.), Handbook on injury and violence prevention interventions. New York: Kluwer Academic Publishers.
Phong, T. V. G. (2013). Lessons from Typhoon Nari storm resistant housing shown to be effective. Hanoi: Institute for Social and Environmental Transition-International Vietnam.
158
Podolak, K., Edelson, D., Kruse, S., Aylward, B., Zimring, M., and Wobbrock, N. (2015). Estimating the water supply benefits from forest restoration in the northern Sierra Nevada. An unpublished report of The Nature Conservancy prepared with Ecosystem Economics. San Francisco, CA.
Reed, W. J., and Heras, H. E. (1992). “The conservation and exploitation of vulnerable resources.” Bulletin of Mathematical Biology, 54(2-3), 185-207.
Resilience concepts and the resilience dividend, handout from project inception meeting, September 28, 2016. New York: Rockefeller Foundation.
Rodin, J. (2014). The resilience dividend: Being strong in a world where things go wrong. New York: Public Affairs.
Rodin, J. (2013, June 24) The city resilient.
Rose, A. (1999). “Defining and measuring economic resilience to earthquakes.” Overarching Center-wide Cross Program Research Activities. Buffalo, NY: University of Buffalo NSF Earthquake Engineering Research Center, 41-54.
Rose, A. (2004). “Defining and measuring economic resilience to disasters.” Disaster Prevention and Management: An International Journal, 13(4), 307-314.
Solow, R. M. (1974). “Intergenerational equity and exhaustible resources.” The Review of Economic Studies, 41, 29-45.
Sonn, C., and Fisher, A. (1998). Sense of community: Community resilient responses to oppression and change. Journal of Community Psychology, 26, 457–472.
State of California (2012). Incident information.
Tanner, T. M., Surminski, S., Wilkinson, E., Reid, R., Rentschler, J., and Rajput, S. (2015). The triple dividend of resilience: Realising development goals through the multiple benefits of disaster risk management. London: Global Facility for Disaster Reduction and Recovery (GFDRR) at the World Bank and Overseas Development Institute (ODI).
Tuan, T. H., Phong, T. V. G., Hawley, K., and Moench, M. (2015). “Quantitative cost-benefit analysis for typhoon resilient housing in Danang city, Vietnam.” Urban Climate, 12, 85-103.
Turner, B. L., Kasperson, R. R., Matson, P. A., McCarthy, J. J., Corell, R. W., Christensen, L., et al. (2003). “A framework for vulnerability analysis in sustainability science.” Proceedings of the National Academy of Sciences, 100(14), 8074-8079.
U.S. Energy Information Administration (2017, July 6). Wholesale electricity and natural gas market data.
U.S. Forest Service Fire & Aviation Management. Through ecosystem restoration. Retrieved March 30, 2017.
University of Essex University of Manchester and Jisc. (2017). “UK Data Service.” Retrieved March 9, 2017.
159
Vekshin, A. (2014). “California water prices soar for farmers as drought grows.” Retrieved March 15, 2017.
Vilsack, T. (2015). “The cost of fighting wildfires is sapping forest service budget.” U.S. Forest Service.
Walker, B., Pearson, L., Harris, M., Maler, K.-G., Li, C.-Z., Biggs, R., et al. (2010). “Incorporating resilience in the assessment of inclusive wealth: An example from South East Australia.” Environmental and Resource Economics, 45(2), 183-202.
Waller, M. A., “Resilience in Ecosystemic Context: Evolution of the Concept,” American Journal of Orthopsychiatry: Mental Health and Social Justice, 71(3), 290-297.
Wilm, H., and Dunford, E. (1948). “Effect of timber cutting on water available for stream flow from a lodgepole pine forest.” USFS Technical Bulletin, 968.
Wobbrock, N. (2017, February 10). Personal communication with Nick Wobbrock, Blue Forest Conservation.
Young, M., et al. (2015). Unbundling water rights: A blueprint for development of robust water allocation systems in the western United States, Duke Nicholas Institute for Environmental Policy Solutions.
Zeff, H., et al. (2016). Benefits, costs, and distributional impacts of a groundwater trading program in the Diamond Valley, Nevada. New York: Rockefeller Foundation.
Ziyath, A. M., Teo, M., and Goonetilleke, A. (2013). “Surrogate indicators for assessing community resilience.” Proceedings of the International Conference on Building Resilience 2013.

www.rand.org
RR-2129-RF 9 7 8 0 8 3 3 0 9 8 9 6 2
ISBN-13 978-0-8330-9896-2ISBN-10 0-8330-9896-9
54550
$45.50
Policymakers, program practitioners, and investors who want to achieve the greatest possible benefits from the resilience projects that they support lack effective tools to estimate the net benefits of those projects. Existing approaches often do not provide a sufficient framework for estimating the benefits that might accrue from a project aimed at increasing resilience, especially if a shock or stress does not occur.
The RAND Corporation and the Rockefeller Foundation formed a partnership to develop a modeling framework that can be used to estimate the net benefits of a resilience project. We call the framework the Resilience Dividend Valuation Model (RDVM). We use the term resilience dividend to describe the net benefits associated with the absorption of shocks and stressors, the recovery path following a shock, and any co-benefits that accrue from a project, even in the absence of a shock. For any given project, the estimated dividend may be positive or negative.
This report describes how we developed the RDVM and offers a set of case studies to demonstrate how it can be applied across diverse settings. The RDVM is designed to provide a systematic, “structural” framework for assessing resilience interventions that ultimately create benefits and costs within a system, such as a community or city. While the model is not designed to be a one-size-fits-all tool, it does provide a way to systematically account for the returns to resilience investments across a range of contexts.
Resilience Dividend Valuation M
odelBond et al.
R
Resilience Dividend Valuation ModelFramework Development and Initial Case Studies
Craig A. Bond, Aaron Strong, Nicholas Burger, Sarah Weilant,
Uzaib Saya, Anita Chandra


