1 Resilience, Vulnerability and Adaptive Capacity of an Inland Rural Town Prone to Flooding: A Climate Change Adaptation Case Study of Charleville, Queensland, Australia Diane U. Keogh 1 , Armando Apan 14 , Shahbaz Mushtaq 1 , David King 23 and Melanie Thomas 23 1 Australian Centre for Sustainable Catchments, University of Southern Queensland, Toowoomba QLD 4350 Australia 2 Centre for Disaster Studies, James Cook University, Townsville QLD 4811 Australia 3 Centre for Tropical Urban and Regional Planning, James Cook University, Townsville QLD 4811 Australia 4 Faculty of Engineering and Surveying, University of Southern Queensland, Toowoomba QLD 4350 Australia Corresponding author: Diane Keogh, [email protected]phone +61 407 584 371 Abstract Australia is currently experiencing climate change effects in the form of higher temperatures and more frequent extreme events, such as floods. Floods are its costliest form of natural disaster accounting for losses estimated at over $300 million per annum. This article presents an historical case study of climate adaptation of an Australian town that is subject to frequent flooding. Charleville is a small, inland rural town in Queensland situated on an extensive flood plain, with no significant elevated areas available for relocation. The study aimed to gain an understanding of the vulnerability, resilience and adaptive capacity of this community by studying the 2008 flood event. Structured questionnaires were administered in personal interviews in February 2010 to householders and businesses affected by the 2008 flood, and to institutional personnel servicing the region (n=91). Data were analysed using appropriate quantitative and qualitative techniques. Charleville was found to be staunchly resilient, with high levels of organisation and cooperation, and well-developed and functioning social and institutional networks. The community is committed to remaining in the town despite the prospect of continued future flooding. Its main vulnerabilities included low levels of insurance cover (32% residents, 43% businesses had cover) and limited monitoring data to warn of impending flooding. Detailed flood modelling and additional river height gauging stations are needed to enable more targeted evacuations. Further mitigation works (eg., investigate desilting Bradley’s Gully and carry out an engineering assessment) and more affordable insurance products are needed. Regular information on how residents can prepare for floods and the roles different organisations play are suggested. A key finding was that residents believe they have a personal responsibility for preparation and personal mitigation activities, and these activities contribute substantially to Charleville’s ability to respond to and cope with flood events. More research into the psychological impacts of floods is recommended. Charleville is a valuable representation of climate change adaptation and how communities facing natural disasters should organise and operate. Keywords: Adaptive capacity, Charleville, climate change adaptation, flood, resilience, vulnerability. Authors’ Accepted Manuscript Version of: Keogh, Diane U. and Apan, Armando and Mushtaq, Shahbaz and King, David and Thomas, Melanie (2011) Resilience, vulnerability and adaptive capacity of an inland rural town prone to flooding: a climate change adaptation case study of Charleville, Queensland, Australia. Natural Hazards, 59 (2). pp. 699-723. ISSN 0921-030X
Transcript
1
Resilience, Vulnerability and Adaptive Capacity of an Inland Rural
Town Prone to Flooding: A Climate Change Adaptation Case Study
of Charleville, Queensland, Australia
Diane U. Keogh1, Armando Apan
14, Shahbaz Mushtaq
1, David King
23 and Melanie Thomas
23
1 Australian Centre for Sustainable Catchments, University of Southern Queensland, Toowoomba
QLD 4350 Australia 2
Centre for Disaster Studies, James Cook University, Townsville QLD 4811 Australia 3
Centre for Tropical Urban and Regional Planning, James Cook University, Townsville QLD 4811
Australia 4
Faculty of Engineering and Surveying, University of Southern Queensland, Toowoomba QLD 4350
More frequent and severe disaster events such as floods are placing greater strain on the resources
and funding of emergency management agencies. Hence it is imperative to gain a detailed
understanding about how areas at risk can adapt and the vulnerabilities, resilience and adaptive
capacity of these communities. Social capital is integral to well-functioning societies. It relates to
social networks, cohesion, trust and support systems (Geoscience Australia 2005) and how individuals
organise to pursue common goals (Kaufman 1999, p. 1304). Data typically collected to measure it has
included data on volunteerism, organisational memberships, contact with friends and family, and
feelings of trust and safety in the community (ABS 2004; Geoscience Australia 2005; World Bank
2004). In Australia in 1997 volunteerism activities alone were valued at contributing between $24 and
$31 billion to society (ABS 2000). Coordination activities enacted in disaster response and people’s
willingness to cooperate are also considered aspects of social capital (Krueger et al. 2009; Putnam
1993; Stewart et al. 2009).
Lessons learned from previous flood studies:
A review of international literature on flood studies revealed important insights as to how communities
subject to flooding operate which are worthy of examination in climate adaptation research (refer
below). More is currently known about the extremely complex and uncertain nature of the
hydrometeorology of floods (Brilly and Polic 2005) and its technical aspects than about people’s
behaviour (Montz and Gruntfest 2002). Researchers have emphasized the importance of studying
people’s behaviour, information needs, experiences and lessons learned from past events. They suggest
3
that community resilience needs to be built and self-protective behaviour promoted amongst
community members to ensure their readiness and willingness to prepare for flood events. The public
also needs to develop a realistic understanding of the threat of floods, be able to interpret flood risk
information and understand the evacuation strategy. Flood risk information needs to be persuasive.
Residents in the March 2001 Grafton flood in NSW, Australia were unprepared, did not have a
realistic appreciation of the threat, nor understand the evacuation strategy, and less than 10 percent of
the population left during the nine hour evacuation (Pfister, 2002). A study in Nimes, France of the
October 1988 flood which damaged 45,000 homes found only 17% of participants (n=187) were aware
they lived in a flood-prone area (Duclos et al. 1991). Migrants and new residents can be unaware of the
risk of natural disasters and have difficulty accessing and interpreting important information. The
heterogeneity of populations at risk can add complexity to the designing of relevant and meaningful
messages (Pfister 2002). People need to know what action they can take, how much it will cost and its
likely effectiveness. Monetary flood damage can be reduced by around 80% in urban areas prone to
flood by residents exhibiting self-protective behaviour (Grothmann and Reusswig 2006). A study of
flood risk in Glomma, Norway found less than half the participants would immediately obey an order
to evacuate, and a third would wait and see (Krasovskaia et al. 2001). Decision-makers were found to
have a poor understanding of the cost and effectiveness of measures to prevent floods.
Communities need strong and cooperative social networks and well-organised institutions.
Operational briefs are important to identify areas for improvement and lessons learned but do not
generally capture the public’s perspective (Pfister 2002). Lasting psychological consequences
associated with disaster events are another public health issue in determining victim support (Verger et
al. 2003). Research in the US has found that in disasters communities rely on assistance from many
authorities and organisations (Brudney and Gazley 2009; Gazley et al. 2009; McGuire et al. 2009) and
there is a growing realization that, with the exception of smaller emergencies, no one organisation is
capable of doing it all (Gazley et al. 2009).
This article presents an historical case study of the 2008 flood in Charleville, an inland rural town
in Queensland, Australia which is subject to frequent flooding. The aim of the study was to understand
how a community such as Charleville, which could become non-viable due to continued flooding,
operates and its characteristics of vulnerability, resilience, and adaptive capacity. It involved personal
interviews with householders and businesses affected by the flood and with institutions, disaster
committees and community service organisations. The effectiveness of flood mitigation measures was
also investigated. This study forms part of a national series of climate change adaptation case studies
underway in Australia.
2 Method
This qualitative study focused on reconstructing an event rather than social modelling. Its main aim
was to identify the characteristics of a society that is regularly flooded in terms of its vulnerability,
resilience and adaptive capacity. Two types of data were collected, primary (using personal interviews
and structured questionnaires) and secondary (through conduct of an extensive local and international
literature review).
2.1 Study area:
Charleville was chosen because it is a location where severe floods could, under climate change
scenarios, become more frequent in the future. The town is also considered representative of a rural
inland town, with a small population and economy, vast hinterland service area, basic infrastructure
and slow population and economic growth. It is located on an extensive flood plain with no significant
elevated areas for relocation and experiences frequent flooding, which leads to isolation and disruption
of services. Charleville is 756 kilometres west of Brisbane in the heart of Queensland‘s mulga country
on the left bank of the Warrego River (Wagner 1991). Its climate varies from -3 to 21ºC in winter and
4
in summer from 27 to 46 ºC, with average rainfall of 450mm (Lord 1982). It covers an area of 13,924
square km (ABS 2006a), lies within the broader region of the South-West Statistical Division and is the
main town servicing a large area for the Central West and Warrego regions.
Most of Charleville lies on the flood plain which is constricted to a width of around 3.5 km and 5
km upstream (Figure 1). The Bradley‘s Creek catchment covers 200 km2 and flows through Charleville
running almost parallel to the Warrego River before it discharges into this river downsteam of the town
(Sargent 1991). These two water courses are monitored by automatic rainfall and river height
monitoring stations: one located approximately 15km east of Charleville at Raceview monitoring
Bradley’s Gully established in 2000, and the other located behind the Police Station on the Warrego
River, established after the 1990 flood.
Charleville‘s population has grown from 58 in 1871 (peaking at 5,154 in 1961) (CGQ 2009) steadily
declining to 3,278 recorded in the 2006 census (of whom 12.9% were indigenous, more than five times the
national average) (ABS 2006a,b). This decline is reportedly linked to the downturn in the pastoral industry,
fluctuating sheep-wool and cattle prices, a number of poor seasons and the effect of rising costs (Lord 1982).
Fig. 1 Charleville Town Map (Source: Murweh Shire Council)
2.2 Data collection
Both primary and secondary data were collected and analysed. Methods for collection and analysis are
discussed below (see Figure 2 below).
Primary data: A purposive sampling research design was used to conduct three phases of data collection of
primary data, targeted at a different group of stakeholders: household residents, businesses and institutions
(see Figure 2). Figure 2 depicts Charleville’s Governance Structure in terms of Emergency Management
Institutions, and the rectangle labeled ‘Charleville Community’ depicts the community and its subgroups,
viz., householders, businesses, and Local, State and Commonwealth Government Organisations and
Community Service Agencies (whom we interviewed in our study).
Bradley’s Gully
Warrego
River
5
Fig. 2 Charleville Governance Chart of Emergency Management Institutions
(Source: Adapted from Department of Community Safety (2009); Department of Community Safety
(2011) and State Disaster Management Group (2010))
Primary data: A purposive sampling research design was used to conduct three phases of data collection of
primary data, targeted at a different group of stakeholders: household residents, businesses and institutions.
Structured questionnaires were administered in personal interviews to householders (n=55), businesses
(n=13) and representatives of institutions, disaster committees and community services organisations
(n=23) in February 2010 in Charleville. To reduce inconvenience to businesses, questionnaires were
dropped off and picked up a day or so later (n=13). Householder and business participants were restricted
to those affected by the 2008 flood. The questionnaires used in this study were adapted from one developed
in the 1990s by James Cook University, Townsville, which had undergone further development in 2004 by
the Bureau of Meteorology for post-flood studies. Questionnaire topics are outlined in Table 1.
Each of the three structured questionnaires contained the same 57 questions; but the institutional
questionnaire had an additional 33 questions. These questions related to the roles played by institutions
during the flood, issues that arose, details of financial assistance provided, action taken post the 1997 flood,
future mitigation and 5 year plans to cope with future floods, and how they might spend additional funding
if it were available. They were asked what they believe the community and other institutions need to do to
better cope with floods and what needs to happen in the next 5 years to make Charleville a viable
community in which to live and work.
Secondary data: Reconstruction of the flood event and assessment of its overall impact was conducted
from data and viewpoints from primary data (as above) and government agencies, media and local
governments (Murweh Shire Council) and using secondary data, interviews and text analysis of news
media. Records were consulted of previous and subsequent flood events in order to place the 2008
floods in context. Related international and local literature were collected and reviewed, including
Commonwealth and Queensland government reports, policy documents, manuals, newspaper articles,
journal papers, media reports and web pages.
6
Table 1 Overview of questionnaire topics relevant to the Charleville sample group questionnaires and
sample sizes
Questionnaire topics
Householders
(n=55)a
Business
(n=13)b
Institutions
(n=23)c
Experience in the 2008 flood event
Recovery after the flood
Precautions taken before the flood
Previous experience of flooding
Warnings of the January/February 2008 flood
Preparations before the flood
Thoughts about floods (to aid public education campaign planning).
Demographic information
State Planning Policy 1/03 & Integrated Planning Act 1997d na
Assisting your clients during the 2008 floods na na
Institutional preparedness for flood events na na
How organisations and community members can better prepare for floods na na
Maintaining Charleville as a viable community in which to live and work na na
a
65 householders were contacted and 55 agreed to participate (85% response rate) b
15 businesses were contacted and 13 agreed to participate (87% response rate) c 30 institutions were contacted and 23 agreed to participate (77% response rate)
d This Act has now been replaced by the Sustainable Planning Act 2009
2.3 Data analysis
The collected data were analysed using appropriate quantitative and qualitative techniques. SPSS
(Version 18) statistical software was used to create a database and generate basic descriptive statistics
and cross-tabulation tables generated with data standardized as percentages and graphs. These simple
cross-tabulations of qualitative data are clear statements of the impact, perceptions and attitudes toward
the flood event. Qualitative data were analysed by grouping responses by common themes and linking
responses to the relevant project objectives, with a focus on associating responses and interpretations
with sample group and community characteristics in terms of vulnerability, resilience and adaptive
capacity, and evaluating the effectiveness of mitigation activities undertaken to prevent flooding.
7
3 Flood Experience, Resilience and Adaptation
Householder, business and institutional survey results are discussed under each of the following
sections: impact of the 2008 flood, vulnerability, flood mitigation measures, resilience and adaptive
capacity. In reviewing these results it is important to note that in Charleville at the time of the 2008
flood the single river gauge height monitoring station at Bradley’s Gully was not working and this
gully was the main source of flood water. Secondly, it is extremely difficult to obtain flood insurance
in Charleville for households and businesses located on the floodplain, making them more vulnerable
to economic losses.
3.1 Comparison of previous floods
The Warrego River (Figures 1 and 3 ) has a well documented history of flooding with records of the
larger floods dating back to 1910 (BOM 2009). In Charleville, more than 10 major floods were
recorded since this period that caused inundation of large areas, isolating towns and cities, including
major disruptions to road and rail links. The significant flood peaks which have occurred at Charleville
since records began are illustrated in Figure 3 and major flooding has occurred in the region including a
legendary flood in 1890.
Fig. 3 Significant flood peaks at the Warrego River in Charleville (Source: Bureau of Meteorology,
2011).
Two major floods in Charleville’s recent history occurred in 1990 and 1997 resulting from differing
rainfall events. A significant flood also occurred in March 2010 (refer Figures 3-4), shortly after the
completion of this study, when around a third of the population in Charleville had to be evacuated and
flood waters from Bradley’s Gully cut through the centre of the town (ABC 2010). Most of the
region’s highways were cut and infrastructure damage was estimated at $7-$9 million (ABC 2010). In
2011 Charleville has once again been affected by the Queensland disaster floods.
8
Bradley’s Gully at Raceview
Fig. 4 Flood Hydrographs recorded during March 2010 for the Warrego River and Bradley’s Gully
(Raceview and Charleville monitoring stations), Charleville (Source: Bureau of Meteorology (BOM)
2010)
The 1990 flood occurred due to prolonged rainfall over a 20 day period, and the 1997 flood from a
6 day rainfall period (BOM 1997). The most intense 24 hour periods of rainfall in 1990 at Charleville
were much higher than those recorded for 1997 (BOM 1997). Flood river peaks for the Warrego River
at Charleville were 8.54m in the 1990 flood, and 7.39m in the 1997 flood (BOM 1997). Unlike the
9
1990 and 1997 floods, the March 2010 flood at Charleville resulted from intense local rains of about
175 mm in 24 hours at Charleville and in the nearby Bradley Gully catchment, with much less rain in
the main Warrego River catchment above Charleville. Rainfall of 250mm fell during 1-4 March and
100mm fell in 8 hours from 5pm on 1st March and this rainfall was widely distributed in the catchment
(Sargent Consulting 2010). This rainfall fell on a catchment which was already wet and resulted in a
large amount of runoff (Sargent Consulting 2010). Inundation of the Charleville township was caused
by a record flood in Bradley’s Gully, and not by high flood levels in the Warrego River. In the
2010 flood, the peak flood level in the river was only 6.65 metres (BOM 2010; Sargent Consulting)
which is almost 2 metres less than the 1990 flood and contained within the main river channel at
Charleville.
1990 flood: In 1990 Charleville had no form of flood mitigation (BOM 2009). In April 1990 a wide
area of Western Queensland experienced a record or near record flooding and Charleville was the town
most affected. All buildings in the business centre and 1,180 of the 1,470 homes were inundated, and
most of the town was flooded to depths of 1.2-2m up to 3m adjacent to Bradley‘s Gully (Sargent 1991).
On 21st April the Warrego River peaked at Charleville at 8.54m, 1.5m higher than the previous record
height in 1956 of 6.96m, with peak discharges estimated at around 3000m3/s (Sargent 1991). The State
Emergency Services (SES) coordinated the complete evacuation of the town to temporary
accommodation at the airport (BOM 1990).
1997 flood: In western Queensland during 28th
January to 3rd
February 1997 heavy rainfall fell resulting
in major flooding in several catchments (BOM 1997). In Charleville 780 people were evacuated due to
major flooding and about 60 properties were affected by flood waters which reached above floor level
(BOM 1997). Repairs to flood damaged buildings were estimated at around $150,000 (BOM 1997).
Rail and road traffic underwent severe disruption with large groups of travellers stranded at various
areas in the flood affected region (BOM 1997). Flooding in the Warrego River was so significant
because at its peak at Charleville it was the highest recorded since the record flood of April 1990 and
was the second highest on the flood record which commenced about 1900 (BOM 1997).
Charleville’s flood warning system is for the Warrego River catchment (which covers approx. 65,000
km2) and major towns on this river are Augathella, Charleville, Cunnamulla and Wyandra (BOM 2009).
Floods have been recorded at the Warrego River since 1910 (BOM 2009). In the Warrego River
catchment average rainfall exceeding 75mm in 24 hours (over isolated areas) and of 50mm (over more
extensive areas) can cause the stream to rise and possible minor flooding, lesser rainfall in the previous
24-72 hours can led to moderate to major flooding; and 100mm in 24 hours will cause isolating flood in
the immediate area where the heavy rain is received (BOM 2009).
3.1 Impact of the 2008 Charleville flood
In 2008 floods in Queensland cost the State and local Governments around $234 million in damages to
infrastructure when approximately one million square kilometres of Queensland (or 62% of the area) was
underwater (Queensland Government 2009). In Charleville between 10-20 January 2008 heavy rainfall
fell along the Queensland coast between Mackay and Townsville, and inland over the Central Interior
and Coalfields followed from a tropical low pressure centre which tracked a path across Queensland
(BOM 2008a, EMA 2009). During 17-20th January 2008 Charleville experienced its biggest Bradley’s
Gully flood event since 1963. This gully flows through the middle of the town (Figure 1) and flood
waters reached 3.1 metres, and funding of $2.5 million was subsequently approved to reinstate the
Murweh Shire road network to its previous condition prior to the flood, under Natural Disaster Relief and
Recovery funding (pers. comm. Allan Pemberton, Murweh Shire Council, 2/11/09).
The 1990 and 1997 floods had been the impetus for the construction of Charleville’s flood
mitigation levee. The Charleville levee was designed to be constructed in two stages - the first stage to
provide protection up to the 1997 flood level (approx. 1 in 80 Annual Exceedance Probability (AEP)
10
plus various allowances), and the second stage up to the 1990 level, however at present only stage one
has been constructed which did not include its northern extension to prevent overflows from Bradley’s
Gully inside the levee, nor the Bradley’s Gully diversion (Sargent 2010). At the time of the 2008 flood
in Charleville, work on the levee was not fully completed, however it did largely prevent flooding of
the township from the river.
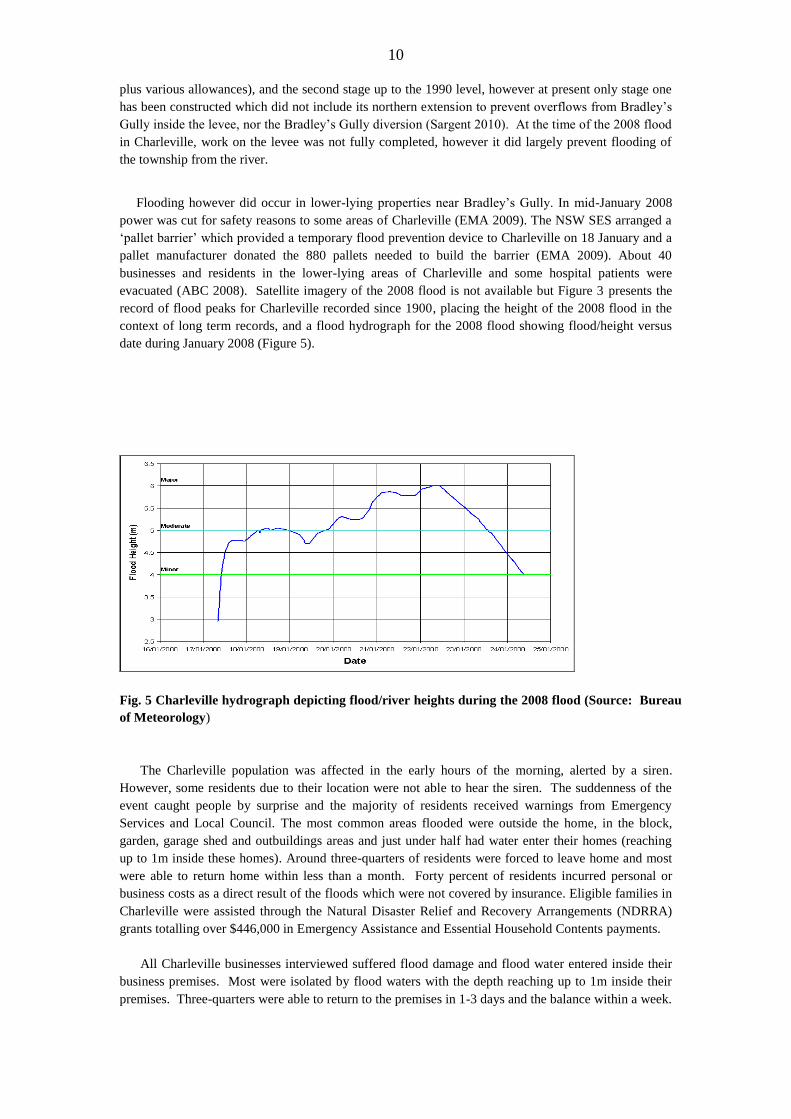
Flooding however did occur in lower-lying properties near Bradley’s Gully. In mid-January 2008
power was cut for safety reasons to some areas of Charleville (EMA 2009). The NSW SES arranged a
‘pallet barrier’ which provided a temporary flood prevention device to Charleville on 18 January and a
pallet manufacturer donated the 880 pallets needed to build the barrier (EMA 2009). About 40
businesses and residents in the lower-lying areas of Charleville and some hospital patients were
evacuated (ABC 2008). Satellite imagery of the 2008 flood is not available but Figure 3 presents the
record of flood peaks for Charleville recorded since 1900, placing the height of the 2008 flood in the
context of long term records, and a flood hydrograph for the 2008 flood showing flood/height versus
date during January 2008 (Figure 5).
Fig. 5 Charleville hydrograph depicting flood/river heights during the 2008 flood (Source: Bureau
of Meteorology)
The Charleville population was affected in the early hours of the morning, alerted by a siren.
However, some residents due to their location were not able to hear the siren. The suddenness of the
event caught people by surprise and the majority of residents received warnings from Emergency
Services and Local Council. The most common areas flooded were outside the home, in the block,
garden, garage shed and outbuildings areas and just under half had water enter their homes (reaching
up to 1m inside these homes). Around three-quarters of residents were forced to leave home and most
were able to return home within less than a month. Forty percent of residents incurred personal or
business costs as a direct result of the floods which were not covered by insurance. Eligible families in
Charleville were assisted through the Natural Disaster Relief and Recovery Arrangements (NDRRA)
grants totalling over $446,000 in Emergency Assistance and Essential Household Contents payments.
All Charleville businesses interviewed suffered flood damage and flood water entered inside their
business premises. Most were isolated by flood waters with the depth reaching up to 1m inside their
premises. Three-quarters were able to return to the premises in 1-3 days and the balance within a week.
11
Sixty-eight percent of householders and 57% of businesses did not have insurance cover and business
responses on the questionnaire indicate that it is virtually impossible to obtain insurance for flood for
businesses in Charleville. Many of the business premises are situated on the flood plain area very close
to Bradley’s Gully making them very vulnerable to flooding from the gully. Most businesses reported
that they incurred expenses as a result of the flood which were not covered by insurance. These costs
were estimated at $375,000. Residents reported uninsured costs incurred of $100,130. These small
uninsured financial losses were likely minimized by the extensive effort expended by residents,
businesses, institutions and the SES in preparation, recovery and response efforts which contributed to
a successful emergency response. Charleville’s well-functioning social and institutional networks,
coordination activities and levels of cooperation make it a sound model of how towns facing future
disasters need to organise and operate.
Institutions played a major role in response and recovery. They responded to calls for help, carried
out minor rescues, measured water flows, pumped out low lying buildings that had water, transferred
hospital patients by air, provided policing and paramedic services, financial assistance and counselling.
One Government department closed its offices for 10 days so that staff could provide volunteer help
with sandbagging and other tasks. Low risk prisoners also assisted and are now well thought of in the
community. Institutional personnel hosed and washed out houses and used high pressure hoses to clean
houses and remove mud and other debris, took furniture to the dump, implemented strategies to stop
mosquito larvae breeding in stagnant water, inspected hospitality businesses such as butchers for
potential health issues, disconnected power, where necessary, and monitored people‘s assets and safety.
Coordination and support activities included attending Local and District Disaster Committee meetings
and updates, dealing with community issues, coordination efforts for different services, disaster
management coordination, phoning insurance companies on behalf of residents overwhelmed by the
event, providing support to the local SES, loans of vehicles and communications equipment, catering
for evacuees and registration, helping people get where they needed to go, and helped build the
temporary levee. To build this temporary levee engineering expertise was obtained from New Zealand.
An emergency accommodation shelter was also established. Swift-water rescue personnel had to be
brought in.
Difficulties arose with keeping children out of the water and from children floating downstream,
there were a few snakes getting around and there was debris in the river. Sometimes people were
reluctant to evacuate. Onlookers caused some problems getting in the way and some drove through
flood waters and created wakes, which were sometimes just enough to force a breach and result in
water entering a house. There was a lack of suitable facilities for temporary housing of nursing home
patients in the local hospital, staff fatigue occurred due to long periods of overtime, and there were
issues of logistics and access. Communicating with rural residents is often via police, radio and
distance education School of the Air (who were reportedly on holidays at the time of the flood). Several
institutions felt that some decisions made by staff in locations outside the local area would have been
better made by local staff, and it was suggested that local people would be valuable for checking the
validity of claims for funding in terms of those reporting they were affected by floods.
It was suggested that handing out food or food vouchers may be better than handing out money
straight away, as it can sometimes be spent on alcohol instead of necessary items like food. The
amount of paperwork involved in claiming financial subsidies for rural property fencing damage was
said to have dissuaded claims. Sandflies were a problem; but water quality was not, bore water does not
usually become contaminated by flood water. The Council continued to sample water during the flood
period. One organisation which did not have flood insurance incurred a lot of expense to rent
temporary premises and this reportedly affected their ability to deliver many of their programs and
services.
3.3 Vulnerability
Vulnerability relates to exposure (how likely a hazardous event is) and coping ability (resilience and
resistance) (Clark et al., 1998). People cope with hazards differently, and their vulnerability may relate
12
to factors such as age, disability, ethnicity, income, family structure and social networks, housing, and
the built environment. Many studies have shown that those aged over 75 years are considered a
vulnerable sector of a population (Granger, 1995; Blaikie et al. 1994). Sivell et al (2008) suggest that
societies need a plan showing where vulnerable people live. Settlement patterns and building codes can
contribute to higher flood risk, as can the building’s construction. Communities with poor management
or leadership, lack of disaster preparedness and planning and low levels of confidence about flood
warning information are likely to feel vulnerable. New residents may have never experienced a flood
and migrants may face additional pressures and challenges, such as language barriers and the need to
build social networks.
Householders: The main vulnerability of this sample group was the low level of flood household
insurance cover (only 32% had flood insurance). This insurance is difficult and expensive to obtain,
making them more vulnerable to economic losses in flood events. Some residents mistakenly believed
their household contents insurance covered them for flood damage, whereas this was frequently not the
case. Many homes are located close to Bradley’s Gully making them vulnerable to flooding. Almost
two-third of residents believe floods could pose quite a lot, or a great deal, of threat to daily activities
(work, leisure, etc.). Close to half believe a damaging flood could occur in the future and about three-
quarters believe this could occur during their lifetime. Groups householders believe are responsible for
protecting them from floods included individual householders (whom they rated most highly), followed
by Local Council and the State Government (Figure 6). Most residents said they would not leave
Charleville if affected by another flood (Figure 7) nor move to another area of Charleville. Less than
15% of members of resident households had participated in local community groups related to flood, or
had written letters to authorities. However, almost a quarter had attended meetings about flooding.
0
5
10
15
20
25
30
35
40
45
Individual
Households
Local Council State Govt Cwealth Govt
A great deal Quite a lot Neutral
Not much Not at all
% Response
Fig. 6 Groups householders believe are responsible to protect them from floods (n ranges 47-54)
Businesses: Close to a third of businesses did not receive any flood warning, however most are
confident about flood warning information. Two-thirds were aware of evacuation routes and centres
and about a third considered they were significantly or very prepared for the 2008 flood. Close to half
rated the response of Local Council very or significantly responsive. The time between the first
warning and the flood ranged from less than 1 to 24 hours. Fifty-seven percent of businesses did not
have flood insurance and many are located close to Bradley’s Gully which makes them highly
vulnerable to floods. They rely on easy access to the town for their custom; hence moving out of town
would not be an attractive economic option. They consider the risk of floods a threat to business
activities, they actively think about, talk about and source information on floods, and consider them a
possible threat to personal safety. A small proportion of businesses would consider leaving Charleville
if affected by another flood (Figure 7) or would relocate within the town. Although this proportion
may be considered low, if these businesses left Charleville it would have quite a significant effect on
such a small community. Almost 70% strongly believe a damaging flood could occur in the future and
91% believe it could happen in their lifetime. Most respondents were Managers or Directors/Owners,
70% were female and all were of non-indigenous descent.
Institutions: Representatives of Local, State and Commonwealth Governments, Community Service
Agencies and members of Local and District Disaster Committees were interviewed. Most had
experienced between 1-3 floods and considered the 2008 flood not as severe as that experienced in
1990. Only two institutions were affected by the 2008 flood. One evacuated for 5 days and the other
13
was situated close to Bradley‘s Creek and underwent severe inundation and had to relocate to
temporary premises for six months. This relocation affected their ability to service their clients and
deliver programs. Flood waters inside the institutional premises ranged from 130-1500mm. Few
institutions would consider leaving Charleville if affected by another flood event (Figure 7) and similar
proportions would relocate within the town. They considered flood warnings and information accurate
and most received warning of the 2008 flood from Emergency Services and Local Council.
About half received the first warning more than 24 hours before being affected by the flood waters.
They found the most helpful forms of communication for updates were radio alerts, the Bureau of
Meteorology website, SES workers and a message sent to their mobile by Murweh Shire Council. Most
considered they were prepared for the 2008 flood (70%) and 93% were aware of the evacuation routes
and centres. Most believe floods are likely to occur in their lifetime and there is a need to be prepared
for floods. Institutions in Charleville are very committed to remaining in the town and employ between
2-150 staff and two-thirds have operated in Charleville for more than 10 years. Seventy percent of
respondents were male and 15% were of indigenous descent, most were tertiary qualified.
0
20
40
60
80
100
Not at all Not much Neutral Quite a
lot
A greal
deal
Householders (n=54)
Businesses (n=11)
Institutions (n=20)
% Response
Fig. 7 Percent of residents, businesses and institutions who would leave Charleville if affected by
another flood (n ranges from 11-54)
3.4 Flood Mitigation Measures in Charleville
One of the objectives of this study was to understand the extent to which flood mitigation measures
have been applied to reduce vulnerability to flood events, and how these might be improved.
Householder Mitigation Measures: During the 2008 flood vehicles were the most common items
moved to higher ground, other items included washing machines, freezers and fridges. A small
proportion of residents sampled raised the floor level of their house as a mitigation activity (9%) and
just over half moved irreplaceable items above ground level. Almost three-quarters regularly carried
out maintenance to ensure ditches and drains around their property were clean and free of debris. Fifty-
eight percent of residents had copies of local flood plans of the area or were aware they are in a flood
prone area. Many did not have a household Evacuation Plan, Emergency Plan or Emergency Kt (56%,
69%, 67% respectively) and only 32% had flood insurance.
Businesses Mitigation Measures: The most common items moved were vehicles and outdoor
equipment, fridges, freezers, chemicals and poisons. Businesses turned off utilities, locked premises
and raised furniture. Emptied freezers, put sandbags in the bathroom, and evacuated with the
emergency kit using the evacuation route. Forty-three percent of businesses had flood insurance. Some
businesses had raised their floor levels as a mitigation activity prior to the flood, and this group tended
to be very vigilant in terms of maintaining ditches and drains around their property, keeping them clean
and free of debris and in moving irreplaceable items above ground level (92% and 84%, respectively).
Actions taken by institutions after the 1997 flood: Most institutions (90%) had taken action to
prepare for floods post the 1997 flood. These actions included conducting training, reviewing and
preparing emergency supplies, desktop and mock exercises, the establishment of roles, attending
14
meetings eg., District Disaster Committee Meetings, revisiting their Disaster Management Plan,
conducting workshops. Information brochures were also translated into Vietnamese for this migrant
group and distributed to Emergency Management Queensland (EMQ) and the Red Cross. Computers
and equipment were moved, including a generator to higher ground, airconditioning installed in an
operations room, desks were purchased with steel legs and carpet squares to replace carpet (easier to
move in a flood). Major mitigation works carried out since the 1997 flood included partial construction
of a levee bank, development of flood free residential real estate areas, desilting and clearing the
Warrego River and installing permanent disaster communication lines. Risk management studies and a
regional taskforce were also deployed for assistance. Few institutions provided an estimate of the cost
of these actions, and of the two who did, the total cost was estimated at $30,000. Three organisations
indicated that prior to the 2008 flood they had tested their mitigation strategies and only one
organisation said that they found their mitigation planning and strategy had proved useful in coping
with the 2008 flood.
15
Institutional Mitigation Measures: Prior to the 2008 flood mitigation activities included moving
vehicles and outdoor equipment to higher ground, moving chemicals and poisons, freezers and fridges.
Prior to evacuating, others raised furniture, documents and other valuables onto tables and roof spaces,
locked premises and took emergency and evacuation kits, turned off power, water and gas, and emptied
freezers and refrigerators leaving doors open. Few had Emergency Plans (14%), Emergency Kits (35%)
and Evacuation Plans (25%), suggesting that this could be a potential area for improvement.
Mitigation Measures suggested by Institutions post-2008 flood: Institutions suggested that more
river height reading stations and other warning devices are needed on Bradley‘s Creek, the Warrego
River and the Nieve River and better data including flood mapping and risk assessment using manual
or automatic systems. Bradley’s Gully needs to be desilted and community education programs and
training for SES volunteers is needed. An estimate provided for the initial cost of implementing these
mitigation activities is $2 million, with a recurrent cost of $100,000. It was also suggested that a review
of laws with respect to electricity line clearance during emergencies such as during flooding is needed.
The Murweh Shire covers 43,905 km2 and includes the towns of Augathella, Charleville,
Cooladdi and Morven situated in the Great Artesian Basin. In Charleville, the Murweh Shire Council
has a flood overlay as part of the Town Plan. The industrial area in Charleville is outside the flood
prone area, and new commercial premises in the flood area are required to have an upstairs area or an
Evacuation Management Plan. The Murweh Shire Council Planning Scheme (2005) requires habitable
dwellings to be above the 1 in 100 Average Recurrence Interval (ARI) flood level for the site. The
Building Code of Australia and the Queensland Development Code (DIP 2008) set out building
standards that recommend building at least 300mm above ARI 100 flood height and the Council is
using the Queensland ARI 100 flood height . The Murweh Shire Council is using the last known flood
height (that is 300mm above the 1997 flood height level) as the Defined Flood Event (DFE). Council
has a social, moral and legal responsibility to care for its aged citizens and there would be concerns if
the houses of elderly residents had to be raised on stumps, compromising their accessibility and their
having to use steps to enter the house. There would be concerns as to how elderly residents would cope
with the raised level of the house. A further concern has been the increased confidence amongst some
residents in building on a concrete slab, since the construction of the levee. The construction of the
levee may have contributed to a false sense of security that has eroded the willingness of people to
construct high set houses.
3.5 Resilience
Resilient communities must be able to demonstrate the ability to buffer the event, self-organise before,
during and after, and adapt and learn from the event (Trosper 2002). Residents who have lived for a
number of years in a community who have a strong sense of belonging and community and feel
confident about the capabilities and organisational ability of their institutions are likely to have high
levels of resilience and well-developed social networks. Social sources of resilience can include social
networks (Eriksen et al. 2005); social security payments, lessons learned from past events (Finan and
Nelson 2001; Nelson and Finan 2008) and consensus building (Brown et al. 2002). Resilience may not
necessarily involve physical measures or spending significant funding, and can be attained through
changes in awareness, procedure and management (Sivell et al. 2008). Resilient societies have
individuals and networks which are both resilient (Sivell et al. 2008). Economic resilience is concerned
with business resilience eg., the nature of the business and its practices, flood defences, transport
utilities and how many businesses have climate adaptation strategies and insurance against extreme
weather events (Sivell et al. 2008). To date community resilience has been difficult to accurately
measure or quantify (McIntosh et al. 2008).
Resilience of Charleville residents and businesses: The study found that more than 60% of residents
had lived in Charleville for over 10 years. Residents displayed high levels of resilience as we found
strong personal networks (evidenced by 77% of residents evacuating to family or friends during the
flood, Figure 8), high levels of sense of belonging in the community and participation in community
16
activities. Over a third of residents are tertiary qualified and almost half are employed full time.
Research has found those working full time who are educated are usually less vulnerable (Anderson-
Berry and King 2005). Residents believe they, as well as Local Council, are responsible for preparing
for floods. Low rates of formal volunteerism were found but, based on the study results there is a
suggestion of high levels of community spirit, and strong informal volunteering networks. Most
businesses had operated in the area for over 10 years and had substantial formal volunteer rates of
around 54%. This group‘s main non-resilience characteristic related to its low levels of insurance
cover, as discussed under vulnerability. Many businesses said they are reluctant to move out of town as
they will lose substantial business and need to remain close to town for the convenience of customers.
0 20 40 60 80 100
Rental accom
Showgrounds
Temp accom
Family/friends
% Response
Businesses (n=4)
Householders (n=34)
Fig. 8 Where residents and businesses evacuated to during the 2008 Charleville flood
Recovery: After the 2008 flood 920 families in the Charleville area were assisted with NDRRA
(Natural Disaster Relief and Recovery Arrangements) grants administered totalling over $446,000 in
Emergency Assistance and Essential Household Contents Grant payments (pers. Comm.. Jill Peters,
Community Recovery Unit, Queensland Department of Communities, Brisbane, 23/12/2009).
Concessional loans paid out to primary producers under NDRRA related to 5 applicants, and the total
assistance provided was $0.658 million; 23 small business grants valued at $0.298 million and 96
primary producer grants valued at $1.341 million were also paid out (QRAA 2010). The estimate to
restore essential public assets for Local Government by the Department of Infrastructure and Planning
was $2,526,835; EMQ counter disaster operations costs for Murweh Shire were $216,000 and
$482,000 for restoration of essential public assets for State Government; no freight subsidies were paid
out to primary producers by the Department of Employment, Economic Development & Innovation
(pers. comm. Stephen Hinkler, Queensland Department of Community Safety, 18/1/2010). Estimates of
total general insurance claims for the 2008 Charleville flood are not available.
Disease outbreaks following flood events in Australia are not common, however there is an increased
risk of infection if direct contact is made with polluted waters, which can cause conditions such as
conjunctivitis, dermatitis, ear, nose and throat infections, wound infections, and risks can increase for
diseases such as dengue fever, diarrhoeal diseases, leptospirosis and melioidosis (QH 2008). The
South-West Health Service District at the Charleville Base Hospital reported that presentations to the
hospital’s Emergency Department rose in the March 2008 quarter to 1447, up from 1190 in the
December 2007 quarter, falling to 1091 in the June 2008 quarter, however the hospital’s clinical coder
advised they were not able to identify admissions specifically related to the 2008 flood (pers. comm..
Sarah Charlwood, Queensland Health, 4/1/2010). Most deaths occurring in Australia are as a result of
people walking, swimming or attempting to drive through flood waters (QH 2008). No deaths were
recorded in Charleville that were directly related to the 2008 flood.
3.6 Adaptive Capacity
Adaptation involves change and the practice of individuals, communities and societies as they adjust
their locations, life courses and activities to maximize new opportunities (Nelson et al. 2007).
Adapting to environmental change can involve adjustment in social, ecological, or economic systems in
response to expected or observed changes in the environment, and their impacts and effects, to alleviate
adverse impacts (Berkhout et al. 2006; Janssen 2006; Smit and Wandel, 2006; Pielke 1998). Examples
17
of adaptive actions include selling assets (Eriksen et al., 2005); livelihood diversification and insurance
schemes (Finan and Nelson, 2001; Nelson and Finan, 2008); developing community-based resources
and consensus building for future zoning (Brown et al. 2002); regulatory changes such as
enhancements to building codes and zoning, developing plans and committees (Tompkins, 2005).
Adaptive Capacity of Residents: Residents were found to be heeding practical advice provided on
floods, such as checking electrical appliances before use and boiling tap water. Boiling tap water is
less of an issue in Charleville as their supply is bore water, whose quality tends to be less affected by
events such as floods. Increased numbers of Charleville residents intend to move irreplaceable items
above ground level in the future and more than three-quarters will continue to keep ditches and drains
around their properties clear and free of debris. Most residents would not move to another town if their
property was affected by another flood (Figure 7) or relocate within Charleville. Comments were made
that some residents had suffered psychologically from past flood events (particularly the 1990 flood).
The decision to stay in a community may be more about resilience, while a decision to move, rather
than indicating a lack of resilience, may be considered an adaptive response. The definition of
adaptation used in this study stresses change, and includes change in location as an adaptive response.
If large numbers of residents or businesses left the town, the impact on Charleville would be
considerable.
Residents rated Government and community groups highly in terms of their preparedness for future
flood events, suggesting strong levels of capacity amongst these groups (Figures 9 and 10). They rated
the preparedness of State Government, utility providers and their Local Hospital highly (78%, 59% and
49%, respectively) (Figures 9 and 10). Little evidence was found of factors which may weaken their
adaptive capacity (apart from low levels of flood insurance, mentioned previously).
Adaptive Capacity of Businesses: Businesses had also heeded practical advice on floods, such as
boiling tap water and having electrical appliances checked before use. Most said they intend keeping
drains and ditches free and clear of debris and will be moving irreplaceable items above ground level.
This group appears to have strong networks with others in terms of cooperation. Most businesses
would not move out of Charleville or relocate within the town if there was another flood event. Whilst
the number who may consider relocation is low, the impact of 18% of businesses moving due to
concerns about future floods could have a large impact on the town. Businesses saw cost as a barrier in
terms of preparing for future floods, they have other things to think about apart from floods. They
believed the community and households could be better prepared for future flood events (Figure 9).
Few businesses indicated they intend joining groups to discuss flood risk. Many were unsure how
prepared different government and community groups were for future floods.
The community’s adaptive capacity could be vastly improved by solving the Bradley‘s Gully
problem and implementing other mitigation measures and more river height gauging stations to
improve monitoring and reduce flood risk. To enable residents and businesses to access more
affordable flood insurance, documentation may be needed to persuade the insurance industry of the
reduce flood risk due to new mitigation works, better flood modelling and additional river height gauge
monitoring tools.
18
0
10
20
30
40
50
60
70
Households Community Local
Hospital
Utility
Providers
Social
welfare
orgns
Very prepared Somewhat Not very
Not at all Don't know
% Response
0
10
20
30
40
50
60
70
80
90
Local Govt State Govt Commonwealth
Govt
Met Bureau
Very prepared
Somewhat
Not very
Not at all
Don't know
% Response
Fig. 9 How prepared householders believe Fig. 10 How prepared householders believe
these Charleville groups are for future floods (n=55) Government institutions are for future floods
(n ranges from 54-55)
19
3.7 Recommendations by Participants to Better Cope with Future Floods
Future actions recommended by study participants are summarised in Table 2 below. Institutions
suggested improved catchment flood modelling and planning is needed, better warning systems; further
specific mitigation measures, best practice catchment management; localized decision-making; ongoing
publishing of information and education; greater departmental cooperation; managing onlookers; more
commitment from insurance companies; employing more apprentice plumbers and promoting rail as a
service option.
Table 2 Recommendations by study participants to better cope with future floods events in Charleville
Key characteristic
Recommendations by study participants
VULNERABILITY
Improve flood modelling and warning systems: Improve flood modelling and warning systems, more warning devices upstream in the Warrego River. Strategic placement of additional river height monitoring stations. Develop an improved warning system that can be heard all throughout the town, supplement with door knocking and consider sending SMS messages for flood warnings
Mitigation works: Engineering assessment of Bradley‘s Gully in Charleville and impact of upstream catchment practices. Investigate desilting of Bradley’s Gully (estimated cost $500,000); Regular monitoring, clearing and desilting of the river and Bradley‘s Gully. Install more river height reading stations on Bradley’s Gully, Warrego River and Nieve Rivers (estimated cost $50,000-$100,000)
More affordable insurance products: support with evidence of improved mitigation works additional river height monitoring stations
Animal housing during floods: Set aside areas for use in floods to house domestic and rural stock, so different types of dogs, house cattle, etc., can be separated to reduce animals deaths
Install evacuation signs: eg., Erect signs saying eg., Evacuation Area 1 so residents know where they need to go
Map vulnerable populations and regularly communicate info in the media: Be more targeted in evacuations with plans showing the location of vulnerable populations. Maintain regular information in the media re what needs to be done and what different people‘s roles are; ensure one person is the key contact for all flood information
RESILIENCE
Promote resident responsibility to prepare for floods: Promote the importance of self-protective behaviour
Additional professionals to help with overtime: Provide relief staff eg., nurses, police and key professionals to help during flood events to manage overtime and staff fatigue.
ADAPTIVE CAPACITY
Developing info resources: Develop info which lists who they call if they need help and detailing what they can do to prepare for, Regular community education program
Resources for new people to area: Develop flyers on what to do to prepare for floods for new people to the town, including information translated into other languages for migrants
Continue with translations of information for non-English speakers: continue translating important materials and investigate the possibility having more translators in Charleville
Swift-water and other flood boat training: Provide swift-water rescue training for SES volunteers and Fire & Rescue personnel. Review all the major training eg., flood boat training for 3 levels - flood and fast moving water. Ensure the Queensland Ambulance Service (QAS) is in the communication network of organisations that receive information on roads cut to help them plan their service delivery. Road cuts can severely impede the work of the Charleville QAS who do not have helicopters permanently based at Charleville to get to sites.
Planning and partnerships: Annual mock exercises, training and update recovery plans, Annual, and continuous training, including of new staff. Planning for major events, detailing the chain of command, reviewing what worked well and what didn't. Allocating staff to support local government and help the SES and work with the local people
Do not discard furniture/whitegoods, managing clothing donations: People not throw out furniture but use this furniture until they obtain new furniture. Also, sometimes whitegoods can be repaired. People need to be dissuaded from sending clothes to the Charleville railway station, as during the 2008 flood around 30 crates of donated clothes arrived there that were not needed and they did not have the people to handle all those clothes. Clothing donations need to be sent through to an organised group.
Replace financial handouts with food and food vouchers: Discontinue financial handouts and replace with food and food vouchers
20
4 Conclusions
This historical case study is one in a series of case studies of extreme events in Australia investigating
the adaptive capacity of communities, and includes a study of the 2008 flood event in Mackay (Apan et
al. 2010). These case studies seek to understand how communities coped with different extreme events
and their capacity to cope should more frequent events occur due to climate change.
Our study makes a significant contribution to understanding how a community that is regularly
flooded copes, their characteristics of vulnerability and adaptive capacity, resilience and attitude to risk.
These characteristics are likely to be present in other small inland rural communities in Australia and
developed countries facing extreme events. The Charleville population exhibited a strong sense of
personal responsibility to protect themselves and reduce their vulnerability and, in terms of resilience, a
determination to remain in the town even if another flood event occurred. Their supportive community
ensured that most people were able to evacuate to family or friends rather than to evacuation centres
and study participants recommended a number of actions to improve their town’s adaptive capacity.
The small community of Charleville with just over 3000 people demonstrated that they are staunchly
resilient and possess high levels of social capital in the way their community operates and how they
collectively responded to the flood event. They indicated that they are prepared to meet the challenges
associated with future flood risk, despite the likelihood of continued risk to their community,
businesses and institutions.
Charleville was found to be a useful model of climate change adaptation and how towns facing
natural disasters should organise and operate. The findings of this study have implications for the
international context.
Firstly, it was found that the strength and quality of connections and relationships within and
between social and institutional networks in areas regularly affected by this natural disaster can
substantially impact on a community’s ability to cope and recover. Communities in high risk regions
need reliable, quality scientific monitoring and modelling data to inform them about the risks and the
probabilities associated with these risks. These data can aid preparation of accurate warning
information and more targeted evacuations. Residents and organisations need to receive timely
information that is accurate and which they are confident about. Land use planning also needs to be
informed by appropriate and regular scientific data and debate.
Secondly, the increasing number of natural disaster events occurring worldwide means that additional
financial and resource pressures are being placed on governments to support mitigation and recovery.
In some locations they may need to support multiple disaster events in the same location at short time
intervals. Hence the community needs to be convinced that they have a personal responsibility to
prepare for the event and for personal mitigation activities. They need to be advised about the structural
and non-structural options available to them, what they cost and how effective they are likely to be.
Government agencies with the major responsibility for protecting residents need to ensure mitigation
works are at least adequate and that the insurance industry is providing fair and equitable products to
areas affected by natural hazards.
Thirdly, strain on professional staff working excessive overtime during these disaster events can lead to
fatigue and agencies need to ensure adequate relief staff is made available and budgeted for.
Fourthly, community members who have experienced flood events are better prepared and therefore it
is important to provide regular information to new people to the affected area, and have this
information translated into other languages for migrants. Such preparation can reduce losses and
possibly save lives. People need to know what they can do and who they can contact in an emergency.
Fifthly, vulnerable populations such as aged care residents and animals, including domestic animals,
need to be housed in temporary accommodation that it suitable for their needs, with appropriate
21
facilities. Spatial mapping and listings of vulnerable populations are also needed to ensure more
targeted evacuations.
Sixthly, the importance of testing warning systems was highlighted in this study as some Charleville
community members were unable to hear the warning siren, and hence door-knocks were
recommended as an additional strategy. This highlights the importance of regularly testing and
evaluation of warning and mitigation systems.
More studies are needed to quantify the social capital of societies affected by natural disasters and their
characteristics of vulnerability, resilience and adaptive capacity, as well as to investigate the
psychological effects of floods and how these might impact on the decision to stay or to migrate
elsewhere, amongst other aspects related to psychological stresses and impacts. This study was carried
out in conjunction with an historical case study of the 2008 flood in Mackay, Queensland.
Acknowledgements: Our appreciation is extended to the National Climate Change Adaptation
Research Facility (NCCARF) for funding this work. We gratefully appreciate the participation of
Charleville householders, businesses and institutional personnel in our study. We also wish to thank
Douglas Magendanz, Stephen Hinkler and Peter Baddiley for providing useful information for this
study; Allan Pemberton (Murweh Shire Council) for his on-the-ground assistance in Charleville, Ernest
Dunwoody and David Liddell for their help with data collection, and Peter Whalley and Glenys
Baldwin for useful discussions.
22
References
Anderson-Berry L, King D (2005) Mitigation of the Impact of Tropical Cyclones in Northern Australia
through Community Capacity Enhancement. Special issue of Mitigation and Adaptation Strategies for
Global Change, 10:367–392.
Apan A, Keogh, DU, King D, Thomas M, Mushtaq S, Baddiley P (2010). The 2008 Floods in
Queensland: A Case Study of Vulnerability, Resilience and Adaptive Capacity. Report for the National
Climate Change Adaptation Research Facility, Gold Coast, Australia.
Australian Broadcasting Commission (ABC) Western Queensland (2008) Charleville town inundated it
water from Bradley Gully. http://www.abc.net.au/local/stories/2008/01/18/2141596.htm.
Australian Broadcasting Commission (ABC) 2010 Hundreds evacuated from flood-bound Charleville.