52
Resilient Distribution System PI: Zhaoyu Wang, GRA: Shanshan Ma Department of Electrical and Computer Engineering Iowa State University Iowa State University

Resilient Distribution System
PI: Zhaoyu Wang, GRA: Shanshan Ma
Department of Electrical and Computer Engineering
Iowa State University
Iowa State University

Iowa State University
Outline
• Motivation and Introduction
• Research Activities
• Subtopic 1: Optimal line hardening strategy for distribution systems
• Subtopic 2: Resilience-oriented design of distribution systems
• Research Publications
• Reference
2

Iowa State University
Motivation: Impacts of Extreme Weather Events
3
• Climate ChangeThe probability of occurrence
The intensity
Extreme weather event
The failure frequency
The power outages
Distribution Grids
(Hurricane, ice-storm, flood, etc)
Power poles pulled down by Irma[3]
Substation flooded by Irma [4]
South Florida Night
before and after
Irma [3]
South Florida Night before
Irma [5]South Florida Night After
Irma [5]
• Example: Hurricane Irma in September 2017
• Left 6.7 million Floridians without power-65% of all customers in Florida [1]
• Its overall damage cost reached to approximately $50 billion [2]

Iowa State University 4
Motivation: Current Situation of Distribution Systems
As power engineers, how can we improve grid resilience to
survive from extreme weather events?
• Most existing distribution systems are designed and maintained for normal
weather conditions
• The classic reliability principles cannot guarantee the lights on under
extreme weather events
• U.S. power grids are now old and outdated
• Utilities upgrade grids based on experiences, patrols, and observations

Iowa State University
• A distribution system is considered to be resilient if it is able to anticipate, absorb, adapt to, and/or rapidly recover from a disruptive event [6].
5
Introduction: The Resilience of Distribution System
Fig.1. A general system performance curve of a distribution system
following an extreme weather event
• Event prevention stage: Resistant
capability
• Damage propagation stage: Absorptive
and adaptive capacity
• Restoration stage: Recovery capability
Iowa State University 6
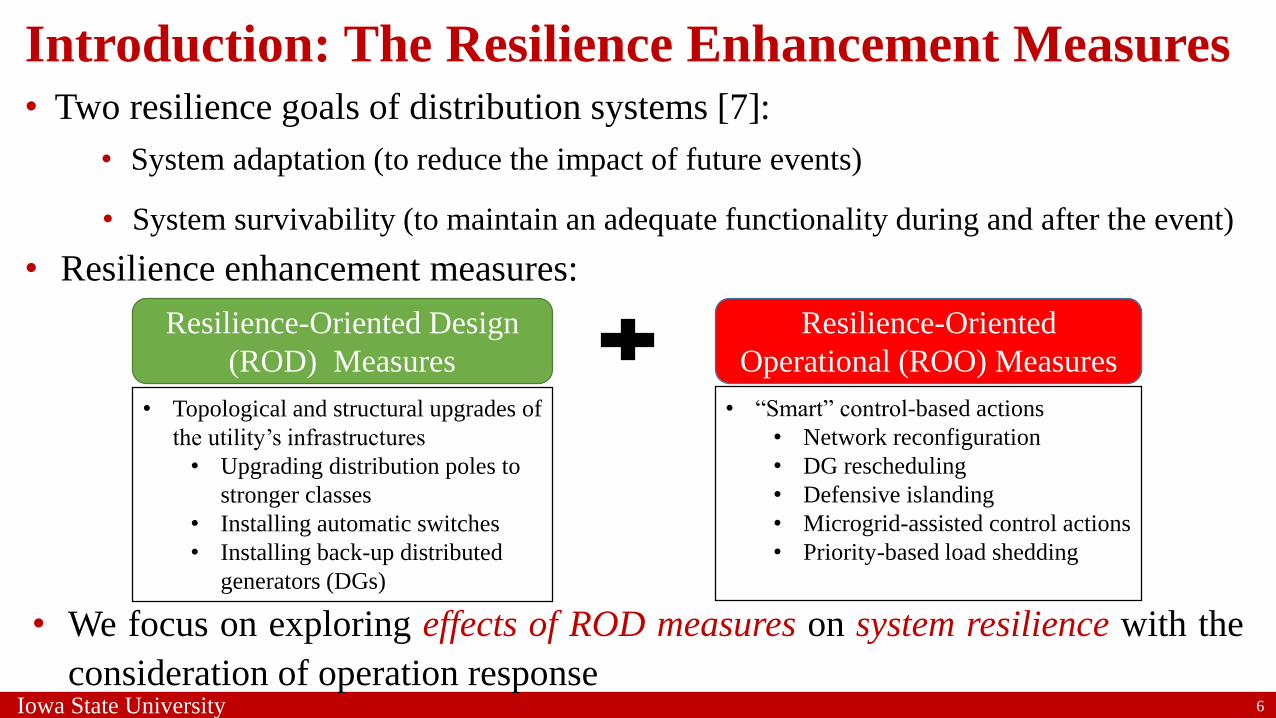
Introduction: The Resilience Enhancement Measures
• Resilience enhancement measures:
• Two resilience goals of distribution systems [7]:
Disaster Response
& Risk Management
Resilience-Oriented Design
(ROD) Measures
Resilience-Oriented
Operational (ROO) Measures
• Topological and structural upgrades of
the utility’s infrastructures
• Upgrading distribution poles to
stronger classes
• Installing automatic switches
• Installing back-up distributed
generators (DGs)
• “Smart” control-based actions
• Network reconfiguration
• DG rescheduling
• Defensive islanding
• Microgrid-assisted control actions
• Priority-based load shedding
• System adaptation (to reduce the impact of future events)
• System survivability (to maintain an adequate functionality during and after the event)
• We focus on exploring effects of ROD measures on system resilience with the
consideration of operation response

Iowa State University
Subtopic 1: Optimal line hardening strategy for distribution systems
• Problem Statement
• Literature Review
• Methodology
• Tri-level Robust Optimization Model
• Mathematical Formulation
• Solution Method
• Case Study
• Conclusion
7

Iowa State University
Problem Statement
8
• We propose an optimal hardening strategy to enhance the resilience of power distribution
networks against extreme weather events, considering the time-varying uncertainty of
the extreme weather events and the failure probabilities of hardened distribution lines
• There are two major questions on distribution grid hardening[1]:
• How to prioritize distribution lines for hardening with limited budget
• What hardening measure should be applied to each line
• The extreme weather events and their negative effects are uncertain.
• Occurrence and traveling path
• Damage (line failure)

Iowa State University 9
Literature Review
• Salman et al. in [8] proposed targeted hardening strategy to improve distribution system
reliability
• Utilities: experiences, patrols and observation
• Kuntz et al. in [9] proposed a vegetation management scheduling algorithm (optimal
time and location)
• Yuan et al. in [10] proposed a robust optimization model
• Drawbacks:
• only consider a single hardening strategy
• assume the hardened components will have zero failure probability

Iowa State University
Methodology
10
• Use tri-level robust optimization to enhance the resilience of
distribution networks against extreme weather events.
• Three hardening measures
• Upgrading distribution poles with higher classes
• Vegetation Management
• The combination of both
• Use a polyhedral set to represent damage uncertainty considering
the failure probabilities of hardened lines

Iowa State University 11
Tri-level Robust Optimization Model
• First stage (Defender): identify hardening strategies
Minimize: Hardening Investment Cost
Determine:
Maximize: The Damage
Determine:
Minimize: Load Shedding Cost
Determine:
The First Level
System planner
The Second Level
Extreme weather events
The Third Level
System Opterator
Distribution lines to be hardened
The failures of distribution lines
Load shedding
• Second stage (Attacker): find the worst
weather scenario
• Third stage (Defender): minimize load
shedding

Iowa State University 12
Mathematical Formulation
Objective:
Minimize the hardening investment
and the projected load shedding cost
under worst weather scenarios
First Stage Second Stage Third StageHardening Cost Load Shedding CostLine Damage
. . :s t
Hardening investment budget constraint
Hardening measure selection constraint
whether k-th hardening strategy is selected (1) or not at line (i, j)
First stage Variable:
First stage Constraints:

Iowa State University 13
Mathematical Formulation
Second stage decision variables:
Second stage constraints:
Uncertainty budget constraint: • A line with lower failure probability takes up
more uncertainty budget if it fails
• If the failure probability of a line is zero, then
it takes up infinitely large uncertainty budget.
Repair time constraint: • If the line ij starts to be out of service at time
st, it remains failed until being repaired.
Hardening strategy constraint: • The failure of a line being hardened by a
specific strategy can only occur if that
strategy is selected in the first stage.
Line failure time limit: • Line failure only occurs once during the
extreme weather event
line status at time t: damaged (1) or not (0)
whether line ij hardened by the kth hardening
strategy is failed (1) or not (0) at time t
Iowa State University
Power balance constraint
14
14
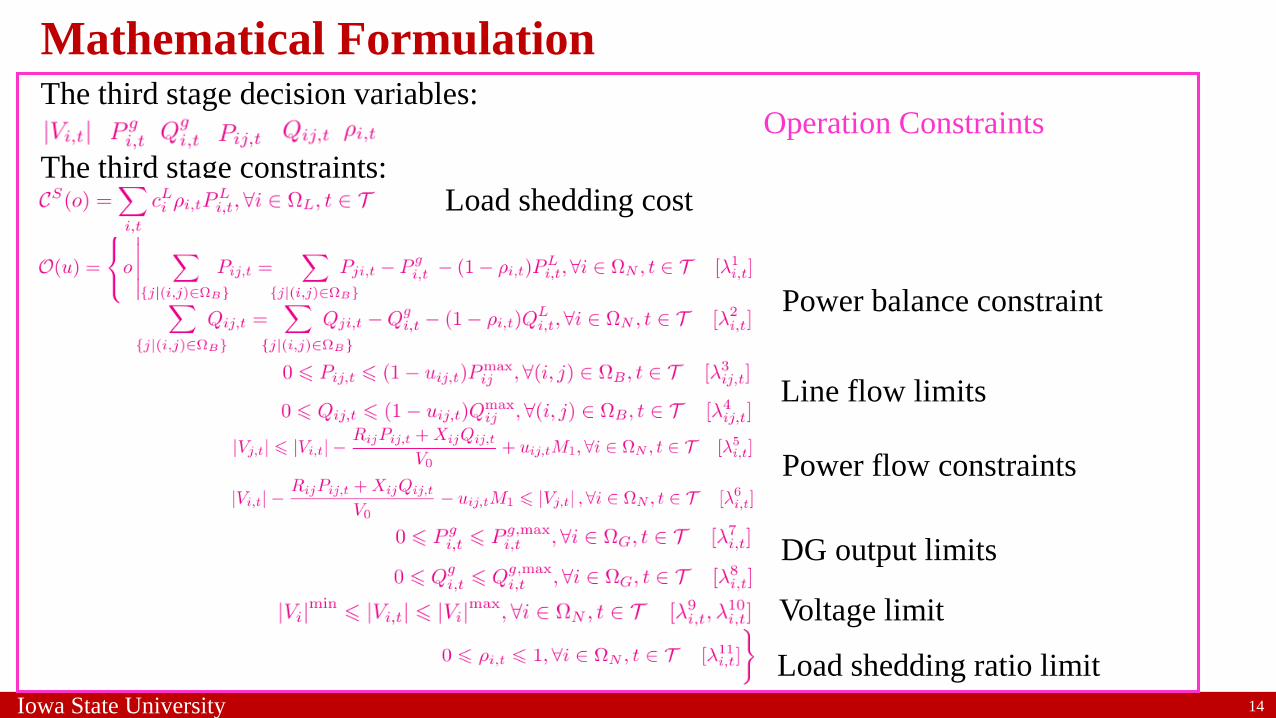
The third stage decision variables:
The third stage constraints:Load shedding cost
Line flow limits
Power flow constraints
DG output limits
Voltage limit
Load shedding ratio limit
Operation Constraints
Mathematical Formulation
Iowa State University 15
15
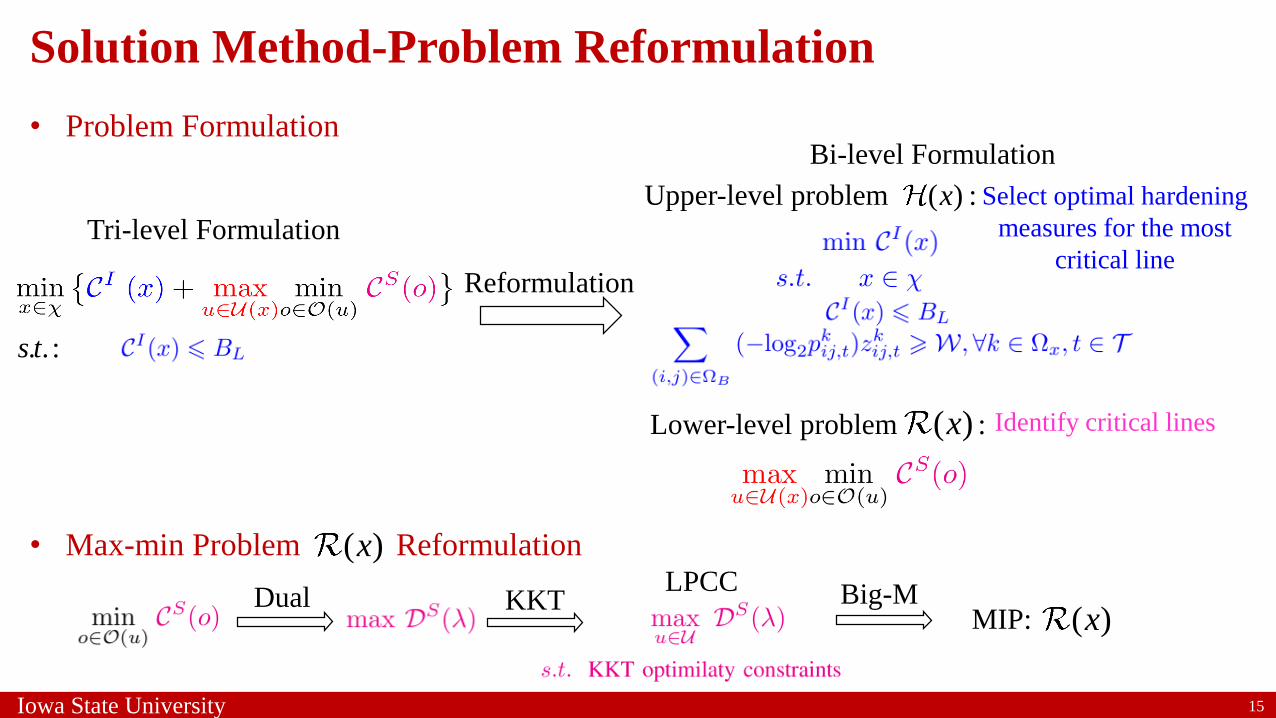
Solution Method-Problem Reformulation
Bi-level Formulation
Reformulation
• Problem Formulation
. . :s t
Tri-level Formulation
• Max-min Problem Reformulation
Dual
( )x
KKTLPCC Big-M
MIP: ( )x
Upper-level problem :( )x Select optimal hardening
measures for the most
critical line
Lower-level problem :( )x Identify critical lines
Iowa State University 16
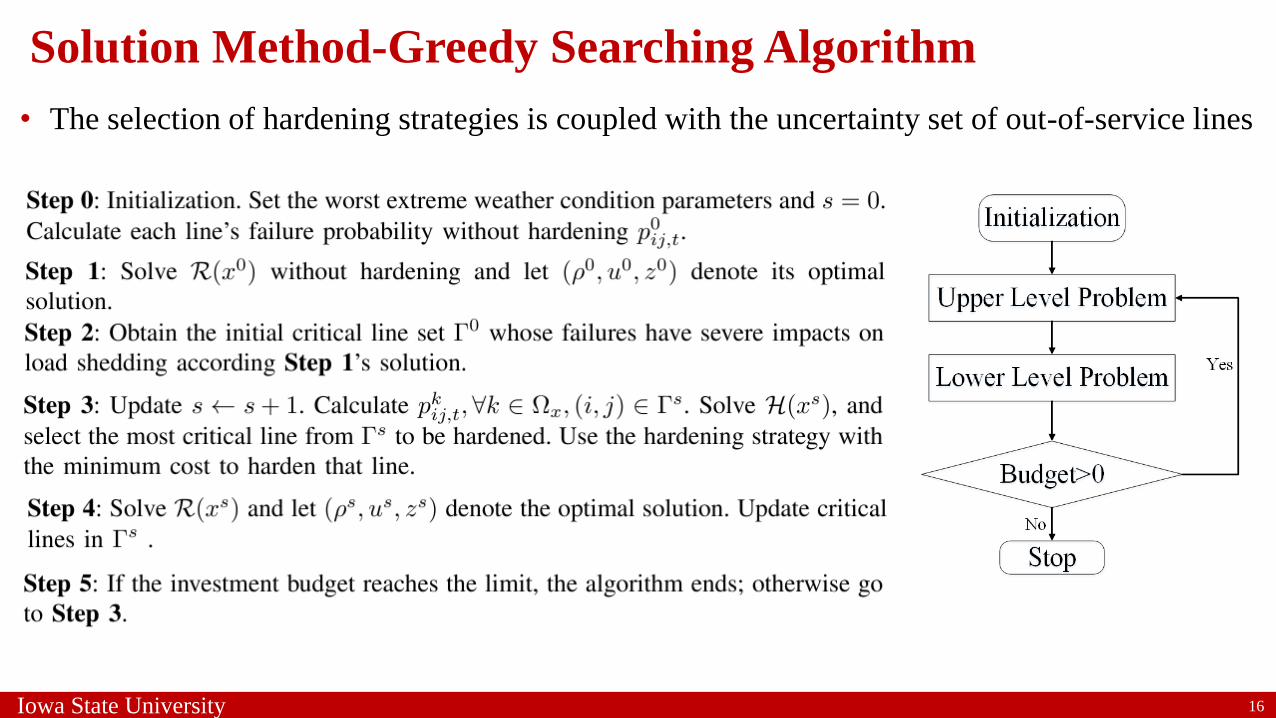
Solution Method-Greedy Searching Algorithm
• The selection of hardening strategies is coupled with the uncertainty set of out-of-service lines

Iowa State University 17
Case Study: A Modified Electric Power Research
Institute (EPRI) Test Circuit
• This system has a 74-mile primary circuit that supplies 3885 customers.
• There are 68 lines and 69 nodes in the primary network.
• The total load demand at peak is 30.43MW
• The total load shedding cost is $51, 832, 148.26 before hardening

Iowa State University
Case Study 1: With/Without Hardening
18
Iowa State University
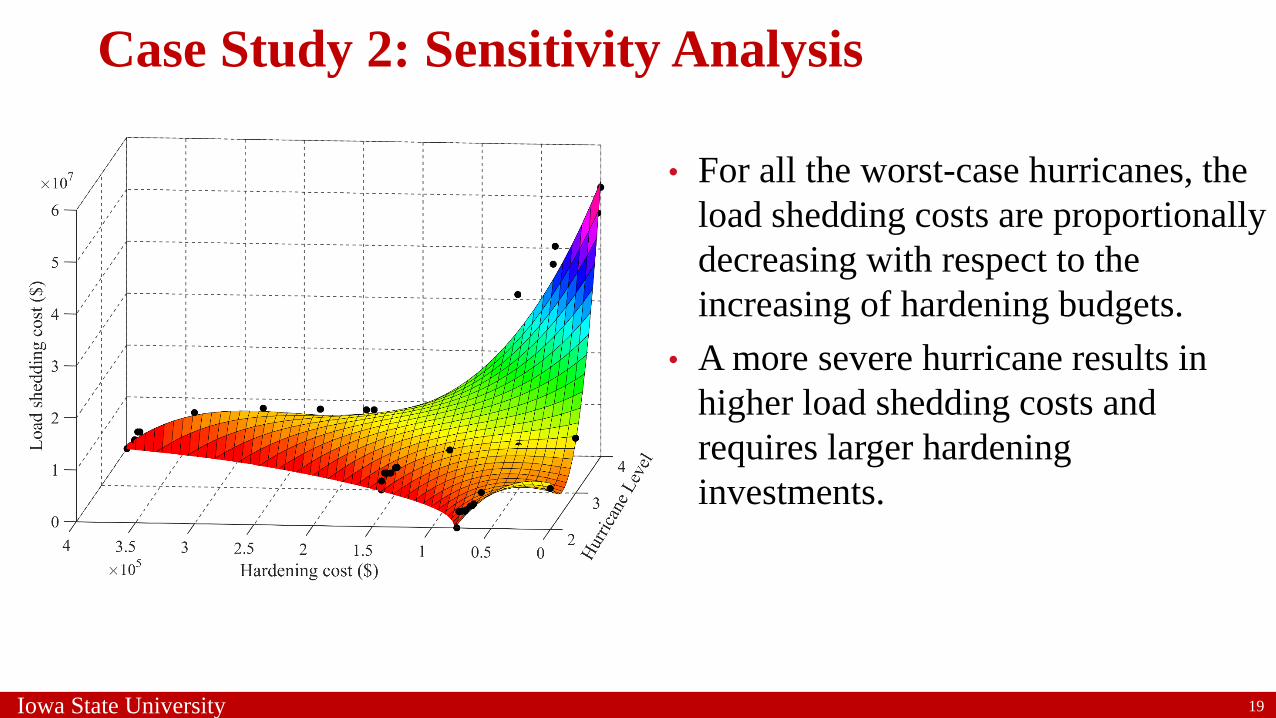
Case Study 2: Sensitivity Analysis
19
• For all the worst-case hurricanes, the
load shedding costs are proportionally
decreasing with respect to the
increasing of hardening budgets.
• A more severe hurricane results in
higher load shedding costs and
requires larger hardening
investments.

Iowa State University
Conclusion
20
• A new approach is proposed for hardening distribution systems to protect against extreme weather events.
• The problem is formulated as a tri-level mixed-integer linear program, and then reformulated as a bi-level model.
• The proposed model is tested on a modified EPRI test circuit.
• Numerical results show that the proposed model can assist utilities to identify optimal hardening strategies to mitigate systems’ vulnerability to extreme weather.

Iowa State University
Subtopic 2: Resilience-Oriented Design of Distribution Systems
• Problem Statement
• Literature Review
• Research Objective
• Stochastic Decision Process of ROD Problem
• Mathematical Formulation of ROD Problem
• Solution Algorithm
• Case Study
• Conclusion
21

Iowa State University
Problem Statement
22
• Some spatial-temporal correlations exist among ROD decisions, extreme weather
events, and system operations
• Occurrence, intensity and traveling paths of events are uncertain
• Physical infrastructure damage statuses are affected by both extreme weather event and ROD
decisions (decision dependent uncertainty)
• ROD decisions affect system recovery and the associated outage/repair costs
• A time-varying interaction exists between structural damages and electric outage
propagation
• Difficult to capture the entire failure-recovery-cost process of distribution
systems during and after an extreme weather event.
• How to optimally apply ROD measures to prevent distribution system from
extensive damages caused by extreme weather events
Iowa State University
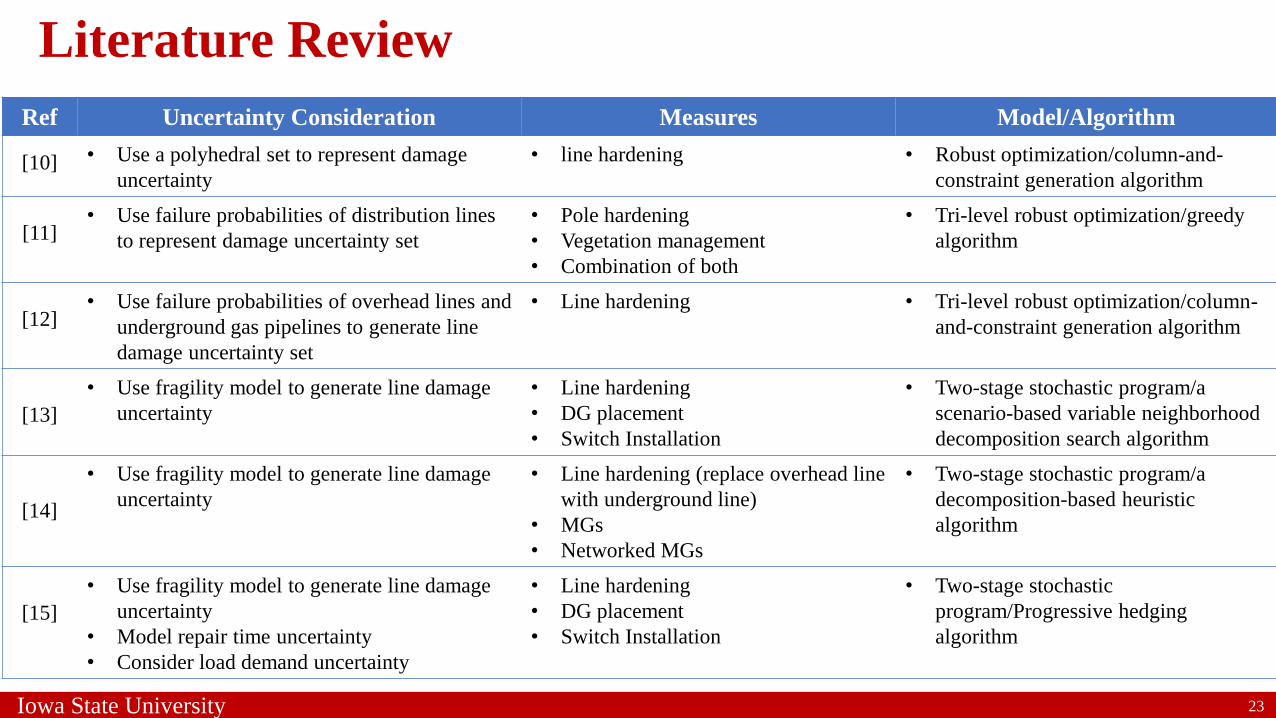
Literature Review
Ref Uncertainty Consideration Measures Model/Algorithm
[10] • Use a polyhedral set to represent damage
uncertainty
• line hardening • Robust optimization/column-and-
constraint generation algorithm
[11]• Use failure probabilities of distribution lines
to represent damage uncertainty set
• Pole hardening
• Vegetation management
• Combination of both
• Tri-level robust optimization/greedy
algorithm
[12]• Use failure probabilities of overhead lines and
underground gas pipelines to generate line
damage uncertainty set
• Line hardening • Tri-level robust optimization/column-
and-constraint generation algorithm
[13]
• Use fragility model to generate line damage
uncertainty
• Line hardening
• DG placement
• Switch Installation
• Two-stage stochastic program/a
scenario-based variable neighborhood
decomposition search algorithm
[14]
• Use fragility model to generate line damage
uncertainty
• Line hardening (replace overhead line
with underground line)
• MGs
• Networked MGs
• Two-stage stochastic program/a
decomposition-based heuristic
algorithm
[15]
• Use fragility model to generate line damage
uncertainty
• Model repair time uncertainty
• Consider load demand uncertainty
• Line hardening
• DG placement
• Switch Installation
• Two-stage stochastic
program/Progressive hedging
algorithm
23

Iowa State University
Research Objective
24
• Develop a new modeling and solution methodology for the ROD of
distribution systems against extreme weather events
• Develop a stochastic decision process to describe the spatio-temporal
correlations of ROD decisions and uncertainties
• Formulate a two-stage stochastic mixed-integer linear program (SMILP) to
capture the impacts of ROD decisions and uncertainties on system’s
responses to extreme weather events
• Design solution algorithm for solving the above problems

Iowa State University
Stochastic Decision Process of ROD Problem
• Overview
• ROD Measures
• Uncertainty Modeling
25

Iowa State University 26
Overview
• ROD problem is modeled as a two-stage stochastic decision process:
• Planner makes ROD decisions
• The operation uncertainties are resolved during the extreme weather event
• Operator makes the operation decisions

Iowa State University 27
ROD Measures
• Hardening poles:
• Strengthening vulnerable components
• 6 pole types
• Pole stress ( )1 > 2 > 3 > 4 > 5 > 6
• Installing backup DGs
• Increasing adequacy of power supply
• Adding sectionalizers
• Increasing topological flexibility
Fig.1. Pole types

Iowa State University 28
Uncertainty Modeling
Fig.1. The structure of uncertainty space: independent observable
random variables/processes (highlighted in red) + deterministic
casual connections (parameterized by the first-stage decision).
• Consider three groups of random
variables that have direct impacts
on the evolution of the system
operation state
• Line damage status
• Repair cost
• Load demand

Iowa State University 29
(a) Line Damage Status Uncertainty
Damage status
Wood fiber stress
Repair timeWind speed
Structural limit state function (G)
=Pole resistance (R) – Wind load (S)
Wind speed Wood fiber stress
Damaged pole counterDamaged pole counter
Pole hardening decision

Iowa State University 30
(b) Repair Cost Uncertainty
Damaged pole counterDamaged pole counter
Structural limit state function (G)
=Pole resistance (R) – Wind load (S)
Wind speed Wood fiber stress
Wood fiber stress
Wind speed
Repair cost
Pole repair cost
Pole hardening decision

Iowa State University 31
(c) Load Demand Uncertainty
Fig.2. load profile shape at the substation (root node)
Fig.1. load demand uncertainty

Iowa State University
Mathematic Formulation of ROD Problem
• Overview
• First-stage Problem
• Second-stage Problem
32

Iowa State University
Overview
33
• Investment Stage: identify the optimal ROD decisions
• Operation Stage: achieve self-healing operation
• need a mathematical formulation to model the full power
outage propagation process
• need an analytical optimization to sectionalize a
distribution network into multiple self-supplied MGs
while maintaining their radial network typologies

Iowa State University
First-Stage Formulation
34
Objective:
Minimize the ROD investment cost and the
expected cost of the second stage in
realized extreme weather events
. . :s t
First stage ROD variables:
whether hardening line (1) or not (0)
whether installing DG at node (1) or not (0)
First stage constraints:
Hardening strategy limit DG number limit
Switch installation constraint
The expected cost of the second stage
whether adding a sectionalizer at the end of line
(1) or not (0)

Iowa State University
• Model the power outage propagation constraints
35
Second-Stage Problem: Technique Outline (1)
• Add a virtual node in the middle of each branch
• Apply a symmetric fault to the virtual node if the
line is damaged
• Set the voltage feasible region:
• Fully curtail a load when its voltage magnitude is zero
• Set loading limits to all branches and penalize
load shedding amount in the objective
Fig.1. The illustrative example for isolating a fault
• Customers at the nodes that directly connected to the damaged line will be out of service
• Propagation process:
• Sectionalizers or breakers only exist in certain line sections
Iowa State University
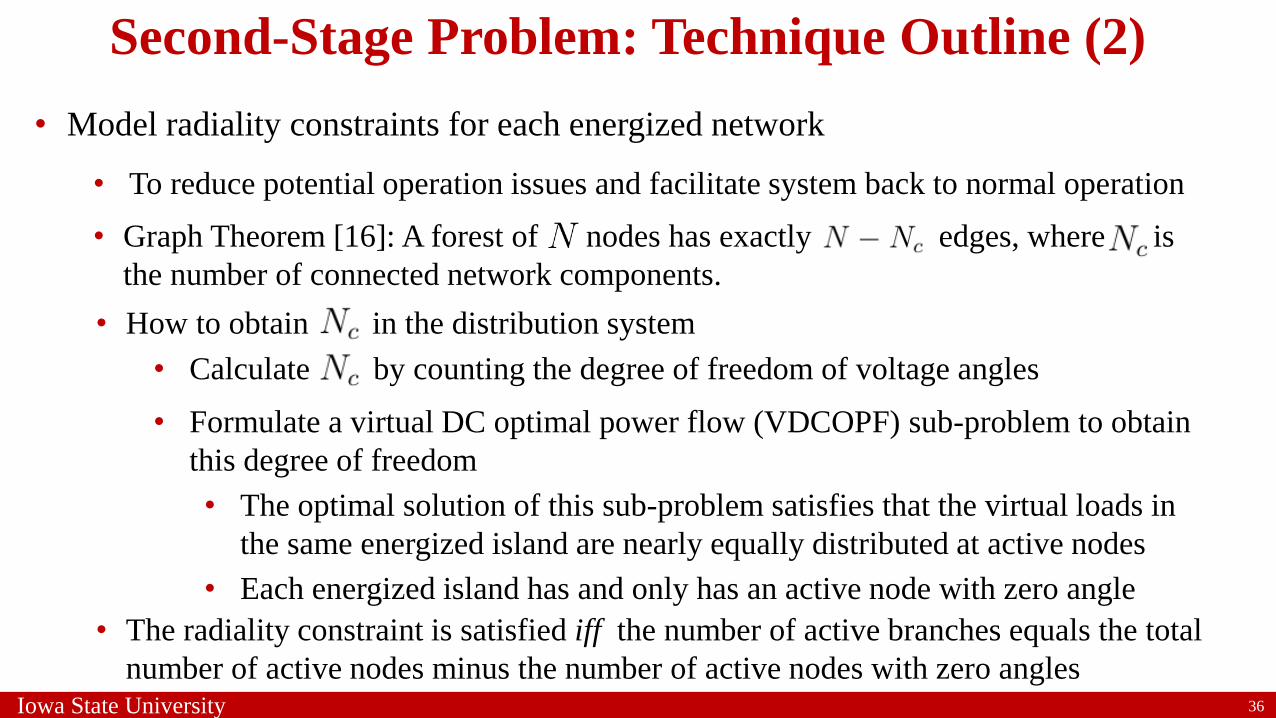
• Model radiality constraints for each energized network
36
Second-Stage Problem: Technique Outline (2)
• Graph Theorem [16]: A forest of nodes has exactly edges, where is
the number of connected network components.
• The radiality constraint is satisfied iff the number of active branches equals the total
number of active nodes minus the number of active nodes with zero angles
• How to obtain in the distribution system
• Calculate by counting the degree of freedom of voltage angles
• Formulate a virtual DC optimal power flow (VDCOPF) sub-problem to obtain
this degree of freedom
• The optimal solution of this sub-problem satisfies that the virtual loads in
the same energized island are nearly equally distributed at active nodes
• Each energized island has and only has an active node with zero angle
• To reduce potential operation issues and facilitate system back to normal operation
Iowa State University
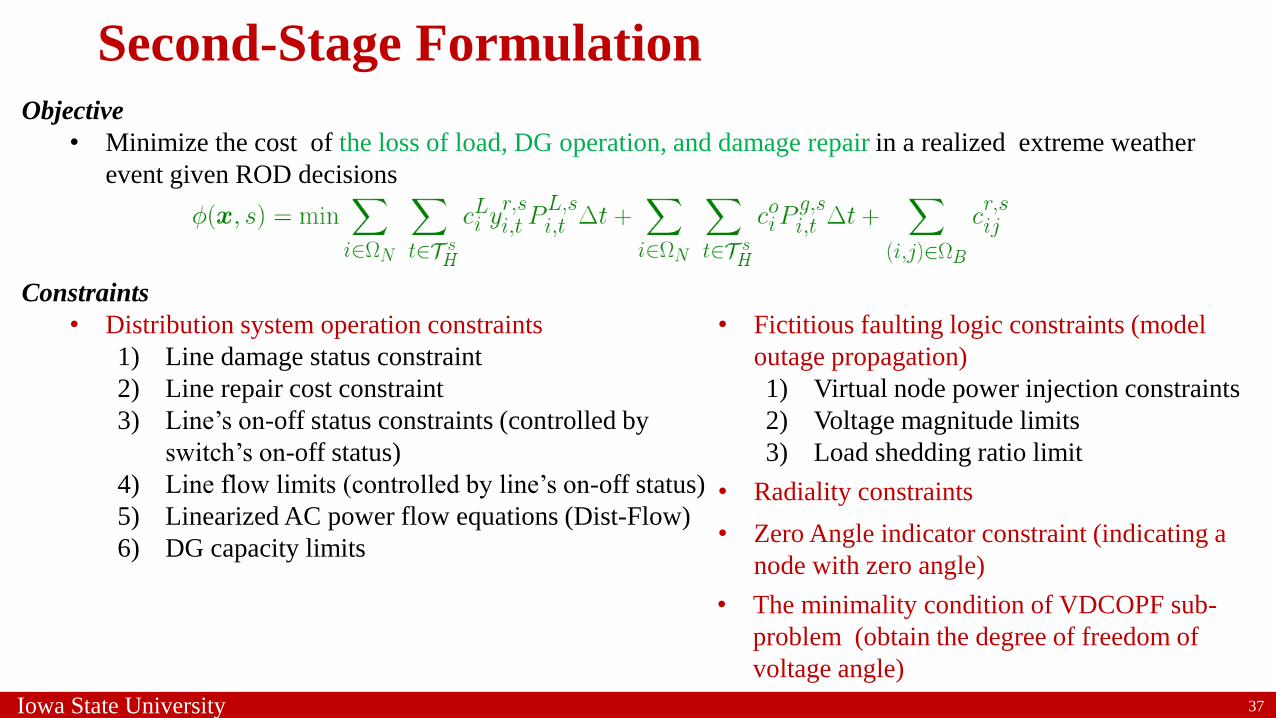
Second-Stage Formulation
37
Objective
• Minimize the cost of the loss of load, DG operation, and damage repair in a realized extreme weather
event given ROD decisions
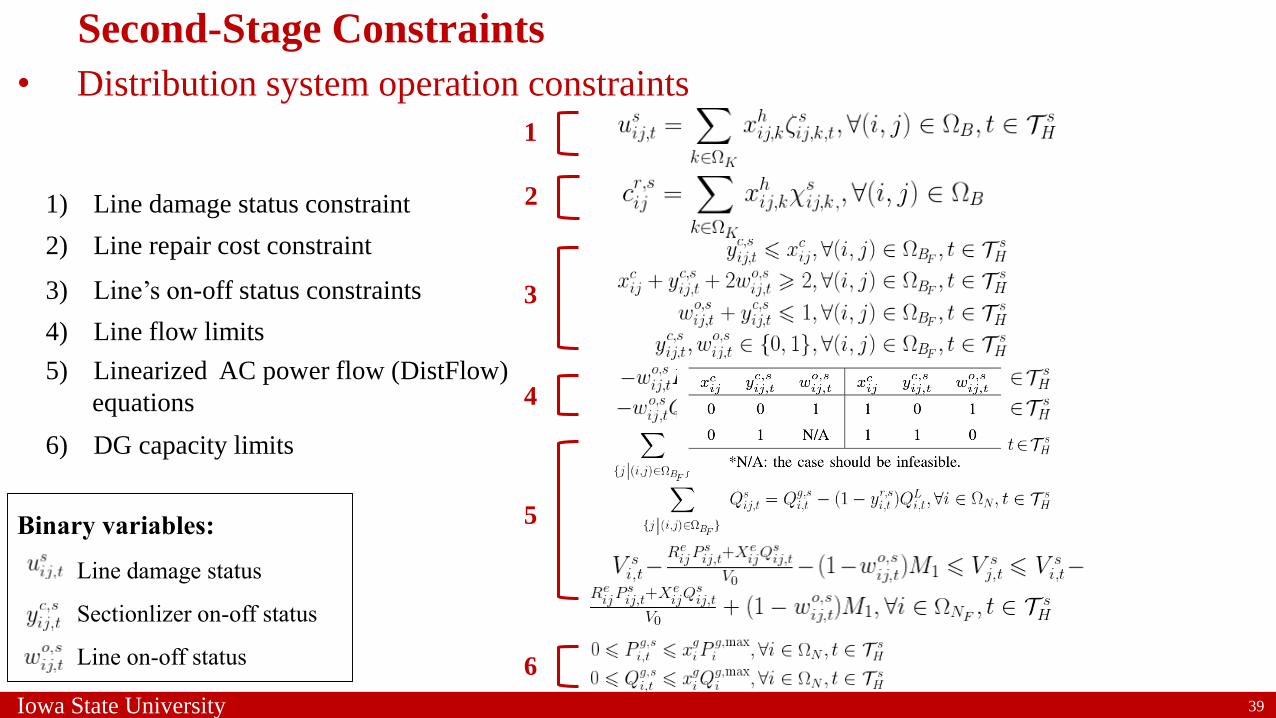
Constraints
• Distribution system operation constraints
1) Line damage status constraint
2) Line repair cost constraint
3) Line’s on-off status constraints (controlled by
switch’s on-off status)
4) Line flow limits (controlled by line’s on-off status)
5) Linearized AC power flow equations (Dist-Flow)
6) DG capacity limits
• Fictitious faulting logic constraints (model
outage propagation)
1) Virtual node power injection constraints
2) Voltage magnitude limits
3) Load shedding ratio limit
• Zero Angle indicator constraint (indicating a
node with zero angle)
• The minimality condition of VDCOPF sub-
problem (obtain the degree of freedom of
voltage angle)
• Radiality constraints
Iowa State University 38
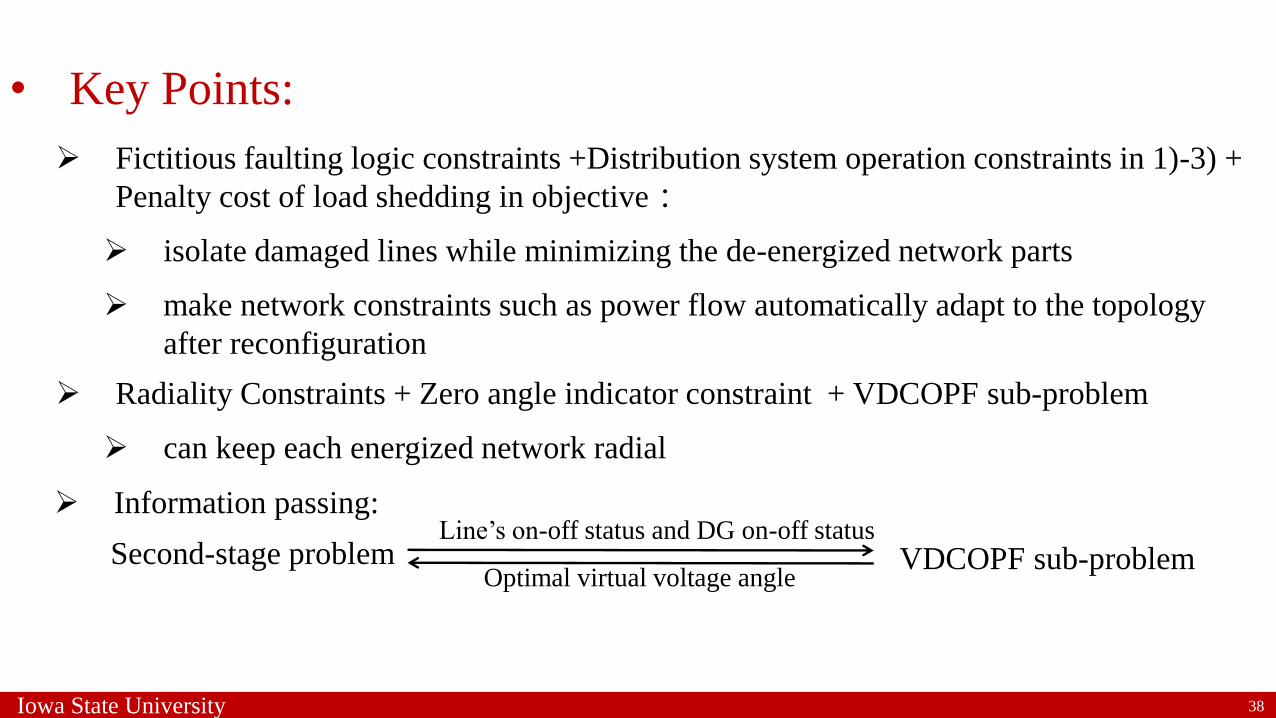
• Key Points:
Information passing:
VDCOPF sub-problemLine’s on-off status and DG on-off status
Optimal virtual voltage angleSecond-stage problem
Fictitious faulting logic constraints +Distribution system operation constraints in 1)-3) +
Penalty cost of load shedding in objective:
isolate damaged lines while minimizing the de-energized network parts
make network constraints such as power flow automatically adapt to the topology
after reconfiguration
Radiality Constraints + Zero angle indicator constraint + VDCOPF sub-problem
can keep each energized network radial
Iowa State University
• Distribution system operation constraints
39
1) Line damage status constraint
2) Line repair cost constraint
3) Line’s on-off status constraints
4) Line flow limits
5) Linearized AC power flow (DistFlow)
equations
6) DG capacity limits
6
5
4
3
2
1
Binary variables:
Line damage status
Sectionlizer on-off status
Line on-off status
Second-Stage Constraints

Iowa State University
• Fictitious faulting logic constraints
40
1) Radiality constraint
2) Voltage magnitude limits
3) Load shedding ratio limit
2
1
3
• Radiality constraints
1) Virtual node power injection
constraints
2) Active branch identification
constraint
Binary variables:
active node active branch
active node with zero voltage angle
1
2
• Zero angle indicator constraint
Second-Stage Constraints

Iowa State University
• The minimality condition of VDCOPF sub-problem
• To realize that a connected network component (healthy island) has one and only one degree of freedom of voltage angle under the condition of full DC power flow equations
41
• KKT optimality condition:

Iowa State University
Dual Decomposition Algorithm• A Compact Notation Form of ROD Model
42
• The Lagrangian relaxation with respect to the nonanticipativity constraint
• The lower bound of the Lagrangian relaxation (Lagrangian Dual)
where
(1)
(2)
(3)
(4)
• To induce a scenario-based decomposable structure, the copies of the
first-stage variables are introduced to create the following reformulation
Iowa State University
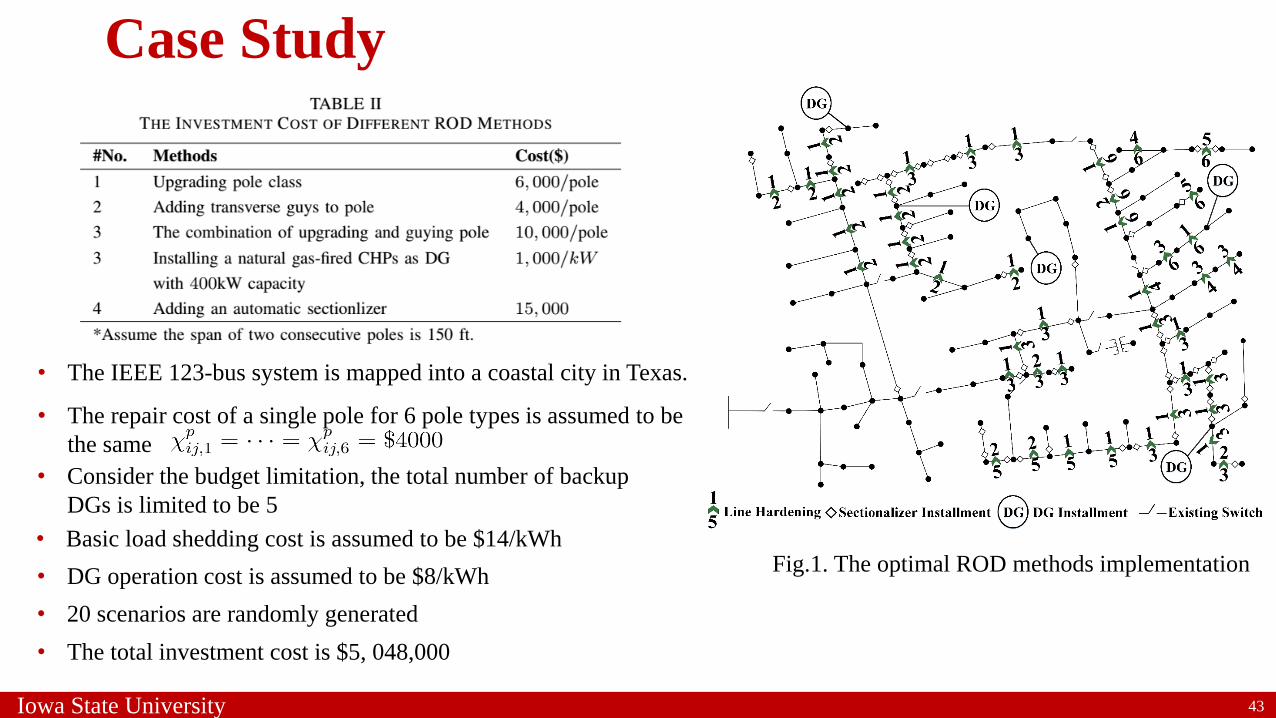
Case Study
43
Fig.1. The optimal ROD methods implementation
• The repair cost of a single pole for 6 pole types is assumed to be
the same
• Consider the budget limitation, the total number of backup
DGs is limited to be 5
• The IEEE 123-bus system is mapped into a coastal city in Texas.
• The total investment cost is $5, 048,000
• Basic load shedding cost is assumed to be $14/kWh
• DG operation cost is assumed to be $8/kWh
• 20 scenarios are randomly generated

Iowa State University
Simulating a pole damage status in a hurricane
44

Iowa State University
Case1: Comparison with and without ROD
45
Fig.1. The second stage cost comparison with and without ROD under different scenarios
• Compare the second stage cost from the hurricane hits the system to the point when
all damaged lines are repaired
• The expected second-stage cost with optimal ROD is 8.93% of that without ROD

Iowa State University
Case1: Comparison with and without ROD
46
• Compare the system resilience by the resilience curve, which can be expressed by the percentage of power-
served (POPS(t)):
Fig.1. The system resilience curve comparison
• The system with optimal ROD has stronger surviving ability to withstand hurricane and faster recovery
• DGs and automatic sectionalizers can contribute to mitigating the hurricane’s impact on the system

Iowa State University
Case2: The self-healing operation case
• To validate the novelty of our MILP formulation strategy to solve the challenges of self-healing operation
47
Fig.1. System’s self-healing operation at t = 10 Fig.2. System’s self-healing operation at t = 21

Iowa State University
Case 3: Computational Results
48
• It is assumed the relative optimality gap is 8%.

Iowa State University 49
Conclusions
• A new modeling and solution methodology for resilience-oriented design (ROD) of power
distribution systems against extreme weather events is proposed
• The spatial-temporal correlations among ROD decisions, uncertainty space, and system
operations during and after extreme weather events are well explored and established
• A two-stage stochastic mixed-integer model is proposed with the objective to minimize
the investment cost in the first-stage and the expected costs of the loss of loads, repairs
and DG operations in the second stage
• A scenario-based dual composition algorithm is developed to solve the proposed model
• Numerical studies on the 123-bus distribution system demonstrate the effectiveness of
optimal ROD on enhancing the system resilience

Iowa State University 50
Research PublicationsJournal Papers
1. S. Ma, S. Li, Z. Wang, and F. Qiu, “Resilience-Oriented Distribution System Design with Decision-Dependent Uncertainty,” IEEE Transactions on Power System, accepted, 2019.
2. S. Ma, L. Su, Z. Wang, and F. Qiu, “Resilience Enhancement of Distribution Grids Against Extreme Weather Events,” IEEE Transactions on Power System, vol. 33, no. 5, pp. 4842-4853, Sept. 2018.
3. S. Ma, B. Chen and Z. Wang, "Resilience Enhancement Strategy for Distribution Systems Under Extreme Weather Events," IEEE Transactions on Smart Grid, vol. 9, no. 2, pp. 1442-1451, March 2018.
Conference Paper
1. S. Ma, N. Carrington, A. Arif, and Z. Wang, “Resilience Assessment of Self-healing Distribution Systems Under Extreme Weather Events”, IEEE PES General Meeting, 2019 [Best Paper Award].
2. S. Ma, S. Li, Z. Wang, A. Arif, and K. Ma., “A novel MILP formulation for fault isolation and network reconfiguration in active distribution systems,” IEEE PES General Meeting, Portland, OR, 2018, pp. 1-5.
Iowa State University
Reference[1] A. L. Tyler Hodge, “Hurricane irma cut power to nearly two-thirds of florida’s electricity customers,” U.S. Energy Information Administration, Tech. Rep., 2017. [Online]. Available: https://www.eia.gov/todayinenergy/detail.php?id=32992[2] A. B. Smith, “2017 us billion-dollar weather and climate disasters: a historic year incontext,” NOAA Climate. gov [available online at: https://www. climate. gov/newsfeatures/blogs/beyond-data/2017-us-billion-dollar-weather-and-climate-disasters-historic-year,accessed 26 May 2018], 2018.
[3] https://www.cnbc.com/2017/09/11/irma-knocks-out-power-to-nearly-four-million-in-florida-utilities.html
[4] https://www.electric.coop/co-mo-electric-helping-hurricane-irma-repairs
[5] https://www.vox.com/science-and-health/2017/9/11/16290234/hurricane-irma-2017-power-outages-florida-miami-naples-keys-space
[6] A. Gholami, T. Shekari, M. H. Amirioun, F. Aminifar, M. H. Amini, and A. Sargolzaei, “Toward a consensus on the definition and taxonomy of power system resilience,” IEEE Access, vol. 6, pp. 32 035-32 053, 2018
[7] M. Panteli and P. Mancarella, “The grid: Stronger, bigger, smarter?: Presenting a conceptual framework of power system resilience,” IEEE Power Energy Mag., vol. 13, no. 3, pp. 58-66, May 2015.
[8] A. M. Salman, Y. Li, and M. G. Stewart, “Evaluating system reliability and targeted hardening strategies of power distribution systems subjected to hurricanes,” Reliability Engineering&System Safety, vol. 144, pp. 319- 333, Aug. 2015.
[9] P.A. Kuntz, R.D.Christie, and S. S.Venkata, “Optimal vegetation maintenance scheduling of overhead electric power distribution systems,” IEEE Trans. Power Deli., vol.17, no.4, pp.1164-1169, Oct. 2002.
[10] W. Yuan, J. Wang, F. Qiu, C. Chen, C. Kang, and B. Zeng, “Robust optimization-based resilient distribution network planning against natural disasters,” IEEE Trans. Smart Grid, vol. PP, no. 99, pp. 1-10, 2016.
[11] S. Ma, B. Chen, and Z. Wang, “Resilience enhancement strategy for distribution systems under extreme weather events,” IEEE Trans. Smart Grid, vol. PP, no. 99, p. 1, 2016.
[12] C. He, C. Dai, L. Wu, and T. Liu, “Robust network hardening strategy for enhancing resilience of integrated electricity and natural gas distribution systems against natural disasters,” IEEE Trans. Power Syst., vol. 33, no. 5, pp. 5787{5798, Sep. 2018.
[13] E. Yamangil, R. Bent, and S. Backhaus, “Resilient upgrade of electrical distribution grids,” in Twenty-Ninth AAAI Conference on Artificial Intelligence, Austin, Texas, USA, Jan. 2015, pp. 1233-1240.
[14] A. Barnes, H. Nagarajan, E. Yamangil, R. Bent, and S. Backhaus, “Resilient design of largescale distribution feeders with networked microgrids,” Electric Power Systems Research, vol. 171, pp. 150-157, 2019.
[15] S. Ma, L. Su, Z. Wang, F. Qiu and G. Guo, “Resilience Enhancement of Distribution Grids Against Extreme Weather Events,” IEEE Trans. Power Syst., vol. 33, no. 5, pp. 4842-4853, Sept. 2018.[16] R. K. Ahuja, T. L. Magnanti, and J. B. Orlin, “Network flows: theory, algorithms, and applications,” 1993.
51

Iowa State University 52
Thank You!Q & A


