First-Half 2017 Results News Release Page 1 of 16 Resilient First Half Revenue growth of 9.1% and 6.9% in constant currency Improving momentum in North America, good performance in Europe Fast-Growing Markets impacted by a decline in Brazil Mixed performance in Sunglasses & Readers division Healthy Free Cash Flow 3 generation Charenton-le-Pont, France (July 28, 2017 – 6:30 am) – The Board of Directors of Essilor International met yesterday to approve the financial statements for the six months ended June 30, 2017. The auditors have performed a limited review of the consolidated financial statements. Financial Highlights € millions June 30, 2017 Adjusted 4 June 30, 2016 Change % June 30, 2017 Reported Revenue 3,909 3,583 +9.1% 3,909 Contribution from operations 2 (% of revenue) 721 18.4% 677 18.9% +6.6% 720 18.4% Operating profit 670 646 +3.7% 611 Profit attributable to equity holders 433 416 +4.0% 391 Earnings per share (in €) 2.00 1.95 +2.7% 1.81 The income statement as of June 30, 2017 is adjusted for expenses accounted for in the financial statements due to the proposed combination with Luxottica in the amount of €59m on operating profit and €42m on group net profit. Commenting on these results, Hubert Sagnières, Chairman and Chief Executive Officer of Essilor, said: "The first half of the year marks another step forward in our mission to eradicate poor vision around the globe. Worldwide demand for better vision continues to grow and the strength of our business model, based on innovation, acquisitions and partnerships was demonstrated through continued progression in our results. The vast unmet need for vision correction and protection translate to exciting mid to long term opportunities, despite a more challenging near term market environment linked to the announcement of Essilor’s pending combination with Luxottica. We are in progress to finalize the agreement and are more confident and enthusiastic than ever about the opportunities ahead as we build the foundation for future growth.”
Transcript
F i r s t - H a l f 2 0 1 7 R e s u l t s
N e w s R e l e a s e
Page 1 of 16
Resilient First Half
Revenue growth of 9.1% and 6.9% in constant currency
Improving momentum in North America, good performance in Europe
Fast-Growing Markets impacted by a decline in Brazil
Mixed performance in Sunglasses & Readers division
Healthy Free Cash Flow3 generation
Charenton-le-Pont, France (July 28, 2017 – 6:30 am) – The Board of Directors of Essilor International
met yesterday to approve the financial statements for the six months ended June 30, 2017. The auditors
have performed a limited review of the consolidated financial statements.
Financial Highlights
€ millions June 30, 2017
Adjusted4 June 30, 2016
Change
% June 30, 2017
Reported
Revenue 3,909 3,583 +9.1% 3,909
Contribution from operations2 (% of revenue)
721 18.4%
677 18.9%
+6.6%
720 18.4%
Operating profit 670 646 +3.7% 611
Profit attributable to equity holders
433 416 +4.0% 391
Earnings per share (in €) 2.00 1.95 +2.7% 1.81
The income statement as of June 30, 2017 is adjusted for expenses accounted for in the financial statements due to
the proposed combination with Luxottica in the amount of €59m on operating profit and €42m on group net profit.
Commenting on these results, Hubert Sagnières, Chairman and Chief Executive Officer of Essilor, said:
"The first half of the year marks another step forward in our mission to eradicate poor vision around the
globe. Worldwide demand for better vision continues to grow and the strength of our business model,
based on innovation, acquisitions and partnerships was demonstrated through continued progression in
our results. The vast unmet need for vision correction and protection translate to exciting mid to long term
opportunities, despite a more challenging near term market environment linked to the announcement of
Essilor’s pending combination with Luxottica. We are in progress to finalize the agreement and are more
confident and enthusiastic than ever about the opportunities ahead as we build the foundation for future
growth.”
F i r s t - H a l f 2 0 1 7 R e s u l t s
N e w s R e l e a s e
Page 2 of 16
First-half operating highlights
Consolidated revenue amounted to €3,909 million in the first six months of 2017, an increase of 6.9% at
constant exchange rates and 2.5% in like-for-like1 terms. In line with previously announced expectations,
adjusted4 contribution from operations2 amounted to 18.4% of revenue. Adjusted4 earnings per share
grew by 2.7%. Free cash flow3 advanced 34% as reported and 13% excluding exceptional charges.
Performance for the first half was characterized by:
Revenue growth in the Lenses & Optical Instruments division of 5.8% in constant currency, of which
2.7% like-for-like1 growth, including:
- Gains in North America where like-for-like sales growth accelerated from 2.3% in Q1 to 3.1% in
Q2;
- Resilient performance in Europe supported by the recent Eye Protect System™ and Varilux® X
series™ launches;
- An expansion of sales in fast growing markets dampened by a decline in Brazil;
- A 14% increase in online sales;
A decrease in like-for-like1 sales for the Sunglasses & Readers division (-1.5%) alongside a 16.7%
contribution from the perimeter effect mainly linked to the consolidation of Photosynthesis Group in
China;
A strong dynamic in the Equipment division;
A more challenging market environment following the announcement of the proposed combination
with Luxottica.
Outlook
For the rest of the year, Essilor expects sales growth to be driven by the deployment of innovation along
with continuous development across its businesses. Nevertheless, in light of first-half dynamics, the
Company now anticipates full-year revenue growth of between 6% and 7% in constant currency terms
including around 3% on a like-for-like1 basis. The adjusted4 contribution from operations2 is expected to
be close to 18.5% of revenue.
Combination of Essilor and Luxottica
Essilor and Delfin, the majority shareholder of Luxottica Group, announced on January 16, 2017 the
signing of an agreement designed to create an integrated global player in the eyewear industry with the
combination of Essilor and Luxottica. The transaction is subject to satisfaction of several conditions
precedent. In March, the transaction obtained the favorable opinions of Essilor’s employee representative
bodies. On April 12, the AMF (Autorité des Marché Financiers) decided to waive Delfin's obligation to file
a mandatory tender offer for Essilor’s shares. On May 11, Essilor shareholders convened for a general
meeting and holders of double voting rights convened for a special meeting, approved the combination.
Lastly, to date, Essilor and Luxottica have jointly filed with the antitrust authorities in several jurisdictions.
The two companies’ shared objective in cooperation with the relevant authorities is to close the antitrust
process around the end of the year (please refer to the news release issued on July 24, 2017).
F i r s t - H a l f 2 0 1 7 R e s u l t s
N e w s R e l e a s e
Page 3 of 16
A conference call in English will be held today at 10:30 a.m. CEST.
The meeting will be available live and may also be heard later at:
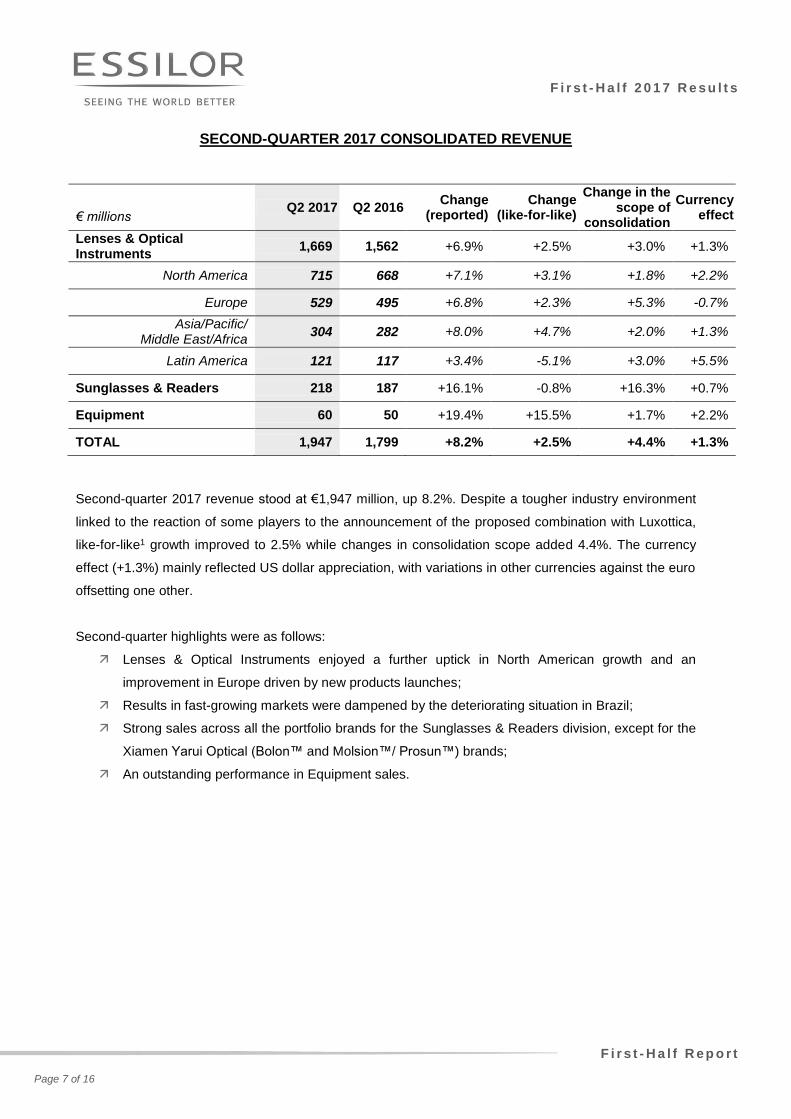
Second-quarter 2017 revenue stood at €1,947 million, up 8.2%. Despite a tougher industry environment
linked to the reaction of some players to the announcement of the proposed combination with Luxottica,
like-for-like1 growth improved to 2.5% while changes in consolidation scope added 4.4%. The currency
effect (+1.3%) mainly reflected US dollar appreciation, with variations in other currencies against the euro
offsetting one other.
Second-quarter highlights were as follows:
Lenses & Optical Instruments enjoyed a further uptick in North American growth and an
improvement in Europe driven by new products launches;
Results in fast-growing markets were dampened by the deteriorating situation in Brazil;
Strong sales across all the portfolio brands for the Sunglasses & Readers division, except for the
Xiamen Yarui Optical (Bolon™ and Molsion™/ Prosun™) brands;
An outstanding performance in Equipment sales.
F i r s t - H a l f 2 0 1 7 R e s u l t s
F i r s t - H a l f R e p o r t
Page 8 of 16
ACQUISITIONS AND PARTNERSHIPS
During the first half, Essilor pursued its strategy of forging local partnerships by acquiring majority stakes
in eight companies representing aggregate full-year revenue of around €85 million.
North America
In the United States, Essilor formed a partnership with Partners In Vision, Inc. and Vision
Associates, Inc., two service platforms for eye care professionals.
Europe
In the Netherlands, the Company acquired a majority stake in Optitrade Logistics Center (OLC),
the distribution platform of Optitrade, a purchasing alliance of around 650 optical stores in this
country.
Asia/Pacific/Middle East/Africa
In India, Essilor acquired a majority stake in Mangalsons Optics PTE Ltd, a distributor of plastic
and glass lenses, sunglasses and prescription frames.
Essilor increased its equity investment in the joint venture Topcon Visioncare Japan (TVJ) to 51%.
TVJ is the distributor of Topcon’s optometry line and Essilor’s lens finishing line to opticians in
Japan.
In Ethiopia, a majority stake was purchased in Sun Optical Technologies, a prescription
laboratory.
In addition, Creasky Optical, the acquisition of which was announced in November 2016, was
consolidated at the beginning of the year.
Latin America
In Brazil, the Company acquired a majority stake in Visolab Produtos Opticos Ltda, a prescription
laboratory located in the State of Sergipe.
In Guatemala, the Company acquired a majority stake in Opticas Exclusivas, an integrated
prescription laboratory operating around 50 optical stores.
F i r s t - H a l f 2 0 1 7 R e s u l t s
F i r s t - H a l f R e p o r t
Page 9 of 16
CONDENSED STATEMENT OF INCOME
Reconciliation of adjusted6 to reported accounts
€ millions H1 2017
Adjusted6
Items
adjusted
H1 2017
Reported H1 2016
Revenue 3,909 3,909 3,583
Gross Profit 2,275 2,275 2,135
Contribution from operations2 721 (1) 720 677
Other income (expense) (51) (58) (109) (31)
Operating profit 670 (59) 611 646
Net profit
Attributable to equity holders of
Essilor International
482
433
(42)
(42)
440
391
450
416
Earnings per share (in €) 2.00 1.81 1.95
The 2017 accounts are adjusted6 for items related to the Company’s combination with Luxottica
including: (i) €1 million at the Contribution from operations2 level; (ii) €58 million at the Other income
(expense) level, leading to an adjusted Operating profit that is €59 million higher. After taking into account
tax effects (€17 million), the adjusted Net profit attributable to equity holders of Essilor International
amounts to €433 million.
F i r s t - H a l f 2 0 1 7 R e s u l t s
F i r s t - H a l f R e p o r t
Page 10 of 16
Condensed adjusted6 statement of income
€ millions H1 2017
Adjusted6 H1 2016 Change
Revenue 3,909 3,583 +9.1%
Gross profit
(% of revenue)
2,275
58.2%
2,135
59.6%
+6.6%
--
Operating expenses (1,554) (1,458) +6.6%
Contribution from operations2
(% of revenue)
721
18.4%
677
18.9%
+6.6%
--
Other income (expense) (51) (31) --
Operating profit
(% of revenue)
670
17.1%
646
18.0% +3.7%
Financial income (expense), net (32) (37) --
Income tax
Effective tax rate
(156)
24.5%
(159)
26.1% --
Net profit
Attributable to equity holders of
Essilor International
(% of revenue)
482
433
11.1%
450
416
11.6%
+7.0%
+4.0%
--
Earnings per share (in €) 2.00 1.95 +2.7%
ADJUSTED6 CONTRIBUTION FROM OPERATIONS: 18.4% OF REVENUE
Gross profit: up 6.6%
In the first half of 2017, gross profit (revenue less cost of sales) stood at €2,275 million, representing
58.2% of revenue, versus 59.6% in first-half 2016.
Despite an improved operating cost base, the decrease reflected an evolution in the channel mix which
included fast-growing e-commerce activities and the increased weight of acquisitions integrated over the
period.
Adjusted6 operating expenses: up 6.6%
Adjusted6 operating expenses amounted to €1,554 million for the period or 39.8% of revenue versus
40.7% in first-half 2016.
They primarily comprised:
€110 million in R&D and engineering costs, versus €108 million in first-half 2016.
€956 million in selling and distribution costs, versus €892 million in first-half 2016.
F i r s t - H a l f 2 0 1 7 R e s u l t s
F i r s t - H a l f R e p o r t
Page 11 of 16
Adjusted6 contribution from operations2
Adjusted6 contribution from operations2 rose by 6.6% to €721 million in the first half. However, adjusted6
contribution from operations2 as a percentage of revenue narrowed from 18.9% in first-half 2016 to
18.4%, which was nonetheless higher than in the second half of 2016 (18.3% of revenue).
"Other income and expenses from operations" together represented a net adjusted6 expense of €51
million versus €31 million in first-half 2016 which had benefited from an €8 million gain linked to the sale
of a real estate asset. These items mainly covered:
Charges to restructuring provisions totaling €14 million, including the closure of the Transitions
Optical site in Florida in the United States
Compensation costs for share-based payments totaling €30 million
The costs associated with the final settlement of the litigation between Transitions Optical and the
previous owner of the Vision Ease lens caster.
As a result, adjusted operating income6 amounted to €670 million, an increase of 3.7% and representing
17.1% of revenue.
Finance costs and other financial income and expenses, net
This item came out at a net cost of €32 million, down from a net cost of €37 million in first-half 2016. This
decrease reflects a slight reduction in the cost of debt and a modest gain on currency hedging
transactions.
Adjusted6 profit attributable to equity holders up 4.0% to €433 million
Adjusted6 profit attributable to equity holders of Essilor International is stated after:
€156 million in adjusted6 income tax expense, representing an effective tax rate of 24.5% compared
with 26.1% in the year ended June 30, 2016. The decrease in the tax rate was mainly attributable to
the application of the APA agreement on royalties signed in 2016 between the French and US tax
authorities.
€49 million in non-controlling interests. This €15 million increase versus first-half 2016 is linked
notably to Photosynthesis Group, a company consolidated in late 2016 in which the group holds a
50% stake, and good performance from the Company’s partners in the United States.
Due to the increase in the number of shares, linked notably to the payment of a substantial portion of the
2015 dividend in shares, adjusted6 earnings per share showed slower growth than adjusted6 net profit
(+2.7%), ending the period at €2.00.
F i r s t - H a l f 2 0 1 7 R e s u l t s
F i r s t - H a l f R e p o r t
Page 12 of 16
BALANCE SHEET AND CASH FLOW STATEMENT
FREE CASH FLOW5 UP 34%
Free cash flow5 increased by 34% to €331 million. Excluding certain non-recurring items, i.e. the payment
of a fine to the German competition authority in 2016 and the settlement of the litigation between the
Company and Vision Ease during the first half of 2017, free cash flow5 increased by 13%.
Capital expenditure and investments
Purchases of property, plant and equipment and intangible assets amounted to €125 million over the six
months to June 30, 2017 and mainly involved industrial investment to support the Company’s growth.
Change in working capital requirement
The working capital requirement rose by €259 million over the six months to end June 2017, principally
due to the usual seasonality effects in the Lenses & Optical Instruments business.
Operating cash flow4
Operating cash flow4 stood at €715 million compared with €625 million at June 30, 2016. This included
the settlement of the Company’s litigation with Vision Ease.
Net debt
At June 30, Essilor’s net debt stood at €2,244 million, i.e. 1.3 times the Company’s 12-month EBITDA.
Cash flow statement
€ millions
Net cash from operations (before change in WCR(a))
715 Change in WCR(a) 259
Proceeds from share issues 4 Capital expenditure 125
Change in net debt 182 Dividends 350
Other(b) 109 Acquisition of investments, net of
disposals(c) 276
(a) Working capital requirement. (b) Other items include the positive €97 million currency effect. (c) Financial investments net of cash acquired, plus debt of newly-consolidated companies.
F i r s t - H a l f 2 0 1 7 R e s u l t s
F i r s t - H a l f R e p o r t
Page 13 of 16
OTHER SIGNIFICANT EVENTS DURING THE FIRST HALF
Combination of Essilor and Luxottica
Essilor and Delfin, the majority shareholder of Luxottica Group, announced on January 16, 2017 the
signing of an agreement designed to create an integrated global player in the eyewear industry with the
combination of Essilor and Luxottica. The transaction is subject to satisfaction of several conditions
precedent.
In March, the transaction obtained the favorable opinions of the employee representative bodies. On April
12, the AMF (Autorité des Marchés Financiers) decided to waive Delfin's obligation to file a mandatory
tender offer for Essilor’s shares. On May 11, Essilor shareholders convened for a general meeting and
holders of double voting rights convened for a special meeting approved the combination. Lastly, to date,
Essilor and Luxottica have jointly filed with the antitrust authorities in several jurisdictions. The two
companies’ shared objective in cooperation with the relevant authorities is to close the antitrust process
around the end of the year (please refer to the news release issued on July 24, 2017).
F i r s t - H a l f 2 0 1 7 R e s u l t s
F i r s t - H a l f R e p o r t
Page 14 of 16
APPENDIX 1
ESSILOR INTERNATIONAL REPORTED STATEMENT OF INCOME
€ millions H1 2017
Reported
H1 2016
Reported Change
Revenue 3,909 3,583 +9.1%
Gross profit
(% of revenue)
2,275
58.2%
2,135
59.6%
+6.6%
--
Operating expenses (1,555) (1,458) +6.7%
Contribution from operations
(% of revenue)
720
18.4%
677
18.9%
+6.4%
--
Other income (expense) (109) (31) --
Operating profit
(% of revenue)
611
15.6%
646
18.0% -5.5%
Financial income (expense), net (32) (37) --
Income tax
Effective tax rate
(139)
24.0%
(159)
26.1% --
Net profit
Attributable to equity holders of
Essilor International
(% of revenue)
440
391
10.0%
450
416
11.6%
-2.3%
-6.1%
--
Earnings per share (in €) 1.81 1.95 -7.2%
F i r s t - H a l f 2 0 1 7 R e s u l t s
F i r s t - H a l f R e p o r t
Page 15 of 16
APPENDIX 2
CONSOLIDATED REVENUE BY QUARTER
€ millions 2017 2016
First Quarter
Lenses & Optical Instruments 1,713 1,567
North America 767 710
Europe 508 470
Asia/Pacific/Middle East/Africa 311 283
Latin America 127 104
Sunglasses & Readers 199 173
Equipment 50 44
TOTAL First Quarter 1,962 1,784
Second Quarter
Lenses & Optical Instruments 1,669 1,562
North America 715 668
Europe 529 495
Asia/Pacific/Middle East/Africa 304 282
Latin America 121 117
Sunglasses & Readers 218 187
Equipment 60 50
TOTAL Second Quarter 1,947 1,799
Third Quarter
Lenses & Optical Instruments 1,541
North America 671
Europe 461
Asia/Pacific/Middle East/Africa 288
Latin America 121
Sunglasses & Readers 132
Equipment 50
TOTAL Third Quarter 1,723
Fourth Quarter
Lenses & Optical Instruments 1,549
North America 657
Europe 480
Asia/Pacific/Middle East/Africa 286
Latin America 126
Sunglasses & Readers 192
Equipment 68
TOTAL Fourth Quarter 1,809
F i r s t - H a l f 2 0 1 7 R e s u l t s
F i r s t - H a l f R e p o r t
Page 16 of 16
RISK FACTORS
Risk factors are similar to those presented in section 1.6 (pages 27 to 33) of the 2016 Registration
Document and section 3.3 (pages 81 to 90) of the Document E (information document relating to the
issuance of ordinary share in consideration for the contribution in kind of Luxottica shares) and did not
change significantly during the first half of 2017. Litigation risks are described in note 13 to the first-half
condensed consolidated financial statements.
NOTES
1. Like-for-like growth: Growth at constant scope and exchange rates. See definition provided in
Note 2.3 to the consolidated financial statements in the 2016 Registration Document.
2. Contribution from operations: Revenue less cost of sales and operating expenses (research
and development costs, selling and distribution costs and other operating expenses).
3. Bolt-on acquisitions: Local acquisitions or partnerships.
4. Operating cash flow: Net cash from operating activities before working capital requirement.
5. Free cash flow: Net cash from operating activities less purchases of property, plant and
equipment and intangible assets, according to the IFRS consolidated cash flow statement.
6. Adjusted in 2017 for expenses accounted for in the financial statements in the context of the