Page 1
RESISTANCE TO WHEAT STREAK MOSAIC VIRUS AND TRITICUM MOSAIC VIRUS IN
WHEAT MEDIATED BY RNAI
by
LUISA FERNANDA CRUZ
B.S., National University of Colombia, 2006
A THESIS
submitted in partial fulfillment of the requirements for the degree
MASTER OF SCIENCE
Department of Plant Pathology
College of Agriculture
KANSAS STATE UNIVERSITY
Manhattan, Kansas
2009
Approved by:
Co-Major Professor
Harold Trick
Approved by:
Co-Major Professor
John Fellers
Page 2
Abstract
Wheat streak mosaic virus (WSMV) and Triticum mosaic virus (TriMV), are two of the
major viruses in the Great Plains of the United States. Cultural practices and mite vector control
are the primary methods of disease management; however, they are not fully effective. Resistant
varieties are also deployed, although some of the lines present temperature sensitive resistance or
negative agronomic properties are linked to resistance. Alternative approaches to viral resistance
are needed. RNAi has been shown to play a role in viral defense response and has been
successfully used as a biotechnological tool to preprogram viral resistance in transgenic plants.
RNAi reduces the expression of specific genes by targeting the accumulation of mRNA. The
mechanism is activated by the presence of dsRNA, which is processed into small non-coding
sequence that serves as a guide for degrading RNA in a sequence specific manner. In this work,
the RNAi approach was used to elicit resistance against WSMV and TriMV. Immature embryos
of the wheat cv „Bobwhite‟ were independently co-transformed with pAHC20, containing the
bar gene for glufosinate selection, and either the hairpin construct targeting the coat protein of
WSMV or TriMV. After tissue culture, PCR was used to determined the presence of the RNAi
CP transgene in putative transformed plants. Eight WSMV and ten TriMV CP RNAi transgenic
plants were obtained from the bombardment experiments. Transgenic T1 and T2 seeds were
collected and transgene expression was established through RT-PCR. In order to determine viral
resistance, T1 and T2 progeny was mechanically inoculated. ELISA results indicated a
differential resistance response among the tillers evaluated in each line in T1 generation for both
WSMV and TriMV constructs. In T1 generation resistance was seen in up to 60% of the plants
evaluated for both constructs, although some events that showed transgene presence did not
exhibited resistant phenotype. Analyses of transgene presence and expression in T2 generation
evidenced events of transgene silencing and deletion. Regardless of these phenomena, consistent
resistance response in two lines of WSMV CP construct and one TriMV CP transgenic line was
found.
Page 3
iii
Table of Contents
List of Figures ........................................................................................................................... iv
List of Tables ..............................................................................................................................v
Acknowledgements ................................................................................................................... vi
Introduction ................................................................................................................................1
Materials and Methods .............................................................................................................. 12
Plasmid Construction: ........................................................................................................... 12
Plant Transformation ............................................................................................................. 14
Plant material .................................................................................................................... 14
Bombardment .................................................................................................................... 15
Tissue culture .................................................................................................................... 15
Plant Evaluation .................................................................................................................... 16
Liberty painting ................................................................................................................. 16
PCR gene detection ........................................................................................................... 16
Southern Hybridization ...................................................................................................... 17
T1 and T2 Generation Evaluation ....................................................................................... 18
Bioassays .............................................................................................................................. 19
ELISA T1 and T2 generation .................................................................................................. 19
siRNA Detection ................................................................................................................... 20
Small RNA fraction and RNA hybridization ...................................................................... 20
Segregation analyses ............................................................................................................. 21
Data Analysis ........................................................................................................................ 21
Results ...................................................................................................................................... 22
Expression of WSMV CP RNAi vector: ................................................................................ 22
Expression of TriMV CP RNAi vector: ................................................................................. 25
Other Constructs from WSMV: ............................................................................................. 29
Discussion ................................................................................................................................. 31
Conclusion and future work .................................................................................................. 36
References And/Or Bibliography .............................................................................................. 63
Page 4
iv
List of Figures
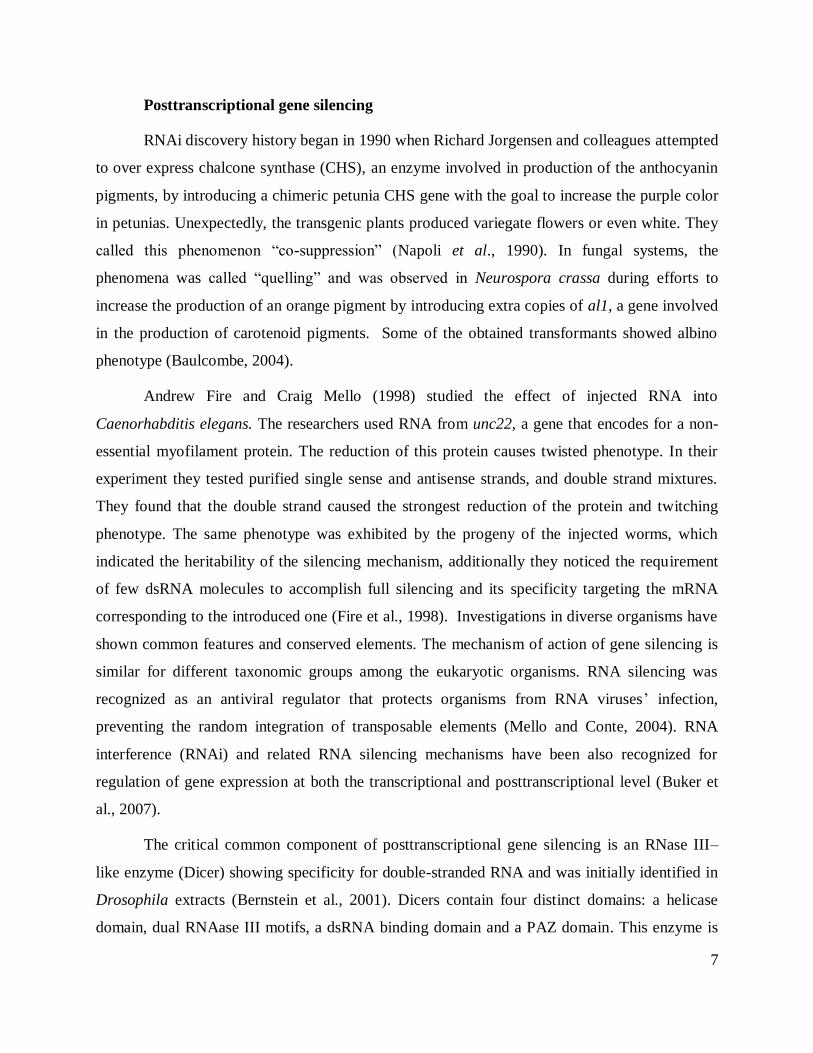
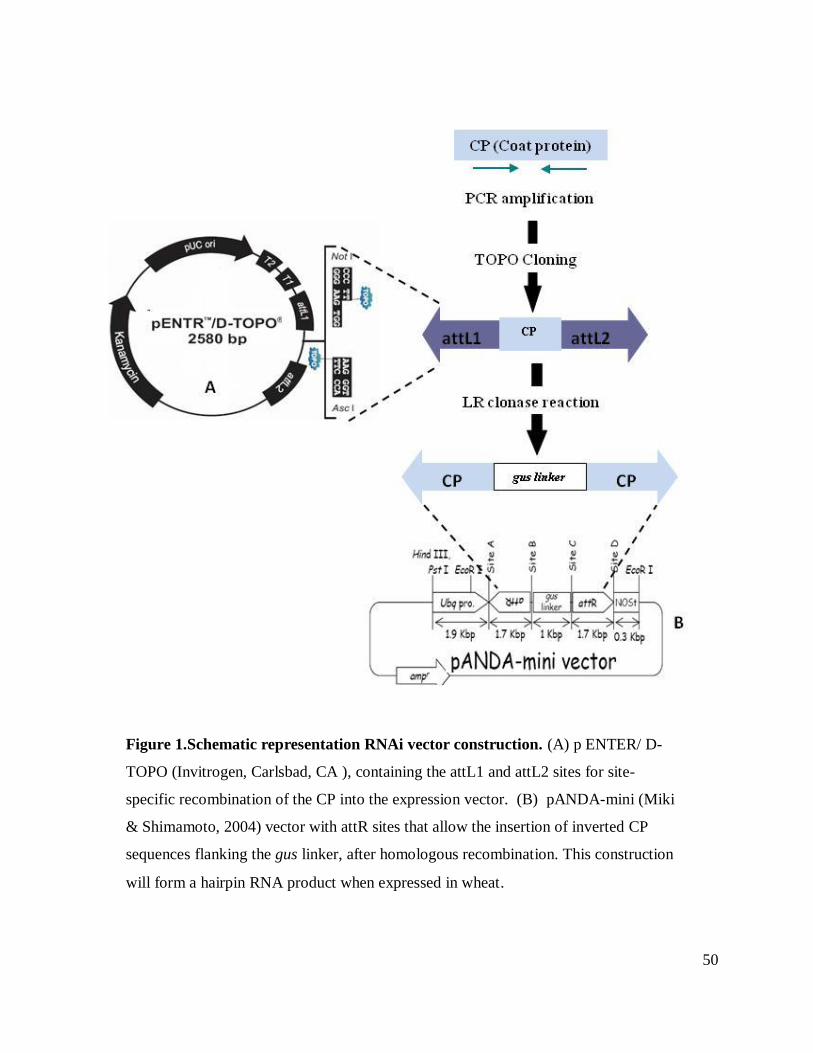
Figure 1. Schematic representation RNAi vector construction. .................................................. 50
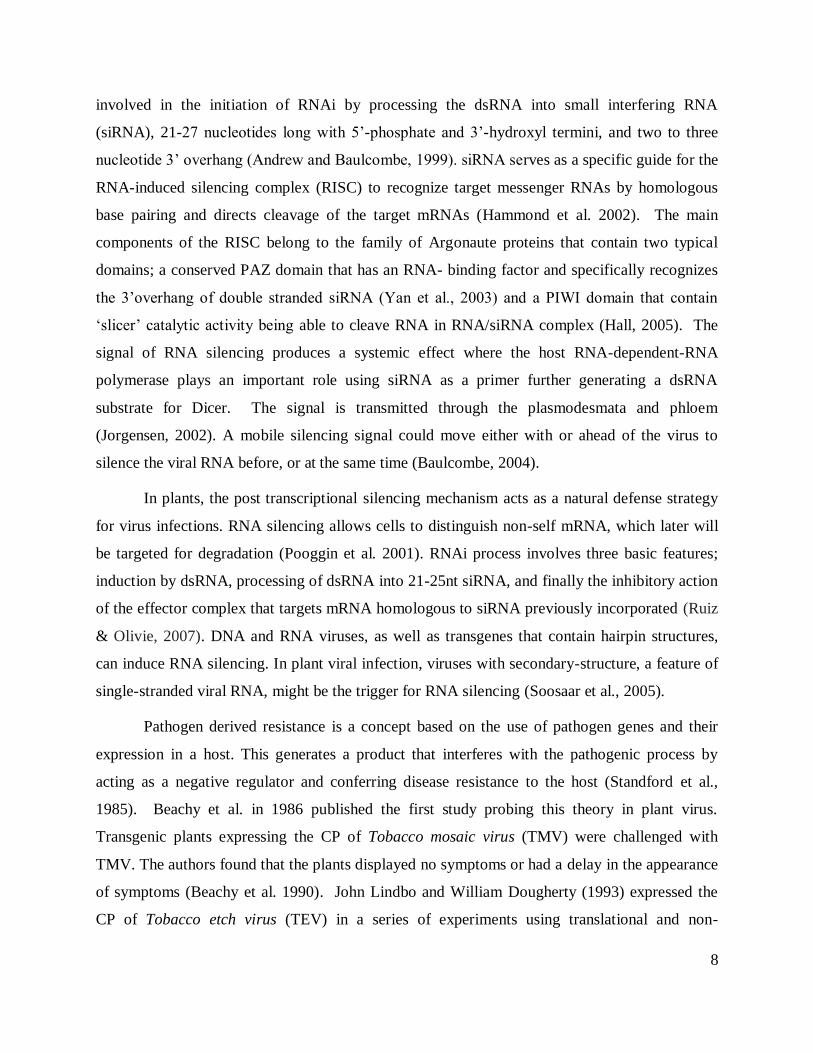
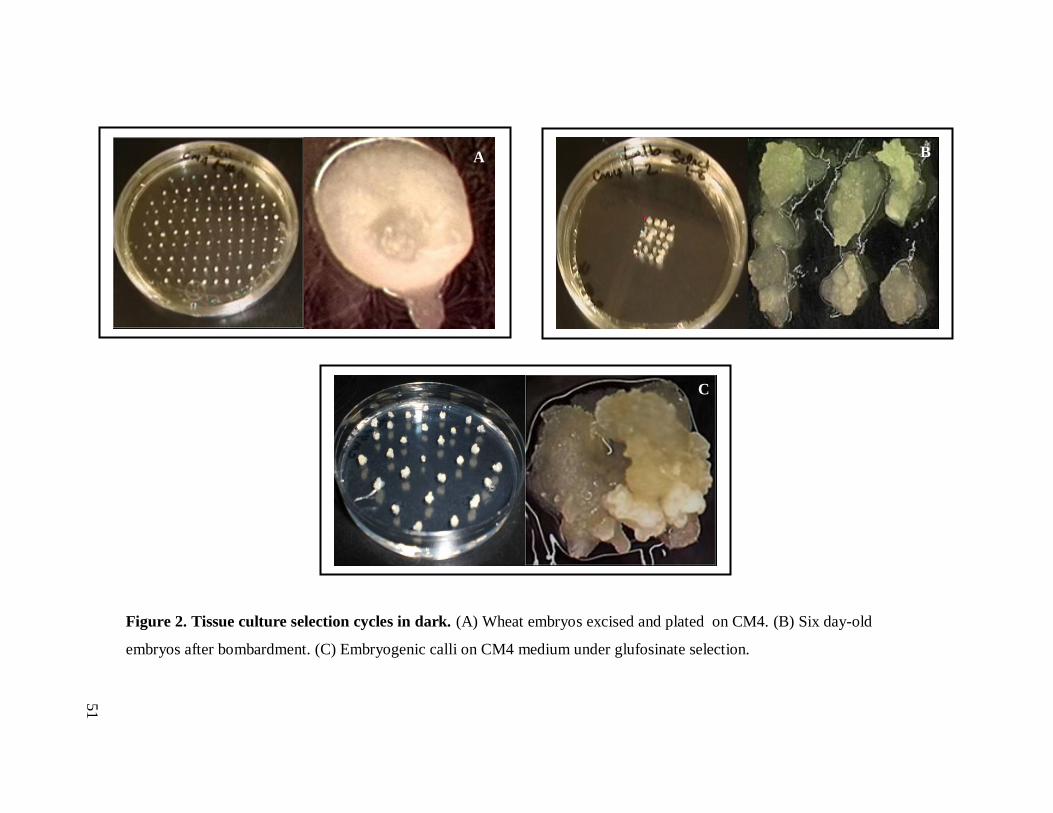
Figure 2. Tissue culture selection cycles in dark. ....................................................................... 51
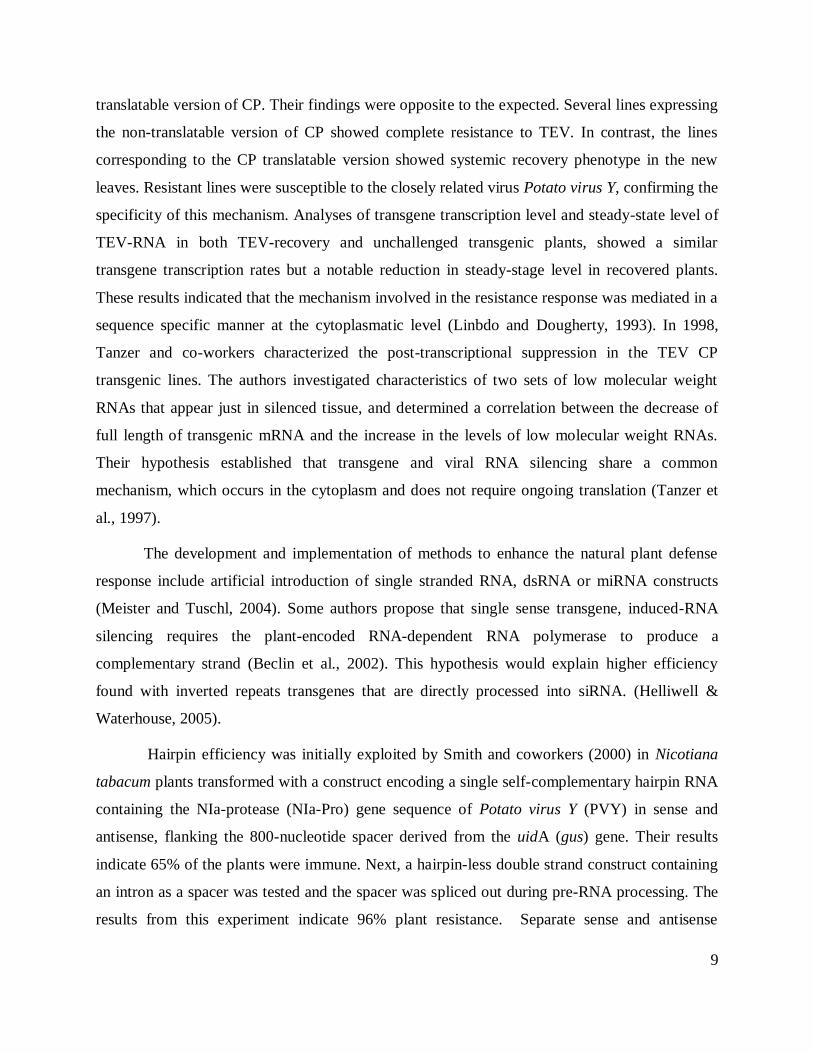
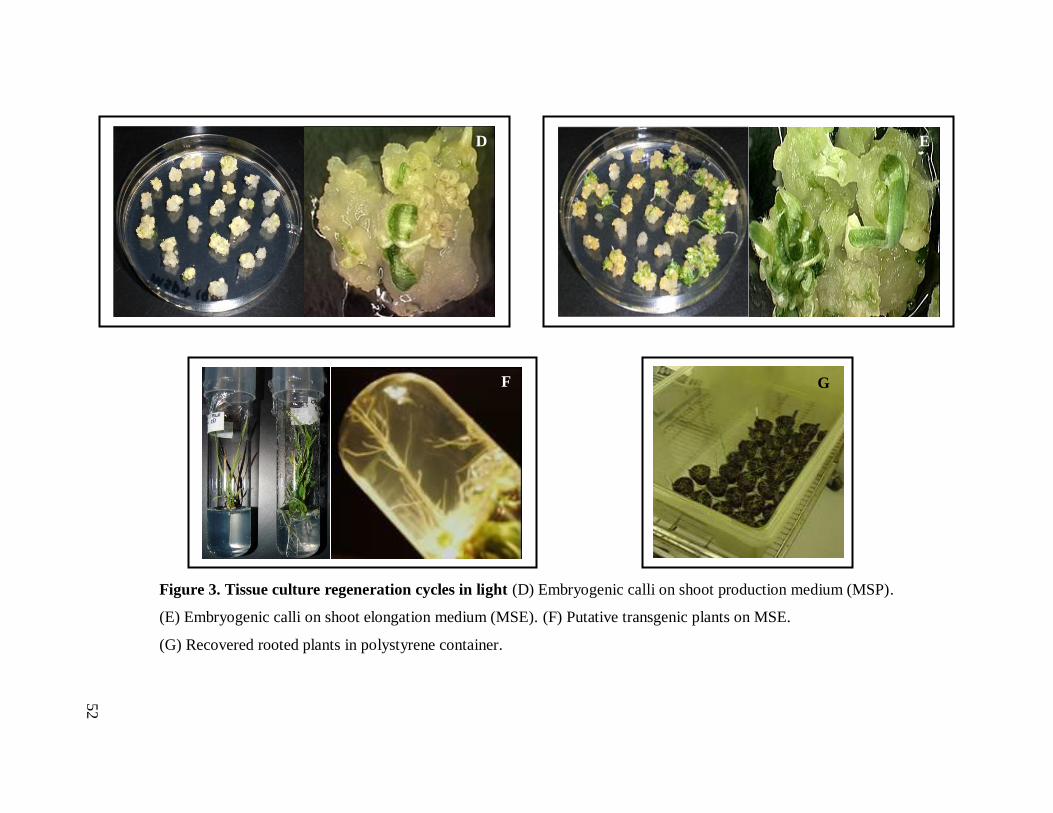
Figure 3. Tissue culture regeneration cycles .............................................................................. 52
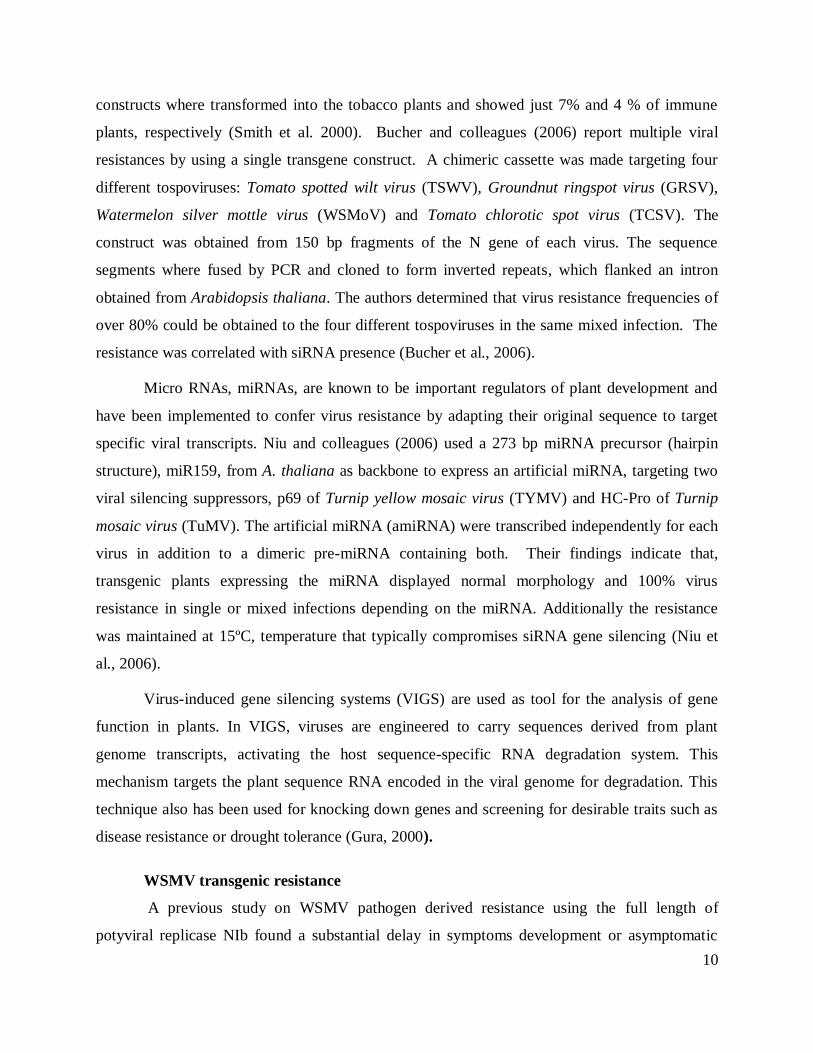
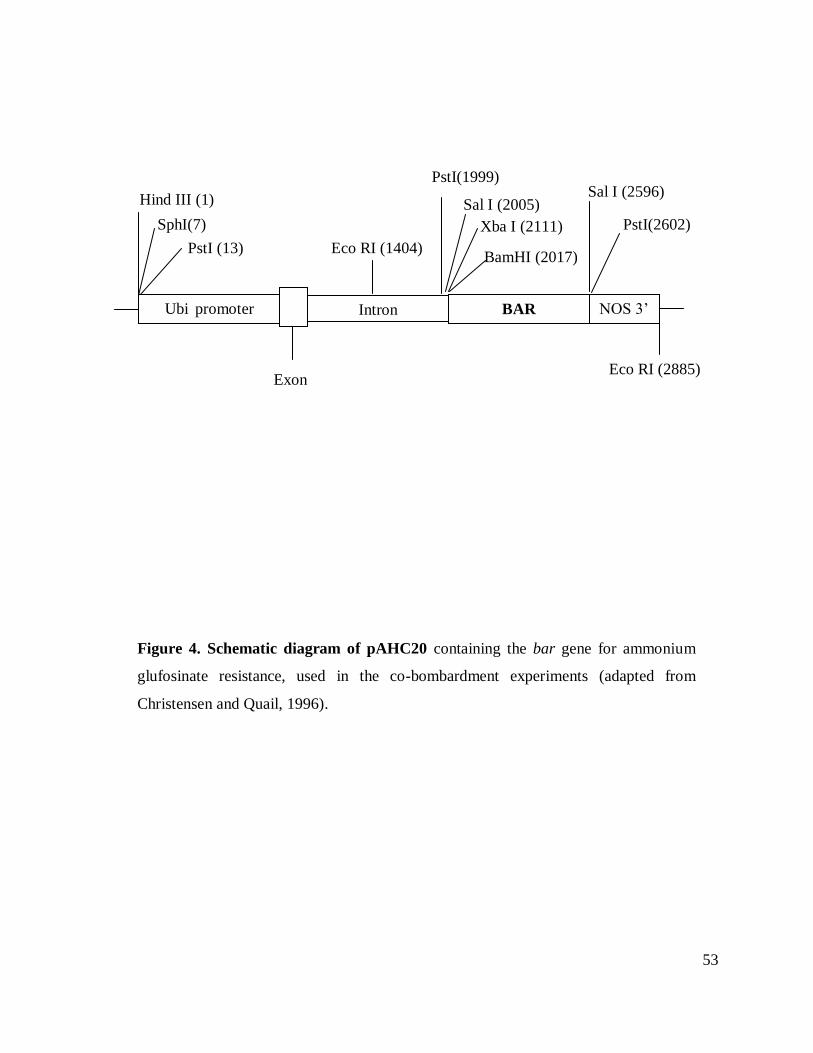
Figure 4. Schematic diagram of pAHC20 ................................................................................. 53
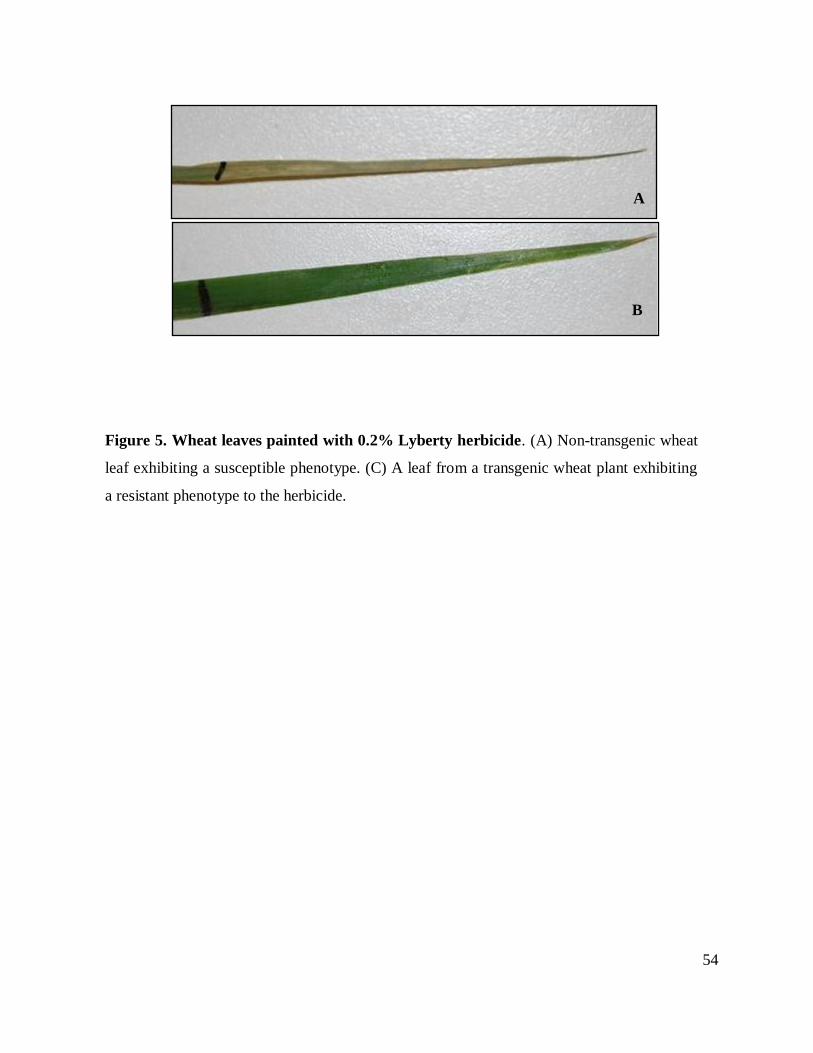
Figure 5. Wheat leaves painted with 0.2% Lyberty herbicide. .................................................... 54
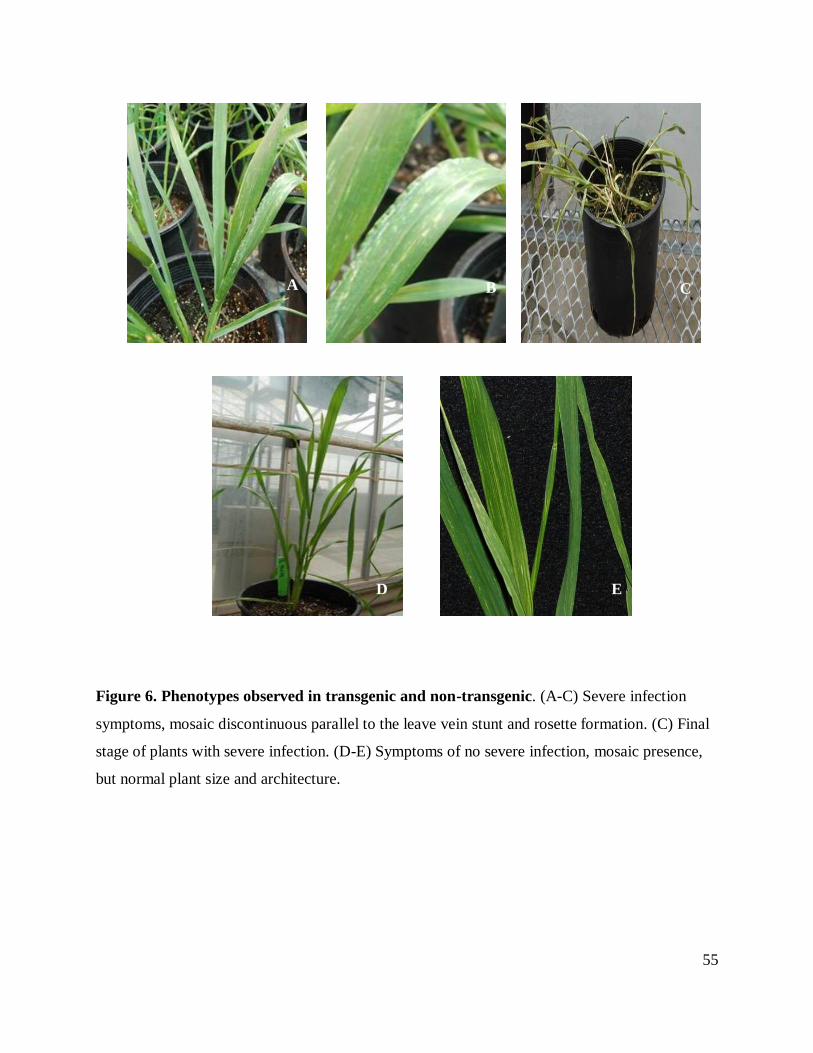
Figure 6. Phenotypes observed in transgenic and non-transgenic. .............................................. 55
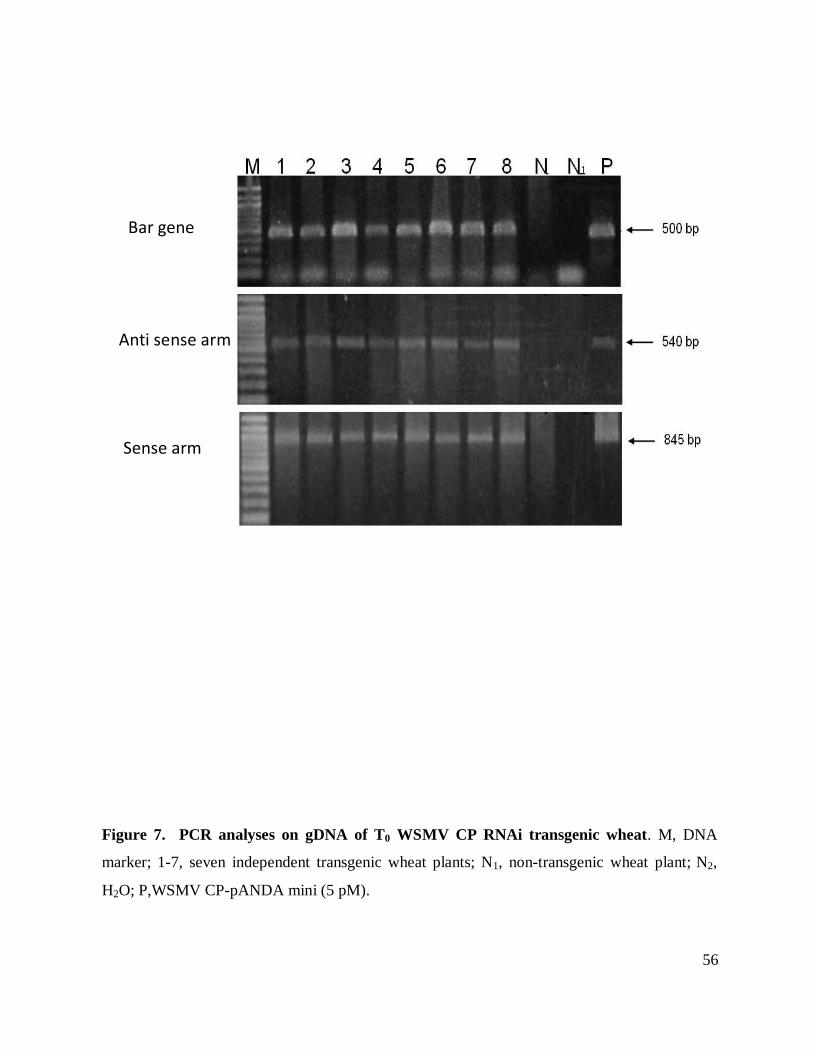
Figure 7. PCR analyses on gDNA of T0 WSMV CP RNAi transgenic wheat.. .......................... 56
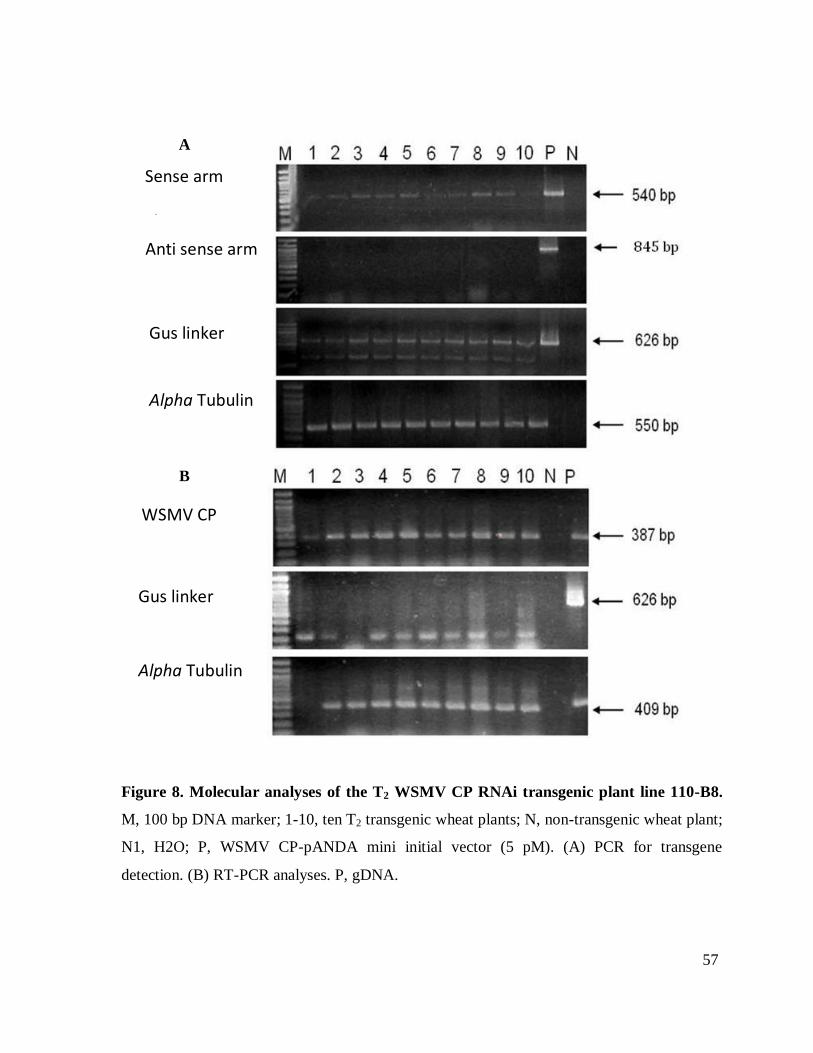
Figure 8. Molecular analyses of the T2 WSMV CP RNAi transgenic plant line 110-B8. ............ 57
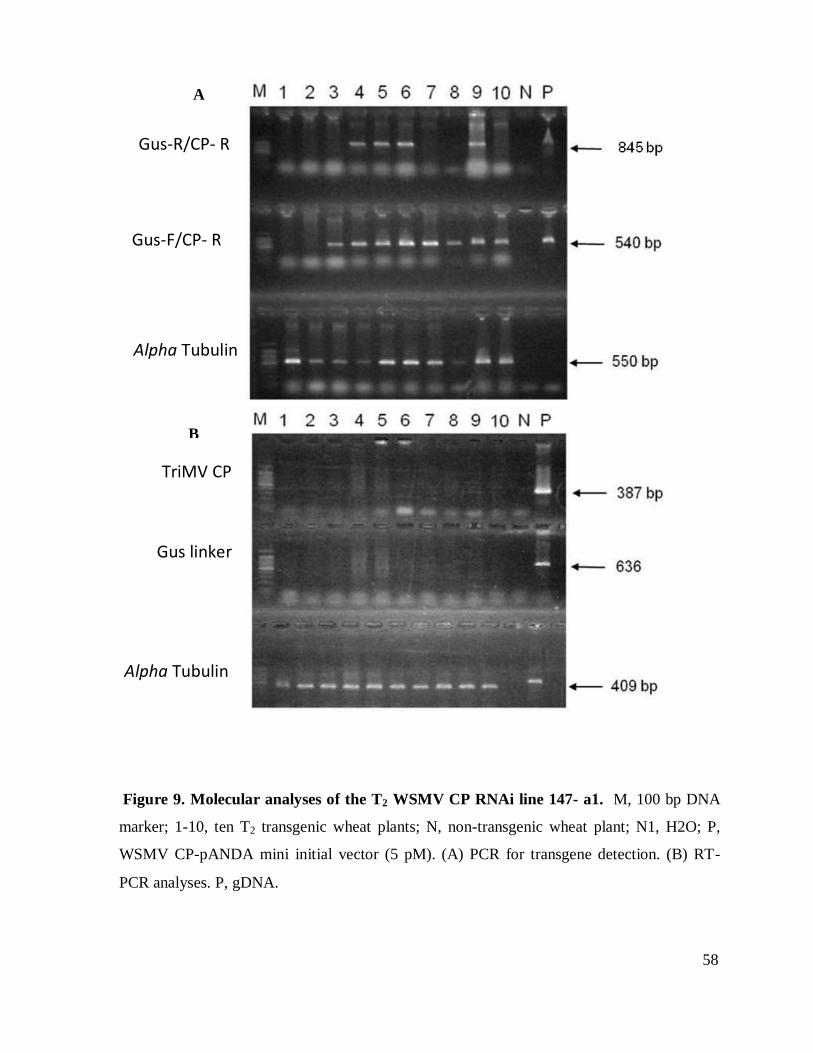
Figure 9. Molecular analyses of the T2 WSMV CP RNAi line 147- a1 ...................................... 58
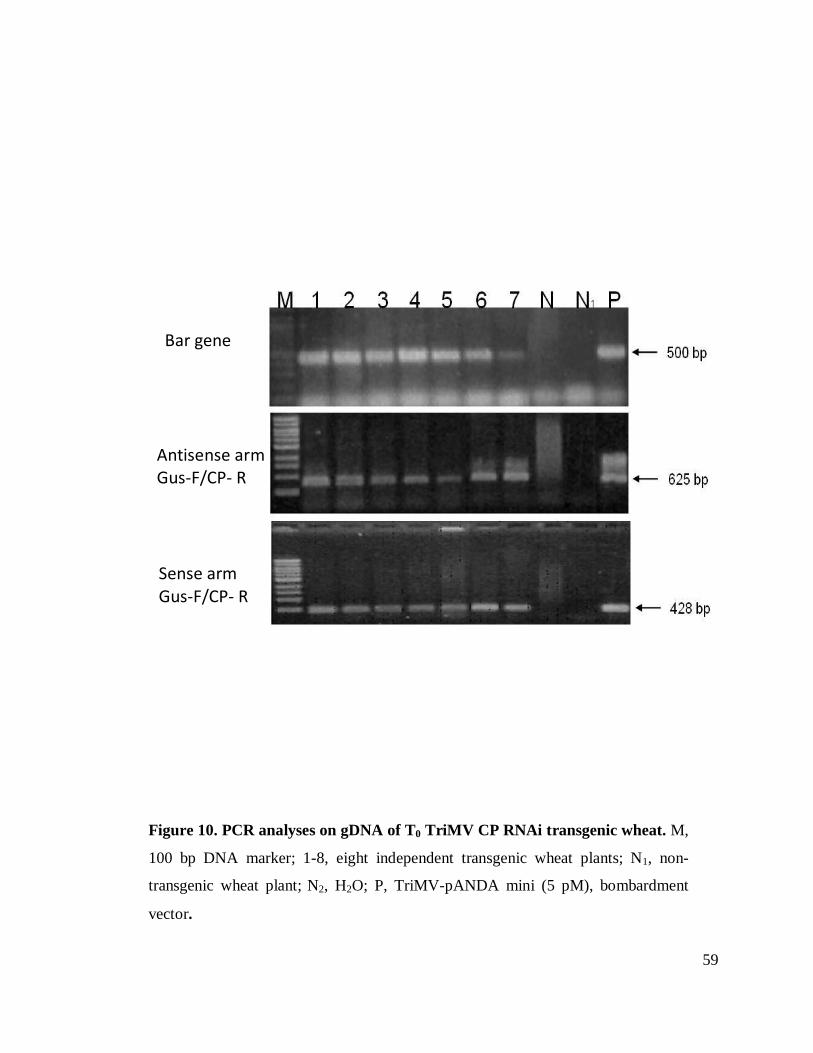
Figure 10. PCR analyses on gDNA of T0 TriMV CP RNAi transgenic wheat. M, 100 bp DNA 59
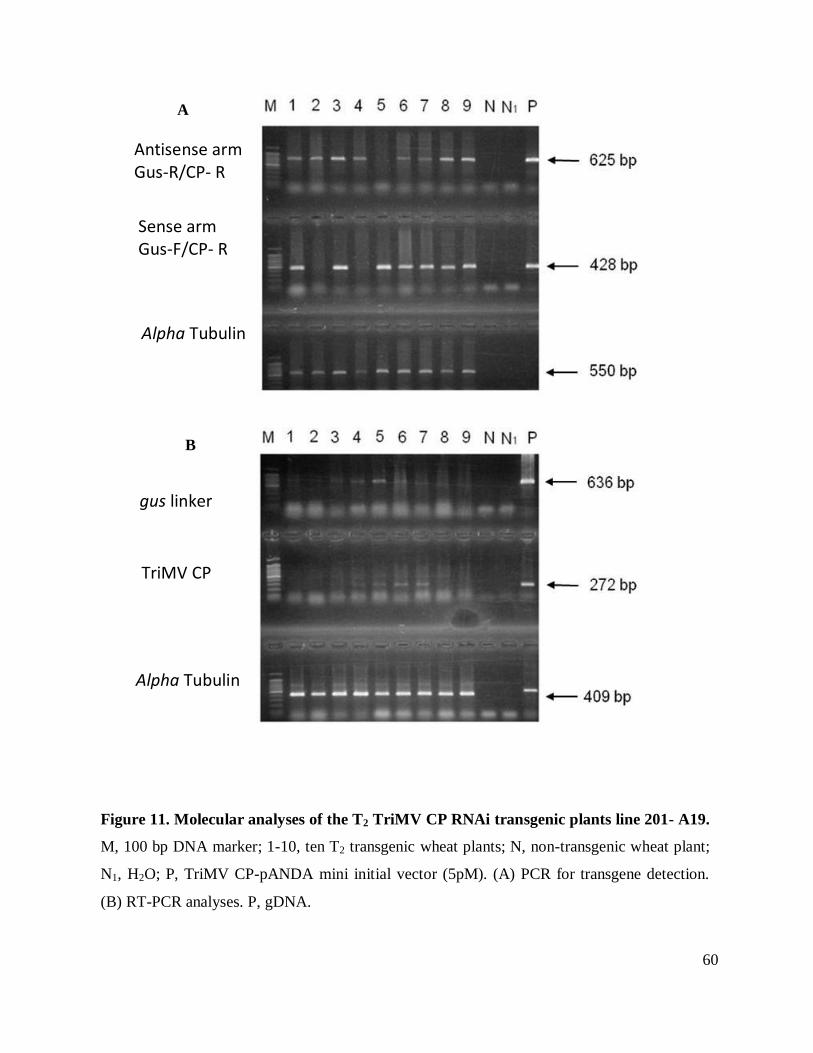
Figure 11. Molecualar analyses of the T2 TriMV CP RNAi transgenic plants line 201- A19. .... 60
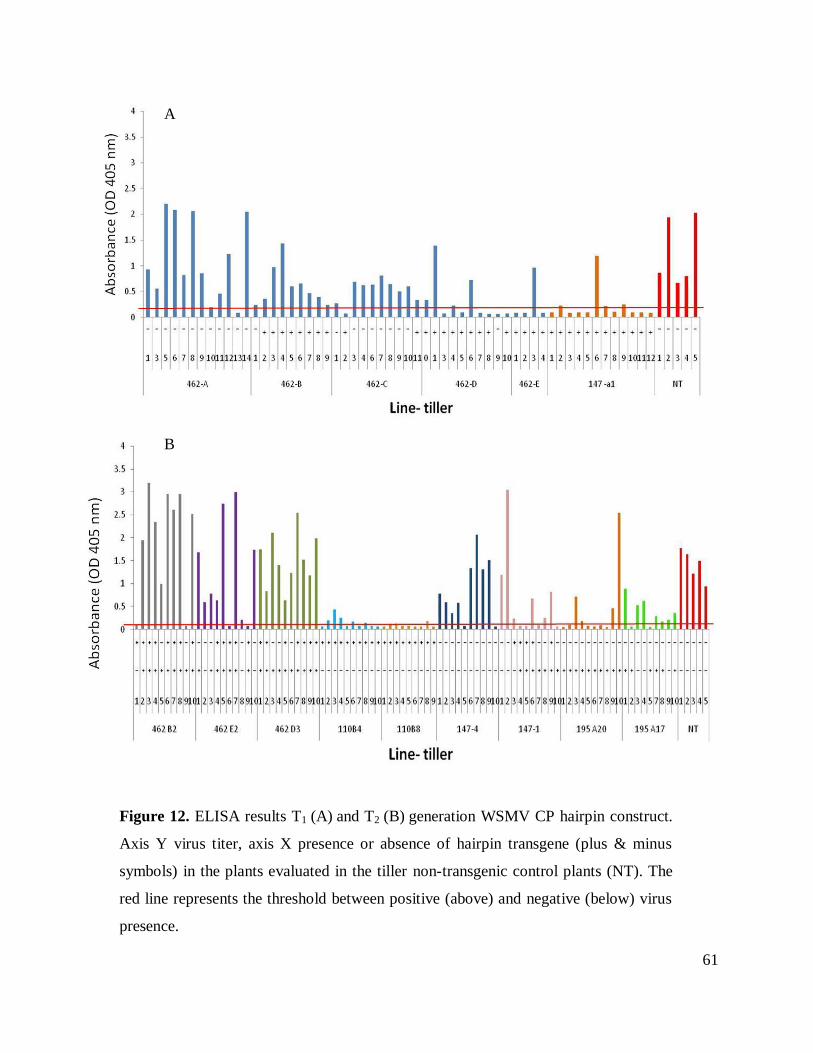
Figure 12. ELISA results T1 and T2 generation WSMV CP hairpin construct.. .......................... 61
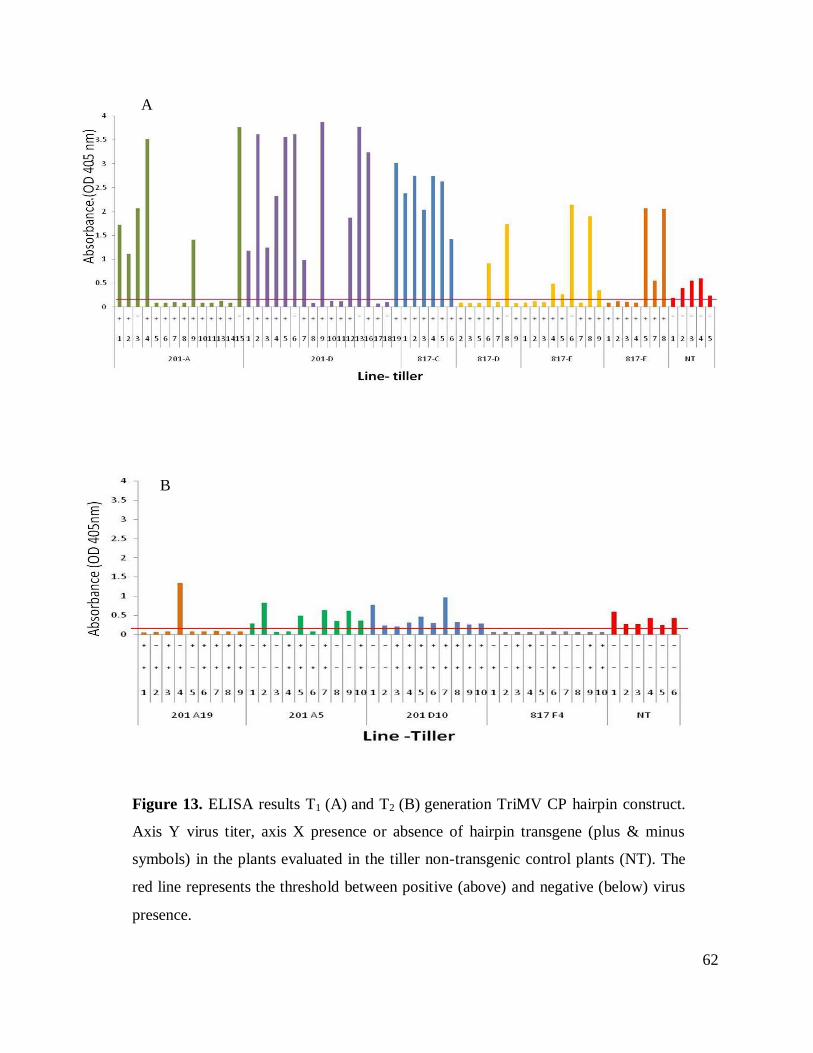
Figure 13. ELISA results T1 and T2 generation TriMV CP hairpin construct.. ........................... 62
Page 5
v
List of Tables
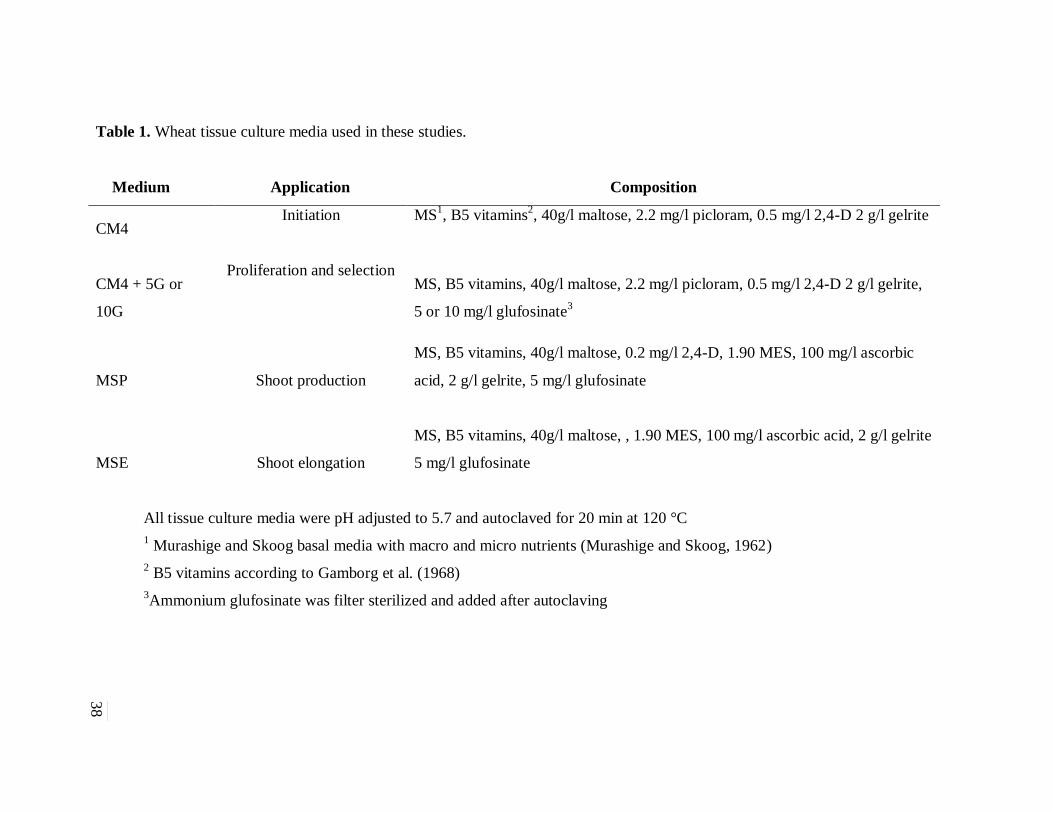
Table 1. Wheat tissue culture media used in these studies. ......................................................... 38
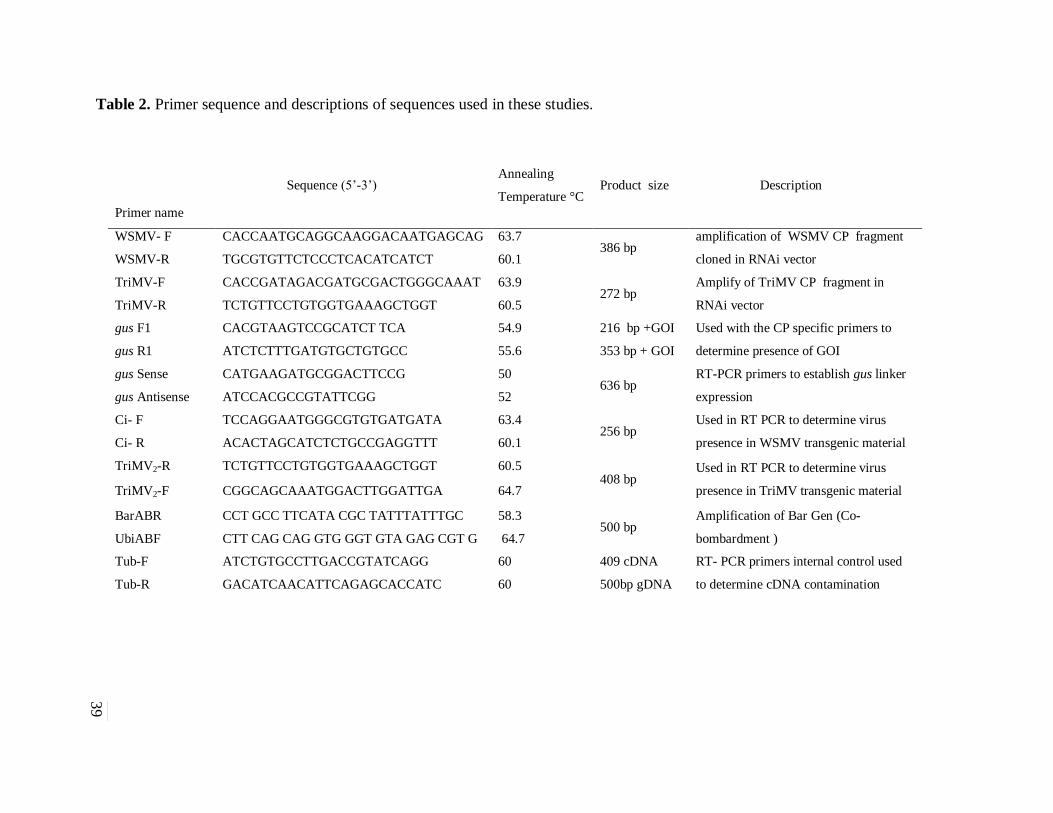
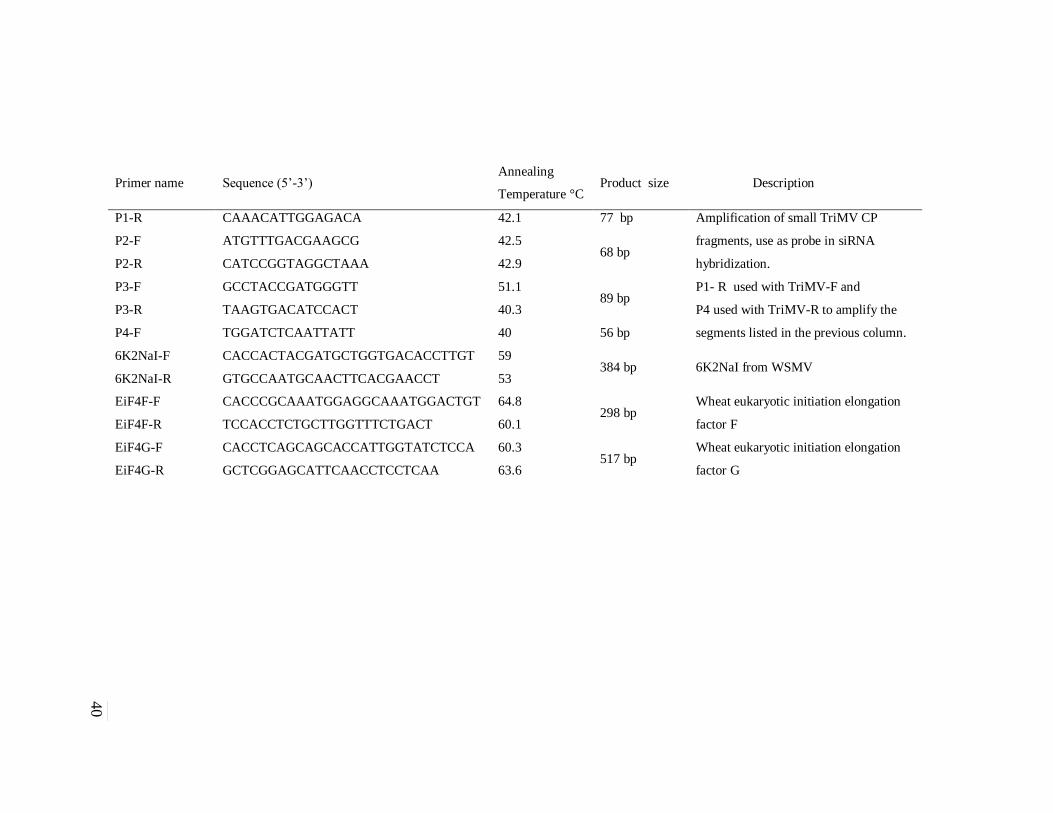
Table 2. Primer sequence and descriptions of sequences used in these studies. .......................... 39
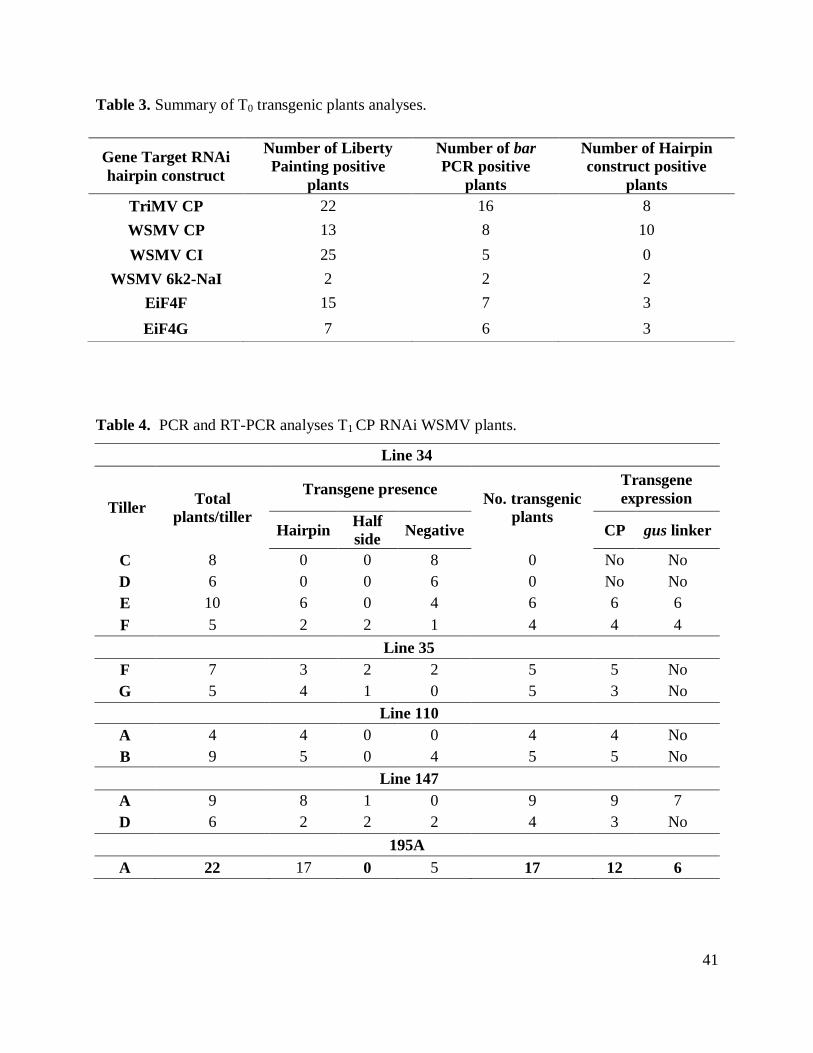
Table 3. Summary of T0 transgenic plants analyses. .................................................................. 41
Table 4. PCR and RT-PCR analyses T1 CP RNAi WSMV plants. ............................................. 41
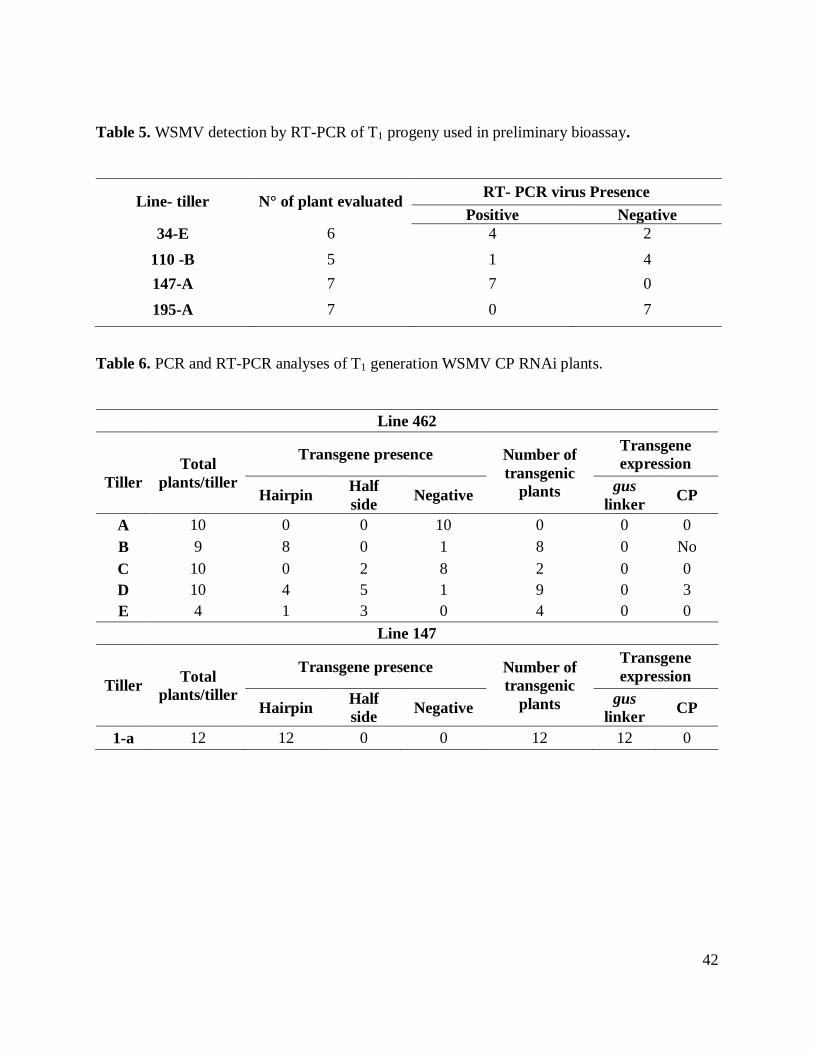
Table 5. WSMV detection by RT-PCR of T1 progeny used in preliminary bioassay. ................. 42
Table 6. PCR and RT-PCR analyses of T1 generation WSMV CP RNAi plants. ........................ 42
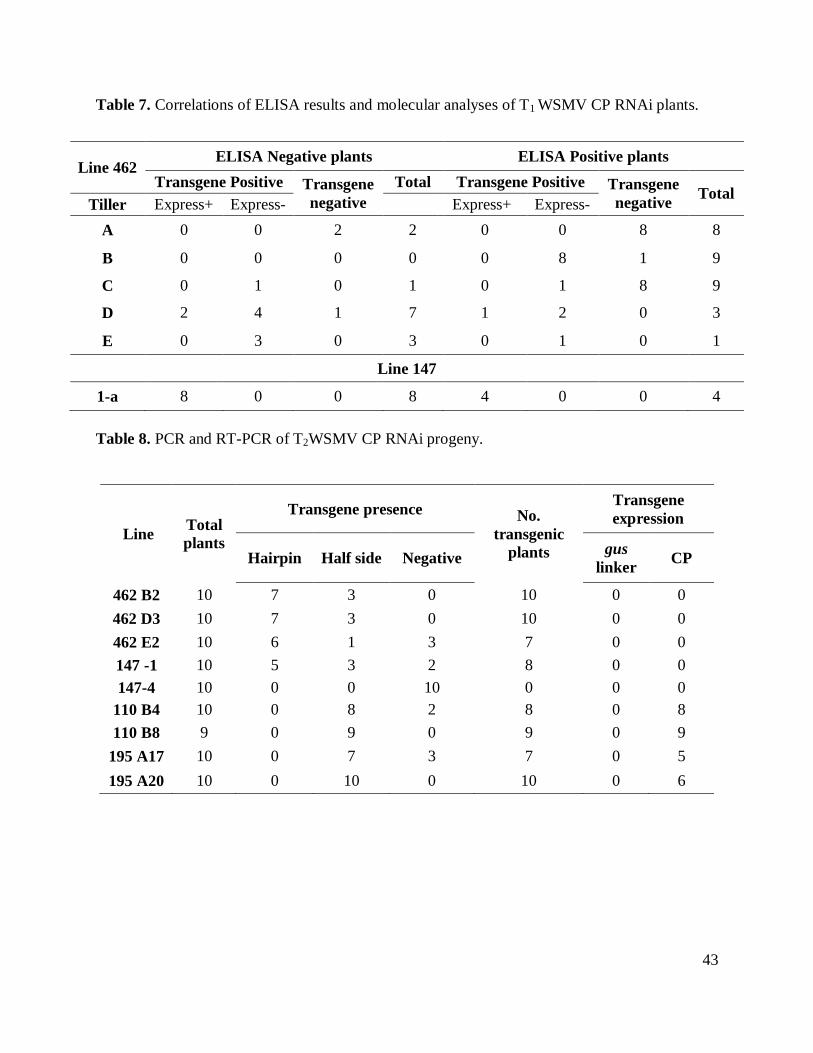
Table 7. Correlations of ELISA results and molecular analyses of T1 WSMV CP RNAi plants. . 43
Table 8. PCR and RT-PCR of T2WSMV CP RNAi progeny. ..................................................... 43
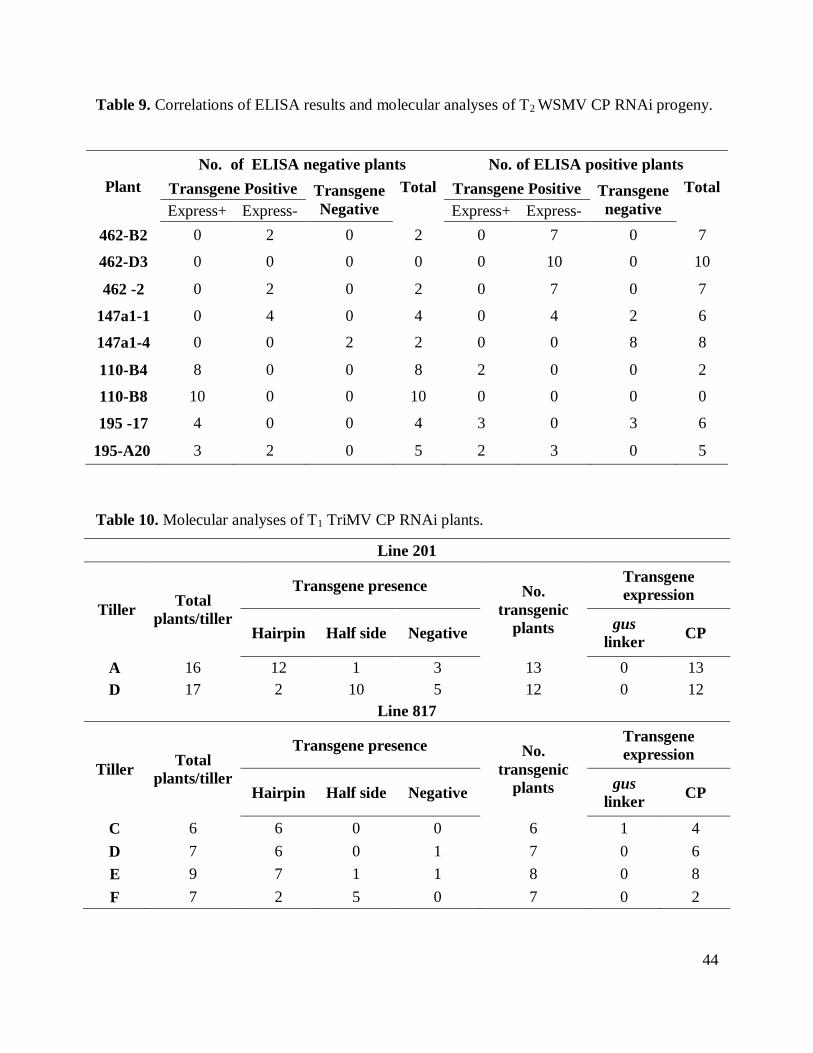
Table 9. Correlations of ELISA results & molecular analyses of T2 WSMV CP RNAi progeny. 44
Table 10. Molecular analyses of T1 TriMV CP RNAi plants. ..................................................... 44
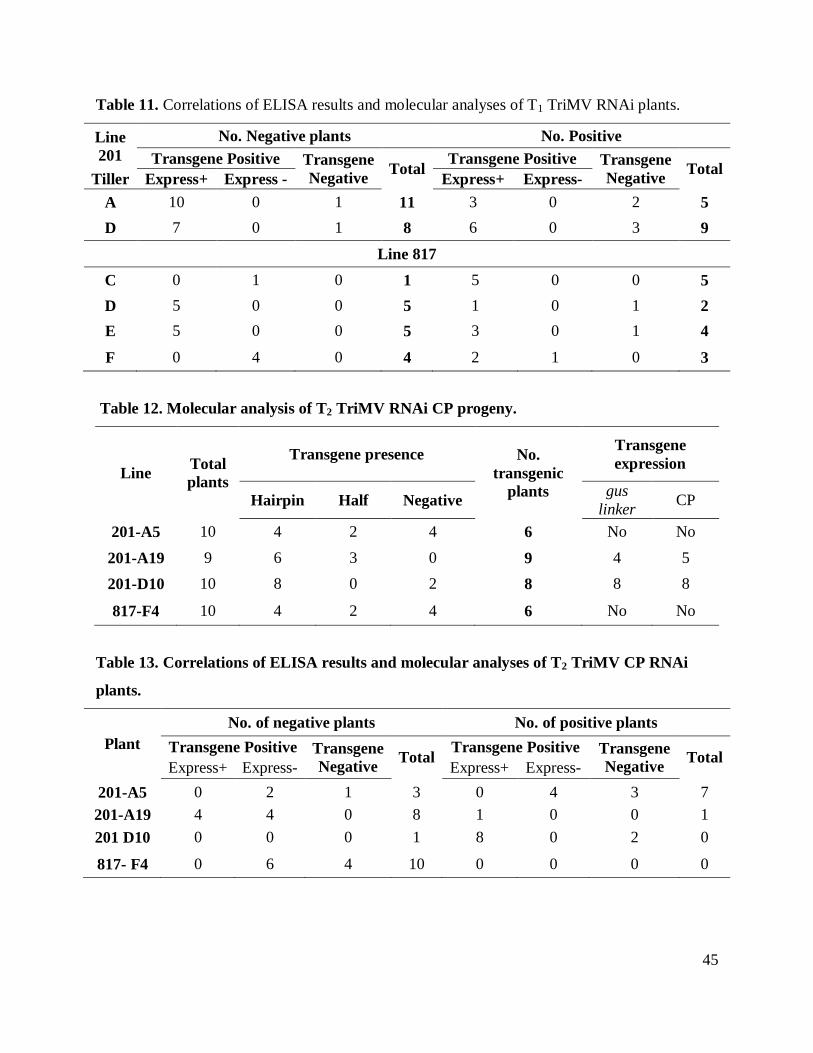
Table 11. Correlations of ELISA results and molecular analyses of T1 TriMV RNAi plants. ..... 45
Table 12. Molecular analysis of T2 TriMV RNAi CP progeny. .................................................. 45
Table 13. Correlations of ELISA results and molecular analyses of T2 TriMV CP RNAi plants. 45
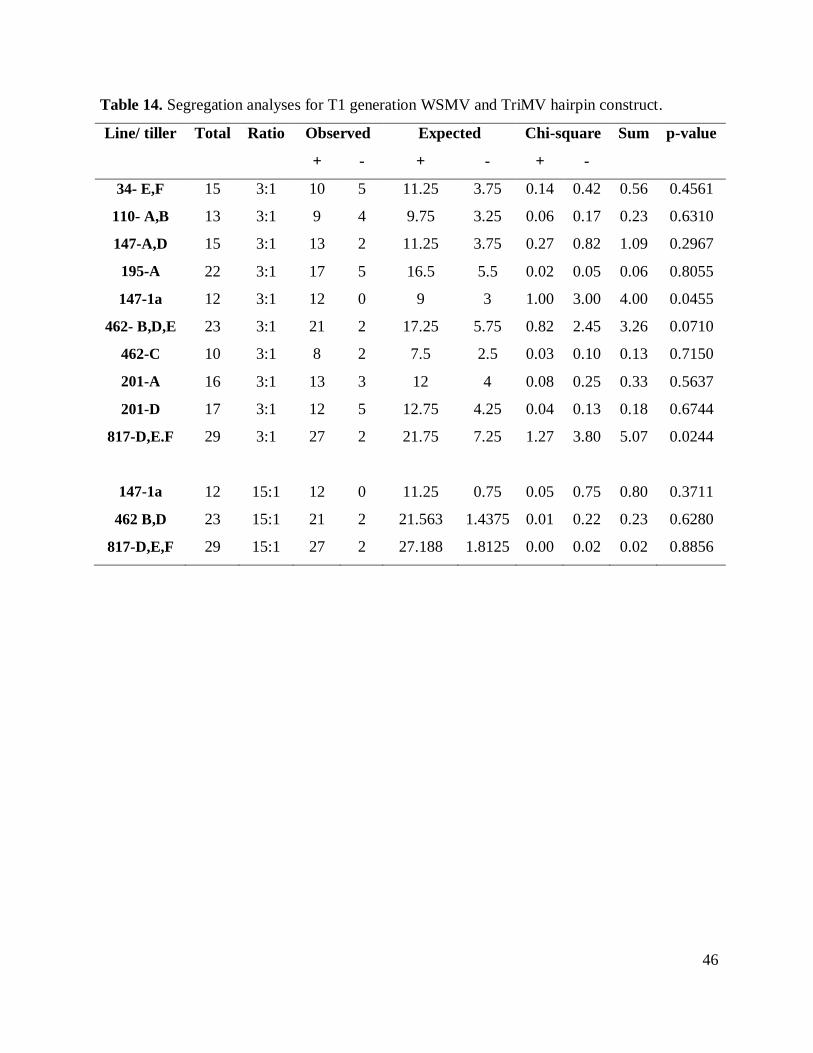
Table 14. Segregation analyses for T1 generation WSMV and TriMV hairpin construct............ 46
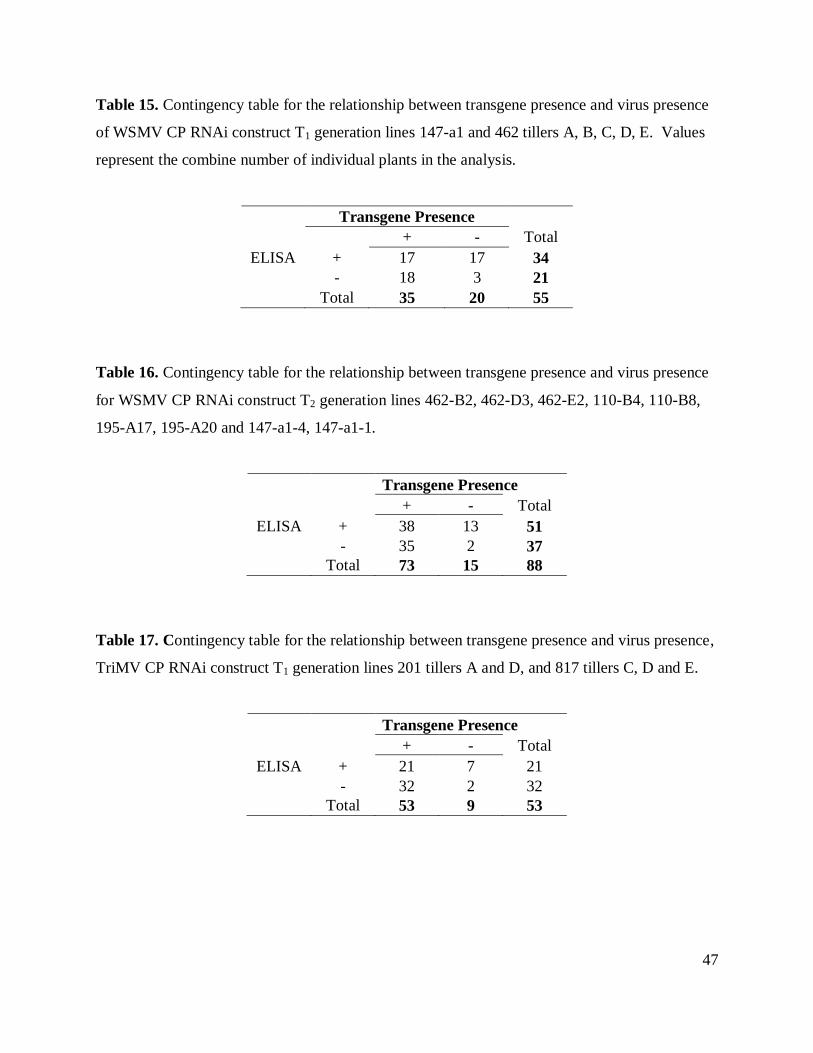
Table 15. Contingency table transgene presence and virus presence, WSMV CP RNAi T1. ....... 47
Table 16. Contingency table transgene presence and virus presence, WSMV CP RNAi T2. ....... 47
Table 17. Contingency between transgene presence and virus presence, TriMV CP RNAi T1 ... 47
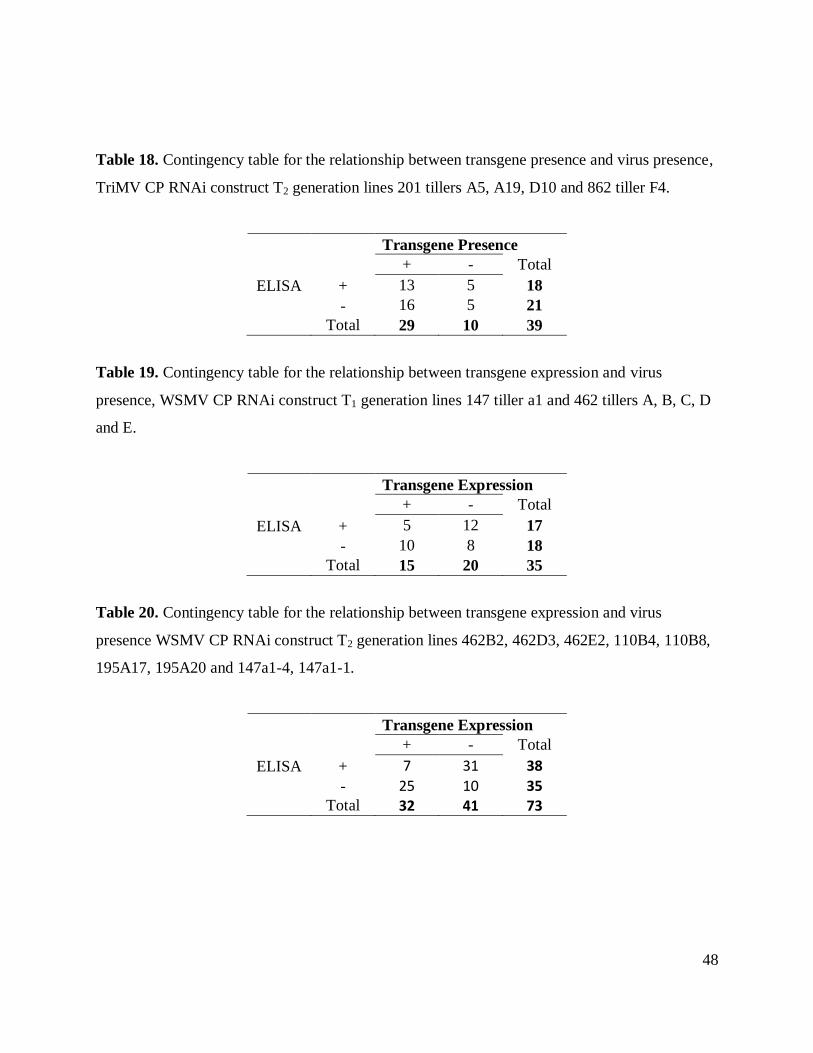
Table 18. Contingency table transgene presence and virus presence, TriMV CP RNAi T2. ........ 48
Table 19. Contingency table transgene expression and virus presence, WSMV CP RNAi T1. .... 48
Table 20. Contingency table transgene expression and virus presence, WSMV CP RNAi T2 ..... 48
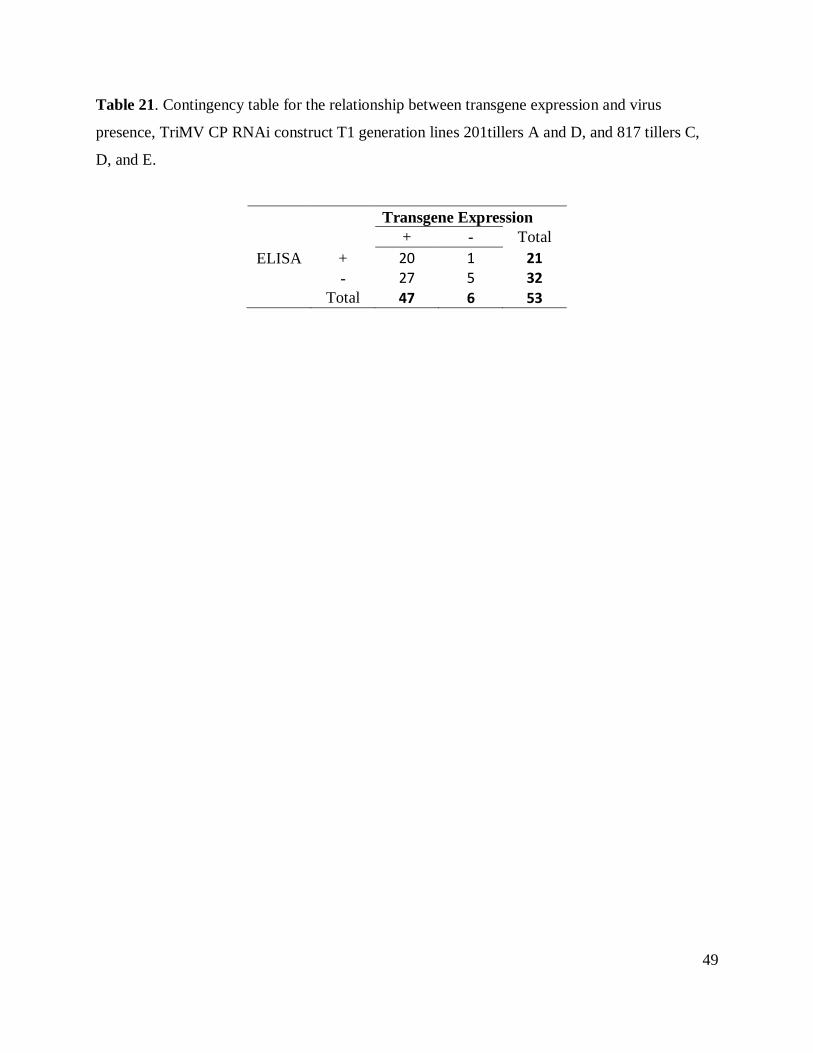
Table 21. Contingency table transgene expression and virus presence, TriMV CP RNAi T1 .... 49
Page 6
vi
Acknowledgements
I would like to thank Dr. Harold Trick for providing me the opportunity to be part of his
lab and to study at Kansas State University. I am grateful for his guidance during these years. I
also would like to thank Dr. John Fellers for his support and assistance and Dr. Anna Whitfield
for being part of my committee. I am also grateful for all the support of the members of the lab
have given me. Julie Essig for all the knowledge and advice, Sheila Stevens for all her
assistance in the laboratory techniques, and Dr. Jiarui Li and Dr. Jung Hoon Lee for answering
all my questions and assistance with the experiments. I also would like to thank Hyeonju Lee for
all her help. I am also thankful with the Plant Pathology Department graduate students and
friends for all the encouragement and support. My most sincerely gratitude goes to my family
here with me in the United States, David, Juan and Carolina and to my parents in Colombia.
Page 7
1
Introduction
The United States ranks third in the world for annual wheat production. According to the
USDA Economic Research Service, in 2008 63.15 million acres were planted and the overall
production was 2,499.52 million bushels. With half of the U.S. wheat production being exported,
the U.S. produces about 13% of the world‟s wheat and supplies about 25% of the world‟s wheat
export market. Over 70% of the wheat is used for food products, approximately 22% is used for
animal feed and residuals, and the remainder is used for seed (US Environmental Protection
Agency, epa.gov/oecaagct/ag101/cropmajor.html). Over 240,000 farms in the United States
produce wheat and although wheat is grown in most of the 50 states, approximately two-thirds of
total U.S. wheat production originates from the Great Plains. Kansas leads the nation in wheat
production and is responsible for nearly 20 percent of total domestic production. In 2008, 9.6
million acres of wheat were planted in Kansas, which produced 367 million bushels with a
market value of near $2 billion (Kansas Wheat Commission, www.kswheat.com).
A wide range of pathogens attack wheat and collectively are responsible for
approximately 13 to 15% of the annual crop losses. Agropyron mosaic virus, Wheat soil borne
mosaic virus, Wheat spindle streak mosaic virus, Wheat American striate virus, Barley yellow
dwarf mosaic virus, High Plains virus (HPV), Wheat streak mosaic virus (WSMV) and Triticum
mosaic virus (TriMV) (Siefers et al 2008) are the most economically important viruses. The
annual losses caused by WSMV are estimated to be 2.5% (Bockus et al., 2001), but can account
for over one-half of the disease loss. In 2006, Kansas growers suffered an estimated $109 million
in losses due to WSMV alone (Kansas Wheat Commission, virus-resistant germplasm). The
interaction of WSMV with other viruses, including HPV and TriMV, can increase the severity of
symptoms and yield losses (Kansas State University research and extension,
www.oznet.ksu.edu/library/plant2/ep145.pdf).
WSMV is a member of the family Potyviridae genus Tritimovirus (Stenger et al., 1998)
and was first discovered in Nebraska in 1922. Virion particles are flexuous, non-enveloped and
filamentous in shape, 690 to 700 nm long, and are made up of approximately 2000 copies the
coat protein (CP) encapsulating the genetic material. The WSMV genome consists of a positive-
Page 8
2
sense, single stranded RNA of 9,384 nt in length that encodes a single open reading frame of
3,035 amino acids (Stenger et al., 1998). The RNA genome has a 5‟- viral protein genome linked
VPg and carries a 3‟- polyadenylated tail (Fauquet et al., 2005). Potyviruses express the genome
as a single polyprotein and use a post-translational proteolytic processing strategy utilizing three
encoded proteinases to produce functional proteins (Hull, 2002). The proteinases are: P1, a
trypsin-like serine proteinase at the amino- terminal end of the polyprotein and has cis auto
catalytic activity; nuclear inclusion protein A (NIa), the major proteinase of potyviruses acting in
cis and trans; and helper component (HC-Pro), a conserved carboxy-terminal cysteine proteinase
domain that acts in cis to cleave the HC-Pro/P3 junction of the viral polyprotein (Stenger et al.,
2006; Urcuqui-Inchima et al., 2001). The polyprotein cleavage results in seven smaller proteins
denoted as P1, HC-Pro, P3, cylindrical inclusion (CI) protein, NIa, nuclear inclusion B (NIb),
CP, and two small proteins known as 6K1 and 6K2 (Riechmann, et al., 1992).
The majority of Potyviridae are aphid transmitted, however Tritimoviruses are mite-
transmitted. WSMV and TriMV are transmitted semi-persistently by the wheat curl mite Aceria
tosichella Keifer (Slykhuis, 1955; Siefers et al., 2009). The multifunctional HC-Pro has been
implicated in different steps of the potyvirus life cycle (Maia et al., 1996) in addition to its
function in virus-vector interaction (Stenger et al., 2005). Three HC-Pro regions have been
described. The amino terminus is implicated in vector transmission (Blanc et al., 1998), the
carboxy-terminus is a proteinase domain involved in polyprotein maturation (Maia et al., 1996),
and the protein central region has an essential role in viral amplification and systemic movement
(Croin et al., 1995). However, in 2005, Stenger and coworkers studied WSMV HC-Pro and they
confirmed that mutations in WSMV HC-Pro abolish long-distance movement. Their experiments
also indicate that HC-Pro was not required for replication, cell-to-cell movement, or
encapsidation of WSMV, although it might be involved in optimization some of these processes.
HC-Pro is implicated in silencing suppression (Anandalakshmi et al., 1998) and is thought to
inhibit the accumulation of siRNA by binding the 21nt short class siRNA and by interfering with
the methylation of viral RNAs or preventing RISC assembly (Mérai et al., 2006).
The CP is involved in aphid transmission and has been divided in three domains. The C-
terminal and the N-terminal expose on the surface of the particle and implicated in systemic
movement, and the conserved central domain implicated in cell-to-cell and virus encapsidation
Page 9
3
(Dolja et al., 1994). The DAG motif, located in the N-terminal domain, is conserved among the
aphid-transmissible Potyviruses and required in the interaction of HC-Pro and CP (Blanc et al.,
1997). WSMV CP lacks this motif and an interaction with the HC-Pro has not been found,
suggesting a different mechanism for virus transmission in this genus of virus (Stenger et al.,
2005).
Other proteins, such as NIa, are involved in genome amplification. In addition to its
activity in protein cleavage, the N-terminal VPg domain functions in viral replication and host
specificity. VPg is covalently attached to the viral RNA and interacts with the host cap binding
protein eukaryotic translation initiation factor 4E (eIF4E; Leonard et al., 2000). This interaction
is required for infection and could also lead the initiation of translation of viral genome
(Thivierge et. al., 2005). NIa interacts with NIb (the potyviral RNA–dependent RNA
polymerase, RdRp). These proteins are co-localized in the inclusion bodies at the nucleolus and
cytoplasm of infected cells. NIb replicase activity is found in the cytoplasm and is associated
with the replication complex during viral genome amplification (Fellers et al., 1998). Another
protein linked with replication is the 6k2 peptide. It is associated with the vesicular compartment
derived from the endoplasmic reticulum. The binding occurs via its central hydrophobic domain
and it is postulated that 6k2 anchors the viral replication complex to ER-like membranes (Schaad
et al., 1997).
The cylindrical inclusion protein (CI) belongs the „super family 2‟ of RNA helicases
characterized for the presence of seven conserved segments. Segment I is important for NTP and
RNA binding activity, segment Ia has unknown function, segment II is involved in NTPase
activity, segment III and IV are highly conserved, segment V appears to be involved in ATPase
activity required for RNA unwinding (Fernandez et al., 1995), and segment VI has been shown
to have RNA binding activity (Fernandez and Garcia, 1996) . CI protein has been implicated in
virus cell-to-cell movement. CI localized close to the plasmodesmata during early stages of
infection where ATPase activity has been found. ATPase and helicase activity are probably
required for cell-to-cell viral transport, thus CI may be involved in this function (Carrington et
al., 1998). CI also has been implicated in replication but this function is still unknown (Urcuqui-
Ichima et al., 2001).
Page 10
4
Triticum mosaic virus (TriMV) is a new virus isolated in Kansas in 2006 (Siefers et al.,
2008). TriMV was discovered infecting a WSMV-resistant wheat cultivar RonL, and symptoms
are indiscernible from those caused by WSMV. Serological analyses by ELISA of wheat
extracts gave negative reactions against antibodies specific to WSMV, other potyviruses and
High plains virus. Electron microscopy of cesium chloride purified virus preparations identified
virus like particles that were flexuous and rod shaped and 15nm wide 800nm in length. Sodium
dodecyl sulfate polyacrylamide gel (SDS-PAGE) analyses of these preparations evidenced a 35
KDa protein encoded by 882 nt corresponding to the coat protein of the infectious agent. Amino
acid sequence of this protein exhibited 49% similarity to Sugarcane streak mosaic virus
(SCSMV), a member of the family Potyviridae. To determine the vector of TriMV, Seifers and
co-workers screened two possible candidate vectors, the bird cherry oat aphid (Rhopalosiphum
padi L.) and the wheat curl mite (Aceria tosichella Keifer), both present in the geographical
localization where TriMV was found. The results showed that wheat curl mite is the vector of
TriMV and virus transmission can occur individually (WSMV or TriMV alone) or together
(Seifers et al., 2009).
Primary control strategies for WSMV and TriMV are the same. They are focused on
limiting the increase and spread of vector population, as well as minimizing the source of
inoculum. One of the main recommendations for control is the eradication of alternative mite and
WSMV hosts such as volunteer wheat and grassy weeds that can act as a virus reservoir during
the non-crop season. Planting dates are also important in order to decrease the disease impact. In
the case of winter wheat, planting earlier than the recommended date allows mite establishment
and reproduction (Kansas State University, Extension Plant pathology, www.oznet.ksu.edu/path-
ext/factSheets). Another point to take into consideration is related to the cultivar susceptibility
and genetic resistance. For WSMV, genetic sources of resistance have been found in lines that
contain the resistance gene Wsm1, which was transferred to wheat from intermediate
wheat grass
Thinopyrum intermedium (Host) Barkworth & DR Dewey (Friebe et al., 1991). However, many
derived lines have shown poor bread-making quality or agronomic properties. Other sources of
unknown origin are present in the germplasm line CO960293-2 (Haley et al., 2002)
and in the
cultivar RonL (Seifers et al., 2007). These resistance sources are temperature sensitive and not
effective at temperatures above 18°C. (Seifers et al., 2006, 2007). Friebe and co-workers (2009)
reported TriMV genetic resistance, in wheat containing also the Wsm1 gene. In this study, the
Page 11
5
Th. intermedium translocation T4DL·4JsS segment was shortened in order to reduce the
detrimental effects affecting bread-making quality and other agronomic parameters. In their
experiments were recovered one proximal (rec36) and four distal (rec45, rec64, rec87, rec213)
primary recombinants. The recombinants together with resistant and susceptible controls were
screened based on phenotypic symptoms and ELISA for the resistance to TriMV and WSMV.
Their findings indicate that distal recombinants rec45, rec64, rec87, and rec213 were resistant to
both WSMV and TriMV at low temperatures of 18°C and susceptible at 24°C (Friebe et al.,
2009).
Mechanisms of plant viral defense
R-mediated resistance to viruses
Most of the identified resistance genes that confer resistance against virus belong to the
nucleotide binding site-leucine rich repeats (NBS-LRR) family. Examples are the N gene, from
Nicotiana sp. conferring resistance to Tobacco mosaic virus: Rx1 and Rx2, cloned from Solanum
tuberosum, conferring resistance to Potato virus X; Sw-5, cloned from Lycopersicon sp. which
confers resistance to Tomato spotted wilt virus; HRT, cloned from Arabidopsis thaliana ecotype
Dijon-17 and RCY1 cloned from A. thaliana ecotype C24, which confers resistance to Cucumber
mosaic virus strain Y. Members of this family are subsequently divided in two subgroups
depending on the N-terminal domain which can contain either a coiled-coil (CC) or Toll-
interleukin-1 receptor (TIR). Corresponding with intracellular nature of viruses, NBS-LRR
products do not contain a transmembrane domain (Maule et al., 2007). Most R genes operate
through gene-for-gene recognition of the pathogen, where each R gene confers resistance to a
specific pathogen avr gene (Flor, 1971). The specificity is believed to be conferred by the leucine
rich repeats (Farnham and Baulcombe, 2006).
Hypersensitive response is typically associated with gene-for-gene resistance in which
the plant prevents the spread of the infection by inducing programmed cell death and confining
the pathogen to the lesions (Soosar et al., 2005). However, NBS-LRR virus resistance genes
frequently lead to complete resistance not associated with cell death (Maule et al., 2007).
Different viral components have been characterized as avr determinants, such as the CP,
movement proteins, replicases, as well as the potyviral protein genome-linked VPg (Maule et al.,
2007). Two models have been proposed, to explain the interaction between R genes and their
Page 12
6
cognate avr determinants. The first hypothesis proposes the direct interaction between receptor
(R gene) and ligand (avr). A second hypothesis called the „guard hypothesis‟ suggests an
additional association of R proteins with host proteins that act as negative regulators. When
infection occurs, the pathogen causes modifications in the structure of the host proteins. The R
gene detects these changes and is activated; the signaling cascade is initiated, resulting in
resistance response (Dangl and Jones, 2001).
Viruses depend on host factors to complete their infection cycle. The eukaryotic
initiation factor complex has been shown to play an important role in cell-to-cell movement,
translation, and replication of diverse families of viruses. In many cases, these factors are
considered pathogenicity determinants. The interaction of the potyviral VPg and the eukaryotic
translation initiation factors eIF4E and eIF4G have been confirmed as essential for infection
(Diaz- Pendon et al, 2004). Mutant alleles of the eukaryotic translation initiation factors can
confer recessive resistance to specific virus as demonstrated in mutagenic analyses in
Arabidopsis where the susceptibility to Clover yellow vein virus (ClYVV) and Turnip mosaic
virus (TuMV) was tested. The experiment indicated that ClYVV accumulates in leaves of mutant
plants lacking eIF(iso)4E, but not in mutant plants lacking eIF4E. In contrast, TuMV multiplied
in mutant plants lacking eIF4E, but not in mutant plants lacking eIF(iso)4E. These experiments
suggest the selective requirement of some of the elements of the eukaryotic translation initiation
complex in potyviral infection (Sato et al., 2005). Additional evidence also suggests the
requirement of eIF4G for the interaction eIF4F/VPg or its direct requirement for infection.
Arabidopsis mutants knocked-out for eIF4G genes demonstrated the selective recruitment of the
eIF4G isoforms for the infection of ClYVV, TuMV, Plum pox virus (PPV), and Lettuce mosaic
virus (LMV) (Nicaisea et al., 2007). In barley, two genes, rym4 and the allelic rym5, located in
the telomeric region of chromosome 3HL, were found to confer recessive resistance to different
strains of the Barley yellow mosaic virus (BaYMV) and Barley mild mosaic virus (BaMMV).
The barley translation initiation factor E (eiF4E) was mapped to the same chromosomal interval
and the gene product contains unique amino acid substitutions compared with the wild-type
protein. The polymorphic residues were identified at the mRNA cap-binding pocket. (Kanyuka et
al, 2005; Stein et al., 2005). Stable transformation of resistance genotypes with the full-length
cDNA of the eIF4E from susceptible plants induced susceptibility to BaMMV (Stein et al.,
2005).
Page 13
7
Posttranscriptional gene silencing
RNAi discovery history began in 1990 when Richard Jorgensen and colleagues attempted
to over express chalcone synthase (CHS), an enzyme involved in production of the anthocyanin
pigments, by introducing a chimeric petunia CHS gene with the goal to increase the purple color
in petunias. Unexpectedly, the transgenic plants produced variegate flowers or even white. They
called this phenomenon “co-suppression” (Napoli et al., 1990). In fungal systems, the
phenomena was called “quelling” and was observed in Neurospora crassa during efforts to
increase the production of an orange pigment by introducing extra copies of al1, a gene involved
in the production of carotenoid pigments. Some of the obtained transformants showed albino
phenotype (Baulcombe, 2004).
Andrew Fire and Craig Mello (1998) studied the effect of injected RNA into
Caenorhabditis elegans. The researchers used RNA from unc22, a gene that encodes for a non-
essential myofilament protein. The reduction of this protein causes twisted phenotype. In their
experiment they tested purified single sense and antisense strands, and double strand mixtures.
They found that the double strand caused the strongest reduction of the protein and twitching
phenotype. The same phenotype was exhibited by the progeny of the injected worms, which
indicated the heritability of the silencing mechanism, additionally they noticed the requirement
of few dsRNA molecules to accomplish full silencing and its specificity targeting the mRNA
corresponding to the introduced one (Fire et al., 1998). Investigations in diverse organisms have
shown common features and conserved elements. The mechanism of action of gene silencing is
similar for different taxonomic groups among the eukaryotic organisms. RNA silencing was
recognized as an antiviral regulator that protects organisms from RNA viruses‟ infection,
preventing the random integration of transposable elements (Mello and Conte, 2004). RNA
interference (RNAi) and related RNA silencing mechanisms have been also recognized for
regulation of gene expression at both the transcriptional and posttranscriptional level (Buker et
al., 2007).
The critical common component of posttranscriptional gene silencing is an RNase III–
like enzyme (Dicer) showing specificity for double-stranded RNA and was initially identified in
Drosophila extracts (Bernstein et al., 2001). Dicers contain four distinct domains: a helicase
domain, dual RNAase III motifs, a dsRNA binding domain and a PAZ domain. This enzyme is
Page 14
8
involved in the initiation of RNAi by processing the dsRNA into small interfering RNA
(siRNA), 21-27 nucleotides long with 5‟-phosphate and 3‟-hydroxyl termini, and two to three
nucleotide 3‟ overhang (Andrew and Baulcombe, 1999). siRNA serves as a specific guide for the
RNA-induced silencing complex (RISC) to recognize target messenger RNAs by homologous
base pairing and directs cleavage of the target mRNAs (Hammond et al. 2002). The main
components of the RISC belong to the family of Argonaute proteins that contain two typical
domains; a conserved PAZ domain that has an RNA- binding factor and specifically recognizes
the 3‟overhang of double stranded siRNA (Yan et al., 2003) and a PIWI domain that contain
„slicer‟ catalytic activity being able to cleave RNA in RNA/siRNA complex (Hall, 2005). The
signal of RNA silencing produces a systemic effect where the host RNA-dependent-RNA
polymerase plays an important role using siRNA as a primer further generating a dsRNA
substrate for Dicer. The signal is transmitted through the plasmodesmata and phloem
(Jorgensen, 2002). A mobile silencing signal could move either with or ahead of the virus to
silence the viral RNA before, or at the same time (Baulcombe, 2004).
In plants, the post transcriptional silencing mechanism acts as a natural defense strategy
for virus infections. RNA silencing allows cells to distinguish non-self mRNA, which later will
be targeted for degradation (Pooggin et al. 2001). RNAi process involves three basic features;
induction by dsRNA, processing of dsRNA into 21-25nt siRNA, and finally the inhibitory action
of the effector complex that targets mRNA homologous to siRNA previously incorporated (Ruiz
& Olivie, 2007). DNA and RNA viruses, as well as transgenes that contain hairpin structures,
can induce RNA silencing. In plant viral infection, viruses with secondary-structure, a feature of
single-stranded viral RNA, might be the trigger for RNA silencing (Soosaar et al., 2005).
Pathogen derived resistance is a concept based on the use of pathogen genes and their
expression in a host. This generates a product that interferes with the pathogenic process by
acting as a negative regulator and conferring disease resistance to the host (Standford et al.,
1985). Beachy et al. in 1986 published the first study probing this theory in plant virus.
Transgenic plants expressing the CP of Tobacco mosaic virus (TMV) were challenged with
TMV. The authors found that the plants displayed no symptoms or had a delay in the appearance
of symptoms (Beachy et al. 1990). John Lindbo and William Dougherty (1993) expressed the
CP of Tobacco etch virus (TEV) in a series of experiments using translational and non-
Page 15
9
translatable version of CP. Their findings were opposite to the expected. Several lines expressing
the non-translatable version of CP showed complete resistance to TEV. In contrast, the lines
corresponding to the CP translatable version showed systemic recovery phenotype in the new
leaves. Resistant lines were susceptible to the closely related virus Potato virus Y, confirming the
specificity of this mechanism. Analyses of transgene transcription level and steady-state level of
TEV-RNA in both TEV-recovery and unchallenged transgenic plants, showed a similar
transgene transcription rates but a notable reduction in steady-stage level in recovered plants.
These results indicated that the mechanism involved in the resistance response was mediated in a
sequence specific manner at the cytoplasmatic level (Linbdo and Dougherty, 1993). In 1998,
Tanzer and co-workers characterized the post-transcriptional suppression in the TEV CP
transgenic lines. The authors investigated characteristics of two sets of low molecular weight
RNAs that appear just in silenced tissue, and determined a correlation between the decrease of
full length of transgenic mRNA and the increase in the levels of low molecular weight RNAs.
Their hypothesis established that transgene and viral RNA silencing share a common
mechanism, which occurs in the cytoplasm and does not require ongoing translation (Tanzer et
al., 1997).
The development and implementation of methods to enhance the natural plant defense
response include artificial introduction of single stranded RNA, dsRNA or miRNA constructs
(Meister and Tuschl, 2004). Some authors propose that single sense transgene, induced-RNA
silencing requires the plant-encoded RNA-dependent RNA polymerase to produce a
complementary strand (Beclin et al., 2002). This hypothesis would explain higher efficiency
found with inverted repeats transgenes that are directly processed into siRNA. (Helliwell &
Waterhouse, 2005).
Hairpin efficiency was initially exploited by Smith and coworkers (2000) in Nicotiana
tabacum plants transformed with a construct encoding a single self-complementary hairpin RNA
containing the NIa-protease (NIa-Pro) gene sequence of Potato virus Y (PVY) in sense and
antisense, flanking the 800-nucleotide spacer derived from the uidA (gus) gene. Their results
indicate 65% of the plants were immune. Next, a hairpin-less double strand construct containing
an intron as a spacer was tested and the spacer was spliced out during pre-RNA processing. The
results from this experiment indicate 96% plant resistance. Separate sense and antisense
Page 16
10
constructs where transformed into the tobacco plants and showed just 7% and 4 % of immune
plants, respectively (Smith et al. 2000). Bucher and colleagues (2006) report multiple viral
resistances by using a single transgene construct. A chimeric cassette was made targeting four
different tospoviruses: Tomato spotted wilt virus (TSWV), Groundnut ringspot virus (GRSV),
Watermelon silver mottle virus (WSMoV) and Tomato chlorotic spot virus (TCSV). The
construct was obtained from 150 bp fragments of the N gene of each virus. The sequence
segments where fused by PCR and cloned to form inverted repeats, which flanked an intron
obtained from Arabidopsis thaliana. The authors determined that virus resistance frequencies of
over 80% could be obtained to the four different tospoviruses in the same mixed infection. The
resistance was correlated with siRNA presence (Bucher et al., 2006).
Micro RNAs, miRNAs, are known to be important regulators of plant development and
have been implemented to confer virus resistance by adapting their original sequence to target
specific viral transcripts. Niu and colleagues (2006) used a 273 bp miRNA precursor (hairpin
structure), miR159, from A. thaliana as backbone to express an artificial miRNA, targeting two
viral silencing suppressors, p69 of Turnip yellow mosaic virus (TYMV) and HC-Pro of Turnip
mosaic virus (TuMV). The artificial miRNA (amiRNA) were transcribed independently for each
virus in addition to a dimeric pre-miRNA containing both. Their findings indicate that,
transgenic plants expressing the miRNA displayed normal morphology and 100% virus
resistance in single or mixed infections depending on the miRNA. Additionally the resistance
was maintained at 15ºC, temperature that typically compromises siRNA gene silencing (Niu et
al., 2006).
Virus-induced gene silencing systems (VIGS) are used as tool for the analysis of gene
function in plants. In VIGS, viruses are engineered to carry sequences derived from plant
genome transcripts, activating the host sequence-specific RNA degradation system. This
mechanism targets the plant sequence RNA encoded in the viral genome for degradation. This
technique also has been used for knocking down genes and screening for desirable traits such as
disease resistance or drought tolerance (Gura, 2000).
WSMV transgenic resistance
A previous study on WSMV pathogen derived resistance using the full length of
potyviral replicase NIb found a substantial delay in symptoms development or asymptomatic
Page 17
11
plants. The transgene expression and viral resistance were evaluated in lines of the T2 and T3
generations of NIb transgenic material. The phenotypical observations made from the transgenic
material at three different time points indicate various degrees of resistance response including
recovery phenotype, new leaves that exhibit no symptoms and were negative in ELISA
detection, which. Interestingly five out of six lines evaluated did not show transgene mRNA
expression (Sivamani et al., 2000).
Independent experiments have been done using the CP of WSMV. Sivamani and co-
workers transformed wheat with a construct containing the full length of the WSMV coat
protein. One out of five lines that were evaluated showed resistance to WSMV, the observed
resistance corresponded to recovery phenotype. Oppose to the previous results, the resistant line
showed high levels of CP mRNA expression but not CP protein expression. Another remark was
the high number of transgene copies in this line (Sivanami et al., 2002). A second work using
the full length of the CP of WSMV was made by Li and colleagues. As was found in previous
studies, the authors found strong resistance in some of the lines containing the transgene
evaluated for the first generation of plants, however analyses of T2 and T3 transgene loss or
silencing and the corresponding susceptible phenotypes (Li et al., 2005).
The objectives of my study were: 1. Designed RNAi hairpin constructs from sequence
the CP of WSMV and TriMV; 2. Produce transgenic wheat via biolistic approach; 3.
Characterize transgenic plants at molecular level; 4. Perform bioassays in T1 and T2 progeny of
transgenic material and; 5. Detect the siRNA molecules in resistant lines.
Page 18
12
Materials and Methods
Plasmid Construction:
Primers were designed from the sequence of the coat protein (CP) of Triticum mosaic
virus (TriMV) (GenBank Accession #EF173696) and Wheat streak mosaic virus (WSMV)
(GenBank Accession #AF057533) using Integrated DNA Technologies, Primer Quest and
OligoAnalyzer 3.0 program (www.idtdna.com). For TriMV CP gene amplification, the primer
sequences of 5‟-CACCGATAGACGATGCGACTGGGCAAAT-3‟ and 5‟-
TCTGTTCCTGTGGTGAAAGCTGGT -3‟were selected for the forward and reverse primers,
respectively. For WSMV CP gene amplification, the primer sequences of 5‟-
CACCAATGCAGGCAAGGACAATGAGCAG-3‟and 5‟-
TCTGTTCCTGTGGTGAAAGCTGGT-3‟ were selected. The sequence of CACC was added to
the 5‟ end of both forward primers to allow the directional cloning of the PCR fragment into the
entry vector pENTER-D/TOPO (Invitrogen, Carlsbad, CA).
RNA was extracted using TRIZOL® (Invitrogen, Carlsbad, CA) isolation, according to
the manufacturer‟s instructions. One hundred mg of symptomatic leaf tissue was ground in
liquid nitrogen, homogenized in 1ml of TRIZOL® reagent, and incubated for 5 min at room
temperature. Two hundred µl of chloroform was added to the homogenate and the sample was
vortexed for 30 sec. Samples were centrifuged at 12,100 xg in a Eppendorf centrifuge 5415 C at
4 ⁰C. Total RNA was precipitated using 500 µl 100% isopropyl alcohol, washed with 500 µl
75% ethanol, and resuspended in 40 µl Diethyl pyrocarbonate (DEPC)-treated water. Total RNA
was quantified in a Nanodrop spectrophotometer (NanoDrop Technologies, Rockland, DE).
RT-PCR was performed on total RNA using the Reverse Transcription System Kit (cat #
A3500, Promega, Madison, WI). cDNA was synthesized according to the manufacturer‟s
instructions. One mg of total RNA was denaturated at 65 ⁰C for 15 min and placed on ice for
five min. The reverse transcription reaction mixture containing 5 mM MgCl2; 1X Reverse
Transcription Buffer (10mM TRIS-HCl pH 9.0 at 25 °C; 50mM KCl; 0.1% Triton®X-100);
Page 19
13
1mM each dNTP; 1 u/μl Recombinant RNasin® Ribonuclease Inhibitor 15 u/μg; AMV Reverse
Transcriptase; 0.5μg random primers per microgram of RNA was immediately added to the RNA
samples and were incubated at room temperature for 10 min followed by incubation at 42 °C for
one hour. To inactivate the AMV enzyme, samples were heated at 95 °C for five min and then
placed on ice. cDNA was used as a template for the CP primers described above. PCR products
were purified with QIAquick® PCR Purification Kit (Qiagen, Germantown, MD) following the
manufacturer‟s protocol. Briefly, five volumes of PB were added to one volume of PCR sample.
The mixture was applied to a supplied DNA binding column and centrifuged for 60 sec at 9,300
xg, the column was washed with 0.75 ml of PE buffer, and DNA was eluted by applying 40 μl of
65 °C prewarmed water.
Purified sequence fragments were subcloned into the entry vector pENTER-D/TOPO,
which carries two recombination sites, attL1 and attL2 for the next cloning step (Figure 1). The
cloning reaction was carried out according to the manufacturer‟s instructions. 500 ng of PCR
product was mixed with 1 μg of pENTER-D/TOPO vector and 1 µl of salt solution (1.2 M NaCl,
0.06 M MgCl2). The reaction was incubated for 5 min at room temperature, 2 µl of the solution
were added into a vial E. coli TOP 10 competent cells (Invitrogen, Carlsbad, CA), and incubated
on ice for 30 min. The cells were transformed via heat shock for 30 sec at 42 °C and immediately
transferred to ice, 250 μl of room temperature S.O.C. medium (2% Tryptone, 0.5% yeast extract,
10 mM NaCl, 2.5 mM KCl, 10mM MgCl2, 10 mM MgSO4, 20mM glucose) were added and the
mix was shaker incubated for 1 hour at 37 °C. Transformed bacteria were placed on LB medium
containing 50 mg/L kanamycin sulfate and incubated overnight at 37 °C. Putative colonies were
individually selected and cultured in 5 ml of LB broth containing the selective antibiotic. For
bacteria DNA extraction, E.Z.N.A Plasmid Mini Kit from Omega Bio-Tek, Inc. (Norcross, GA)
was used following the manufacturer‟s instructions. Briefly, the bacterial cells were pelleted by
centrifugation and resuspended in 250 μl RNases solution I. Two hundred and fifty μl of the
alkaline-SDS lytic solution II was added and the tube was inverted four to six times to form a
clear lysate. To neutralize the solution and precipitate proteins and carbohydrates, 250 μl of
solution III was added to the lysate. The lysate was then centrifuged at 10,000xg and the
supernatant was added to the supplied binding column. The column was centrifuged for one
minute at maximum speed in a microcentrifuge. The column was then washed with 700 μl of
DNA washing buffer-containing ethanol and spun for 60 sec at maximum rpm. The DNA was
Page 20
14
eluted from the column with 40 μl of 65 °C prewarmed water followed by 60 sec of
centrifugation at maximum rpm. Bacterial DNA PCR and restriction endonuclease digestion
were used to confirm the presence of the CP fragments. DNA sequencing was performed by
KSU DNA Sequencing and Genotyping Facility to determine the correct orientation of the
inserts as well as verifying proper amplification of the sequences derived from the CP of each
virus.
To produce the plant expression vector, the CP fragments were independently cloned into
pANDA mini vector (Daisuke Miki and Ko Shimamoto, 2003; Figure 1) by means of a
homologous recombination reaction LR clonase (Invitrogen, Carlsbad, CA). This reaction
between the entry and destination vector allowed the insertion of the identical CP fragments in
two regions defined by the recombination sites attB1 and attB2. Consequently the gus linker is
flanked by the two identical copies of the CP in opposite directions. The transformation
procedure was completed using 50 µl of heat shock JM109 competent cells (Promega)
transformed with the 25 ng of LR reaction containing the pANDA vectors. The bacteria were
incubated on ice for 30 min, heat-shocked at 42 °C for 90 sec and placed on ice for 2 min. Five
hundred µl of S.O.C. medium was added to the transformed bacteria and incubated for 45 min at
37 °C while shaking at 250 rpm. The bacteria were plated in LB medium with 100 mg/L
ampicillin and incubated overnight at 37 °C. Colony PCR was performed to confirm the presence
of the gene fragment in both recombination sites of pANDA mini and sequencing was required
to confirm correct insertion of the gene fragment.
Plant Transformation
Plant material
Immature seed, 10 to 14 days post anthesis of the Triticum aestivum L. cultivars
Bobwhite and Fielder were harvested from greenhouse-grown plants and surface sterilized with
20% bleach and 0.04% Tween-20. Excised embryos were cultured on callus induction medium
CM4 (Table 1) in the dark at room temperature (Figure 2.A). The embryos were oriented on the
medium so that the embryo axis was in contact with the medium (Figure 2.B). After one week,
organized callus on the scutellum was selected for bombardment. Prior to bombardment the
Page 21
15
embryos were air-dried for one hour in laminar flow hood in order to decrease the osmotic
pressure of the cells.
Bombardment
Wheat transformation was performed through biolistic particle delivery system as
described by Anand et al, (2002). Embryos were co-bombarded with the vector pAHC20
containing the ubiquitin promoter, the RNAi construct containing the target gene for either
TriMV or WSMV, and bar herbicide resistance, which confers ammonium glufosinate resistance
(Christensen and Quail, 1996; Figure 4). Bombardment experiments were performed using
helium at 4136.85438 millibars of gas pressure under -1 930.53204 millibars vacuum conditions.
Fifty mg of tungsten particles were sterilized, washed, and resuspended in 500µl of sterile water
of which 25 µl of resuspended particles were with coated with 5µg of the RNAi plasmid DNA
and equal amount of the co-bombardment plasmid. The DNA was precipitated with 25 µl of 2.5
M of CaCl2 and 10 µl of 100 mM spermidine. The emulsion was kept on ice for 4 min and 50 µl
of supernatant was removed, 2 µl of the remaining mix was used for each bombardment. Five
independent assays using 180 embryos in each experiment was used for each plasmid construct.
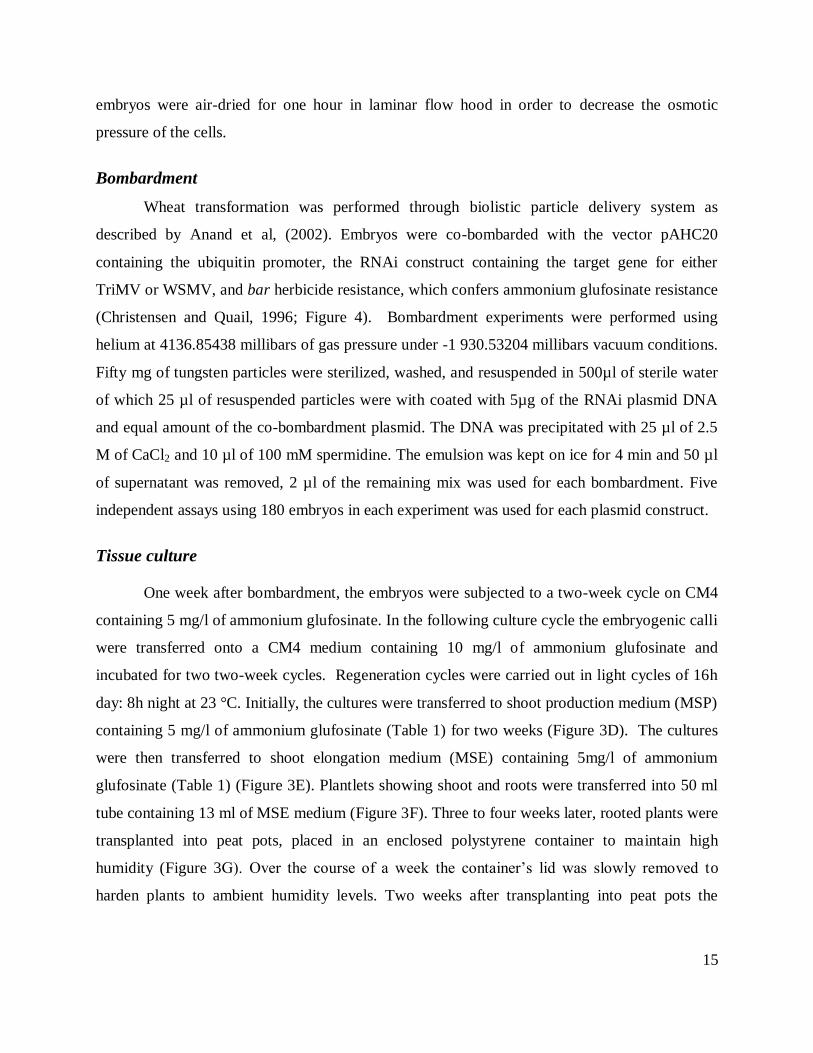
Tissue culture
One week after bombardment, the embryos were subjected to a two-week cycle on CM4
containing 5 mg/l of ammonium glufosinate. In the following culture cycle the embryogenic calli
were transferred onto a CM4 medium containing 10 mg/l of ammonium glufosinate and
incubated for two two-week cycles. Regeneration cycles were carried out in light cycles of 16h
day: 8h night at 23 °C. Initially, the cultures were transferred to shoot production medium (MSP)
containing 5 mg/l of ammonium glufosinate (Table 1) for two weeks (Figure 3D). The cultures
were then transferred to shoot elongation medium (MSE) containing 5mg/l of ammonium
glufosinate (Table 1) (Figure 3E). Plantlets showing shoot and roots were transferred into 50 ml
tube containing 13 ml of MSE medium (Figure 3F). Three to four weeks later, rooted plants were
transplanted into peat pots, placed in an enclosed polystyrene container to maintain high
humidity (Figure 3G). Over the course of a week the container‟s lid was slowly removed to
harden plants to ambient humidity levels. Two weeks after transplanting into peat pots the
Page 22
16
putative transgenic wheat were transplanted into one-gallon pots, transferred into a growth
chamber (16h light 23 °C: 8h dark at 18 °C).
Plant Evaluation
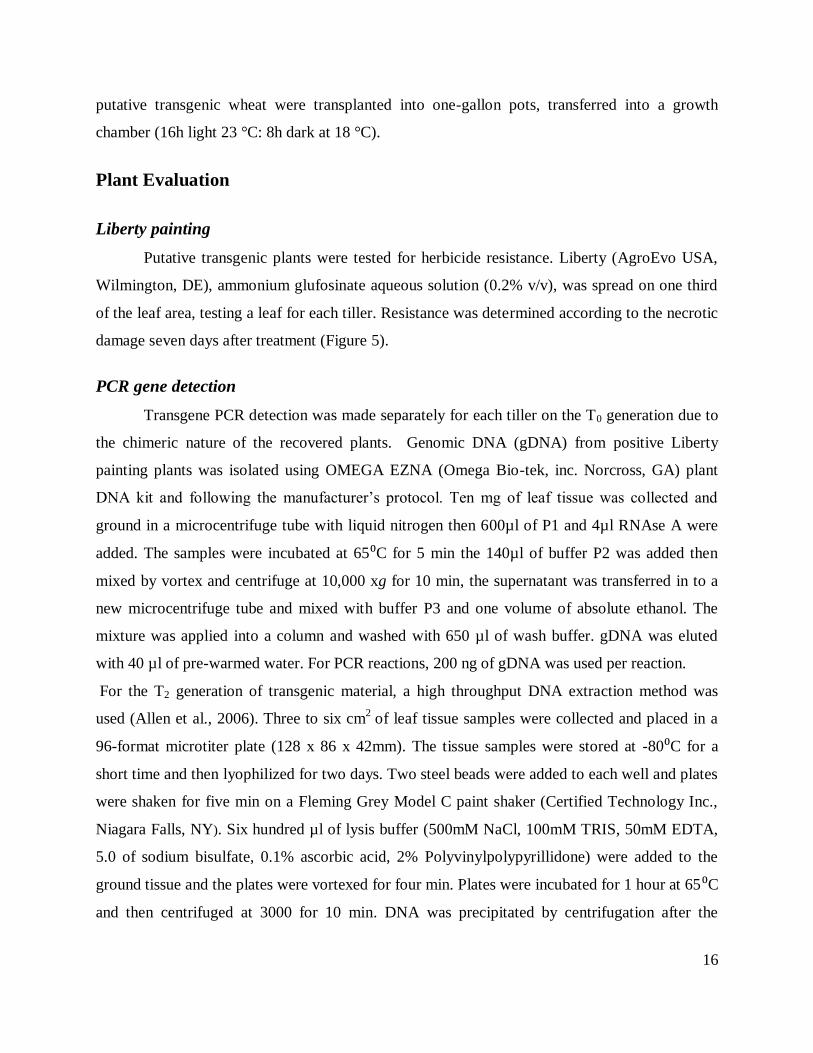
Liberty painting
Putative transgenic plants were tested for herbicide resistance. Liberty (AgroEvo USA,
Wilmington, DE), ammonium glufosinate aqueous solution (0.2% v/v), was spread on one third
of the leaf area, testing a leaf for each tiller. Resistance was determined according to the necrotic
damage seven days after treatment (Figure 5).
PCR gene detection
Transgene PCR detection was made separately for each tiller on the T0 generation due to
the chimeric nature of the recovered plants. Genomic DNA (gDNA) from positive Liberty
painting plants was isolated using OMEGA EZNA (Omega Bio-tek, inc. Norcross, GA) plant
DNA kit and following the manufacturer‟s protocol. Ten mg of leaf tissue was collected and
ground in a microcentrifuge tube with liquid nitrogen then 600µl of P1 and 4µl RNAse A were
added. The samples were incubated at 65⁰C for 5 min the 140µl of buffer P2 was added then
mixed by vortex and centrifuge at 10,000 xg for 10 min, the supernatant was transferred in to a
new microcentrifuge tube and mixed with buffer P3 and one volume of absolute ethanol. The
mixture was applied into a column and washed with 650 µl of wash buffer. gDNA was eluted
with 40 µl of pre-warmed water. For PCR reactions, 200 ng of gDNA was used per reaction.
For the T2 generation of transgenic material, a high throughput DNA extraction method was
used (Allen et al., 2006). Three to six cm2
of leaf tissue samples were collected and placed in a
96-format microtiter plate (128 x 86 x 42mm). The tissue samples were stored at -80⁰C for a
short time and then lyophilized for two days. Two steel beads were added to each well and plates
were shaken for five min on a Fleming Grey Model C paint shaker (Certified Technology Inc.,
Niagara Falls, NY). Six hundred µl of lysis buffer (500mM NaCl, 100mM TRIS, 50mM EDTA,
5.0 of sodium bisulfate, 0.1% ascorbic acid, 2% Polyvinylpolypyrillidone) were added to the
ground tissue and the plates were vortexed for four min. Plates were incubated for 1 hour at 65⁰C
and then centrifuged at 3000 for 10 min. DNA was precipitated by centrifugation after the
Page 23
17
addition of 50 µl of 10 mM NH4Ac and 400µl isopropanol to the supernatant. The resulting
pellet was washed with 400 µl of 70% ethanol and resuspended in 100 µl TE buffer.
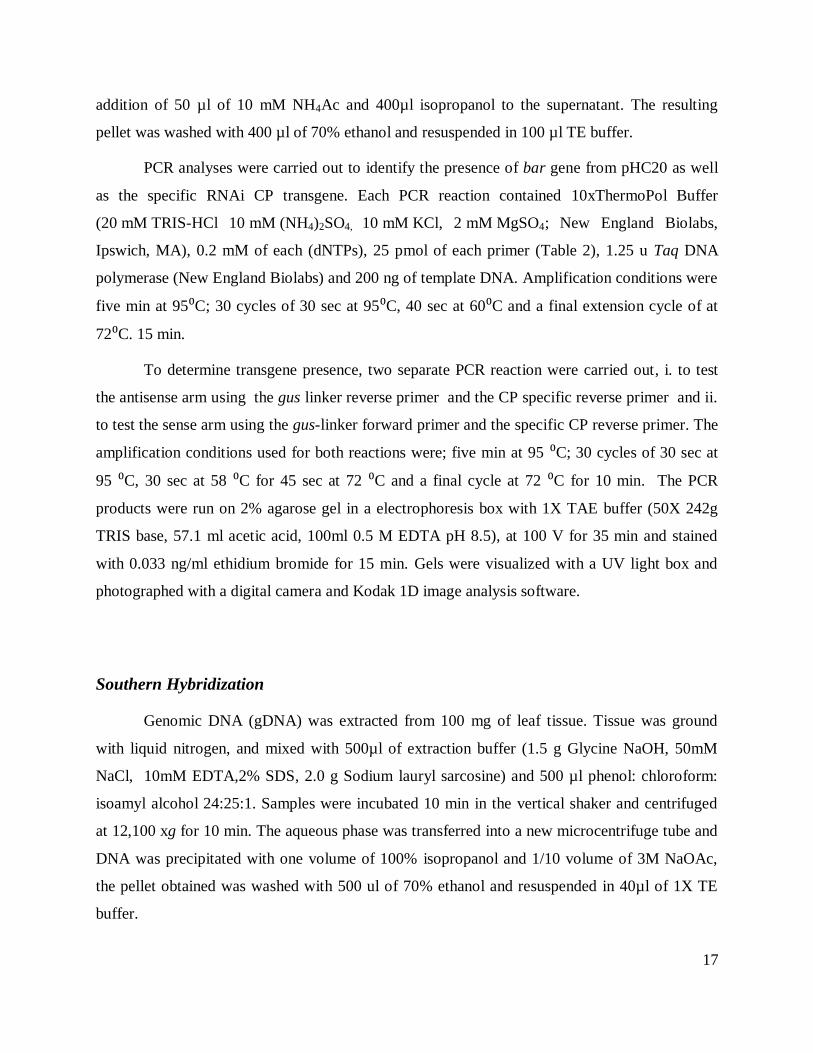
PCR analyses were carried out to identify the presence of bar gene from pHC20 as well
as the specific RNAi CP transgene. Each PCR reaction contained 10xThermoPol Buffer
(20 mM TRIS-HCl 10 mM (NH4)2SO4, 10 mM KCl, 2 mM MgSO4; New England Biolabs,
Ipswich, MA), 0.2 mM of each (dNTPs), 25 pmol of each primer (Table 2), 1.25 u Taq DNA
polymerase (New England Biolabs) and 200 ng of template DNA. Amplification conditions were
five min at 95⁰C; 30 cycles of 30 sec at 95⁰C, 40 sec at 60⁰C and a final extension cycle of at
72⁰C. 15 min.
To determine transgene presence, two separate PCR reaction were carried out, i. to test
the antisense arm using the gus linker reverse primer and the CP specific reverse primer and ii.
to test the sense arm using the gus-linker forward primer and the specific CP reverse primer. The
amplification conditions used for both reactions were; five min at 95 ⁰C; 30 cycles of 30 sec at
95 ⁰C, 30 sec at 58 ⁰C for 45 sec at 72 ⁰C and a final cycle at 72 ⁰C for 10 min. The PCR
products were run on 2% agarose gel in a electrophoresis box with 1X TAE buffer (50X 242g
TRIS base, 57.1 ml acetic acid, 100ml 0.5 M EDTA pH 8.5), at 100 V for 35 min and stained
with 0.033 ng/ml ethidium bromide for 15 min. Gels were visualized with a UV light box and
photographed with a digital camera and Kodak 1D image analysis software.
Southern Hybridization
Genomic DNA (gDNA) was extracted from 100 mg of leaf tissue. Tissue was ground
with liquid nitrogen, and mixed with 500µl of extraction buffer (1.5 g Glycine NaOH, 50mM
NaCl, 10mM EDTA,2% SDS, 2.0 g Sodium lauryl sarcosine) and 500 µl phenol: chloroform:
isoamyl alcohol 24:25:1. Samples were incubated 10 min in the vertical shaker and centrifuged
at 12,100 xg for 10 min. The aqueous phase was transferred into a new microcentrifuge tube and
DNA was precipitated with one volume of 100% isopropanol and 1/10 volume of 3M NaOAc,
the pellet obtained was washed with 500 ul of 70% ethanol and resuspended in 40µl of 1X TE
buffer.
Page 24
18
For each sample each, 30 µg of gDNA was digested with 50U of KpnI and the reaction was
carried out at 37 ⁰C for 24 hours. A positive control of 1 µg plasmid DNA was digested
with KpnI, the reaction was incubated for 1 hour at 37⁰C, inactivated at 65⁰C, and diluted to
obtain a final concentration of 5 pg/µl. The samples and positive control were loaded in a
0.8% agarose gel and separated for 24 h at 35 volts. Gels were stained with ethidium
bromide and visualized in the UV box to verify proper digestion and equal loading of DNA.
The gels were depurinated in two volumes of 0.25N HCl and denatured in 0.4 M NaOH for
20 min, the N+ membrane (Amershad Biosciences, Piscataway, NJ) was equilibrated in the
same solution for 10 min. The DNA in the gel was transferred using semi-dry capillary
method. After transfer the membrane was washed in 2xSSC for two min. (Sambrook and
Russell, 2001).
Blots were pre-hybridized with 20 ml of hybridization buffer (5x SSC, 0.5% SDS, 20 mM
Na2PO4) and 500 µl of denatured ssDNA and incubated at 65 ⁰C over night. Portions of the
CP and bar gene were used as probes (Figure 4). The radioactive labeling of the segments
was made using 50-100 ng probe DNA (boiled for 10 min and set on ice for 10 min), 5X
labeling buffer (500 mM TRIS, 35mM MgCl, 5.0mM DTT), 1.5 µl random primers, 5 µl of
dNTP-dCTP (3mM each), 1.0 µl Pol2 Klenow fragment and 5.0 µl dCTP32
. The labeling
reaction was carried out overnight at room temperature. The probe was purified using a
NICKTM
column (GE Healthcare, UK) following manufacturer‟s instructions. The probe
was denatured at 95 ⁰C for five min and kept on ice for five min before being added into the
hybridization tube. The membrane was hybridized at 65 ⁰C overnight. The membrane was
then washed twice with washing buffer 1 (5% SDS 4mM NaHPO4) for 30 min and washing
twice with buffer 2 (1% SDS 4mM NaHPO4) for 30 min. The membrane was exposed a
phosphor screen for 24 hours and scanned with the Storm TM
840 (Sambrook and Russell,
2001).
T1 and T2 Generation Evaluation
Seeds from T0 positive plants were collected and germinated. DNA was extracted from
plants and PCR analysis was used to confirm the presence of the gene of interest. Total RNA was
extracted as described above to determine the transgene expression. RT-PCR was performed on
Page 25
19
total RNA using the Reverse Transcription System (catalog # A3500) from Promega. cDNA was
synthesized according to the manufacturer‟s instructions as previously described in the cloning
process. The cDNA was used as a template for two PCR reactions; the first one to determine the
expression of the gus linker using gus sense and anti sense primers to amplify a fragment of 636
bp in length from the gus linker. The second reaction was made to determine the expression of
the CP fragment on WSMV or TriMV RNAi transgenic plants. An additional PCR was
performed using primers designed from an endogenous gene, alpha tubulin (Li et al. 2005), to
verify the amount of the cDNA and discard any eventual DNA contamination. A PCR product of
500 bp as opposed to the expected 400 bp fragment would indicate presence of DNA
contamination in the sample.
Bioassays
Bioassays were carried out on T1 and T2 generation plants at the three-leaf stage after
they were tested for the presence of the transgene and its expression. Mechanical inoculation was
done using 1 g of fresh leaf tissue infected with TriMV or WSMV, blended with 20 ml of 0.02M
Phosphate buffer (2.74 g KH2PO4, 3.48 g KHPO4 in 1L water) and filtrated through cheesecloth
to remove plant tissue. The filtrate was added to de-Vilbiss atomizer sprayer along with 0.3 g of
carborundum powder. Inoculations were made using compressed air at 25-30 psi, on the adaxial
surface of the second leaf until a small “water-soaked” spot was present. After inoculation, plants
were incubated in a controlled-environment chamber (16:8 l:d cycle, 500 µE m
–2 s
–1) at 19 ⁰C.
Leaf samples were taken 14 to 21 days post-inoculation and stored at -80 ⁰C until used ELISA or
RT-PCR.
ELISA T1 and T2 generation
Virus presence was determined by indirect enzyme-linked immunosorbent assay (ELISA)
according to prescribed protocol (Agdia). Samples from transgenic material, nontransgenic
inoculated wheat, and uninfected samples were used in the assays. 100 µl of indirect coating
buffer (15 mM Na2CO3, 34.8 mM NaHCO3, 3 mM NaN3) were pipetted into the ELISA plate
Page 26
20
wells. Two hundred mg of leaf tissue were ground with 2 ml of indirect extraction buffer (1X
PBS, 10g polyvinyl pyrrolidone; Agdia). One hundred µl of the extracts were added into each
well and shaken at room temperature on an orbital shaker in a humidity bag for one hour. The
liquid was removed from the wells and the plate was washed with 1X PBST buffer (0.13 M
NaCl, 1.4 mM KH2PO4, 8.1 mM Na2PO4, 2.7 mM KCl, Tween 20). The specific rabbit
antiserum (provided from KSU Plant Diagnostic lab) for each virus was diluted 1:100 in the
extract of healthy wheat ground in indirect extraction buffer as above. Afterwards 100 µl of
enzyme substrate (PNP) were dispensed into the wells and shaken in dark for one hour until they
were read at 405 nm on a plate reader (Agdia).
siRNA Detection
Small RNA fraction and RNA hybridization
For small RNA detection, total RNA was extracted from 1g of leaf tissue using TRIZOL
reagent. Low molecular weight RNA was obtained using DNA/RNA extraction kit (QIAGEN)
according to the manufacturer‟s instructions. Total RNA was bound to a column resin and
washed. Small RNA was selectively eluted by the addition of 1 ml of buffer QRW2 (50mM
MOPS pH 7.0, 750 mM NaCl, and 15% ethanol). The precipitation of low molecular weight
RNAs was made by the addition of 850 µl of ice-cold isopropanol and centrifugation at 15,000
xg for 30 min at 4 ⁰C. Low molecular weight RNAs were washed with 75% ethanol, air dried,
and resuspended in 50 µl of DEPC water.
Low molecular weight RNA was separated by electrophoresis on 15% polyacrylamide
gel (30% acrylamide 5ml, urea 4.2g, 10XTBE 0.5ml, 10% 80µl and TEMED 6 µl). Samples
were denatured by the addition of one volume of deionized formamide and heated at 65⁰C for 5
min then kept on ice for 5 min. Single strand RNA loading dye was added and the mixture was
loaded in to the gel. A mix of 2 µl of the specific primers for each viral CP segment was used as
a positive control. Gels were run for one hour at 180 volts. An siRNA marker (Biolabs, San
Diego, CA) was loaded to indicate sizes of 15, 21, 27 bp. To determine the position of each band
the marker was removed before blotting stained in ethidium bromide and measure with a ruler.
siRNAs were transferred onto N+
membrane (GE Healthcare, Buckinghamshire, UK) by
electroblotting, at 80 volts for one hour, using 0.5X TBE as transfer buffer. The membrane was
Page 27
21
washed with 2X SSC buffer for 2 min; UV cross-linked and air-dried overnight. For Pre-
hybridization and hybridization, 6ml of pre-warmed ULTRhyb-oligo buffer (Ambion, Austin,
TX) was used. To prepare the probe, primers were designed from the cloned sequence to
amplified segments no bigger that 100bp (Table 2), the PCR products were gel extracted, a mix
of the small segments obtained was radioactively labeled (10.0 µl) denatured at 95 min for 10
min and then added into the hybridization tube. Hybridization was carried out at 42 ⁰C overnight
in the rotating hybridization oven. The hybridization buffer was discarded and the membrane
was washed with 1X SSC, 0.8% SDS for 15 min at 42 ⁰C and 1X SSC, 0.8% SDS for 15 at
42⁰C. The membrane was placed in the cassette and exposed to a phosphor screen for two days
and then scanned with the StormTM
840.
Segregation analyses
PCR transgene detection data of T1 generation of plants was used for segregation
analyses. To estimate the pattern of heritage of each line Chi-square goodness-of-fit tests were
performed to establish whether the observed segregation ratios of CP-positive plants to negative
plants fit the expected Mendelian 3:1 for integration at a single locus or two loci integration 15:1
(Table 14).
Data Analysis
For data analyses two by two contingency tables (Tables 15-18) were constructed from
the data obtained in transgene PCR detection and the ELISA result. Each table was made
independently for each construct and each generation of plants.
Chi-square analyses of independence were used to determine the association between the
transgene presence and the ELISA result. The Yates continuity correction was applied to these
tables.
Posterior analyses were performed on the set of data that showed lack of independence
in the analyses for transgene presence. Two by two contingency tables (Tables 5.4- 5.6) were
constructed to determine the relationship between the expression of transgene (RT-PCR data)
and the presence or absence of virus (ELISA results).
Page 28
22
Results
Expression of WSMV CP RNAi vector:
Production of transgenic plants (To)
Approximately 900 wheat callus explants were bombarded in five independent biolistic
transformation experiments. One week after bombardment the calli were transferred to selection
media (CM4 media containing 5 mg/l glufosinate) for a two-week cycle, and then transferred to
CM4 + 10 mg/l glufosinate for another two-week cycle. During this selection process, the calli
did not show major morphological changes except an increase on size and, in few cases, roots
were produced. The selection agent suppressed growth of the majority of the calli (Figure 2).
Under regeneration conditions on MSP media, also containing 10 mg/l glufosinate, the calli
became more organized and distinguishable shoot and leaves appeared followed by root growth
(Figure 3). However, some in cases, roots appeared before shoots. The regeneration cycles were
completed in MSE+5G media where the shoots were elongated and roots developed more
vigorously. One hundred and thirty-six plants, regenerated under glufosinate selection were
transferred to soil and kept under high humidity conditions, in polystyrene containers. During
this adaptation process, 12.5% mortality was observed. Surviving putative transgenic plants were
transplanted into one-gallon pots after the wheat plants grew to the three-or four-leaf stage.
Analyses of T0 plants
Liberty painting helped screen putative transgenic plants and was performed one week
after transplanting to the one-gallon pots. Each tiller of all recovered plants was evaluated
separately as one leaf per tiller was tested. If the leaf was susceptible, it would become chlorotic
and then turn brown in about ten days (Figure 5). Resistant leaves would remain green. Some
plants exhibited an intermediate phenotype and were considered positive until molecular analysis
could provide a definitive answer. Thirteen liberty-positive plants were obtained for the WSMV
CP hairpin construct. Due to the low selection pressure of the glufosinate some calli were
chimeric. As a result, some of the regenerated plants contained both herbicide-resistant and
susceptible tillers. The herbicide-susceptible tillers were removed. DNA was isolated from
putative Liberty-positive plants and used as a template for bar gene primers (from pHC20 co-
bombardment vector). Eight of the putative liberty-positive plants were confirmed to contain bar
Page 29
23
gene (Table 2; Figure 7). In most of cases, both co-bombardment vector and hairpin construct
were detected in the same plant sample. Seeds of each tiller from T0 plants were independently
collected.
T1 Transgenic plants
Initial analyses of T1 progeny were carried out on five different lines derived from T0
PCR positive plants: Lines 34, 35, 110 147 and 195. Tillers from each line were independently
evaluated (Table 4). PCR analyses, using specific primers for the sense and antisense fragment of
the WSMV CP hairpin construct, determined the number of positive plants of each tiller. RNA
was extracted from plants containing the transgenic insert and the cDNA was used as a template
for two separate PCR reactions to determine mRNA expression of CP and gus linker. RT-PCR
experiments demonstrated the expression of CP in almost all the samples containing the
transgene. On the other hand, relative low mRNA expression of gus linker was found only in
lines 147 and 195, the other lines did not show any signal of gus linker expression. Alpha tubulin
was used as an internal control to corroborate the quality of the cDNA used for amplification.
Another observation was made on the size of the bands obtained in the plants from lines 195 and
110. These bands both sense and antisense, obtained gDNA PCR transgene detection, were
smaller that the obtained from the positive control (initial pANDAmini vector containing the
fragment of WSMV CP, used for the transformation experiments). Sequencing of these segments
indicated a deletion in the sequence of gus linker.
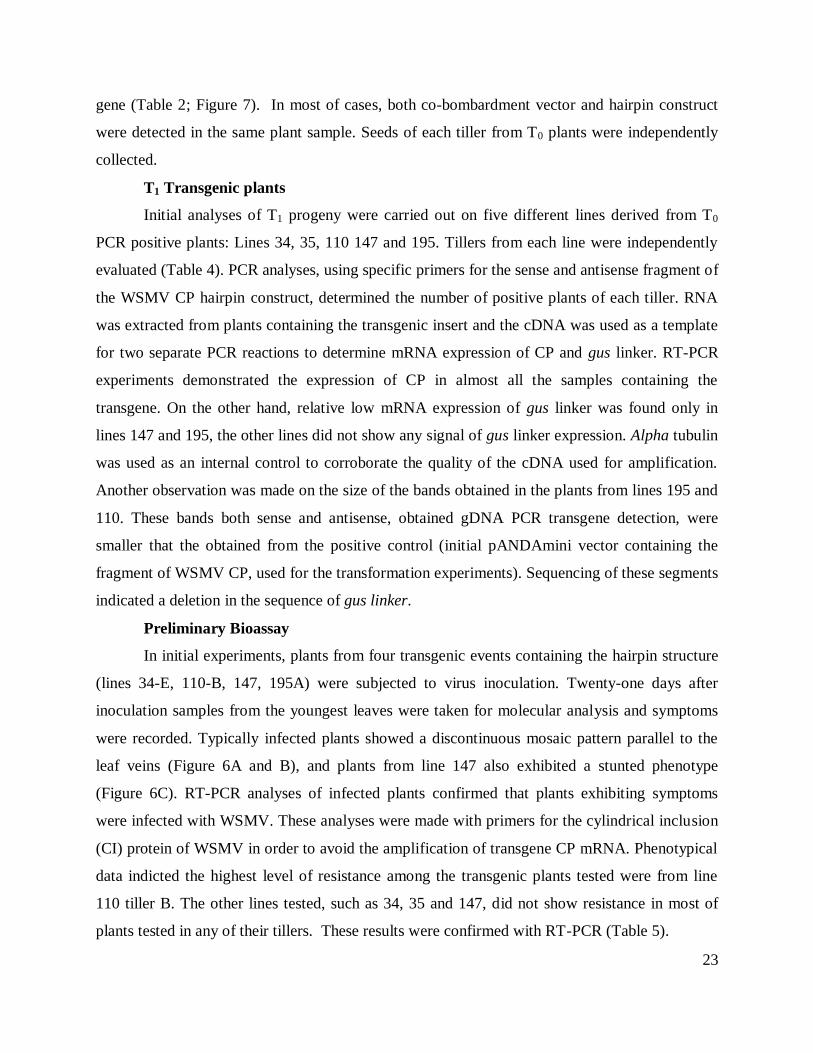
Preliminary Bioassay
In initial experiments, plants from four transgenic events containing the hairpin structure
(lines 34-E, 110-B, 147, 195A) were subjected to virus inoculation. Twenty-one days after
inoculation samples from the youngest leaves were taken for molecular analysis and symptoms
were recorded. Typically infected plants showed a discontinuous mosaic pattern parallel to the
leaf veins (Figure 6A and B), and plants from line 147 also exhibited a stunted phenotype
(Figure 6C). RT-PCR analyses of infected plants confirmed that plants exhibiting symptoms
were infected with WSMV. These analyses were made with primers for the cylindrical inclusion
(CI) protein of WSMV in order to avoid the amplification of transgene CP mRNA. Phenotypical
data indicted the highest level of resistance among the transgenic plants tested were from line
110 tiller B. The other lines tested, such as 34, 35 and 147, did not show resistance in most of
plants tested in any of their tillers. These results were confirmed with RT-PCR (Table 5).
Page 30
24
A second analysis was carried out in five tillers of lines 462 and one tiller of line 147.
Plants were tested for presence of the sense and antisense transgene sequences using PCR
analysis (Table 6). Four out of five tillers evaluated in line 462 were confirmed to contain the
WSMV construct although deletion of one of two sides of the construct was also observed in few
of these plants. PCR of the plants from tiller 147 confirmed that the transgene was intact.
mRNA expression analyses (RT-PCR) of CP for line 462 showed no clear expression of CP nor
gus linker. Analyses of line 147 showed expression consistent expression of gus linker but CP
mRNA was not detected.
Bioassays of T1 progeny
T1 progeny from lines 462 and 147 were challenged with WSMV by mechanical
inoculation and to avoid inoculation failures, a second inoculation was performed one week later.
Symptoms were recorded and samples for ELISA were taken twenty days after the first
inoculation. According to ELISA values and phenotypical data, resistance was presented in two
out of five tillers evaluated in line 462, and was presented in the plants containing the transgenic
CP hairpin construct. In the plant evaluated for line 147-a1, a consistent resistant response was
observed in 8 out of 12 plants, four susceptible plants in this line showed a delay in symptom
development and low virus titer in ELISA assays (Table 7). The negative control non-transgenic
plants showed 100% virus incidence.
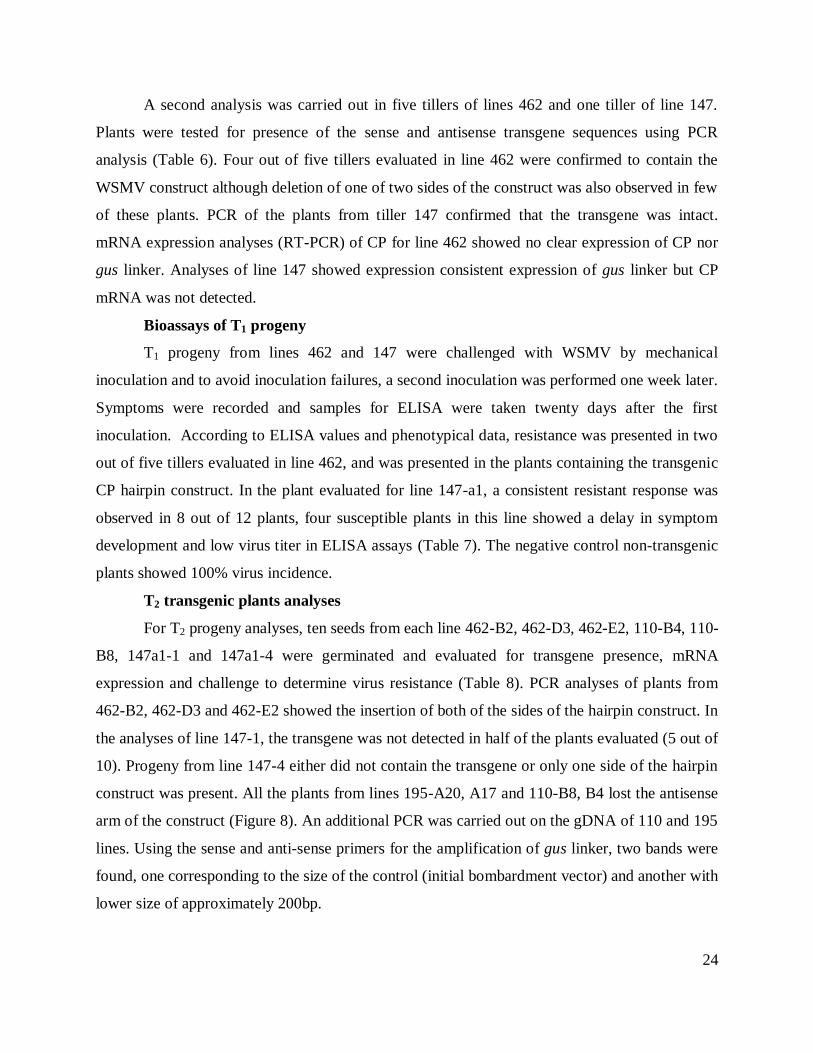
T2 transgenic plants analyses
For T2 progeny analyses, ten seeds from each line 462-B2, 462-D3, 462-E2, 110-B4, 110-
B8, 147a1-1 and 147a1-4 were germinated and evaluated for transgene presence, mRNA
expression and challenge to determine virus resistance (Table 8). PCR analyses of plants from
462-B2, 462-D3 and 462-E2 showed the insertion of both of the sides of the hairpin construct. In
the analyses of line 147-1, the transgene was not detected in half of the plants evaluated (5 out of
10). Progeny from line 147-4 either did not contain the transgene or only one side of the hairpin
construct was present. All the plants from lines 195-A20, A17 and 110-B8, B4 lost the antisense
arm of the construct (Figure 8). An additional PCR was carried out on the gDNA of 110 and 195
lines. Using the sense and anti-sense primers for the amplification of gus linker, two bands were
found, one corresponding to the size of the control (initial bombardment vector) and another with
lower size of approximately 200bp.
Page 31
25
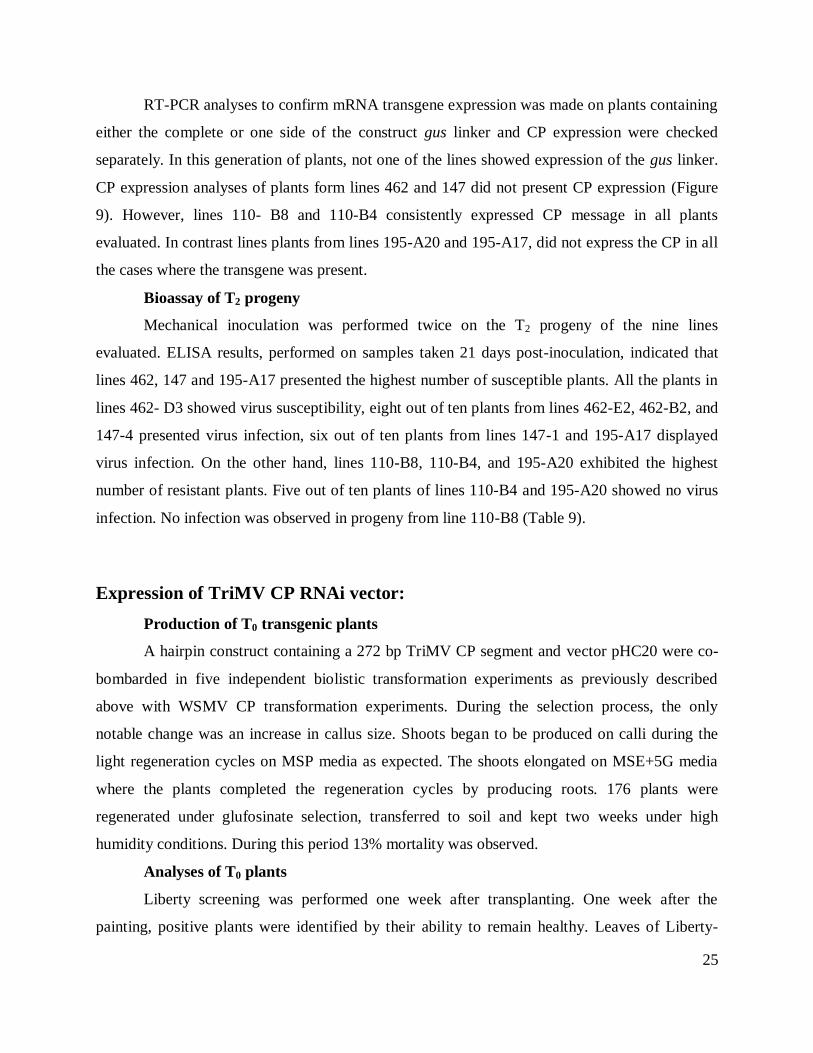
RT-PCR analyses to confirm mRNA transgene expression was made on plants containing
either the complete or one side of the construct gus linker and CP expression were checked
separately. In this generation of plants, not one of the lines showed expression of the gus linker.
CP expression analyses of plants form lines 462 and 147 did not present CP expression (Figure
9). However, lines 110- B8 and 110-B4 consistently expressed CP message in all plants
evaluated. In contrast lines plants from lines 195-A20 and 195-A17, did not express the CP in all
the cases where the transgene was present.
Bioassay of T2 progeny
Mechanical inoculation was performed twice on the T2 progeny of the nine lines
evaluated. ELISA results, performed on samples taken 21 days post-inoculation, indicated that
lines 462, 147 and 195-A17 presented the highest number of susceptible plants. All the plants in
lines 462- D3 showed virus susceptibility, eight out of ten plants from lines 462-E2, 462-B2, and
147-4 presented virus infection, six out of ten plants from lines 147-1 and 195-A17 displayed
virus infection. On the other hand, lines 110-B8, 110-B4, and 195-A20 exhibited the highest
number of resistant plants. Five out of ten plants of lines 110-B4 and 195-A20 showed no virus
infection. No infection was observed in progeny from line 110-B8 (Table 9).
Expression of TriMV CP RNAi vector:
Production of T0 transgenic plants
A hairpin construct containing a 272 bp TriMV CP segment and vector pHC20 were co-
bombarded in five independent biolistic transformation experiments as previously described
above with WSMV CP transformation experiments. During the selection process, the only
notable change was an increase in callus size. Shoots began to be produced on calli during the
light regeneration cycles on MSP media as expected. The shoots elongated on MSE+5G media
where the plants completed the regeneration cycles by producing roots. 176 plants were
regenerated under glufosinate selection, transferred to soil and kept two weeks under high
humidity conditions. During this period 13% mortality was observed.
Analyses of T0 plants
Liberty screening was performed one week after transplanting. One week after the
painting, positive plants were identified by their ability to remain healthy. Leaves of Liberty-
Page 32
26
susceptible plants became pale green to necrotic. Twenty-two liberty positive plants were
detected. Some of the plants contained both herbicide-resistant and susceptible tillers and the
herbicide-susceptible tillers were removed.
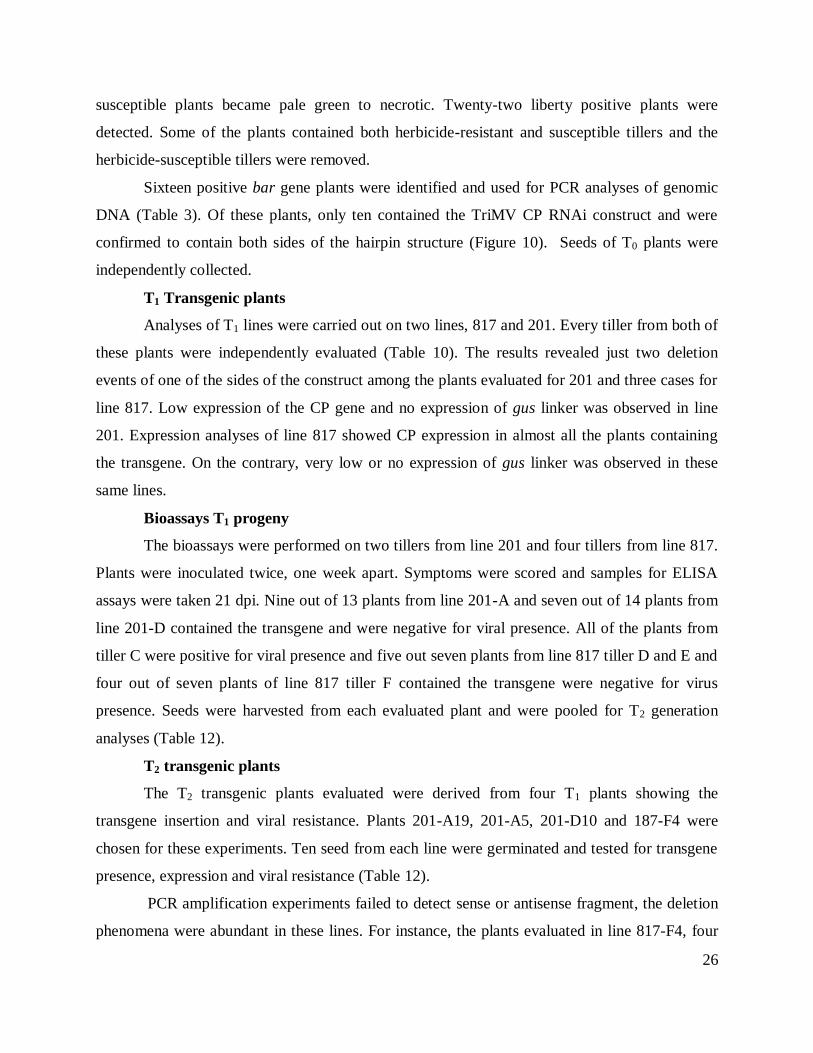
Sixteen positive bar gene plants were identified and used for PCR analyses of genomic
DNA (Table 3). Of these plants, only ten contained the TriMV CP RNAi construct and were
confirmed to contain both sides of the hairpin structure (Figure 10). Seeds of T0 plants were
independently collected.
T1 Transgenic plants
Analyses of T1 lines were carried out on two lines, 817 and 201. Every tiller from both of
these plants were independently evaluated (Table 10). The results revealed just two deletion
events of one of the sides of the construct among the plants evaluated for 201 and three cases for
line 817. Low expression of the CP gene and no expression of gus linker was observed in line
201. Expression analyses of line 817 showed CP expression in almost all the plants containing
the transgene. On the contrary, very low or no expression of gus linker was observed in these
same lines.
Bioassays T1 progeny
The bioassays were performed on two tillers from line 201 and four tillers from line 817.
Plants were inoculated twice, one week apart. Symptoms were scored and samples for ELISA
assays were taken 21 dpi. Nine out of 13 plants from line 201-A and seven out of 14 plants from
line 201-D contained the transgene and were negative for viral presence. All of the plants from
tiller C were positive for viral presence and five out seven plants from line 817 tiller D and E and
four out of seven plants of line 817 tiller F contained the transgene were negative for virus
presence. Seeds were harvested from each evaluated plant and were pooled for T2 generation
analyses (Table 12).
T2 transgenic plants
The T2 transgenic plants evaluated were derived from four T1 plants showing the
transgene insertion and viral resistance. Plants 201-A19, 201-A5, 201-D10 and 187-F4 were
chosen for these experiments. Ten seed from each line were germinated and tested for transgene
presence, expression and viral resistance (Table 12).
PCR amplification experiments failed to detect sense or antisense fragment, the deletion
phenomena were abundant in these lines. For instance, the plants evaluated in line 817-F4, four
Page 33
27
out of ten plants had lost the insert, two plants displaying no signal in PCR analyses for half of
the construct and four plants holding both sides of the hairpin. This type of transgene deletion
was found among all the lines evaluated (Table 12). RT-PCR was performed on these plants to
determine transgene expression. Only lines 201-A19 (Figure 11), and 201-D10 showed
expression of both TriMV CP and gus linker. However, the expression was not consistent in all
the plants containing the transgene in these two lines.
T2 Bioassays
Mechanical inoculation was performed twice on the five lines previously analyzed and at
twenty-one days post inoculation, ELISA assays were performed. The results of these assays
indicated that the line with the higher number of resistant plants was line 201-A19. Eight out of
nine plants evaluated showed negative ELISA results and all the plants in line 817-F4, which
showed no disease symptom and were ELISA negative (Table 13). In contrast, plants in line
201-D10 were all susceptible, and line 201-A5 just two out of ten plants showed no viral
infection.
Segregation analyses
Chi-square analyses of PCR transgene detection data indicate that lines 34, 110,195 and
462 tiller C fit 3:1, suggesting that the transgene integrations occurred in at single locus,
although separate integration also could occurred at closely linked loci. In Lines 147-a1, 462
tiller B and D and 817 have a tendency that indicated 15:1 integration ration, suggesting
integration at two independent loci. Even though, the p-values allowed accepting the hypothesis
for segregation 3:1 or 15:1 the number of samples evaluated in each case is not large enough to
make this test conclusive, it just indicated a tendency among the lines (Table 14).
Data Analyses
Contingency tables were used to determine if there is any relationship between presence
of the transgenes and virus resistance. The null hypothesis tested was that the virus infection is
independent of transgene presence. The different transgenic lines with the same construct were
grouped because i. the number plants per transgenic line are not large enough to perform the
statistical method with certain and ii. because the hypothesis is that the presence of the construct
regardless of the transgenic line confers resistance to the virus. Chi-square was calculated using
Yates-Chi square formula to correct for continuity (Chi-square distribution is continuous) and to
prevent over estimation of statistical significance.
Page 34
28
For the WSMV CP hairpin T1 analyses, data obtained for transgene PCR detection and
ELISA results from tiller 147-a1 and 462 tillers A, B, C, D, E. were grouped. Two by two
contingency table of the WSMV CP RNAi T1 chi-square analyses indicate association between
transgene presence and ELISA result (χ2
= 7.155612, df =1, P = 0.007473) (Table 15). The chi –
Yates continuity correction factor corroborated the lack of independence between these two
variables (chi-Yates=5.6954, P= 0.017009).
For T2 progeny analyses of WSMV CP construct PCR transgene detection and ELISA
result data from tillers 462-B2, 462-D3, 462-E2, 110-B4, 110-B8, 195-A17, 195-A20 and 147-
a1-4, 147-a1-1 was grouped. Analyses of two by two contingency table of T2 generation (Table
16) of the same construct, showed lack of independence (χ2 = 6.117515, df =1, P = 0.013385).
Chi-Yates continuity correction factor confirm these results (Chi-Yates=0.0288, P= 0.0288).
For TriMV CP RNAi T1 generation PCR transgene detection and ELISA data from lines
201tillers A and D, and 817tillers C, D and E was grouped. The two by two contingency table
(Table 17) of association between transgene presence and ELISA results, Chi-square analyses
indicate that the relationship between transgene presence and virus presence was not independent
(χ2
= 4.522506, df =1, P = 0.033452). However, when Chi-Yates continuity correction factor was
applied, was not significant (Chi-Yates =3.11308, P= 0.077666) indicating independence
between transgene presence and the ELISA results. The same analyses of T2 RT-PCR and
ELISA data from 201 tillers A5, A19, D10 and 862 tiller F4 were combined in the two by two
tables (Table 18). Chi-square analyses indicated no association between the transgene presence
and ELISAs (χ2 = 0.080049, df =1, P = 0.777231).
To establish whether transgene expression and virus presence has any relationship were
constructed two by two contingency tables from the expression data, obtained from RT-PCR and
the ELISA results. These analyses were made on the generations that showed any significance in
the two by two contingency tables for association of ELISA and transgene presence, WSMV CP
hairpin construct T1 and T2 generation and TriMV CP construct T1 generation
For WSMV CP construct T1 analyses, RT-PCR and ELISA data from lines 147-a1 and
462 tillers A, B, C, D, E. was grouped (Table 19). Chi-square analyses of two by two
contingency tables did not showed association between expression and virus presence(χ2
=
2.440087, df =1, P = 0.11827). On the contrary the same analyses of T2 CP construct grouping
RT-PCR and ELISA data of plants derived tillers 462-B2, 462-D3, 462-E2, 110-B4, 110-B8,
Page 35
29
195-A17, 195-A20 and 147-a1-4, 147-a1-1 (Table 20) showed lack of independent of (χ2
=
20.79293, df =1, P =5.12E-06). This result was corroborated by Chi-Yates continuity correction
factor (Chi-Yates =18.69563, P= 1.53E-05).
For the analyses of TriMV CP T1 generation construct, the data from lines 201 tillers A
and D, and 817 tillers C, D and E was grouped (Table 21). Chi-square analyses of contingency
tables did not show association between expression and virus presence (χ2
= 1.490401, df =1, P =
0.222154).
Other Constructs from WSMV:
Cylindrical inclusion protein
A 296bp fragment from the cylindrical inclusion (CI) WSMV protein was cloned in
pANDA mini hairpin vector and co-bombarded with pAHC20. From five independent biolistic
experiments, approximately 900 wheat callus explants were bombarded with these two plasmids.
One hundred and forty plants were recovered from glufosinate selection on tissue culture
processes and enclosed at high humidity conditions. The rate of mortality of plants in the
adaptation process was 23.6%. Plants were transplanted into one-gallon pots and liberty-painting
screen was performed. Thirteen putative herbicide-resistant plants were identified and were
subsequently tested for the presence of bar gene and hairpin construct using PCR. Three plants
were determined to contain the bar gene, but no plants were positive for either sense or antisense
side CI gene of the hairpin construct. The transformation experiments were repeated in three
independent bombardments using approximately 540 callus explants. Twenty-nine rooted plants
were recovered and transferred into high humidity condition in the growth chamber. During the
adaptation process three plants died. The liberty-painting screen resulted in 12 putative
herbicide-resistant plants. PCR analyses for transgene detection confirmed two plants containing
the bar gene. However, consistent with previous experiments, no plants contained the CI RNAi
vector. This may indicate an inhibitory effect of the CI RNAi vector expression in wheat growth
or development.
Eukaryotic translation initiation factor G
A fragment of 517 bp form the host translation initiation factor G (GenBank Accession
#EF190330.1) was cloned in pANDA mini and co-bombarded with pAHC20 in five independent
biolistic experiments using approximately 900 wheat callus. Embryogenic calli was transferred
Page 36
30
into the selection cycles where tissue increased. However, during the regeneration cycle, tissue
culture tissue did show morphological differentiation and in many cases, even when leaves were
formed roots were not produced. Seventy-two plant generated under glufosinate, were enclosed
at high humidity conditions. The rate of dead plants the adaptation process was 33.3%. Plants
were transplanted into one-gallon pots and were screened for Liberty resistance one week later.
Seven herbicide-resistant plants were identified and six of these lines were confirmed by PCR to
contain the bar gene. PCR analyses also confirmed the presence of the hairpin construct in three
lines of the bar-positive plants. These plants are currently being grown to maturity.
Eukaryotic translation initiation factor F
A fragment of 298 bp from the host eiF(iso)4F (GenBank Accession #WHT l F4F28A)
was cloned in pANDA mini and bombarded in five independent biolistic experiments using
approximately 900 wheat callus. Embryogenic calli was transferred into the selection and
regeneration cycles, where morphological differentiation occurred normally. One hundred and
nineteen plant were generated under glufosinate selection, and transferred to high humidity
conditions. The rate of dead plants the adaptation process was 20.1%. Plants were liberty-
painted these screen established 15 herbicide resistant plants were identified and PCR analyses
of these plants determined 7 bar gene positive plants and specific primer for the hairpin construct
identified three lines. These plants are currently being grown to maturity.
6K2-NaI
A construct containing a segment of 397 bp from WSMV 6K2-NaI protein was designed
and transformed into wheat embryos. At this point all the tissue complete the selection cycles.
Currently some tissue is still undergoing tissue culture regeneration cycles, a few number of
recovered rooted plants have been transferred in to the growth chamber and are being evaluated
for herbicide resistance. As of the summer of 2009, two liberty painting resistant plants both
containing the hairpin construct have been identified.
Page 37
31
Discussion
The results indicated that RNAi targeting either the CP of WSMV or TriMV elicit
resistance response in transgenic plants. These results concur with previous studies showing
various levels of resistance using the full-length sequence of the WSMV CP (Li et al., 2005) or
the viral replicase, NIb (Sivanami et al., 2000) in transgenic wheat. The use of hairpin constructs
has been shown to increase the efficiency of posttranscriptional gene silencing (Smith et al.,
2000) compared to sense or antisense constructs alone. RNA interference-based gene silencing
strategy has been successfully used in wheat functional gene analyses reducing the expression of
endogenous genes (Fu et al., 2007).
Plants of WSMV CP hairpin construct T1 generation used in the preliminary assays
contained the CP insert and expressed the transgene in most cases (Table 4). However, after
inoculation, only plants from lines 195 and 110 exhibited a significant number of resistant plants
(Table 5). Analyses of the second set of T1 lines determined no expression in most of the plants
derived from the different tillers of line 462 (Table 6), few plants in this line were ELISA
negative. The resistance response was clearly different between the tillers and present only in
some of them. When resistance was found, plants contained the transgene. Nevertheless,
transgene presence did not necessarily implicate a resistance response, as was observed in the
tiller B of the same line (462) where 100% of the plants containing the transgene showed viral
symptoms during their whole life cycle. These results suggest that the lack of resistance in this
line was probably due to transgene silencing. On the other hand, all the plants from tiller 147-a1
showed to contain the transgenic insert and expression of gus linker but not CP expression in any
of the plants evaluated. This line exhibited a delay in symptoms development or no symptoms.
We found clear indication of transgene silencing in tiller B of line 462, which did not
show transgene expression or resistance. On the other hand, the lack expression but resistance
response was present in some of the plants from tiller D and E in the same line. Assuming that
RNAi is eliciting plant viral defense, transgene expression levels could have been strong enough
to elicit an effect but too low for our detection methods. Another hypothesis to explain this
phenomenon could directly involve RNAi mechanism. The hairpin transgene, which contains
Page 38
32
dsRNA is recognized by the dicer like enzyme, inducing the RNAi mechanism (Helliwell &
Waterhouse, 2005). Dicer could have processed the mRNA prior to virus inoculation, thus RNA
would have become part of the RISC complex and target, preventing the detection of transgene
mRNA. Another line that showed evidence of this hypothesis was line 147-1-a where only the
expression of gus linker was detected, but not the expression of CP. This result could indicate
that the transgene mRNA was processed without viral presence, given that the samples used for
RNA extraction and posterior cDNA synthesis were taken before virus inoculation. In the case
of line 1471-a, the dsRNA formed by the inverted CP fragments was processed. Alternatively,
most of plants from lines 34 and 147 that did express CP fragment and sometimes the gus linker
sequence, but they did not exhibit a resistance phenotype.
A high number of WSMV CP T2 generation plants lost the resistant phenotype (Table 9);
it was the case of almost all the plants derived from line 462. Similarly, plants derived from line
147 lost the expression of gus linker and susceptible plants did not show the delay in symptoms
development or low virus titer, observed in the susceptible plants of the T1 generation. These
losses suggest transgene silencing could occur during the development of T2 or late in the T1
generation and be meiotically transmitted. Previous works in WSMV also generated by the
biolistic method, found similar results for resistance in plants expressing the full length of the
viral CP. The authors suggest that the number of transgene copies generated for bombardment is
the main cause of transgene silencing (Li et al., 2005). Different factors have been implicated in
transgene silencing, such as interaction between multiple transgene copies, methylation and
chromatin modification, or the interaction of them (Hammond et al., 2001). However, it was not
possible to obtain this information from the southern analyses. The failure of these experiments
was probably due to either, the size of the probe used, even though different probes were tested
in order to detect the transgene including the CP fragment cloned in the hairpin construct, bar
gene, and the gus plus the CP fragment obtained by PCR, or a problem with the hybridization
process including related to buffer. The DNA quality and proper digestion seemed to be correct
as was confirmed by spectrophotometer quantification and ethidium bromide staining of the
corresponding gel. Additionally radioactive labeled probes showed good activity.
Other phenomenon observed was the partial loss of one arm or the complete construct.
This case has been also reported in transgenic lines of wheat, carrying the bar gene, which
physically lost the transgene in T3 generation (Srivastava et al., 1996). In Arabidopsis thaliana,
Page 39
33
the Kanamycin resistant gene was lost (Feldman et al., 1997) and in bean the rep-trap-ren genes
from Bean golden mosaic virus geminivirus also lost its transgene (Romano et al., 2005). This
phenomenon is poorly understood, but has been suggested that it is caused by the genetic
instability imposed by stress conditions during tissue culture (Risseeuw et al., 1997). However,
this hypothesis could not explain the deletions observed in the T2 generation (Tables 8, 12).
Another explanation for this observation is based on intra-chromosomal recombination that lead
to the co-elimination of transgenes; this hypothesis also suggests that the transgene integration
site is a key factor in the elimination process (Fladung, 1999). An alternative explanation has
attributed this phenomenon to mechanisms of genome defense (Srivastava et al., 1996).
Lower than expected molecular weight bands were observed in PCRs of Lines 110 and
195. Sequencing both arms of these lines established that there was no deletion in the two
identical CP fragments of the hairpin construct. The smaller size of PCR products obtained is
probably due to a re-arrangement or fragmentation in the sequence of gus linker, and it occurred
in late T0 generation or in the development of the seeds for T1. In theory, this deletion does not
affect the formation of the double strand required for the silencing mechanism or if it did both
fragment still can elicit the silencing mechanism (Fire et al., 1998). Consistent transgene
expression and a resistant phenotype were observed in both T1 and T2 generation of lines 110B4
and B8 (Figure 8). This suggests that the observed resistance is a consequence of a homozygosis
genotype in T1 generation parental plants. It also shows a strong resistant phenotype suggesting
that the resistance in these lines was stably inherited for the next generation. Various studies
have suggested that a transgene dose affect resistance response in plants carry transgene
homologous to viral sequences. Homozygous loci are able to confer higher level of virus
resistance, and stably transmit the resistance into the next generation (Dinant et al., 1997; Tenant
et al., 2001). Importantly, the T2 generation of these lines exhibited loss of the construct
antisense arm indicating that the resistant phenotype observed is not due to the hairpin construct
instead, it is the remaining fragment of CP that is eliciting the resistance response, as has been
previously reported (Lindbo and Dougherty, 1993). In this case the formation of the double
strand that triggers the silencing mechanism is thought to be generated by the virus negative
strand or replicative intermediate or by the host RdRp (Beclin et al., 2002). The efficacy of the
silencing observed in these lines may depend on the production of the transgene RNA above the
threshold level, as has been found in homozygous lines (Dinant et al., 1997; Tenant et al., 2001).
Page 40
34
In the T1 generation lines evaluated for the TriMV construct, 817 and 201 had transgene
expression in many of the plants containing the transgene (Table 10). However, several plants
did not exhibit a resistant phenotype. In the following generation of plants, many deletion events
were observed (Table 12). This indicates that the deletion phenomenon was not caused by the
sequence itself. It might be related instead to the nature of the hairpin construct and its stability
in wheat plants. Additionally, some of the plants derived from resistant plants, such as line 201A
lost the expression and the resistance phenotype (Table 13). These losses are likely caused by
transgene silencing. The only line that kept high level of resistance was 201-A19, in this case
resistance is correlated with the hairpin construct presence. Line 817 showed also a resistant
phenotype, but the fact that many of them did not contain the construct denotes a failure in the
inoculation.
No correlation was found between transgene expression data obtained by RT-PCR, and
resistance response. Plants presenting no detectable transgene mRNA but resistance response,
suggest that the RNAi mechanism is constitutively activated as previously reported (Hyli et al.,
2005). In this case, siRNA induced by the hairpin construct targets the corresponding mRNA for
degradation and that is the reason why it is not detected by RT-PCR. On the other hand, some
plants presented transgene expression but not detectable resistance. There are two possible
explanations for this outcome. First, the mRNA is not forming the hairpin (dsRNA) required to
activate the system. Second, the hairpin is produced and processed, but the triggered RNA
response is not enough to render complete resistance (ELISA negative). It has been found that
RNAi in transgenic plants can produce different levels of suppression of gene expression (Fu et
al., 2007). It is possible that some level of RNAi activity was present in these plants but it was
not enough to cause a distinguishable phenotype from the susceptible plants. Moreover, different
levels of susceptibility were not screened.
The RT-PCR analyses allows for the detection of the steady-state mRNA at a specific
time point of the transcript life. The amount of mRNA of a transcript at each moment is the
result of the balance between the rate of synthesis and rate of degradation (Lindbo et al., 1993).
Therefore, if the hairpin mRNA is not detected, the hairpin was not produced or it was produced
and later degraded by the RNAi mechanism. Conversely, the detection of transgene mRNA
means that there is no degradation, or there is degradation but still unprocessed mRNA is
Page 41
35
present. These ideas would explain the contradictory results in the correlation between transgene
expression (RT-PCR) and virus resistance (ELISA).
Plants recovered from the bombardment experiments and were PCR positive for the
presence of the hairpin construct targeting the eukaryotic translation initiation factors G and F
(EiF4F and EiF4G) did not show any apparent morphological abnormality, regardless of their
role in protein synthesis (Thivierge et al., 2005). A posterior work to determine the functional
roles of EiF4E and EiF(iso)4E in the tobacco plants growth, using antisense down regulation,
normal vegetative development of plants showing depletion of either EiF4F or EiF(iso)4E was
found. However, when the level of both factors was depleted plants displayed a semi-dwarf
phenotype. The explanation to the differential phenotype is the compensatory increase in the of
the corresponding factor iso-form plants (Thivierge et al., 2005). Similar result were observed
Arabidopsis containing a genetic mutation in the EiF4(iso)E4 that completely inhibited mRNA
and protein, these mutants presented no morphological changes or developmental modifications.
The absence of differential phenotype in our experiment can be explained by the functional
redundancy in this family of proteins (Duprat et al., 2002). Additionally another aspect to take
into consideration, the variable quantitative response generated by RNAi (Fu et al., 2007),
suggesting that the phenotypes observed in the recovered transgenic plants did not necessarily
contain strong reduction of the corresponding elongation factor mRNA. However, T1 and T2
plants have been studied to establish transgene in resistance and any possible effects in growth.
Transformation experiments with the cylindrical inclusion protein did not generate any
transformants containing the hairpin construct, even though the number of bombardment for this
protein was increased. It suggested that the CI contain any lethal property that resulted in death
of the tissue containing the transgene. The CI belong the „super family 2‟ of RNA helicases
(Ref), a large protein family with members from all kingdoms and play important roles in all
types of processes in RNA metabolism RNA helicases have been implicated in every step of
RNA metabolism, including nuclear transcription, pre-mRNA splicing, ribosome biogenesis,
nucleocytoplasmic transport, translation, RNA decay, and organellar gene expression (De la
Cruz et al., 1999). Sequence and structural analyses revealed homology among this proteins
among the V domian of this protein in related and distant members (Fernandez et al., 1995). An
hypothesis that can explain the lack of transformants is based in the RNAi mechanism itself, if
the CI helicase contain a sequence homology with one present in wheat, that happened to have
Page 42
36
an essential function in plant growth, development or any physiological function, the silencing
elicited by the construct would interfere with the endogenous protein. Other explanation for the
experiments results could be related the CI sequence used in the experiment that contains some
characteristics that inhibits the insertion or alerts the plant repairing mechanism, which would
remove the sequence.
Conclusion and future work
The experiments generated different levels of WSMV and TriMV resistance. This can be
attributed to either the structure of the hairpin transgene (Smith et al., 2000) or the delivery
system. For instance, delivery systems based on bombardment introduce several transgene copies
at random integration places. This may result in differential transcriptional activity, which in turn
could lead to transgene silencing and expression variability. The use of Agrobacterium-mediated
transformation to introduce the transgene might enhance expression and transgene stability.
Additionally, the transgene stability can be affected by chromosomal process, as well as repair or
defense process that end physical transgene deletion. An ideal transgene integration scenario
requires two main conditions. First, a few copies of the transgene and second the progeny
homozygosis. Despite, hairpin constructs have been shown high gene silencing efficiency, we
found that expression of only the sense CP fragment could also achieve resistance.
Next experiments have to be done with the T3 generation of plants lines 110B and 195A
for WSMV CP RNAi construct and 201D19 corresponding to the TriMV construct to determine
if the expression and resistance are still stable in this generation or analyze the cause of the loss.
6K2NIa, and the elongation factors transgenic T1 generation plants need to be analyzed for
transgene presence expression and resistance. Future experiments can evaluate the effect of the
transgenic plants in the virus vector transmission. Additionally the method of siRNA detection
has to be improved, we suggest that the failure of the blotting is cause by type of probe used, we
tested series of oligonucleotides spanning the CP fragment, but still an RNA probe be
synthesized by in vitro transcription of this segments.
Additionally the use of constructs containing multiple virus sequence has been shown
have high resistance efficiency (Bucher et al., 2006). The co-infection of WSMV and TriMV is
Page 43
37
known to have a worse effect on wheat (Kansas State University research and extension,
www.oznet.ksu.edu/library/plant2/ep145.pdf), a construct containing sequence from the CP or
another protein can be evaluated for resistance.
Page 44
38
Table 1. Wheat tissue culture media used in these studies.
Medium Application Composition
CM4 Initiation
MS1, B5 vitamins
2, 40g/l maltose, 2.2 mg/l picloram, 0.5 mg/l 2,4-D 2 g/l gelrite
CM4 + 5G or
10G
Proliferation and selection
MS, B5 vitamins, 40g/l maltose, 2.2 mg/l picloram, 0.5 mg/l 2,4-D 2 g/l gelrite,
5 or 10 mg/l glufosinate3
MSP Shoot production
MS, B5 vitamins, 40g/l maltose, 0.2 mg/l 2,4-D, 1.90 MES, 100 mg/l ascorbic
acid, 2 g/l gelrite, 5 mg/l glufosinate
MSE Shoot elongation
MS, B5 vitamins, 40g/l maltose, , 1.90 MES, 100 mg/l ascorbic acid, 2 g/l gelrite
5 mg/l glufosinate
All tissue culture media were pH adjusted to 5.7 and autoclaved for 20 min at 120 °C
1 Murashige and Skoog basal media with macro and micro nutrients (Murashige and Skoog, 1962)
2 B5 vitamins according to Gamborg et al. (1968)
3Ammonium glufosinate was filter sterilized and added after autoclaving
Page 45
39
Table 2. Primer sequence and descriptions of sequences used in these studies.
Primer name
Sequence (5‟-3‟) Annealing
Temperature °C Product size Description
WSMV- F CACCAATGCAGGCAAGGACAATGAGCAG 63.7 386 bp
amplification of WSMV CP fragment
cloned in RNAi vector WSMV-R TGCGTGTTCTCCCTCACATCATCT 60.1
TriMV-F CACCGATAGACGATGCGACTGGGCAAAT 63.9 272 bp
Amplify of TriMV CP fragment in
RNAi vector TriMV-R TCTGTTCCTGTGGTGAAAGCTGGT 60.5
gus F1 CACGTAAGTCCGCATCT TCA 54.9 216 bp +GOI Used with the CP specific primers to
determine presence of GOI gus R1 ATCTCTTTGATGTGCTGTGCC 55.6 353 bp + GOI
gus Sense CATGAAGATGCGGACTTCCG 50 636 bp
RT-PCR primers to establish gus linker
expression gus Antisense ATCCACGCCGTATTCGG 52
Ci- F TCCAGGAATGGGCGTGTGATGATA 63.4 256 bp
Used in RT PCR to determine virus
presence in WSMV transgenic material Ci- R ACACTAGCATCTCTGCCGAGGTTT 60.1
TriMV2-R TCTGTTCCTGTGGTGAAAGCTGGT 60.5 408 bp
Used in RT PCR to determine virus
presence in TriMV transgenic material TriMV2-F CGGCAGCAAATGGACTTGGATTGA 64.7
BarABR CCT GCC TTCATA CGC TATTTATTTGC 58.3 500 bp
Amplification of Bar Gen (Co-
bombardment ) UbiABF CTT CAG CAG GTG GGT GTA GAG CGT G 64.7
Tub-F ATCTGTGCCTTGACCGTATCAGG 60 409 cDNA
500bp gDNA
RT- PCR primers internal control used
to determine cDNA contamination Tub-R GACATCAACATTCAGAGCACCATC 60
Page 46
40
Primer name Sequence (5‟-3‟) Annealing
Temperature °C Product size Description
P1-R CAAACATTGGAGACA 42.1 77 bp Amplification of small TriMV CP
fragments, use as probe in siRNA
hybridization.
P1- R used with TriMV-F and
P4 used with TriMV-R to amplify the
segments listed in the previous column.
P2-F ATGTTTGACGAAGCG 42.5 68 bp
P2-R CATCCGGTAGGCTAAA 42.9
P3-F GCCTACCGATGGGTT 51.1 89 bp
P3-R TAAGTGACATCCACT 40.3
P4-F TGGATCTCAATTATT 40 56 bp
6K2NaI-F CACCACTACGATGCTGGTGACACCTTGT 59 384 bp 6K2NaI from WSMV
6K2NaI-R GTGCCAATGCAACTTCACGAACCT 53
EiF4F-F CACCCGCAAATGGAGGCAAATGGACTGT 64.8 298 bp
Wheat eukaryotic initiation elongation
factor F EiF4F-R TCCACCTCTGCTTGGTTTCTGACT 60.1
EiF4G-F CACCTCAGCAGCACCATTGGTATCTCCA 60.3 517 bp
Wheat eukaryotic initiation elongation
factor G EiF4G-R GCTCGGAGCATTCAACCTCCTCAA 63.6
Page 47
41
Table 3. Summary of T0 transgenic plants analyses.
Table 4. PCR and RT-PCR analyses T1 CP RNAi WSMV plants.
Line 34
Tiller Total
plants/tiller
Transgene presence No. transgenic
plants
Transgene
expression
Hairpin Half
side Negative CP gus linker
C 8 0 0 8 0 No No
D 6 0 0 6 0 No No
E 10 6 0 4 6 6 6
F 5 2 2 1 4 4 4
Line 35
F 7 3 2 2 5 5 No
G 5 4 1 0 5 3 No
Line 110
A 4 4 0 0 4 4 No
B 9 5 0 4 5 5 No
Line 147
A 9 8 1 0 9 9 7
D 6 2 2 2 4 3 No
195A
A 22 17 0 5 17 12 6
Gene Target RNAi
hairpin construct
Number of Liberty
Painting positive
plants
Number of bar
PCR positive
plants
Number of Hairpin
construct positive
plants
TriMV CP 22 16 8
WSMV CP 13 8 10
WSMV CI 25 5 0
WSMV 6k2-NaI 2 2 2
EiF4F 15 7 3
EiF4G 7 6 3
Page 48
42
Table 5. WSMV detection by RT-PCR of T1 progeny used in preliminary bioassay.
Line- tiller N° of plant evaluated RT- PCR virus Presence
Positive Negative
34-E 6 4 2
110 -B 5 1 4
147-A 7 7 0
195-A 7 0 7
Table 6. PCR and RT-PCR analyses of T1 generation WSMV CP RNAi plants.
Line 462
Tiller
Total
plants/tiller
Transgene presence Number of
transgenic
plants
Transgene
expression
Hairpin Half
side Negative
gus
linker CP
A 10 0 0 10 0 0 0
B 9 8 0 1 8 0 No
C 10 0 2 8 2 0 0
D 10 4 5 1 9 0 3
E 4 1 3 0 4 0 0
Line 147
Tiller Total
plants/tiller
Transgene presence Number of
transgenic
plants
Transgene
expression
Hairpin Half
side Negative
gus
linker CP
1-a 12 12 0 0 12 12 0
Page 49
43
Table 7. Correlations of ELISA results and molecular analyses of T1 WSMV CP RNAi plants.
Line 462 ELISA Negative plants ELISA Positive plants
Transgene Positive Transgene
negative
Total Transgene Positive Transgene
negative Total
Tiller Express+ Express- Express+ Express-
A 0 0 2 2 0 0 8 8
B 0 0 0 0 0 8 1 9
C 0 1 0 1 0 1 8 9
D 2 4 1 7 1 2 0 3
E 0 3 0 3 0 1 0 1
Line 147
1-a 8 0 0 8 4 0 0 4
Table 8. PCR and RT-PCR of T2WSMV CP RNAi progeny.
Line Total
plants
Transgene presence No.
transgenic
plants
Transgene
expression
Hairpin Half side Negative gus
linker CP
462 B2 10 7 3 0 10 0 0
462 D3 10 7 3 0 10 0 0
462 E2 10 6 1 3 7 0 0
147 -1 10 5 3 2 8 0 0
147-4 10 0 0 10 0 0 0
110 B4 10 0 8 2 8 0 8
110 B8 9 0 9 0 9 0 9
195 A17 10 0 7 3 7 0 5
195 A20 10 0 10 0 10 0 6
Page 50
44
Table 9. Correlations of ELISA results and molecular analyses of T2 WSMV CP RNAi progeny.
Plant
No. of ELISA negative plants No. of ELISA positive plants
Transgene Positive Transgene
Negative
Total Transgene Positive Transgene
negative
Total
Express+ Express- Express+ Express-
462-B2 0 2 0 2 0 7 0 7
462-D3 0 0 0 0 0 10 0 10
462 -2 0 2 0 2 0 7 0 7
147a1-1 0 4 0 4 0 4 2 6
147a1-4 0 0 2 2 0 0 8 8
110-B4 8 0 0 8 2 0 0 2
110-B8 10 0 0 10 0 0 0 0
195 -17 4 0 0 4 3 0 3 6
195-A20 3 2 0 5 2 3 0 5
Table 10. Molecular analyses of T1 TriMV CP RNAi plants.
Line 201
Tiller Total
plants/tiller
Transgene presence No.
transgenic
plants
Transgene
expression
Hairpin Half side Negative gus
linker CP
A 16 12 1 3 13 0 13
D 17 2 10 5 12 0 12
Line 817
Tiller Total
plants/tiller
Transgene presence No.
transgenic
plants
Transgene
expression
Hairpin Half side Negative gus
linker CP
C 6 6 0 0 6 1 4
D 7 6 0 1 7 0 6
E 9 7 1 1 8 0 8
F 7 2 5 0 7 0 2
Page 51
45
Table 11. Correlations of ELISA results and molecular analyses of T1 TriMV RNAi plants.
Line
201
No. Negative plants No. Positive
Transgene Positive Transgene
Negative Total
Transgene Positive Transgene
Negative Total
Tiller Express+ Express - Express+ Express-
A 10 0 1 11 3 0 2 5
D 7 0 1 8 6 0 3 9
Line 817
C 0 1 0 1 5 0 0 5
D 5 0 0 5 1 0 1 2
E 5 0 0 5 3 0 1 4
F 0 4 0 4 2 1 0 3
Table 12. Molecular analysis of T2 TriMV RNAi CP progeny.
Line Total
plants
Transgene presence No.
transgenic
plants
Transgene
expression
Hairpin Half Negative gus
linker CP
201-A5 10 4 2 4 6 No No
201-A19 9 6 3 0 9 4 5
201-D10 10 8 0 2 8 8 8
817-F4 10 4 2 4 6 No No
Table 13. Correlations of ELISA results and molecular analyses of T2 TriMV CP RNAi
plants.
Plant
No. of negative plants No. of positive plants
Transgene Positive Transgene
Negative Total
Transgene Positive Transgene
Negative Total
Express+ Express- Express+ Express-
201-A5 0 2 1 3 0 4 3 7
201-A19 4 4 0 8 1 0 0 1
201 D10 0 0 0 1 8 0 2 0
817- F4 0 6 4 10 0 0 0 0
Page 52
46
Table 14. Segregation analyses for T1 generation WSMV and TriMV hairpin construct.
Line/ tiller Total Ratio Observed Expected Chi-square Sum p-value
+ - + - + -
34- E,F 15 3:1 10 5 11.25 3.75 0.14 0.42 0.56 0.4561
110- A,B 13 3:1 9 4 9.75 3.25 0.06 0.17 0.23 0.6310
147-A,D 15 3:1 13 2 11.25 3.75 0.27 0.82 1.09 0.2967
195-A 22 3:1 17 5 16.5 5.5 0.02 0.05 0.06 0.8055
147-1a 12 3:1 12 0 9 3 1.00 3.00 4.00 0.0455
462- B,D,E 23 3:1 21 2 17.25 5.75 0.82 2.45 3.26 0.0710
462-C 10 3:1 8 2 7.5 2.5 0.03 0.10 0.13 0.7150
201-A 16 3:1 13 3 12 4 0.08 0.25 0.33 0.5637
201-D 17 3:1 12 5 12.75 4.25 0.04 0.13 0.18 0.6744
817-D,E.F 29 3:1 27 2 21.75 7.25 1.27 3.80 5.07 0.0244
147-1a 12 15:1 12 0 11.25 0.75 0.05 0.75 0.80 0.3711
462 B,D 23 15:1 21 2 21.563 1.4375 0.01 0.22 0.23 0.6280
817-D,E,F 29 15:1 27 2 27.188 1.8125 0.00 0.02 0.02 0.8856
Page 53
47
Table 15. Contingency table for the relationship between transgene presence and virus presence
of WSMV CP RNAi construct T1 generation lines 147-a1 and 462 tillers A, B, C, D, E. Values
represent the combine number of individual plants in the analysis.
Transgene Presence
+ - Total
ELISA + 17 17 34
- 18 3 21
Total 35 20 55
Table 16. Contingency table for the relationship between transgene presence and virus presence
for WSMV CP RNAi construct T2 generation lines 462-B2, 462-D3, 462-E2, 110-B4, 110-B8,
195-A17, 195-A20 and 147-a1-4, 147-a1-1.
Transgene Presence
+ - Total
ELISA + 38 13 51
- 35 2 37
Total 73 15 88
Table 17. Contingency table for the relationship between transgene presence and virus presence,
TriMV CP RNAi construct T1 generation lines 201 tillers A and D, and 817 tillers C, D and E.
Transgene Presence
+ - Total
ELISA + 21 7 21
- 32 2 32
Total 53 9 53
Page 54
48
Table 18. Contingency table for the relationship between transgene presence and virus presence,
TriMV CP RNAi construct T2 generation lines 201 tillers A5, A19, D10 and 862 tiller F4.
Transgene Presence
+ - Total
ELISA + 13 5 18
- 16 5 21
Total 29 10 39
Table 19. Contingency table for the relationship between transgene expression and virus
presence, WSMV CP RNAi construct T1 generation lines 147 tiller a1 and 462 tillers A, B, C, D
and E.
Transgene Expression
+ - Total
ELISA + 5 12 17
- 10 8 18
Total 15 20 35
Table 20. Contingency table for the relationship between transgene expression and virus
presence WSMV CP RNAi construct T2 generation lines 462B2, 462D3, 462E2, 110B4, 110B8,
195A17, 195A20 and 147a1-4, 147a1-1.
Transgene Expression
+ - Total
ELISA + 7 31 38
- 25 10 35 Total 32 41 73
Page 55
49
Table 21. Contingency table for the relationship between transgene expression and virus
presence, TriMV CP RNAi construct T1 generation lines 201tillers A and D, and 817 tillers C,
D, and E.
Transgene Expression
+ - Total
ELISA + 20 1 21
- 27 5 32 Total 47 6 53
Page 56
50
Figure 1.Schematic representation RNAi vector construction. (A) p ENTER/ D-
TOPO (Invitrogen, Carlsbad, CA ), containing the attL1 and attL2 sites for site-
specific recombination of the CP into the expression vector. (B) pANDA-mini (Miki
& Shimamoto, 2004) vector with attR sites that allow the insertion of inverted CP
sequences flanking the gus linker, after homologous recombination. This construction
will form a hairpin RNA product when expressed in wheat.
Page 57
51
Figure 2. Tissue culture selection cycles in dark. (A) Wheat embryos excised and plated on CM4. (B) Six day-old
embryos after bombardment. (C) Embryogenic calli on CM4 medium under glufosinate selection.
A B
C
Page 58
52
Figure 3. Tissue culture regeneration cycles in light (D) Embryogenic calli on shoot production medium (MSP).
(E) Embryogenic calli on shoot elongation medium (MSE). (F) Putative transgenic plants on MSE.
(G) Recovered rooted plants in polystyrene container.
G F
D E
Page 59
53
Ubi promoter c
Intron
Intron BAR NOS 3‟
Hind III (1)
Eco RI (1404)
PstI(1999) Sal I (2596)
SphI(7)
PstI (13)
Xba I (2111)
BamHI (2017)
Exon Eco RI (2885)
Sal I (2005)
PstI(2602)
Figure 4. Schematic diagram of pAHC20 containing the bar gene for ammonium
glufosinate resistance, used in the co-bombardment experiments (adapted from
Christensen and Quail, 1996).
Page 60
54
Figure 5. Wheat leaves painted with 0.2% Lyberty herbicide. (A) Non-transgenic wheat
leaf exhibiting a susceptible phenotype. (C) A leaf from a transgenic wheat plant exhibiting
a resistant phenotype to the herbicide.
A
B
Page 61
55
Figure 6. Phenotypes observed in transgenic and non-transgenic. (A-C) Severe infection
symptoms, mosaic discontinuous parallel to the leave vein stunt and rosette formation. (C) Final
stage of plants with severe infection. (D-E) Symptoms of no severe infection, mosaic presence,
but normal plant size and architecture.
A
B
C
D
E
Page 62
56
Figure 7. PCR analyses on gDNA of T0 WSMV CP RNAi transgenic wheat. M, DNA
marker; 1-7, seven independent transgenic wheat plants; N1, non-transgenic wheat plant; N2,
H2O; P,WSMV CP-pANDA mini (5 pM).
Anti sense arm
Sense arm
Bar gene
Page 63
57
Gus-R/CP- R
Alpha Tubulin
Sense arm
Gus linker
WSMV CP
Alpha Tubulin
Gus linker
Figure 8. Molecular analyses of the T2 WSMV CP RNAi transgenic plant line 110-B8.
M, 100 bp DNA marker; 1-10, ten T2 transgenic wheat plants; N, non-transgenic wheat plant;
N1, H2O; P, WSMV CP-pANDA mini initial vector (5 pM). (A) PCR for transgene
detection. (B) RT-PCR analyses. P, gDNA.
Anti sense arm
A
B
Page 64
58
Gus-R/CP- R
Alpha Tubulin
Gus-F/CP- R
Gus linker
TriMV CP
Alpha Tubulin
Figure 9. Molecular analyses of the T2 WSMV CP RNAi line 147- a1. M, 100 bp DNA
marker; 1-10, ten T2 transgenic wheat plants; N, non-transgenic wheat plant; N1, H2O; P,
WSMV CP-pANDA mini initial vector (5 pM). (A) PCR for transgene detection. (B) RT-
PCR analyses. P, gDNA.
B
A
Page 65
59
Sense arm Gus-F/CP- R
Bar gene
Figure 10. PCR analyses on gDNA of T0 TriMV CP RNAi transgenic wheat. M,
100 bp DNA marker; 1-8, eight independent transgenic wheat plants; N1, non-
transgenic wheat plant; N2, H2O; P, TriMV-pANDA mini (5 pM), bombardment
vector.
Antisense arm Gus-F/CP- R
Page 66
60
Antisense arm Gus-R/CP- R
Sense arm Gus-F/CP- R
Alpha Tubulin
gus linker
TriMV CP
Alpha Tubulin
Figure 11. Molecular analyses of the T2 TriMV CP RNAi transgenic plants line 201- A19.
M, 100 bp DNA marker; 1-10, ten T2 transgenic wheat plants; N, non-transgenic wheat plant;
N1, H2O; P, TriMV CP-pANDA mini initial vector (5pM). (A) PCR for transgene detection.
(B) RT-PCR analyses. P, gDNA.
A
B
Page 67
61
Figure 12. ELISA results T1 (A) and T2 (B) generation WSMV CP hairpin construct.
Axis Y virus titer, axis X presence or absence of hairpin transgene (plus & minus
symbols) in the plants evaluated in the tiller non-transgenic control plants (NT). The
red line represents the threshold between positive (above) and negative (below) virus
presence.
A
B
Page 68
62
Figure 13. ELISA results T1 (A) and T2 (B) generation TriMV CP hairpin construct.
Axis Y virus titer, axis X presence or absence of hairpin transgene (plus & minus
symbols) in the plants evaluated in the tiller non-transgenic control plants (NT). The
red line represents the threshold between positive (above) and negative (below) virus
presence.
A
B
A
Page 69
63
References And/Or Bibliography
Anandalakshmi R., Pruss G., Ge X., Marathe R., Mallory A., Smith., Vance V., 1998. A viral
suppressor of gene silencing in plants. PNAS 95, 13079-13084.
Baulcombe D., 2004.RNA silencing in plants. Nature 431, 356-363.
Beclin C., Boutet S, Waterhouse P., Vaucheret H., 2002. A branched pathway for transgene-
induced RNA silencing in plants. Current Biology 12,684–688.
Blanc, S., Lopez-Moya, J.J., Wang, R.Y., Garcia-Lampasona, S., Thornbury, D.W., Pirone,
T.P.,1997. A specific interaction between the coat proteinand helper component
correlates with aphid transmission of a potyvirus. Virology 231, 141–147.
Blanc S., Ammar E.D., Garcia-Lampasona S., Dolja V.V., Llave C., Baker, J., Pirone T.P.,
1998. Mutations in the potyvirus helper component protein: effects on interaction with
virions and aphid stylets. Journal of General Virolology 79, 3119–3122.
Beachy R.N., Loesch-Fries S, Tumer N.E., 1990. Coat Protein –mediate resistance against virus
infection. Annual Review Phytipathology 28, 451-474.
Bernstein, E., A. A. Caudy, S. M. Hammond, and G. J. Hannon., 2001. Role for a bidentate
ribonuclease in the initiation step of RNA interference. Nature 409, 363-366.
Bucher E., Lohuis D., van Poppel P. M. J. A., Geerts-Dimitriadou C., Goldbach R., Prins M.,
2006. Multiple virus resistance at a high frequency using a single transgene construct.
Journal of General Virology 87, 3697-3701.
Bockus W. W., Appel J. A., Bowden R.L., Fritz A. K., Gill B. S., Martin T. J., Seifers D. L.,
Brown-Guedira G. L., Eversmeyer M. G., 2001. Success stories: Breeding for wheat
disease resistance in Kansas. Plant Disease 85, 453–461.
Buker S.M., Iida .T, Bühler M., Villén J., Gygi S.P., Nakayama J., Moazed D., 2007. Two
different Argonaute complexes are required for siRNA generation and heterochromatin
assembly in fission yeast. Nat Struct Mol Biol 14, 200-206.
Page 70
64
Carrington J.C., Jensen P.E., Schaad M., 1998 Genetic evidence for an essential role for
potyvirus CI protein in cell-to-cell movement. The Plant Journal 14, 393–400.
Christensen, A.H., and Quail, P.H., 1996. Ubiquitin promoter-based vectors for high level
expression of selectable and/or screenable marker genes in monocotyledonous plants.
Transgenic Res. 5, 213-218.
Cronin S., Verchot J., Haldeman-Cahill R., Schaad M.C., Carrington, J.C., 1995. Long-distance
movement factor: a transport function of the potyvirus helper component proteinase.
Plant Cell 7, 549–559.
Dangl, J. L., Jones, J. D. G., 2001. Plant pathogens and integrated defence responses to infection.
Nature 411, 826–833.
De la Cruz J., Kressler D., and Linder P., 1999. Unwinding RNA in Saccharomyces cerevisiae:
DEAD-box proteins and related families. Trends Biochem. Sci. 24, 192–198.
Diaz-Pendon J. A., Truniger V., Nieto C., Garcia-Mas J., Bendahmane A., Aranda M. A., 2004.
Advances in understanding recessive resistance to plant viruses. Molecular Plant
Pathology 5, 223-233.
Dinant S, Maisonneuve B, Albouy J, et al., 1997. Coat protein gene-mediated protection in
Lactuca sativa against lettuce mosaic potyvirus strains. Molecular Breeding 3, 75–86.
Dolja V.V., Haldeman R., Robertson N.L., Dougherty W.G., Carrington J.C., 1994. Distinct
functions of capsid protein in assembly and movement of tobacco etch potyvirus in
plants. EMBO J. 13, 1482–1491.
Duprat A., Caranta C., Revers F., Menand B., Browning K. S., Robaglia C., 2002. The
Arabidopsis eukaryotic initiation factor (iso)4E is dispensable for plant growth but
required for susceptibility to potyviruses. Plant J 32, 927–934.
Fauquet M., Mayo M.A., Maniloff J., Desselberger U., Ball L.A. (Eds)., 2005. Virus Taxonomy,
VIIIth Report of the International Committee on Taxonomy of Viruses".
Farnham, G. and Baulcombe, D.C., 2006 Artificial evolution extends the spectrum of viruses that
are targeted by a disease-resistance gene in potato. Proc. Natl Acad. Sci. 103, 18828–
18833.
Page 71
65
Fladung M., 1999. Gene stability in transgenic aspen (Populus). I. Flanking DNA sequences and
T-DNA structure. Molecular Genetics and Genomis 260: 574-581.
Feldmann K. A., Coury D.A., Christianson M.L., 1997. Exceptional segregation of a selectable
marker (KanR) in Arabidopsis identifies genes important for gametophytic growth and
development. Genetics 147: 1411-1422.
Fellers J., Wan J., Hong Y., Collins G. B., Hunt A. G., 1998. In vitro interactions between a
potyvirus-encoded, genomelinked protein and RNA-dependent RNA polymerase.
General Virology 79, 2043- 2049.
Fernández A., Guo H. S., Sáenz P., Buela L. S., Gómez M. García J.,1995. The motif V of plum
pox potyvirus CI RNA helicase is involved in NTP hydrolysis and is essential for virus
RNA replication. Nucleic Acid Research 25, 4474-4480.
Fernandez A., Garcia J. A., 1996. The RNA helicase CI from plum pox potyvirus has two
regions in binding to RNA.FEBS Lett. 338, 206 -210.
Fire A., Xu S., Montgomery M.. Kostas S. A., Driver S. E., Mello C., 1998 Potent and specific
genetic interference by double-stranded RNA in Caenorhabditis elegans .Nature 391,
806-811.
Friebe B., Mukai Y., Dhaliwal H.S. , Martin T. J., Gill B.S., 1991. Identification of alien
chromatin specifying resistance to wheat streak mosaic and greenbug in wheat
germplasm by C-bandingand in situ hybridization. Theor. Appl. Genet. 81, 381-389.
Friebe B., Qi L. L., Wilson D. L., Chang Z. J., Seifers D. L., Martin T. J., Fritz A. K., Gill B. S.,
2009. Wheat–Thinopyrum Intermedium Recombinants Resistant to Wheat Streak Mosaic
Virus and Triticum Mosaic Virus. Crop science 49, 1221-1226
Fu D., Uauy C., Blechl A., Dubcovsky J., 2007 RNA interference for wheat functional gene
analysis. Transgenic Research 16, 689–701.
Gill Gura T., 2000. A silence that speaks volumes. Nature 404, 804-808.
Haley, S.D., Martin T.J.,Quick J.S. Seifers, D.L., Stromberger J.A., Clayshulte S.R., Clifford
B.L., Peairs F.B., Rudolph J.B., Johnson J.J., Gill B.S., Griebe B., 2002. Registration of
Page 72
66
CO960293-2 wheat germplasm resistant to Wheat streak mosaic virus and Russian wheat
aphid. Crop Sciences 42,1381–1382.
Hall T. M. Structure and Function of Argonaute Proteins. Structure.2005. 13,1403-1048.
Hamilton, A. J., and D. C. Baulcombe., 1999. A species of small antisense RNA in
posttranscriptional gene silencing in plants. Science 286,950-952.
Hammond, S. M., E. Berstein, D. Beach, and G. J. Hannon., 2000. An RNA-directed nuclease
mediates post-transcriptional gene silencing in Drosophila cells. Nature 404, 293-296.
Hammond S. M., Caudy A. A., Hannon G. J., 2001. Post-transcriptional gene silencing by doble
stranded RNA. Nature 2,110-119.
Helliwell C., Waterhouse P., 2005. Constructs and methods for hairpin RNA-mediated gene
silencing in plants. Methods in Enzymology 392, 24-35.
Hily J. M., Scorza R., Webb K., Ravelonandro M., 2005. Accumulation of the Long Class of
siRNA Is Associated with Resistance to Plum pox virus in a Transgenic Woody Perennial
Plum Tree. MPMI 18, 794–799.
Hull, R., 2002. Matthews‟ Plant Virology, 4th edn. San Diego:Academic Press.
Jorgensen R., 2002. RNA traffics information systemically in plants. Proc Natl Acad Sci. 99,
11561-11563.
Léonard S., Plante D., Wittman S., Daigneault N., Fortin,M.G., Laliberté, J.-F., 2000. Complex
formation between potyvirus VPg and translation eukaryotic initiation factor 4E
correlates with virus infectivity. J. Virol. 74, 7730–7737.
Li J., Zhao W., Li Q., ye X., An B., Li X., Zhang X., 2005. RNA silencing of waxy gene result
in low levels of amylase in the seeds of transgenic wheat (Triticum aestivum L.). Acta
Genetica Sinica 32, 846-854.
Li Z., Liu Y., Berger P. H., 2005. Transgenic silencing in wheat transformed with the WSMV-
CP gene. Biotechnology 4, 62-68.
Page 73
67
Lindbo J.A., Dougherty W.G., 1992. Untranslatable transcripts of the tobacco etch virus coat
protein gene sequence can interfere with tobacco etch virus replication in transgenic
plants and protoplasts. Virology 189, 725-733.
Lindbo J. A., Silva-Rosales L., Proebsting W. M., and Dougherty W. G., 1993. Induction of a
Highly Specific Antiviral State in Transgenic Plants: Implications for Regulation of Gene
Expression and Virus Resistance. Plant Cell 5, 1749-1759.
MacDiarmid R., 2005. RNA silencing in productive virus infections. Annual Review of
Phytopathology 43, 523-544.
Maia I. G., Haenni A. and Bernardi F., 1996. Potyviral HC-Pro: a multifunctional protein.
Journal of General Virology 77, 1335-1341.
Maule A. J. , Caranta C., Boulton M. I., 2007. Sources of natural resistance to plant viruses:
status and prospects. Molecular Plant Pathology 8, 223-231 .
Meister G., Tuschl T., 2004. Mechanisms of gene silencing by double-stranded RNA. Nature
431, 343-349.
Mérai Z., Kerényi Z., Kertész S, Magna M., Lakatos L., Silhavy D., 2006. Double-Stranded
RNA Binding May Be a General Plant RNA Viral Strategy To Suppress RNA Silencing.
Journal of Virology 80, 5747–5756.
Melo C. C., Conte D., 2004. Revealing the world of RNA interference. Nature 431, 338-342.
Miki D., Shimamoto K., 2004. Simple RNAi vectors for stable and transient suppression of gene
function in rice. Plant Cell Physiology 45, 490–495.
Napoli C.,' Lemieux C., Jorgensen R., 1990. lntroduction of a Chimeric Chalcone Synthase Gene
into Petunia Results in Reversible Co-Suppression of Homologous Genes Ín trans .The
Plant Cell 2, 279-289.
Nicaisea V., Galloisb J., Chafiaia F., Allenc L. M., Schurdi-Levrauda V., Browningc K.S.,
Candressea T., Carantab C., Le Galla O., German-Retana S., 2007. Coordinated and
selective recruitment of eIF4E and eIF4G factors for potyvirus infection in Arabidopsis
thaliana FEBS Letters 581, 1041- 1046.
Page 74
68
Niu QW, Lin SS, Reyes JL, Chen KC, Wu HW, Yeh SD, Chua NH., 2006. Expression of
artificial microRNAs in transgenic Arabidopsis thaliana confers virus resistance. Nature
Biotechnology 24, 1420-1428.
Parker L., Kendall A., Berger P.H., Shiel P.J., Stubbs G., 2005. Wheat streak mosaic virus
Structural parameters for a Potyvirus. Virology 340, 64 – 69
Pooggin M, Dreyfus M., Hohn T., 2001. mRNA Enigmas: The silence of the genes. Int Arch
Biosc 1023 -1026.
Riechmann J. L., Lain S., Garcia J. A., 1992. Highlights and prospects of potyvirus molecular
biology. Journal of General Virology 73- 1-16.
Risseeuw E., Franke-van Dijk M. E., Hooykaas P. J., 1997. Gene targeting and instability of
Agrobacterium T-DNA loci in the plant genome. Plant Journal 11, 717-728.
Romano, N., Macino, G., 1992. Quelling: transient inactivation of gene expression in
Neurospora crassa by transformation with homologous sequences. Mol. Microbiol. 6,
3343–3353.
Romano E., Soares A., Proite K., Neiva S., Grossi M., Faria J. C., Rech E. L. , Aragão F., 2005.
Transgene elimination in genetically modified dry bean and soybean lines. Genetic and
Molecular Research 4, 177-184.
Ruiz V., and Olivier V., 2007. Viral suppression of RNA silencing: 2b wins the Golden Fleece
by defeating Argonaute. BioEssays 29, 319-323.
Sambrook J., Rusell D. W., 2001. Molecular Cloning: A Laboratory Manual. 3th ed, NY: Cold
Spring Harbor Laboratory Press
Sato M., Nakahara K., Yoshii M., Ishikawa M., Uyeda I., 2005. Selective involvement of
members of the eukaryotic initiation factor 4E family in the infection of Arabidopsis
thaliana by potyviruses. FEBS Lett. 579, 1167-1171.
Schaad, M. C., P. E. Jensen, and J. C. Carrington., 1997. Formation of plant RNA virus
replication complexes on membranes: role of an endoplasmic reticulum-targeted viral
protein. EMBO J. 16, 4049-4059.
Page 75
69
Seifers D. L., Martin T.J., Harvey T. L., Stack J.P., Ryba-White M., Harber S., Krikhin O.,
Spicer V., Lovat N., Yamchuk A., StandingK. G., 2007. Triticum mosaic virus: A New
Virus Isolated From Wheat In Kansas. Plant Disease 92, 808-817.
Seifers, D.L., Martin T.J., Harvey T.L., Haber S., 2007. Temperature- sensitive Wheat streak
mosaic virus resistance Identified in KS03HW12 wheat. Plant Dis. 91, 1029-1033.
Sivamani E., Brey C. W., Dyer W. E., Talbert L. E., Qu R., 2000. Resistance to wheat streak
mosaic virus in transgenic wheat expressing the viral replicase (NIb) gene. Molecular
Breeding 6, 469-477.
Sivamani E., Brey C. W., Dyer W. E., Talbert L. E., Qu R., 2002 Resistance to wheat streak
mosaic virus in transgenic wheat engineered with the viral coat protein Transgenic
Research 11, 31-41.
Srivastava V., Vasil V., Vasil I. K., 1996. Molecular characterization of the fate of transgenes in
transformed wheat (Triticum aestivum L.). Theoretical and Applied Genetics 92, 834-
842.
Slykhuis, J. T., 1955. Aceria tulipae Keifer (Acarina: Eriophyidae) in relation to spread of wheat
streak mosaic virus. Phytopathology 45, 116-128.
Smith N. A., Singh S. P., Wang M., Stoutjesdijk P. A., Green A.G ,. Waterhouse P. M., 2000.
Gene expression: Total silencing by intron-spliced hairpin RNAs. Nature 407, 319-320.
Soosaar J.L.M., Burch-Smith T., Dinesh-Kumar S.P., 2005. Mechanisms of plant resistance to
viruses. Nature Reviews Microbiology 3, 789-798.
Stanford J.C., Johnston S.A., 1985. The concept of parasite resistance genes from parasites own
genome. J.Theor. Biol. 113, 395-405.
Stenger C. , Hein G. L., Gildow F E., Horken K. M., French R., 2005. Plant Virus HC-Pro Is a
Determinant of Eriophyid Mite Transmission. Journal of virology 79, 9054–9061.
Stenger C., French R., Gildow F., 2005 Complete Deletion of Wheat Streak Mosaic Virus HC-
Pro: a Null Mutant Is Viable for Systemic Infection Journal of Virology 79, 12077–
12080.
Page 76
70
Stenger DC, Young BA, French R. 2006. Random mutagenesis of Wheat streak mosaic virus
HC-Pro: noninfectious interfering mutations in a gene dispensable for systemic infection
of plants. Journal of General Virology 87, 2741–2747.
Stenger, D. C., Hein, G. L. & French, R. 2006. Nested deletion analysis of Wheat streak mosaic
virus HC-Pro: mapping of domains affecting polyprotein processing and eriophyid mite
transmission. Virology 350, 465–474.
Tennant P., Fermin G., Fitch M. M., Manshardt R. M., Slightom J. L., Gonsalves D., 2001.
Papaya ringspot virus resistance of transgenic Rainbow and SunUp is affected by gene
dosage, plant development and coat protein homology. European Journal of Plant
Pathology 107, 645–653.
Tenger, D.C., Hall, J.S., Choi, I.-R., French, R., 1998. Phylogenetic relationships within the
family Potyviridae: wheat streak mosaic virus and brome streak mosaic virus are not
members of the genus Rymovirus. Phytopathology 88, 782– 787.
Thivierge K., Nicaise V., Dufresne P., Cotton S., Laliberté J.F., Le Gall O., Fortin M. G.,
2005.Plant Virus RNAs. Coordinated Recruitment of Conserved Host Functions by (+)
ssRNA Viruses during early Infection Events. Plant Physiology 138, 1822-1827.
Urcuqui-Inchima S., Haenni A. L., Bernardi F. 2001. Potyvirus proteins: a wealth of functions.
Virus research 74, 157-175.
Seifers D. L., Martin T. J., Harvey T. L., Haber S., Haley S. D. 2006. Temperature Sensitivity
and Efficacy of Wheat streak mosaic virus Resistance Derived from CO960293 Wheat.
Plant disease 90, 623-628.
Tanzer M. M., Thompson W. F., Law M.D., Wernsman E.A., Uknes S., 1997. Characterization
of Post-Transcriptionally Suppressed Transgene Expression That Confers Resistance to
Tobacco Etch Virus Infection in Tobacco. Plant Cell 9, 1411–142.
Yan K. S., Yan S, Farooq A., Han A., Zeng L., Zhou M. 2003 Structure and conserved RNA
binding of the PAZ domain. Nature 426, 468-474.
Zar, J. H. 1999. Biostatistical Analysis, 4th ed. Prentice Hall, Upper Saddle River, NJ