Resistivity and Transmission Electron Microscopy Investigations of Ordering Transformation in Stoichiometric Ni 2 (Cr 0.5 Mo 0.5 ) Alloy A. VERMA, JUNG B. SINGH, M. SUNDARARAMAN, and NELIA WANDERKA The evolution of long-range order (LRO) from short-range order (SRO) and vice versa was studied by combining resistivity measurement and transmission electron microscopy (TEM) investigations on solution-treated samples of composition Ni 2 (Cr 0.5 Mo 0.5 ). The progress of microstructural evolution during the isochronal run for the resistivity measurement was fol- lowed. The measured variation in the intensity of superlattice spots during SRO to LRO transition was correlated with the resistivity profile obtained during the isochronal run. The reappearance of SRO was observed after the disappearance of LRO. The isothermal transfor- mation temperature for the appearance of the long-range ordered state, the beginning of dis- appearance of the long-range ordered state, and the reappearance of the short-range ordered state in the solution-treated sample were determined from the resistivity curves obtained for different heating rates. The resistivity profile was qualitatively explained on the basis of ordering and clustering of solute atoms associated with the formation of different ordered phases obtained from microscopic evidence. DOI: 10.1007/s11661-012-1145-1 Ó The Minerals, Metals & Materials Society and ASM International 2012 I. INTRODUCTION THE Ni-Cr-Mo–based alloys, such as HASTEL- LOYS C-4, C-22, and C-276, HASTELLOY* S, HAYNES* 242, Alloy 625, and Alloy 686, are used for applications requiring very high corrosion and oxidation resistance. [1,2] Some of these alloys are con- sidered as candidate materials for long-term storage applications of radioactive waste up to a period of 10,000 years in geological repository sites at tempera- tures varying in the range of 323 K to 573 K (50 °C to 300 °C). [3,4] These alloys are normally used in solid solution condition and are generally considered non- hardenable by conventional aging treatments. [2] Pro- longed aging of these alloys in the temperature range of 673 K to 973 K (400 °C to 700 °C) results in the precipitation of a long-range ordered Ni 2 (Cr, Mo) phase (which has Pt 2 Mo prototype oI6 structure) from the disordered face-centered-cubic (fcc) matrix. [5–10] This precipitation reaction occurs homogeneously with no preferential nucleation at grain boundaries or twin boundaries. In the temperature range of 1023 K to 1173 K (750 °C to 900 °C), various carbides and topologically-close-packed phases precipitate in the matrix as well as at grain boundaries. Their evolution has been extensively reported. [3,11–13] The formation of carbides leads to sensitization of grain boundaries promoting intergranular failure. The continuous evolution of the long-range order (LRO) from the short-range order (SRO) state attracted numerous researchers to investigate Ni-Cr-Mo–based alloy systems. [9–16] All these researchers used transmission electron microscopy (TEM), X-ray diffraction, and dif- ferential scanning calorimetry [9–11,14–16] for their investi- gations on the formation and dissolution of ordered Ni 2 (Cr, Mo) precipitates in Ni-Cr-Mo alloys. Resistivity measurements were also employed in the past for the investigations of SRO and LRO in alloy systems other than Ni-Cr-Mo. [17–23] Karmazin’s group carried out experimental work to determine the solvus temperature and the details of phase boundary of Ni 2 (Cr, Mo) structure in binary Ni-Cr and ternary Ni-Cr-Mo (with Cr to Mo ratio of 3) systems. [14] They noticed that molybdenum addition shifts the solubility limit toward lower concentration and the maxima of the Ni 2 Cr ordered phase boundary toward higher temperatures with respect to those in the binary Ni-Cr system. The solvus temper- ature of the ternary Ni-Cr-Mo alloy system of stoichi- ometric composition Ni 2 (Cr, Mo) was recently studied by A. VERMA, formerly Guest Scientist, with the Helmholtz-Zentrum Berlin fu¨r Materialien und Energie GmbH, Institut fu¨r angewandte Materia1 forschung, D-14109 Berlin, Germany, is now Scientist, with the Mechanical Metallurgy Division, Bhabha Atomic Research Center, Mumbai 400 085, India. Contact e-mail: barc.amit@gmail. com JUNG B. SINGH, Scientist, is with the Mechanical Metallrugy Division, Bhabha Atomic Research Center. M. SUNDARARAMAN, formerly with the Mechanical Metallurgy Division, Bhabha Atomic Research Center, is now Professor, School of Engineering Sciences and Technology, University of Hyderabad, Gachibowli, Hyderabad 500046, India. NELIA WANDERKA, Scientist, is with the Helmholtz- Zentrum Berlin fu¨r Materialien und Energie GmbH, Institut fu¨r angewandte Materia1 forschung. Manuscript submitted October 14, 2011. Article published online June 6, 2012 *HASTELLOY and HAYNES are trademarks of Stoody Deloro Stellite, Inc., Industry, CA. 3078—VOLUME 43A, SEPTEMBER 2012 METALLURGICAL AND MATERIALS TRANSACTIONS A
Transcript
Resistivity and Transmission Electron MicroscopyInvestigations of Ordering Transformationin Stoichiometric Ni2(Cr0.5Mo0.5) Alloy
A. VERMA, JUNG B. SINGH, M. SUNDARARAMAN, and NELIA WANDERKA
The evolution of long-range order (LRO) from short-range order (SRO) and vice versa wasstudied by combining resistivity measurement and transmission electron microscopy (TEM)investigations on solution-treated samples of composition Ni2(Cr0.5Mo0.5). The progress ofmicrostructural evolution during the isochronal run for the resistivity measurement was fol-lowed. The measured variation in the intensity of superlattice spots during SRO to LROtransition was correlated with the resistivity profile obtained during the isochronal run. Thereappearance of SRO was observed after the disappearance of LRO. The isothermal transfor-mation temperature for the appearance of the long-range ordered state, the beginning of dis-appearance of the long-range ordered state, and the reappearance of the short-range orderedstate in the solution-treated sample were determined from the resistivity curves obtained fordifferent heating rates. The resistivity profile was qualitatively explained on the basis of orderingand clustering of solute atoms associated with the formation of different ordered phasesobtained from microscopic evidence.
DOI: 10.1007/s11661-012-1145-1� The Minerals, Metals & Materials Society and ASM International 2012
I. INTRODUCTION
THE Ni-Cr-Mo–based alloys, such as HASTEL-LOYS C-4, C-22, and C-276, HASTELLOY* S,
HAYNES* 242, Alloy 625, and Alloy 686, are usedfor applications requiring very high corrosion andoxidation resistance.[1,2] Some of these alloys are con-sidered as candidate materials for long-term storageapplications of radioactive waste up to a period of10,000 years in geological repository sites at tempera-tures varying in the range of 323 K to 573 K (50 �C to300 �C).[3,4] These alloys are normally used in solidsolution condition and are generally considered non-hardenable by conventional aging treatments.[2] Pro-longed aging of these alloys in the temperature range of
673 K to 973 K (400 �C to 700 �C) results in theprecipitation of a long-range ordered Ni2(Cr, Mo) phase(which has Pt2Mo prototype oI6 structure) from thedisordered face-centered-cubic (fcc) matrix.[5–10] Thisprecipitation reaction occurs homogeneously with nopreferential nucleation at grain boundaries or twinboundaries. In the temperature range of 1023 K to1173 K (750 �C to 900 �C), various carbides andtopologically-close-packed phases precipitate in thematrix as well as at grain boundaries. Their evolutionhas been extensively reported.[3,11–13] The formation ofcarbides leads to sensitization of grain boundariespromoting intergranular failure.The continuous evolution of the long-range order
(LRO) from the short-range order (SRO) state attractednumerous researchers to investigate Ni-Cr-Mo–basedalloy systems.[9–16]All these researchers used transmissionelectron microscopy (TEM), X-ray diffraction, and dif-ferential scanning calorimetry[9–11,14–16] for their investi-gations on the formation and dissolution of orderedNi2(Cr, Mo) precipitates in Ni-Cr-Mo alloys. Resistivitymeasurements were also employed in the past for theinvestigations of SRO and LRO in alloy systems otherthan Ni-Cr-Mo.[17–23] Karmazin’s group carried outexperimental work to determine the solvus temperatureand the details of phase boundary of Ni2(Cr, Mo)structure in binary Ni-Cr and ternary Ni-Cr-Mo (withCr to Mo ratio of 3) systems.[14] They noticed thatmolybdenum addition shifts the solubility limit towardlower concentration and themaximaof theNi2Cr orderedphase boundary toward higher temperatures with respectto those in the binary Ni-Cr system. The solvus temper-ature of the ternary Ni-Cr-Mo alloy system of stoichi-ometric compositionNi2(Cr,Mo) was recently studied by
A. VERMA, formerly Guest Scientist, with the Helmholtz-ZentrumBerlin fur Materialien und Energie GmbH, Institut fur angewandteMateria1 forschung, D-14109 Berlin, Germany, is now Scientist, withthe Mechanical Metallurgy Division, Bhabha Atomic ResearchCenter, Mumbai 400 085, India. Contact e-mail: [email protected] JUNG B. SINGH, Scientist, is with the Mechanical MetallrugyDivision, Bhabha Atomic Research Center. M. SUNDARARAMAN,formerly with the Mechanical Metallurgy Division, Bhabha AtomicResearch Center, is now Professor, School of Engineering Sciences andTechnology,University ofHyderabad, Gachibowli, Hyderabad 500046,India. NELIA WANDERKA, Scientist, is with the Helmholtz-Zentrum Berlin fur Materialien und Energie GmbH, Institut furangewandte Materia1 forschung.
Manuscript submitted October 14, 2011.Article published online June 6, 2012
*HASTELLOY and HAYNES are trademarks of Stoody DeloroStellite, Inc., Industry, CA.
3078—VOLUME 43A, SEPTEMBER 2012 METALLURGICAL AND MATERIALS TRANSACTIONS A
Pai et al.[16] using DSC and TEM. They reported that thesolvus temperature for the ordered phase increases from900 K to 1046 K (627 �C to 773 �C) with the increase ofMo/Cr ratio from 0 to 1.[16] In addition to long-rangeordered Ni2(Cr, Mo) phase, short-range ordering wasalso noticed in many Ni-based alloys in the solution-treated condition.[24–29] Caudron et al.[24] noticed theformation of 1 1=2 0f g SRO in Ni2Cr and Ni3Cr compo-sitions in the solution-treated alloy in neutron diffractionexperiments, while Pai[25] observed 1 1=2 0f g SRO only inthe Ni2(Cr0.5Mo0.5) alloy in solution-treated conditionusing electron diffraction. TEM was used to study theprogressive changes in the SRO state to LRO state duringthe initial stages of ordering in the Ni-Mo system usingthermal and irradiation experiments.[26] Kumar andVasudevan, in their study on precipitation behavior inNi-25Mo-8Cr alloy using TEM, noticed the formation of1 1=2 0f g SRO and long-range ordered Ni2(Cr, Mo)
phase.[9]
The resistivity technique was used extensively to studythe SRO and LRO formation in materials.[17–23] Soltyset al.[17] carried out isochronal resistivity experiments tostudy the SRO in the Ni-10 at. pct Mo alloy. White andMiller[18] carried out the isothermal resistivity measure-ment for investigating the role of quenched-in vacancieson aging of NIMONIC** alloys and correlated it with
the activation energy of the process. Lang[19] reportedthat the formation of the SRO state resulted inincreasing resistivity in Ni-Cr–based alloys, while theformation of LRO resulted in reduction in resistivity ofalloys.[20,21] Despite many investigations on SRO andLRO states, no study is mentioned in the literature inwhich the microstructural evolution was correlated withthe different regimes of resistivity change.
The present article reports the results of a studyinvolving the resistivity measurements during isochronalheating of a Ni2(Cr0.5Mo0.5) alloy as well as theevaluation of its microstructure (using TEM) at differentstages during isochronal heating. The progress ofordering was investigated using TEM on the basis ofthe intensity measurement made in the reciprocal space(i.e., diffraction patterns). The isothermal transforma-tion temperature for the appearance of the long-rangeordered state, the beginning of disappearance of thelong-range ordered state, and the reappearance of theshort-range ordered state in the solution-treated samplewas determined from the resistivity curves obtained atdifferent heating rates. The resistivity changes areexplained on the basis of clustering and orderingoccurring in the alloy during ordering treatment.
A. Structural Description of Phases Formingin This Alloy
Earlier investigations on Ni-Cr-Mo alloys revealedthat the phases forming in this alloy during orderingreactions are 1 1=2 0f g SRO and Pt2Mo type Ni2(Cr, Mo)
phases both belonging to 1 1=2 0f g family.[9,27–30] Thesestructures can be described in terms of stacking of theatoms on (420) planes of the fcc lattice (Figure 1). TheN2M2 structure (where N = Ni and M = Mo) depictedin Figure 1(a) can be constructed from the concentra-tion wave with 1 1=2 0h i wave vector. The layeringsequence on (420) planes is …NiNiMoMoNiNi…. TheN2M structure can be considered as a layered structureon (420) planes with every third layer being occupiedfully by M atoms (Figure 1(b)). The correspondingsubunit cells of both the phases are also shown in therespective figures. It is worth mentioning here thatcompared to the average composition of the alloy, thefully ordered N2M2 structure contains concentration ofsolutes in excess, while the N2M structure contains thesame concentration of solutes. This is suggestive ofthe fact that clustering of solutes takes place in theformation of the N2M2 structure.
II. EXPERIMENT
Alloy of stoichiometric composition Ni2(Cr0.5,Mo0.5)was prepared by arc melting under purified argonatmosphere in a nonconsumable furnace with tungstenelectrode and a water-cooled copper hearth. The ingotwas homogenized at 1573 K (1300 �C) for 40 hours inflowing argon atmosphere and then furnace cooled. Thehomogenized button was hot rolled, and strips ofsamples of dimensions 20 9 3 9 0.35 mm were preparedfrom the hot-rolled sheets. The strips were solutiontreated at 1423 K (1150 �C) for 2 hours in sealed quartztubes filled with helium gas followed by water quench-ing. A four-probe resistivity measurement setup with aconstant current source and a Keithley nanovoltmeter(Model No. 181) was employed for resistance measure-ment, and the data were recorded through RS 232communication at intervals of 1 second. A standard cellof 1 ohm resistance was used in series with the currentsource for measuring the current input across theprobing wires of the four-probe measurement device.Copper wires of diameter 0.3 mm were spot welded atequidistant points on strip samples for four-proberesistivity measurement. The temperature of the furnace
Fig. 1—Schematic representation of atomic arrangements in the(0 0 1) plane of the fcc lattice (a) N2M2 (where N = Ni andM = Mo) and (b) Pt2Mo structure. Subunit cells are outlined byclosed lines in the representative figures.
**NIMONIC is a trademark of INCO Alloys International, Inc.,Huntington, WV.
METALLURGICAL AND MATERIALS TRANSACTIONS A VOLUME 43A, SEPTEMBER 2012—3079
was controlled by a programmable Eurotherm temper-ature controller (Model No. 2604) connected with thefurnace. Isochronal resistivity experiments with differentheating rates were carried out from room temperature(RT) to 1173 K (900 �C) in flowing atmosphere of high-purity argon gas.
In order to study the evolution of microstructure atdifferent stages of the resistivity profile, samples wereheated to different temperatures in the resistivity setupat a predetermined rate and then water quenched. Thesespecimens were later examined via TEM. Electrontransparent foils were prepared by electropolishing themin a dual-jet electropolisher using an electrolyte con-taining 1 part perchloric acid and 4 parts ethanolmaintained at about 228 K (–45 �C) temperature. AJEOL� 2000FX transmission electron microscope
operated at 160 kV and a Philips� CM30 transmission
electron microscope operated at 300 kV were used formicrostructural investigations. Standard TEM tech-niques such as bright-field (BF) and dark-field (DF)imaging and selected area electron diffraction were usedfor the investigations.
III. RESULTS
A. Resistance Change as a Function of Temperature
The relative change in the resistance as a function oftemperature in solution-treated and water-quenchedsamples during heating of the alloy at a rate of 3 K/min (3 �C/min) is depicted in Figure 2. The sample washeated from RT to 1173 K (900 �C). The resistance vs
temperature curve could be divided into five distincttemperature regimes (marked in Figure 2). Regime I(from RT to temperature T1) exhibited a linear increasein resistance. Regime II (between T1 and T2) wasmarked by a sharp increase in resistance. Regime IIIcorresponded to a sharp drop in resistance from T2 toT3. In fact, the drop in resistance in regime III continuedwell below the RT resistance value. Regime IV wasagain marked by a sharp increase in resistance beyondT3 up to temperature T4. An interesting feature ofregime V was a slow drop in resistance with a temper-ature increase beyond T4. A similar trend was noticedfor other heating rates. The nature of these regimes isdescribed in detail in Section IV. Since the SROformation was reported to result in an increase in theresistance of alloy while that of LRO formation resultedin its reduction,[17,20,21] the temperatures T2, T3, and T4
corresponding to first maximum, minimum, and sec-ondary maximum in the resistivity curve (Figure 2) aretaken to represent the temperature for the first appear-ance of LRO, the beginning of disappearance of LRO,and the complete disappearance of LRO states, respec-tively, in the present work. This becomes obvious inSection IV–B on microstructural evolution. These tem-peratures were deduced from the coefficient of thermalresistivity vs temperature plot for the different heatingrates shown in Figure 3. The coefficient of thermalresistivity is defined as
ares ¼1
T
d R=Rmaxð ÞdT
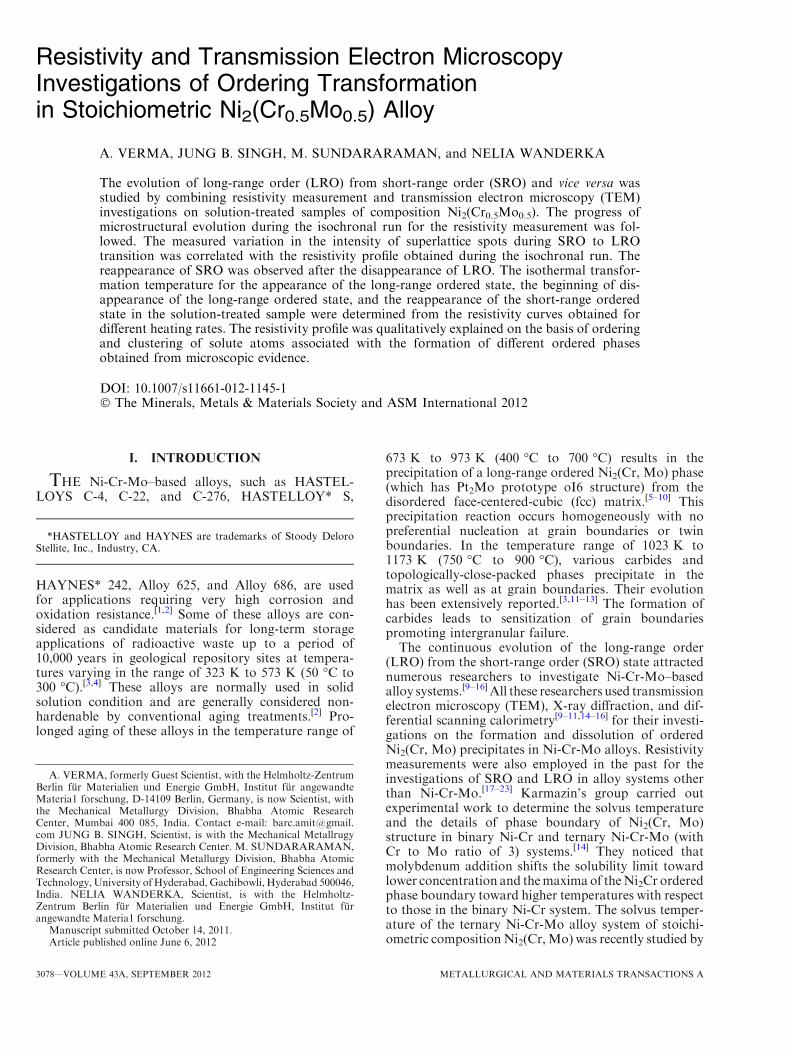
Figure 3 shows the coefficient of thermal resistivity asa function of temperature for different heating rates, viz.2, 3, 4, 5, and 6 K /min (2, 3, 4, 5, and 6 �C/min). Theintersection of line y = 0 with the curve was taken asthe temperature for the first appearance, the beginningof disappearance of LRO, and the reappearance of SROin solution-treated samples. These values are plotted asa function of heating rate (Figure 4), and from theextrapolation of linear fit to these points to zero heating
Fig. 2—Relative change in resistance as a function of temperatureduring the heating run on the sample in the solution-treated andwater-quenched condition.
Fig. 3—Coefficient of thermal resistivity plotted against temperaturefor different heating rates on samples solution treated at 1423 K(1150 �C) and in the water-quenched state.
�JEOL is a trademark of Japan Electron Optics Ltd., Tokyo.
�PHILIPS is a trademark of FEI Company, Hillsboro, OR.
3080—VOLUME 43A, SEPTEMBER 2012 METALLURGICAL AND MATERIALS TRANSACTIONS A
rate, the isothermal temperature for the appearance ofthe LRO state (T2), the beginning of the disappearanceof LRO (T3), and the reappearance of SRO (T4) in thesolution-treated samples were determined to be 832 K,927 K and 1062 K (559 �C, 654 �C, and 789 �C),respectively.
B. Microstructure Evolution
The typical microstructure of the solution-treated andwater-quenched specimen is shown in Figure 5(a). Thecorresponding selected area electron diffraction (SAED)pattern in the [001] zone axis is shown in Figure 5(b),which reveals the presence of diffuse intensity at 1 1=2 0f gpositions, which are linked by streaks that connect at the1/3{220} positions of Ni2(Cr, Mo) phase giving rise to anearly square-shaped intensity distribution. The SAEDpattern in the [112] zone axis is shown in Figure 5(c),where diffuse intensity at 1 1=2 0f g lattice positions couldbe seen streaking toward 1/3{113} and 1/3{420} posi-tions along with diffuse intensity at 1/3{220} positions.A key to diffraction patterns is schematically shown bythe side of the SAED pattern. The diffuse weak intensityof the superlattice reflections at 1 1=2 0f g and 1/3{220}positions indicated the existence of SRO in solution-treated and water-quenched specimens. The intensity ofthese SRO reflections is too weak to record in adiffraction pattern in films, and hence, they wererecorded in image plates employing long-term exposure.The SRO particles could not be imaged in DF imaging.However, the mottled contrast in the BF image inFigure 5(a) is a clear indication of the presence of veryfine particles or microdomains of SRO in the matrix, asreported by earlier workers.[9,28]
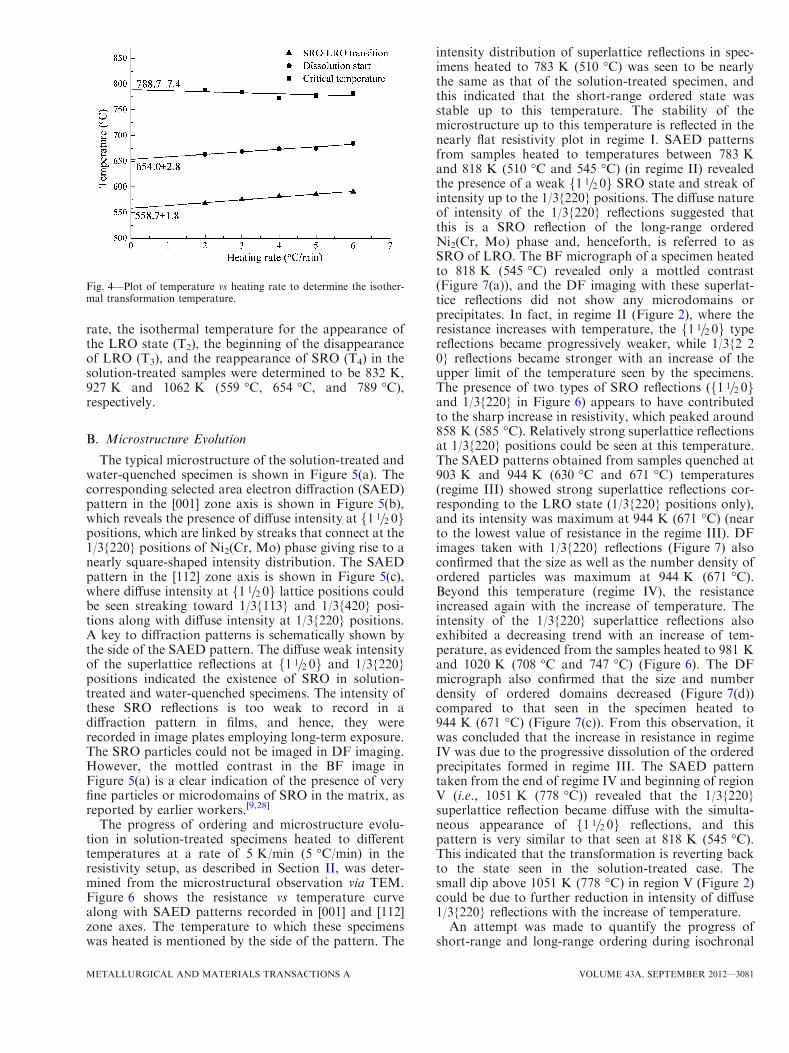
The progress of ordering and microstructure evolu-tion in solution-treated specimens heated to differenttemperatures at a rate of 5 K/min (5 �C/min) in theresistivity setup, as described in Section II, was deter-mined from the microstructural observation via TEM.Figure 6 shows the resistance vs temperature curvealong with SAED patterns recorded in [001] and [112]zone axes. The temperature to which these specimenswas heated is mentioned by the side of the pattern. The
intensity distribution of superlattice reflections in spec-imens heated to 783 K (510 �C) was seen to be nearlythe same as that of the solution-treated specimen, andthis indicated that the short-range ordered state wasstable up to this temperature. The stability of themicrostructure up to this temperature is reflected in thenearly flat resistivity plot in regime I. SAED patternsfrom samples heated to temperatures between 783 Kand 818 K (510 �C and 545 �C) (in regime II) revealedthe presence of a weak 1 1=2 0f g SRO state and streak ofintensity up to the 1/3{220} positions. The diffuse natureof intensity of the 1/3{220} reflections suggested thatthis is a SRO reflection of the long-range orderedNi2(Cr, Mo) phase and, henceforth, is referred to asSRO of LRO. The BF micrograph of a specimen heatedto 818 K (545 �C) revealed only a mottled contrast(Figure 7(a)), and the DF imaging with these superlat-tice reflections did not show any microdomains orprecipitates. In fact, in regime II (Figure 2), where theresistance increases with temperature, the 1 1=2 0f g typereflections became progressively weaker, while 1/3{2 20} reflections became stronger with an increase of theupper limit of the temperature seen by the specimens.The presence of two types of SRO reflections ( 1 1=2 0f gand 1/3{220} in Figure 6) appears to have contributedto the sharp increase in resistivity, which peaked around858 K (585 �C). Relatively strong superlattice reflectionsat 1/3{220} positions could be seen at this temperature.The SAED patterns obtained from samples quenched at903 K and 944 K (630 �C and 671 �C) temperatures(regime III) showed strong superlattice reflections cor-responding to the LRO state (1/3{220} positions only),and its intensity was maximum at 944 K (671 �C) (nearto the lowest value of resistance in the regime III). DFimages taken with 1/3{220} reflections (Figure 7) alsoconfirmed that the size as well as the number density ofordered particles was maximum at 944 K (671 �C).Beyond this temperature (regime IV), the resistanceincreased again with the increase of temperature. Theintensity of the 1/3{220} superlattice reflections alsoexhibited a decreasing trend with an increase of tem-perature, as evidenced from the samples heated to 981 Kand 1020 K (708 �C and 747 �C) (Figure 6). The DFmicrograph also confirmed that the size and numberdensity of ordered domains decreased (Figure 7(d))compared to that seen in the specimen heated to944 K (671 �C) (Figure 7(c)). From this observation, itwas concluded that the increase in resistance in regimeIV was due to the progressive dissolution of the orderedprecipitates formed in regime III. The SAED patterntaken from the end of regime IV and beginning of regionV (i.e., 1051 K (778 �C)) revealed that the 1/3{220}superlattice reflection became diffuse with the simulta-neous appearance of 1 1=2 0f g reflections, and thispattern is very similar to that seen at 818 K (545 �C).This indicated that the transformation is reverting backto the state seen in the solution-treated case. Thesmall dip above 1051 K (778 �C) in region V (Figure 2)could be due to further reduction in intensity of diffuse1/3{220} reflections with the increase of temperature.An attempt was made to quantify the progress of
short-range and long-range ordering during isochronal
Fig. 4—Plot of temperature vs heating rate to determine the isother-mal transformation temperature.
METALLURGICAL AND MATERIALS TRANSACTIONS A VOLUME 43A, SEPTEMBER 2012—3081
Fig. 5—Microstructure in the solution-treated condition: (a) bright-field micrograph in [001], (b) corresponding SAED pattern and its simulatedpattern, and (c) SAED pattern in [112] zone axis and its simulated pattern.
Fig. 6—Microstructural correlation at different stages of the resistivity profile during the heating run of Ni2(Cr0.5Mo0.5) alloy. The central figurerepresents the resistivity profile during the isochronal run, and the figures around it represent the corresponding SAED patterns in [001] and[112] zone axes.
3082—VOLUME 43A, SEPTEMBER 2012 METALLURGICAL AND MATERIALS TRANSACTIONS A
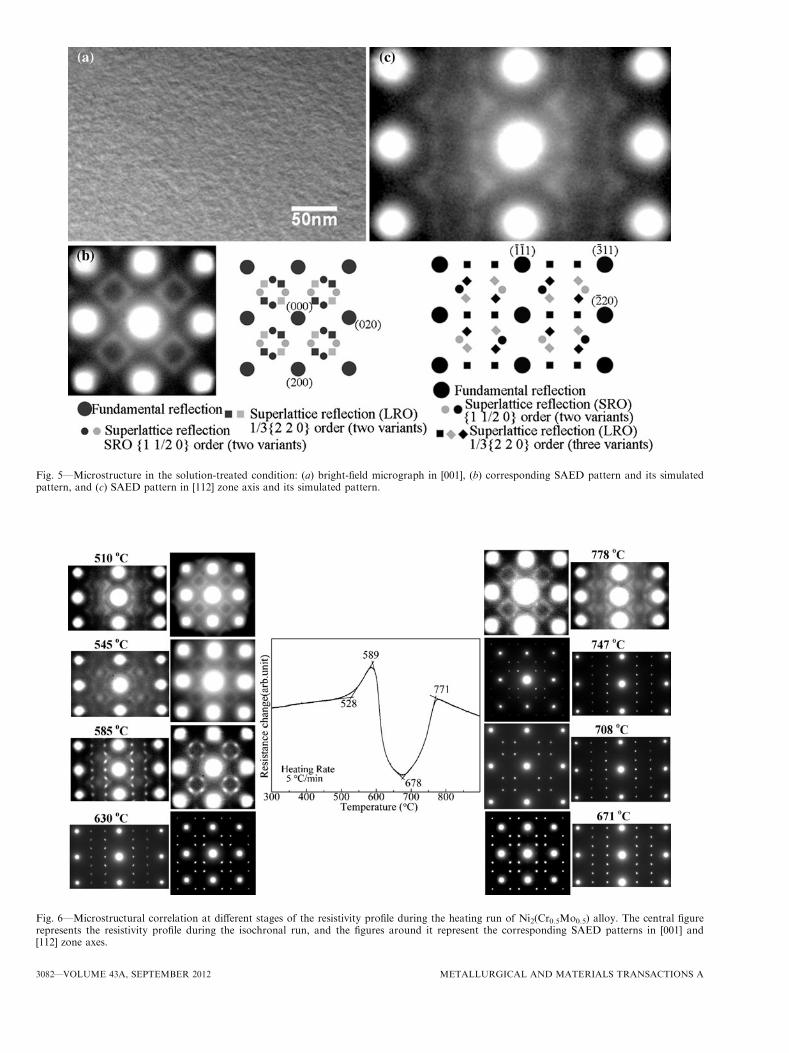
heating from the superlattice reflections in the diffrac-tion patterns. This was done by determining theintensity of superlattice spots of SRO (1 ½ 0) andLRO (1/3(220)) from the [001] SAED patterns ofsamples quenched at different stages of resistivity profile(Figure 6), recorded on ditabis image plates, in thefollowing way. The intensity profile of superlatticereflections was first determined along a line passingthrough the reciprocal lattice points. In order tocompare the data corresponding to different thicknessesand volumes (decided by area under the SAED aper-ture) of samples, the intensity of the spots in eachdiffraction pattern were proportionately increased sothat the central transmitted beam in the diffractionpattern from all samples has the same intensity with thesame full-width at half-maxima. The intensity of SROand LRO spots estimated in the normalized patternswas taken as a measure of progress of ordering in SROand LRO states. The change in the intensity of thesuperlattice spots in [001] zone axis as a function oftemperature (heating rate 5 K/min (5 �C/min)) is shownin Figure 8. It is clear from the figure that the intensityLRO spots do not increase appreciably up to 858 K(585 �C), and thereafter, they increase very sharply toreach a maximum at 944 K (671 �C), followed by anearly equal decrease in intensity. The intensity of theSRO spots also exhibited a decreasing trend in thetemperature range from 783 K to 858 K (510�C to
585 �C) (shown as inset in Figure 8). These observationswere consistent with the resistivity data.
IV. DISCUSSION
A. Microstructure Evolution
The TEM results on isochronally heated specimenspresented in the last section clearly established the factthat the transformation to LRO proceeds from 1 1=2 0f gSRO to SRO of long-range ordered Ni2(Cr, Mo) phase(Pt2Mo structure) in the alloy. This study also showedthat the transformation from LRO to SRO at just abovethe disordering temperature (1051 K (778 �C)) followsthe reverse path (Figure 6) (i.e., from LRO to SRO ofLRO to 1 1=2 0f g SRO). The 1 1=2 0f g SRO in thesolution-treated alloy develops as the instability tem-perature is crossed during the quench. The generation of1 1=2 0f g SRO in Ni-base alloys was attributed to
ordering of Ni and Mo atoms on {420} planes in thesequence …NiNiMoMoNiNi… in the fcc matrix, asshown in Figure 1. The presence of all 1 1=2 0f g (SRO)superlattice spots (observed in different orientations ofcrystals) in the as-quenched state suggests the existenceof all variants of 1 1=2 0f g waves in the area sampled in adiffraction pattern. The observation of faint reflectionsat 1/3{220} positions connected with streaking in 100h iand 112h i zone axes in the solution-treated state of thealloy, as well as at lower temperatures (below 858 K(585 �C)) during isochronal heating, indicated that thesubunit cell of the ordered Ni2(Cr, Mo) phase or, inother words, the SRO of long-range ordered structure ispresent already in the sample. The formation of thesubunit cell and its diffraction effects in Ni2Mo alloyswas well established by Kulkarni[30] on the basis ofMonte Carlo simulations. The weakening of the inten-sity at 1 1=2 0f g positions and the corresponding increasein SRO intensity at 1/3{220} positions prior to the LROtransition shown in Figure 6 (at 858 K (585 �C)) indi-cated the growth of the subunit cells of SRO of LROat the expense of 1 1=2 0f g SRO. The diffuse nature of the
Fig. 7—Microstructural investigation on resistivity quenched speci-mens at different temperatures: (a) BF with [001] at 818 K (545 �C),(b) DF with LRO reflection in [001] at 904 K (630 �C), (c) DF withLRO reflection in [001] at 944 K (671 �C), and (d) DF with LROreflection in [001] at 1020 K (747 �C).
Fig. 8—Plot shows variation of intensity of the LRO and SRO spotsobtained from the SAED in the [001] zone axis with temperature onthe resistivity quenched samples.
METALLURGICAL AND MATERIALS TRANSACTIONS A VOLUME 43A, SEPTEMBER 2012—3083
1/3{220} reflections even at 858 K (585 �C) and thepresence of diffracted intensity linking the 1 1=2 0f g SROreflections with those at 1/3{220} positions at interme-diate times and aging temperatures indicated the con-tinuous change of diffracted intensity from SRO to LRO(Figure 6). A similar observation of the continuouschange of intensity linking the 1 1=2 0f g SRO spot to the1/3{220} spot in SAED patterns were made earlier byKumar and Vasudevan[9] in ternary Ni-17 at pct Mo-9.5at pct Cr alloy using TEM at intermediate agingtemperatures of 823 K to 973 K (550 �C to 700 �C),and they have attributed it to the continuous manner ofordering. Hence, it is reasonable to assume that such amode of transformation takes place in this alloy systemas well. The fact that the ordered microdomains couldnot be resolved at this temperature further support thecontinuous nature of this transition. The LRO statestarted developing beyond this stage with an increase inthe intensity of the LRO spots shown in Figure 6. Thiscould be the result of the favorable kinetics of transfor-mation in regime III (Figure 2) where the orderedprecipitates grew in size and their volume fractionincreased up to 944 K (671 �C). The volume fractionand the size of the particle were found to decrease, witha further increase of temperature, with complete disap-pearance of LRO occurring at 1062 K (789 �C), asindicated by the sharp decrease in intensity of the LROspots in the regime IV. The disappearance of the distinctLRO superlattice spots and the reappearance of 1 1=2 0f gSRO and SRO of the LRO (1/3 {220}) spots in regime Vagain suggested that the system did not reach completedisordered state after the dissolution of the LRO phase,which was also reflected in the continuous decrease inthe resistivity in regime V after the dissolution of LRO.
B. Correlation with Resistivity Data
From the discussion in Section IV–A, it is clear thatdistinct ordered structure/structures evolved at differenttemperatures in the resistivity curve depicted in Fig-ure 2. The microstructural investigation clearly showedthat the initial microstructure of the solution-treatedsamples always contained an SRO structure of 1 1=2 0f gand Pt2Mo types, and this structure was retained up to783 K (510 �C). The stability of these structures isreflected by the nearly constant value of resistivity(Figure 2) as well as 1 1=2 0f g superlattice intensity (inset,Figure 8) up to this temperature. The increase inresistivity up to 858 K (585 �C) could be attributed togrowth of the SRO subunit cell of LRO at the expenseof the SRO subunit cell of 1 1=2 0f g type in regime II.This sharp rise in resistivity is not reflected as anincrease in the intensity of superlattice reflection. In fact,Ziyya and Abbas[31] also observed an isochronal resis-tivity behavior, very similar to the present observation,in AuAgPd alloys. They attributed the initial sharpincrease in resistivity to the formation of SRO phase,while attributing the subsequent drop to reduction inSRO order at higher temperatures. The presence of1 1=2 0f g SRO was attributed to the arrangement of
atoms on {420} planes of the fcc lattice in the N-N-M-Msequence, whereas Pt2Mo type SRO reflections
corresponded to the accumulation of Mo atoms on everythird {420} and {220} planes (Figure 1). On the basisof theoretical calculations, Richter and Schubert[21]
reported that short-range ordering in AB alloy causesa decrease in resistivity, whereas clustering causes anincrease in the resistivity compared with the completestochastic state. There is evidence in the literature for theexhibition of reverse behavior as well.[22,23] Richter andSchubert[21] showed that short-range ordering causes apositive temperature coefficient of resistivity, whereasclustering causes a negative temperature coefficient ofresistivity. It is not unreasonable to assume that the1 1=2 0f g SRO and SRO of LRO in the present alloy
correspond to clustering and ordering considered byRichter and Schubert[21] since there is an increase inconcentration of Mo in 1 1=2 0f g state compared toaverage composition while in SRO of LRO the atomsstart to occupy specific positions in unit cell of LROleading to more unlike bonds though the concentrationremains the same as average value. If it is assumed thatthis system behaves similar to the alloy system asRichter and Schubert[21] has considered, it can beconcluded that increase in the resistivity in the regimeII is due to the combined effect of development of SROstate of long-range ordered state and decay of 1 1=2 0f gSRO of N2M2 cluster structure. On the basis of the sameassumption, the decrease in resistance above the LROdissolution temperature could be attributed to theformation of 1 1=2 0f g SRO (regime V in Figure 6).These observations indicate that the structural changesduring the initial stages in this alloy behave similarlyto the ordering process considered by Richter andSchubert.[21] At temperatures above 858 K (585 �C), thedecrease in resistivity could be attributed to the forma-tion as well as the increase in volume fraction of LRO ofNi2(Cr, Mo) phase up to 944 K (671 �C), as evidencedby the TEM results in Figure 6. The increase inresistivity beyond 944 K (671 �C) matches the decreasein number density as well as size of Ni2(Cr, Mo) LROparticles.In the present discussion, the resistivity variation on
isochronal heating was explained solely on the basis ofcompositional ordering/clustering. The phonon scatter-ing effects that generally increase with temperature wereignored. In fact, many of the experimental observationson resistivity changes close to ordering temperature inFe3Al, FeCo, and b CuZn were satisfactorily explainedin the literature often on the assumption that thephonon contribution is negligible compared to orderingeffects.[22] The present observation on resistivity changesappears to justify the previous explanation based onlyon chemical ordering changes. Another important resultof this study is the determination of the criticaltemperatures for the onset, the maximum, and thedisappearance of long-range ordering. Isochronal datawere used to determine the temperatures for theisothermal case following the procedure employed todetermine the isothermal transformation temperaturefrom DSC measurements. The disappearance/solvustemperature determined by this procedure in this alloymatched reasonably well with the value obtained fromDSC measurements.[16]
3084—VOLUME 43A, SEPTEMBER 2012 METALLURGICAL AND MATERIALS TRANSACTIONS A
V. CONCLUSIONS
In summary, the transformation from disordered stateto ordered state was studied using the resistivity mea-surement method uniquely coupled with TEM. Thecomplete thermal path of the resistivity profile duringisochronal heating was correlated with the microstruc-tural change. The combination of two techniques wasused to determine the SRO to LRO transition tempera-ture, precipitate dissolution start temperature, and crit-ical temperature. The combination of the two methodsleads to the conclusion that SRO to LRO transition orvice versa is always through the short-range ordered state.
ACKNOWLEDGMENTS
The authors thank Dr. J.K. Chakaravartty, HeadMMD, and Dr. A.K. Suri, Director Materials Group,Bhabha Atomic Research Centre, for their continuoussupport, encouragement, and keen interest in thework. A part of this work was carried out as a collab-orative research work under a general memorandumof understanding between Bhabha Atomic ResearchCenter, Mumbai and HZB, Berlin. One of the authors(AV) would like to acknowledge HZB for financialgrant received during his stay at HZB. The authorsextend a special thanks to Dr. Christian Abromeit forvaluable discussion. In addition, the technical assis-tance provided by Leistner Claudia and ChristianeForster is gratefully appreciated.
REFERENCES1. C.T. Sims, N.S. Stoloff, and W.C. Hagel: Superalloys II, John
Wiley and Sons, New York, NY, 1987.2. M.J. Cieslak, T.J. Headley, and A.D. Romig: Metall. Trans. A,
1986, vol. 17A, pp. 2035–47.3. G.E. Gdowski: LLNL Report No UCRL-ID-108330, Lawrence
Livermore National Laboratory, Livermore, CA, Mar. 1991.
4. P.E.A. Turchi, L. Kaufman, and Z.-K. Liu: Computer Coupling ofPhase Diagrams and Thermochemistry, 2006, vol. 30, pp. 70–87.
5. H.M. Tawancy and M.O. Aboe1fotoh: Mater. Sci. Eng. A, 2009,vol. 500, pp. 188–95.
6. H.M. Tawancy and M.O. Aboe1fotoh: Scripta Mater., 2008,vol. 59, 846–49.
7. H.M. Tawancy: Metall. Trans. A, 1980, vol. 11A, pp. 1764–65.8. H.M. Tawancy, R.B. Herchenroeder, and A.I. Asphahani: J. Met.,
1983, vol. 35, pp. 37–43.9. M. Kumar and V.K. Vasudevan: Acta Mater., 1996, vol. 44,
pp. 1591–1600.10. M. Sundararaman, L. Kumar, G.E. Prasad, P. Mukhopadhyay,
and S. Banerjee: Metall. Mater. Trans. A, 1999, vol. 30A, pp. 41–52.
11. M. Raghavan, R.R. Mueller, G.A. Vaughn, and S. Floreen:Metall. Trans. A, 1984, vol. 15A, pp. 783–92.
12. E. Gozlan, M. Bamberger, S.F. Dirnfeld, B. Prinz, and J. KIodt:Mater. Sci. Eng., 1991, vol. 141A, pp. 85–95.
13. J.R. Mihalisin, C.G. Bieber, and R.T. Grant: Trans. AIME, 1968,vol. 242, pp. 2399–2414.
14. L. Karmazin, J. Krejcı, and J. Zeman: Mater. Sci. Eng., 1994,vol. 183A, pp. 103–09.
15. L. Karmazin: Mater. Sci. Eng., 1982, vol. 54, pp. 247–56.16. H.C. Pai, M. Sundararaman, B.C. Maji, A. Biswas, and M.
Krishnan: J. Alloys Compd., 2010, vol. 491, pp. 159–64.17. J. Soltys, R. Kozubski, and A. Michalek: Mater. Sci. Eng., 1989,
vol. A117, pp. L17–L19.18. R.J. White and K.M. Miller: J. Nucl. Mater., 1977, vol. 66,
pp. 101–06.19. E. Lang: Mater. Sci. Eng., 1989, vol. All4, pp. 147–57.20. K. Binder and D. Stauffer: Z. Phys. B, 1976, vol. 24, pp. 407–15.21. J. Richter and G. Schubert: Physica Status Solidi (b), 1983,
vol. 116, pp. 597–605.22. P.L. Rossiter: J. Phys. F: Met. Phys., 1980, vol. 10, pp. 1787–93.23. W. Pfeiler: Acta Metall., 1988, vol. 36, pp. 2417–34.24. R. Caudrona, M. Sarfati, M. Barrachin, A. Finel, and F. Solal:
Physica B, 1992, vols. 180–181, pp. 822–24.25. H.C. Pai: Ph.D. Thesis, Mumbai University, Mumbai, June 2008.26. S. Banerjee, U.D. Kulkarni, and K. Urban: Acta Metall., 1989,
vol. 37, pp. 35–48.27. U.D. Kulkarni, G.K. Dey, and S. Banerjee: Scripta Metall., 1988,
vol. 22, pp. 437–40.28. U.D. Kulkarni and S. Banerjee: Acta Metall., 1988, vol. 36,
pp. 413–24.29. A. Arya, G.K. Dey, V.K. Vasudevan, and S. Banerjee: Acta
Mater., 2002, vol. 50, pp. 3301–15.30. U.D. Kulkarni: Acta Mater., 2004, vol. 52, pp. 2721–32.31. A.B. Ziya and T Abbas: J. Alloys Compd., 2000, vol. 312,
pp. 130–34.
METALLURGICAL AND MATERIALS TRANSACTIONS A VOLUME 43A, SEPTEMBER 2012—3085