Resistivity imaging in steep and weathered terrains Mendoza, Alfredo; Dahlin, Torleif Published in: Near Surface Geophysics 2008 Link to publication Citation for published version (APA): Mendoza, A., & Dahlin, T. (2008). Resistivity imaging in steep and weathered terrains. Near Surface Geophysics, 6(2), 105-112. Total number of authors: 2 General rights Unless other specific re-use rights are stated the following general rights apply: Copyright and moral rights for the publications made accessible in the public portal are retained by the authors and/or other copyright owners and it is a condition of accessing publications that users recognise and abide by the legal requirements associated with these rights. • Users may download and print one copy of any publication from the public portal for the purpose of private study or research. • You may not further distribute the material or use it for any profit-making activity or commercial gain • You may freely distribute the URL identifying the publication in the public portal Read more about Creative commons licenses: https://creativecommons.org/licenses/ Take down policy If you believe that this document breaches copyright please contact us providing details, and we will remove access to the work immediately and investigate your claim.
Transcript
LUND UNIVERSITY
PO Box 117221 00 Lund+46 46-222 00 00
Resistivity imaging in steep and weathered terrains
Mendoza, Alfredo; Dahlin, Torleif
Published in:Near Surface Geophysics
2008
Link to publication
Citation for published version (APA):Mendoza, A., & Dahlin, T. (2008). Resistivity imaging in steep and weathered terrains. Near SurfaceGeophysics, 6(2), 105-112.
Total number of authors:2
General rightsUnless other specific re-use rights are stated the following general rights apply:Copyright and moral rights for the publications made accessible in the public portal are retained by the authorsand/or other copyright owners and it is a condition of accessing publications that users recognise and abide by thelegal requirements associated with these rights. • Users may download and print one copy of any publication from the public portal for the purpose of private studyor research. • You may not further distribute the material or use it for any profit-making activity or commercial gain • You may freely distribute the URL identifying the publication in the public portal
Read more about Creative commons licenses: https://creativecommons.org/licenses/Take down policyIf you believe that this document breaches copyright please contact us providing details, and we will removeaccess to the work immediately and investigate your claim.
In areas where tectonics and weathering have hydrogeological significance, electrical methods can assist in mapping the subsurface. In this work, resistivity imaging was used to map fractures, faults and quartz veins emplaced in strongly weathered volcanic rocks. The aim was to map geological units related to the formation of groundwater systems in the Río Artiguas basin, Nicaragua. Eight 2D resistivity surveys selected from two sites with characteristic geological features are discussed in this article. The resistivity lines were carried out with a multi-electrode system together with dif-ferent electrode geometries. The data inversion was done by applying the robust (L1-norm) method and a finite element grid to accommodate the steep topography. The data interpretation included numerical modelling to assess the suitability of all used electrode arrays in relation to the expected geological settings. The results indicated a top high resistive layer consisting of colluviums with laterite (>50 Ω m), underlain by conductive clay weathered layers (10–50 Ω m). Below the conduc-tive layer less weathered or fresh rock can be found with higher values (50–600 Ω m). The quartz veins and dykes stand out as the highest resistive bodies (100–4000 Ω m). The results indicated an overall weathering thickness of 10–30 m or more. In conclusion, the extensive resistivity imaging surveys allowed delineation of geological structures and weathering layers throughout the study area. Furthermore, the vertical extension of weathering was examined at all locations. A finite ele-ment grid in the inversion prevented distortions arising from topography regardless of the steep slope observed at the survey locations. The numerical modelling results revealed the strengths of different arrays for the particular cases of a fault and a quartz vein in irregular terrains.
Resistivity imaging in steep and weathered terrains
J.A. Mendoza1* and T. Dahlin2
1 Centro de Investigaciones Geocientíficas, Universidad Nacional Autónoma de Nicaragua, Apartado Postal E-1 Managua, Nicaragua
Received May 2007, revision accepted November 2007
ods can also be used to map weathering areas, as distinctive contrast should be observed when fresh rock is reached. The weathering response to electrical methods has been examined in previous research (Palacky and Kadekaru 1979; Doyle and Lindeman 1985; Timms and Acworth 2002; Kellett and Bauman 2004), including the relationship between silica content in weathered rocks and high resistivity responses (Barongo and Palacky 1991). As there is lateral resistivity heterogeneity com-monly associated to weathering layers, the use of 2D resistivity imaging has been suggested (Ritz et al. 1999). For 2D resistivity imaging diverse data collection geometries can be formulated, depending on the aims of the investigation, the target’s expected dimensions and shape and logistical con-strains. The most used arrays include Wenner, Schlumberger, pole-pole, dipole-dipole and traditional gradient. The applicabil-ity of the latter array to different geological structures has been evaluated in earlier studies (Schulz 1985; Shettigara and Adams 1989; Furness 1993). Recently, Dahlin and Zhou (2004) have shown the suitability of the multiple gradient array for multi-electrode surveys. However, in mountainous regions the lateral surface irregu-larities and high slopes can affect geoelectric surveys regardless
INTRODUCTIONResistivity imaging is an effective method for hydrogeological investigations. When applying this method, the target is not groundwater itself but rather geological materials and structures that can store and transmit groundwater. The reliability of the method has increased since the 1990s due to developments in data acquisition techniques (Dahlin 2001; Pellerin 2002), inter-pretation techniques (Loke and Barker 1996) and computer technology. As a result, the mapping of complex and small-scale geological features has become more precise and efficient (Kemna et al. 2000; Sandberg et al. 2002). In areas where tectonics and weathering have hydrogeologi-cal significance, electrical methods can assist in mapping the subsurface. Resistivity soundings and profiling surveys over conductive and resistive intrusive bodies have been reported in several studies (Apparao and Roy 1973; Verma and Bandyopadhyay 1983; Batayneh 2001). Furthermore, automated resistivity surveying has been carried out over dykes and frac-tures (Dahlin 1996; Seaton and Burbey 2002). Electrical meth-
of the used array. The changes in topography cause distortions of the measured potential field that lead to terrain anomalies (Pous et al. 1996; Tsourlos et al. 1999). These topography effects can be accounted for by integrating altitude data in a finite element grid used for the inversion. The objective of this research was to map geological materi-als and structures related to the formation of groundwater sys-tems in the steep-topography basin of Río Artiguas, in central Nicaragua. Resistivity imaging was used to map fractures, faults and quartz veins emplaced in strongly weathered volcanic rocks. This paper highlights the effectiveness of resistivity imaging for mapping dykes and faults in weathered terrains as well as the importance of considering topography when surveying in areas with dramatic changes in topography. In total, forty-four 2D resistivity surveys were performed at hydrogeologically relevant locations of the Rio Artiguas (Sucio) basin (Fig. 1). Eight resistivity lines are presented here as they represent typical responses from the geological materials and structures in the area. To reinforce the field data interpretation, the used electrode arrays were tested against synthetic models of geological units expected to occur in the area. However, carrying out a compre-hensive comparison between electrode arrays was not the pur-pose of this work. The investigations were carried out within the framework of a multi disciplinary research and training programme, funded by the Swedish International Development Authority (Sida/SAREC), with the aim of mapping groundwater systems in an area con-taminated by mining activities.
HYDROGEOLOGICAL SETTING - AREA DESCRIPTIONThe Rio Artiguas basin is located eastwards of the central high-lands of Nicaragua. This basin has experienced a century of gold mining using the mercury method. This method involves the mixing of Hg with a mineral fraction, which produces dense Hg-Au amalgam grains that are later roasted to separate Hg and obtain a pure form of gold (Lechler et al. 2000). A weather sta-tion located in the basin reports temperatures between 17°C and 28°C. Historic average precipitations of circa 2400 mm/yr have been recorded in the area. The young drainage system for surface waters has developed under a structural control where faults, fractures and joints lead to a rectangular flow pattern. The topog-raphy is rough with steep hills and valleys: the slopes are more than 10% and up to 45%. Southwards, in the basin lowlands the relief is less abrupt (see Fig. 1). Geologically, most of the Río Sucio basin is covered by Tertiary volcanic rocks, mainly basalts and andesites lava flows. These lava flows are overlying older rhyolitic-dacitic pyroclastic flows towards the south of the area. There are gold bearing quartz veins embedded in these basalts and andesites lava flows, surrounded by hydrothermal alteration aureoles with a high silica content. More acid rock types are found as plugs intruding into
the basalts and andesites flows (Hodgson 1972; Darce 1990; Ehrenborg 1996). The tectonic development and thereby associated fracturing, hydrothermal processes and secondary alteration of veins control groundwater infiltration, occurrence and flow in the area (Mendoza et al. 2005). Complementarily, the weathering proc-esses facilitate infiltration and water transport in the uppermost surface cover (Fig. 2). With regard to the hundreds-of-metres of thick lava flow covering the area, no major aquifers are expected to occur but rather shallow and locally delimitated aquifers in valleys and other depressions (Mendoza 2002).
FIELD DATA AND INTERPRETATIONData acquisition and processing procedureIn the field, the ABEM Lund Imaging System (Dahlin 1996) was used with different layouts. The system is based on the automa-tion of the collection, processing and presentation of resistivity
FIGURE 1
Top panel, the study area and its surface geology. Bottom panel, the
geomorphology indicating the terrain roughness. Inserted location map
in Nicaragua. NIC: Nicaragua, H: Honduras, CR: Costa Rica, PO: Pacific
Ocean, CS: Caribbean Sea.
Resistivity imaging in steep and weathered terrains 107
data. The data collection was performed by using a roll along technique where cables are moved upwards or downwards along a succession of stations. Additionally, GPS receivers and survey-ing instrumentation were used for the precise positioning of the profiles and electrodes. The main geological targets under investigation were those associated with groundwater occurrence in the area. Rock types, fractures, streams or springs in the surroundings were important aspects taken into consideration in selecting the locations for the resistivity lines. It was also important to gather information on the geology in situ, which was made by documenting the ground lithology and observations in shafts, when possible. Initially, the arrays used were Wenner (electrode spacings a = 2–48), dipole-dipole (a = 2–12, n = 1–6) and pole-dipole (a = 2–20, n = 1–5). During the last part of the field activities, late developments allowed the use of a multiple gradient array (a = 1–8, n = -4–4 and s = 8), where s is the maximum number of potential readings for a current injection as described by Dahlin and Zhou (2006). As it was important to obtain information about the resistivity distribution in the near sub surface, the selected electrode spac-ing was mostly 1 m, 2 m and 5 m, depending on the target being investigated. Vegetation and anthropogenic activities had to be taken into account to decide where to put the lines. The inversion was performed using the RES2DINV algorithm (Loke 1997). The interpretation of the 2D resistivity data was performed by using the robust (L1-norm) inversion method, which minimizes the absolute differences between measured and calculated apparent resistivity values (Loke et al. 2003). This is an appropriate method for interpreting data from areas where subsurface regions separated by sharp boundaries are expected. Furthermore, a finite element grid was used in the data inversion, as including the topography was necessary for the precise rela-tion of the object’s position in space along the survey lines. The depth range of the inverted models was determined by the inver-sion software, based on the range of the median depth of investi-
gation of the apparent resistivity data sets. After processing the data, the final results were prepared for presentation by setting a resistivity scale that suited the expected geological features for each site investigated.
Modelling procedureNumerical modelling was employed to assess the suitability of selected electrode arrays in relation to the expected geological settings. Two models consisting of 81 electrodes with 1 m elec-trode spacing were tested. They simulated a) a dyke embedded in low resistive clay and b) a vertical fault displacing low-resistive blocks. The resistivities used for the different geological materi-als were based on resistivity imaging results over outcropping features in the field, plus direct measurements on the different geological materials in, for example, cuts and mine shafts using a miniature Wenner array (Mendoza et al. 2005). The apparent resistivities of the models were calculated using electrode configurations identical to those used in field. Moreover, field topography was incorporated into the models before calcu-lation of the apparent resistivity values. The maximum slope along the vein model was 30° and the maximum slope along the fault model was 17°. The forward response data was computed using the forward modelling program RES2DMOD (Loke and
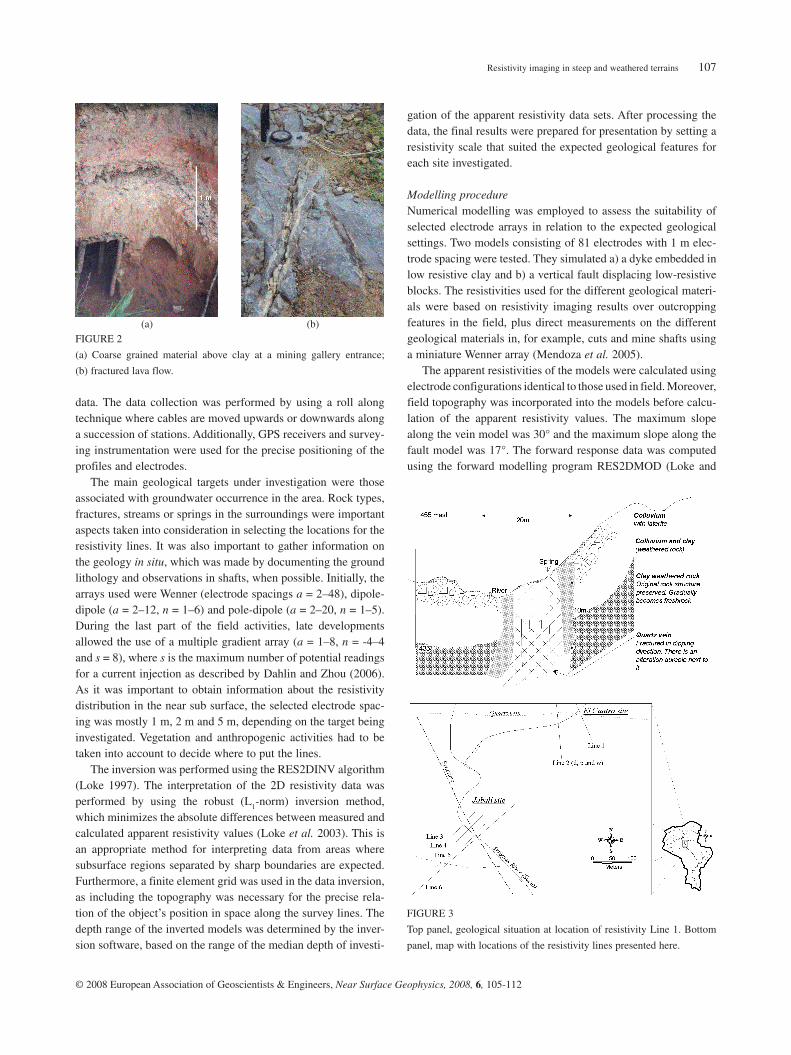
FIGURE 2
(a) Coarse grained material above clay at a mining gallery entrance;
(b) fractured lava flow.
FIGURE 3
Top panel, geological situation at location of resistivity Line 1. Bottom
panel, map with locations of the resistivity lines presented here.
Baker 1996) and the inversion of the synthetic modelling data was performed in the same way as with the field data. The data were processed without adding noise. The models are presented together with results in the following sections. The inversion of the apparent resistivities was carried out incorporating the topog-raphy in the inverted model. However, in order to assess the
effects of omitting the topography, the data were also inverted without including the altitude of the electrodes.
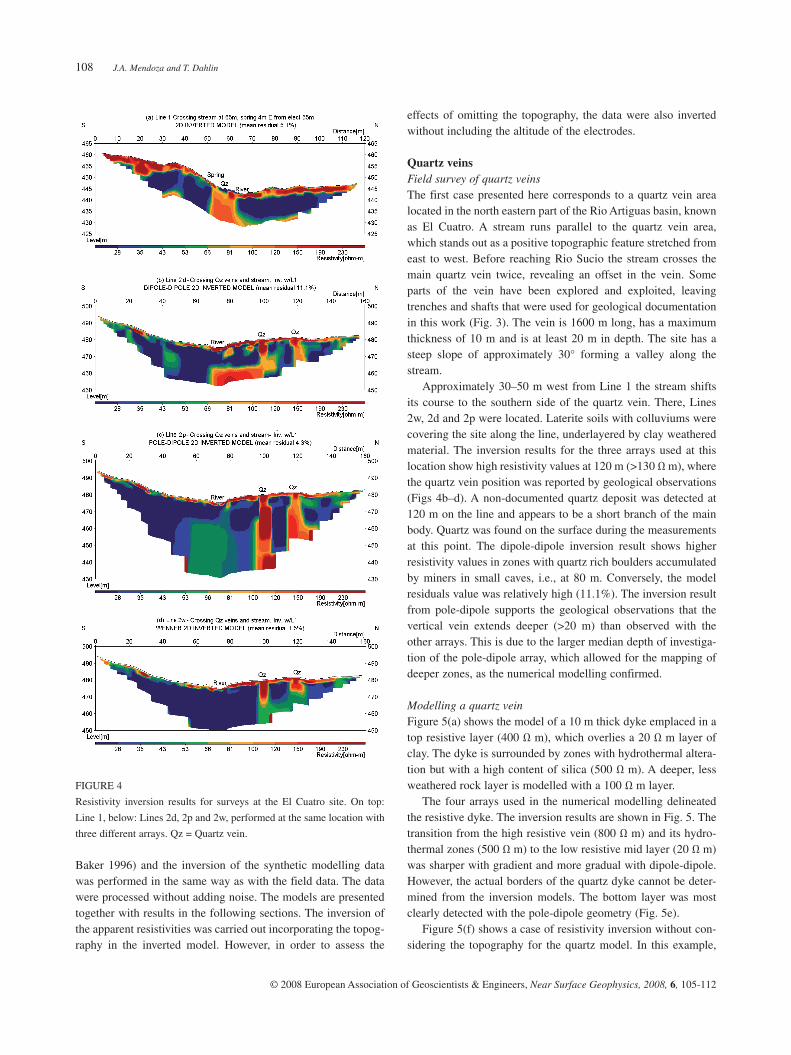
Quartz veinsField survey of quartz veinsThe first case presented here corresponds to a quartz vein area located in the north eastern part of the Rio Artiguas basin, known as El Cuatro. A stream runs parallel to the quartz vein area, which stands out as a positive topographic feature stretched from east to west. Before reaching Rio Sucio the stream crosses the main quartz vein twice, revealing an offset in the vein. Some parts of the vein have been explored and exploited, leaving trenches and shafts that were used for geological documentation in this work (Fig. 3). The vein is 1600 m long, has a maximum thickness of 10 m and is at least 20 m in depth. The site has a steep slope of approximately 30° forming a valley along the stream. Approximately 30–50 m west from Line 1 the stream shifts its course to the southern side of the quartz vein. There, Lines 2w, 2d and 2p were located. Laterite soils with colluviums were covering the site along the line, underlayered by clay weathered material. The inversion results for the three arrays used at this location show high resistivity values at 120 m (>130 Ω m), where the quartz vein position was reported by geological observations (Figs 4b–d). A non-documented quartz deposit was detected at 120 m on the line and appears to be a short branch of the main body. Quartz was found on the surface during the measurements at this point. The dipole-dipole inversion result shows higher resistivity values in zones with quartz rich boulders accumulated by miners in small caves, i.e., at 80 m. Conversely, the model residuals value was relatively high (11.1%). The inversion result from pole-dipole supports the geological observations that the vertical vein extends deeper (>20 m) than observed with the other arrays. This is due to the larger median depth of investiga-tion of the pole-dipole array, which allowed for the mapping of deeper zones, as the numerical modelling confirmed.
Modelling a quartz veinFigure 5(a) shows the model of a 10 m thick dyke emplaced in a top resistive layer (400 Ω m), which overlies a 20 Ω m layer of clay. The dyke is surrounded by zones with hydrothermal altera-tion but with a high content of silica (500 Ω m). A deeper, less weathered rock layer is modelled with a 100 Ω m layer. The four arrays used in the numerical modelling delineated the resistive dyke. The inversion results are shown in Fig. 5. The transition from the high resistive vein (800 Ω m) and its hydro-thermal zones (500 Ω m) to the low resistive mid layer (20 Ω m) was sharper with gradient and more gradual with dipole-dipole. However, the actual borders of the quartz dyke cannot be deter-mined from the inversion models. The bottom layer was most clearly detected with the pole-dipole geometry (Fig. 5e). Figure 5(f) shows a case of resistivity inversion without con-sidering the topography for the quartz model. In this example,
FIGURE 4
Resistivity inversion results for surveys at the El Cuatro site. On top:
Line 1, below: Lines 2d, 2p and 2w, performed at the same location with
three different arrays. Qz = Quartz vein.
Resistivity imaging in steep and weathered terrains 109
pole-dipole presented most distortions derived from the terrain changes as inversion results in an artificial widening of the quartz vein with depth. It is also noteworthy that the model residuals are much higher for the inversion without topography, showing an inability to fit the inverted model to the apparent resistivity data. For the other arrays, Wenner and gradient were less affected, fol-lowed by dipole-dipole.
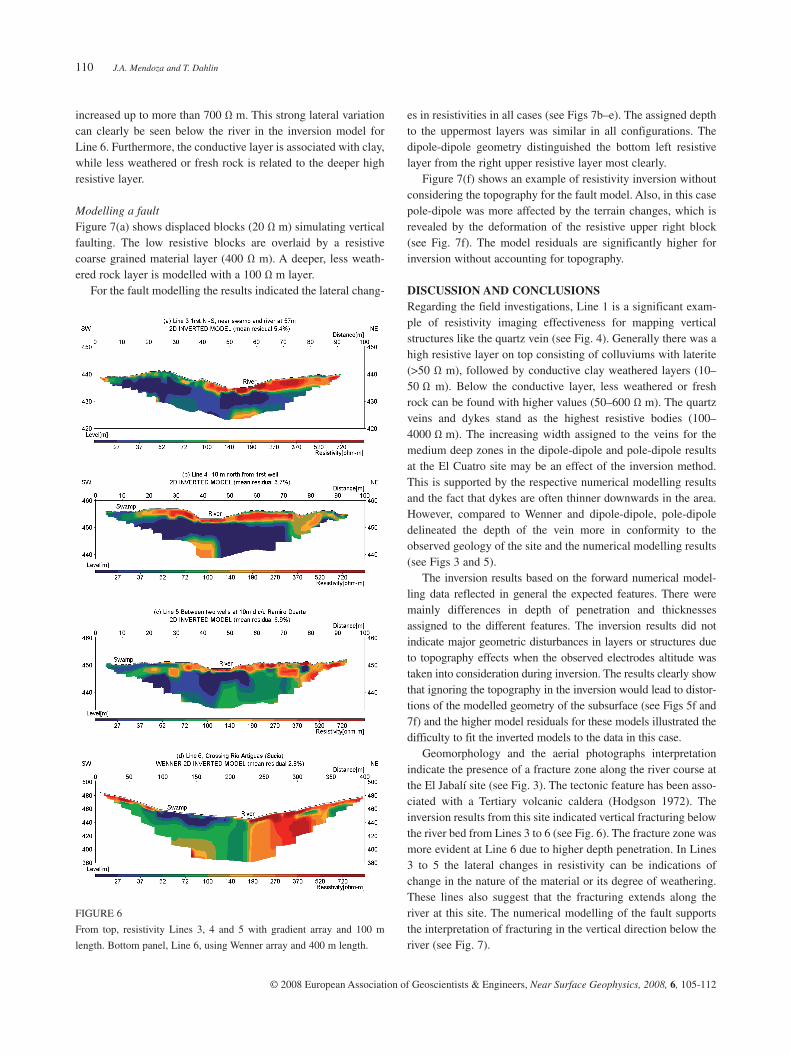
FracturesField survey of a faultFour resistivity lines were placed perpendicular to the Río Artiguas at the El Jabalí site (see Fig. 3). In this case the aim was to investigate the presence of fracturing and faulting below the
river and understand the subsurface conditions near the river. Gradient array was used for Lines 3–5 with 1 m electrode spac-ing and 100 m length. These lines were set parallel at a 10 m distance from each other. For Line 6, the Wenner array was used with 5 m electrode spacing and 400 m total length. The inversion results for Lines 3–6 are presented in Fig. 6. The inversion models indicate the presence of a 3–7 m thick high resistive layer on top. Below that layer the resistivity decreases in a 10 m thick layer and increases again after 15 m depth. The clay content in a swamp located next to the river has a clear effect on decreasing the resistivity as shown at 10 m on Line 5 and at 110 m on Line 6. The deep high resistive zones cover the entire section after the lines cross the river, where the resistivity
FIGURE 5
a) The model of a quartz vein, b–e) numerical modelling inversion results with gradient, Wenner, dipole-dipole and pole-dipole and f) inversion without
increased up to more than 700 Ω m. This strong lateral variation can clearly be seen below the river in the inversion model for Line 6. Furthermore, the conductive layer is associated with clay, while less weathered or fresh rock is related to the deeper high resistive layer.
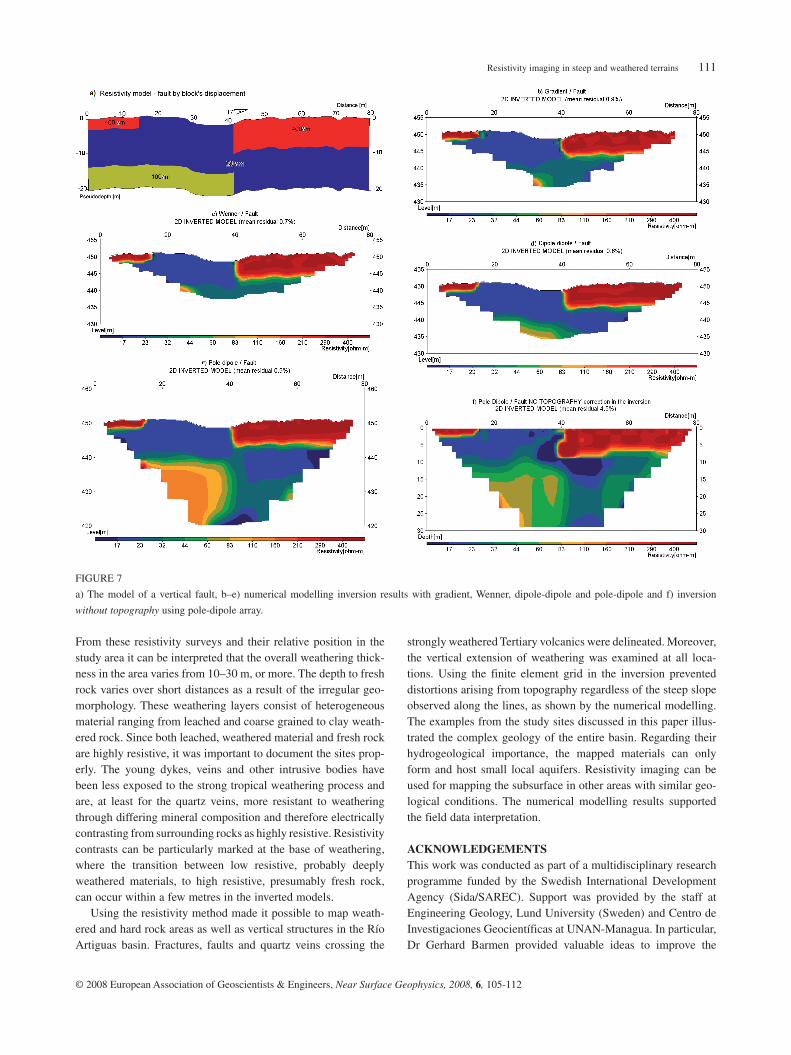
Modelling a faultFigure 7(a) shows displaced blocks (20 Ω m) simulating vertical faulting. The low resistive blocks are overlaid by a resistive coarse grained material layer (400 Ω m). A deeper, less weath-ered rock layer is modelled with a 100 Ω m layer. For the fault modelling the results indicated the lateral chang-
es in resistivities in all cases (see Figs 7b–e). The assigned depth to the uppermost layers was similar in all configurations. The dipole-dipole geometry distinguished the bottom left resistive layer from the right upper resistive layer most clearly. Figure 7(f) shows an example of resistivity inversion without considering the topography for the fault model. Also, in this case pole-dipole was more affected by the terrain changes, which is revealed by the deformation of the resistive upper right block (see Fig. 7f). The model residuals are significantly higher for inversion without accounting for topography.
DISCUSSION AND CONCLUSIONSRegarding the field investigations, Line 1 is a significant exam-ple of resistivity imaging effectiveness for mapping vertical structures like the quartz vein (see Fig. 4). Generally there was a high resistive layer on top consisting of colluviums with laterite (>50 Ω m), followed by conductive clay weathered layers (10–50 Ω m). Below the conductive layer, less weathered or fresh rock can be found with higher values (50–600 Ω m). The quartz veins and dykes stand as the highest resistive bodies (100–4000 Ω m). The increasing width assigned to the veins for the medium deep zones in the dipole-dipole and pole-dipole results at the El Cuatro site may be an effect of the inversion method. This is supported by the respective numerical modelling results and the fact that dykes are often thinner downwards in the area. However, compared to Wenner and dipole-dipole, pole-dipole delineated the depth of the vein more in conformity to the observed geology of the site and the numerical modelling results (see Figs 3 and 5). The inversion results based on the forward numerical model-ling data reflected in general the expected features. There were mainly differences in depth of penetration and thicknesses assigned to the different features. The inversion results did not indicate major geometric disturbances in layers or structures due to topography effects when the observed electrodes altitude was taken into consideration during inversion. The results clearly show that ignoring the topography in the inversion would lead to distor-tions of the modelled geometry of the subsurface (see Figs 5f and 7f) and the higher model residuals for these models illustrated the difficulty to fit the inverted models to the data in this case. Geomorphology and the aerial photographs interpretation indicate the presence of a fracture zone along the river course at the El Jabalí site (see Fig. 3). The tectonic feature has been asso-ciated with a Tertiary volcanic caldera (Hodgson 1972). The inversion results from this site indicated vertical fracturing below the river bed from Lines 3 to 6 (see Fig. 6). The fracture zone was more evident at Line 6 due to higher depth penetration. In Lines 3 to 5 the lateral changes in resistivity can be indications of change in the nature of the material or its degree of weathering. These lines also suggest that the fracturing extends along the river at this site. The numerical modelling of the fault supports the interpretation of fracturing in the vertical direction below the river (see Fig. 7).
FIGURE 6
From top, resistivity Lines 3, 4 and 5 with gradient array and 100 m
length. Bottom panel, Line 6, using Wenner array and 400 m length.
Resistivity imaging in steep and weathered terrains 111
From these resistivity surveys and their relative position in the study area it can be interpreted that the overall weathering thick-ness in the area varies from 10–30 m, or more. The depth to fresh rock varies over short distances as a result of the irregular geo-morphology. These weathering layers consist of heterogeneous material ranging from leached and coarse grained to clay weath-ered rock. Since both leached, weathered material and fresh rock are highly resistive, it was important to document the sites prop-erly. The young dykes, veins and other intrusive bodies have been less exposed to the strong tropical weathering process and are, at least for the quartz veins, more resistant to weathering through differing mineral composition and therefore electrically contrasting from surrounding rocks as highly resistive. Resistivity contrasts can be particularly marked at the base of weathering, where the transition between low resistive, probably deeply weathered materials, to high resistive, presumably fresh rock, can occur within a few metres in the inverted models. Using the resistivity method made it possible to map weath-ered and hard rock areas as well as vertical structures in the Río Artiguas basin. Fractures, faults and quartz veins crossing the
strongly weathered Tertiary volcanics were delineated. Moreover, the vertical extension of weathering was examined at all loca-tions. Using the finite element grid in the inversion prevented distortions arising from topography regardless of the steep slope observed along the lines, as shown by the numerical modelling. The examples from the study sites discussed in this paper illus-trated the complex geology of the entire basin. Regarding their hydrogeological importance, the mapped materials can only form and host small local aquifers. Resistivity imaging can be used for mapping the subsurface in other areas with similar geo-logical conditions. The numerical modelling results supported the field data interpretation.
ACKNOwLEDGEMENTSThis work was conducted as part of a multidisciplinary research programme funded by the Swedish International Development Agency (Sida/SAREC). Support was provided by the staff at Engineering Geology, Lund University (Sweden) and Centro de Investigaciones Geocientíficas at UNAN-Managua. In particular, Dr Gerhard Barmen provided valuable ideas to improve the
FIGURE 7
a) The model of a vertical fault, b–e) numerical modelling inversion results with gradient, Wenner, dipole-dipole and pole-dipole and f) inversion
without topography using pole-dipole array.
J.A. Mendoza and T. Dahlin112
manuscript. Peter Jonsson, Julio Guevara and Roger Wisén assisted along different stages of this work. Families Lazo, Duarte and other local farmers allowed the surveys to be carried out despite of their hesitation towards ‘mining-like’ activities.
REFERENCESApparao A. and Roy A. 1973. Field results for direct current resistivity
profiling with two-electrode array. Geoexploration 11, 21–44.Barongo J.O. and Palacky G.J. 1991. Investigations of electrical proper-
ties of weathered layers in the Yala Area, Western Kenya, using resis-tivity soundings. Geophysics 56, 133–138.
Batayneh A.T. 2001. Resistivity imaging for near-surface resistive dyke using two-dimensional DC resistivity techniques. Journal of Applied Geophysics 48, 25–32.
Dahlin T. 1996. 2D resistivity surveying for environmental and engineer-ing applications. First Break 14, 275–283.
Dahlin T. 2001. The development of electrical imaging techniques. Computers and Geosciences 27, 1019–1029.
Dahlin T. and Zhou B. 2004. A numerical comparison of 2D resistivity imaging with 10 electrode arrays. Geophysical Prospecting 52, 379–398.
Dahlin T. and Zhou B. 2006. Multiple gradient array measurements for multi-channel 2D resistivity imaging. Near Surface Geophysics 4,113–123.
Darce M. 1990. Mineralogic alteration patterns in volcanic rocks of the La Libertad gold mining district and its surroundings, Nicaragua. Economic Geology 85, 1059–1071.
Doyle H.A. and Lindeman F.W. 1985. The effect of deep weathering on geophysical exploration in Australia – a review. Australian Journal of Earth Sciences 32, 125–135.
Ehrenborg J. 1996. A new stratigraphy for the Tertiary volcanic rocks of Nicaraguan Highlands. Geological Society of America Bulletin 108, 830–842.
Furness P. 1993. Gradient array profiles over thin resistive veins. Geo-physical Prospecting 41, 113–130.
Hodgson G. 1972. Geological map of La Libertad. Catastro e Inventario de Recursos Naturales, Managua, Nicaragua (in Spanish).
Kellett R. and Bauman P. 2004. Mapping groundwater in regolith and fractured bedrock using ground geophysics: A case study from Malawi, SE Africa. Recorder 29, 24–32
Kemna A., Binley A., Ramirez A. and Daily W. 2000. Complex resistiv-ity tomography for environmental applications. Chemical Engineering Journal 77, 11–18.
Lechler P.J., Miller J.R., Lacerda L.D., Vinson D., Bonzongo J.C., Lyons W.B. et al. 2000. Elevated mercury concentrations in soils, sediments, water and fish of the Madeira River basin, Brazilian Amazon: A func-tion of natural enrichments? The Science of the Total Environment 260, 87–96.
Loke M.H. 1997. Rapid 2D resistivity inversion using the least-squares method, Manual for RES2DINV. Geolectrical Imaging 2D and 3D.
Loke M.H., Acworth I. and Dahlin T. 2003. A comparison of smooth and blocky inversion methods in 2D electrical imaging surveys. Exploration Geophysics 34, 182–187.
Loke M.H. and Barker R.D. 1996. Rapid least-squares inversion of apparent resistivity pseudosections by a quasi-Newton method. Geophysical Prospecting 44, 131–152.
Mendoza J.A. 2002. Geophysical and Hydrogeological Investigations in the Rio Sucio Watershed, Nicaragua. Lund University. ISBN 919724060X
Mendoza J.A., Dahlin T. and Barmen G. 2005. Hydrogeological and hydrochemical features of an area polluted by heavy metals in central Nicaragua. Hydrogeology Journal 14, 1052–1059.
Palacky G.J. and Kadekaru K. 1979. Effect of tropical weathering on electrical and electromagnetic measurements. Geophysics 44, 69–88.
Pellerin L. 2002. Applications of electrical and electromagnetic methods for environmental and geotechnical investigations. Surveys in Geophysics 23, 101–132.
Pous J., Queralt P. and Chavez R. 1996. Lateral and topographical effects in geoelectric soundings. Journal of Applied Geophysics 35, 237–248.
Ritz M., Parisot J.C., Diouf S., Beauvais A., Dione F. and Niang M. 1999. Electrical imaging of lateritic weathering mantles over granitic and metamorphic basement of eastern Senegal, West Africa. Journal of Applied Geophysics 41, 335–344.
Sandberg S.K., Slater L.D. and Versteeg R. 2002. An integrated geo-physical investigation of the hydrogeology of an anisotropic uncon-fined aquifer. Journal of Hydrology 267, 227–243.
Schulz R. 1985. Interpretation and depth of investigation of gradient measurements in direct current geoelectrics. Geophysical Prospecting 33, 1240–1253.
Seaton W.J. and Burbey T.J. 2002. Evaluation of two-dimensional resis-tivity methods in a fractured crystalline-rock terrain. Journal of Applied Geophysics 51, 21–41.
Shettigara V.K. and Adams W.M. 1989. Detection of lateral variations in geological structures using electrical-resistivity gradient profiling. Geophysical Prospecting 37, 293–310.
Timms W. and Acworth I. 2002. Origin, lithology and weathering char-acteristics of Upper Tertiary – Quaternary clay aquitard units on the Lower Murrumbidgee alluvial fan. Australian Journal of Earth Sciences 49, 525–537.
Tsourlos P., Szymansky J. and Tsokas G. 1999. The effect of terrain topog-raphy on commonly used resistivity arrays. Geophysics 64, 1357–1363.
Verma R. and Bandyopadhyay T. 1983. Use of the resistivity methods in geological mapping-case histories from Raniganj Coalfield, India. Geophysical Prospecting 31, 490–507.