52

Resolving microbial contamination of reusable waste bins in a
pharmacy clean-room

Tyler Weaver BS Public Health (Environ.) Coordinator, Sustainability & Waste Man. Programs Children’s Hosp of Philadelphia. [email protected]
Director, Grimmond & Associates, Microbiology Consultancy, New Zealand. [email protected]
Terry Grimmond FASM, BAgrSc, GrDpAdEd
Senior Manager, Pharmacy Operations, Dept of Pharmacy Services, Children’s Hosp of Philadelphia. [email protected]
Joshua Guinter Pharm. D
Tyler Weaver: Nothing to disclose. Terry Grimmond: Daniels Health paid travel, registration and a per diem. Joshua Guinter: Nothing to disclose.
No commercial entity had input in this session
Disclosures

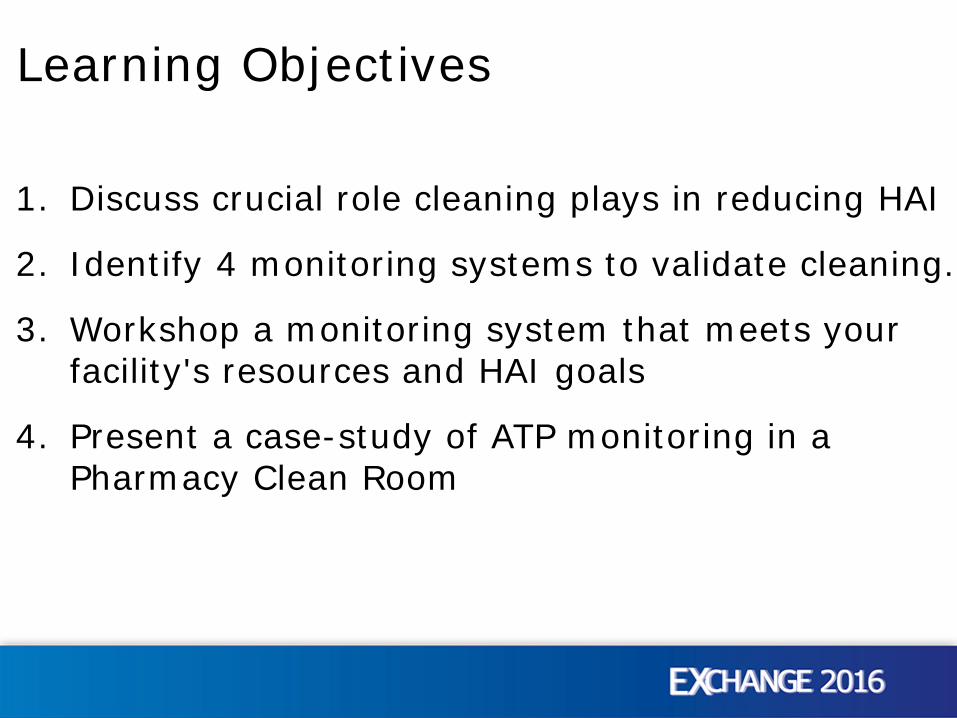
1. Discuss crucial role cleaning plays in reducing HAI
2. Identify 4 monitoring systems to validate cleaning.
3. Workshop a monitoring system that meets your facility's resources and HAI goals
4. Present a case-study of ATP monitoring in a Pharmacy Clean Room
Learning Objectives
1. Discuss crucial role cleaning plays in reducing HAI
2. Identify 4 monitoring systems to validate cleaning.
3. Workshop a monitoring system that meets your facility's resources and HAI goals
4. Present a case-study of ATP monitoring in a Pharmacy Clean Room
Learning Objectives

“…a hospital …should do the sick no harm.” Florence Nightingale, 1863
“…my mother brought my father home the day after his surgery as she knew the risk of infection if she left him in hospital.” 2015 Novel
Healthcare Associated Infections (HAI)
• HAI: Infections in hospital not present on admission
• Consequence: increase stay, illness, mortality and cost
• 2011: Estim 722,000 patients acquired HAI. 75,000 died.
• 4% of all hospital admissions; Cost up to $40 bill/yr
• Pathogen-source: Patient/s, HCW, visitors, environment

Classic 4 HAI
Acronym Full Name Can environment be a source?
CLABSI Central Line Associated Bloodstream Infections Unlikely
SSI Surgical Site Infections Unlikely
CAUTI Catheter-associated Urinary Tract Infections Unlikely
VAP Ventilator-associated pneumonias Unlikely

CDC 6 levels of Risk & Decontamination Risk Activity Decontamination Protocol
Patient medical devices 1. Critical Enter sterile tissue Sterilization
2. Semi-critical Touch mucus memb. Sterilization or High-lev Disinf.
3. Non-critical Touch intact skin Intermediate to Low-lev Disinf.
Guidelines for Environmental Infection Control in Health-Care Facilities. Recommendations of CDC and the Healthcare Infection Control Practices Advisory Committee (HICPAC), 2003. CDC. Atlanta, GA. http://www.cdc.gov/hicpac/pdf/guidelines/eic_in_hcf_03.pdf
Patient environment 4. Low Medical equip. Clean + Low-level disinfectant
5. Lower Envir – High touch Clean ± disinf.
6. Lowest Envir – Low touch Clean

But “Clean” isn’t enough anymore
Cleaning the Patient Environment
Previously….
“It is difficult to justify the routine use of disinfectants in cleaning” Maurer, Hospital Hygiene, 1985
“Most if not all…surfaces need be cleaned only with soap & water.” CDC 2003

New kids on HAI block Acronym Full Name Can environment
be a source?
Cdiff Clostridium difficile intestinal infection Yes
VRE Vancomycin-resistant Enterococci Yes
MRSA Methicillin-resistant Staphylococcus aureus Yes
MDRAb Multidrug-resistant Acinetobacter baumannii Yes
NV Norovirus Yes
1Alfa J, Lo E, Olson N, MacRae M and Beulow-Smith L. Use of a daily disinfectant cleaner instead of a daily cleaner reduced hospital-acquired infection rates. Am J Infect Contr 2015;43:141-6. doi.org/10.1016/j.ajic.2014.10.016. 2Weber D, Rutala W, Miller Sickbert-Bennett E.M, Huslage K and Sickbert-Bennett E. Role of surfaces in the transmission of emerging health care associated pathogens: Norovirus, Clostridium difficile, and Acinetobacter species. Am J Infect Control 2010;38:S25-33
“If patients have VRE, MRSA or Cdiff, then disinfecting room will reduce risk of next room-occupant acquiring these pathogens.”1
For VRE, MRSA, Cdiff, MDRAb &NV patients, “…enhanced cleaning and disinfection of all room surfaces are highly recommended.”2

• 35 states mandate HAI be recorded
• 27 states require HAI be publically reported
Government pressure to reduce HAI
HAI State Law Summary. http://hospitalinfection.org/resources/state-infection-laws/state-law-summary
https://www.cdc.gov/hai/pdfs/toolkits/toolkit-HAI-POLICY-FINAL_01-2012.pdf.

1. Discuss crucial role cleaning plays in reducing HAI
2. Identify 4 monitoring systems to validate cleaning.
3. Workshop a monitoring system that meets your facility's resources and HAI goals
4. Present a case-study of ATP monitoring in a Pharmacy Clean Room
Learning Objectives

Monitoring Thoroughness of Cleaning
Visual traditional but no longer enough
Microbiological Gold Standard; slow & expensive
Fluoro marker Low-cost; but not microbe-related
ATP Quick; somewhat microbe-related; cost; Detects “cells” not soil.
Leas B, Sullivan N, Han J, Pegues D, Kaczmarek J, Umscheid C. Environmental Cleaning for the Prevention of Healthcare-Associated Infections. Technical Brief No. 22 (Prepared by the ECRI Institute – Penn Medicine Evidence-based Practice Center AHRQ 15-EHC020-EF. Rockville, MD. 2015. www.effectivehealthcare.ahrq.gov/reports/final/cfm. Jul 3 2016.

Visual - no longer enough
Microbiological - “Do not conduct random, undirected microbiologic sampling of …environmental surfaces in health-care facilities.”1 CDC 2003
ATP or Flouro – which one?
If monitoring Cleanliness…
1Guidelines for Environmental Infection Control in Health-Care Facilities. Recommendations of CDC and the Healthcare Infection Control Practices Advisory Committee (HICPAC), 2003. U.S. Dept HHS, (CDC) Atlanta, GA. http://www.cdc.gov/hicpac/pdf/guidelines/eic_in_hcf_03.pdf. 2Leas B, Sullivan N, Han J, Pegues D, Kaczmarek J, Umscheid C. Environmental Cleaning for the Prevention of Healthcare-Associated Infections. Technical Brief No. 22 AHRQ 15-EHC020-EF. Rockville, MD. 2015. www.effectivehealthcare.ahrq.gov/reports/final/cfm.
• 3M state 250, but no agreed threshold on ATP2 (500? 250? 100?)
• Neither Fluoro or ATP predict HAI reduction2

Sep 2015: CDC Proposed Research Agenda Cleaning & Disinfection of Surfaces in Patient Rooms
Science of Environmental Hygiene in HC
1. Understanding transmission events related to patient room surfaces
2. Measuring Cleanliness 3. Improving Cleanliness by Focusing on Process 4. Improving Cleanliness by Focusing on emerging
Interventions
CDC - Environmental Hygiene in Healthcare. Proposed research Agenda. https://www.cdc.gov/hai/research/eic-meeting.html.

1. Discuss crucial role cleaning plays in reducing HAI
2. Identify 4 monitoring systems to validate cleaning.
3. Workshop a monitoring system that meets your facility's resources and HAI goals
4. Present a case-study of ATP monitoring in a Pharmacy Clean Room
Learning Objectives
• Small-group discussion
• Which method? What is “pass”?
• Each group present options/methods
• Write-up on flipchart
How does your facility monitor cleaning?

1. Discuss crucial role cleaning plays in reducing HAI
2. Identify 4 monitoring systems to validate cleaning.
3. Workshop a monitoring system that meets your facility's resources and HAI goals
4. Present a case-study of ATP monitoring in a Pharmacy Clean Room
Learning Objectives

• Pharmacy Clean Rooms (PCRs) – Provides controlled environment for preparation of
compounded sterile products (CSPs) • Intermittent and continuous intravenous medications • Total parenteral nutrition
What Happens in Pharmacy Clean Rooms?
– Consists of • Anteroom • Buffer area containing laminar airflow hood(s) (LAFHs) • Buffer area for hazardous preparation • HEPA-filtered air supply
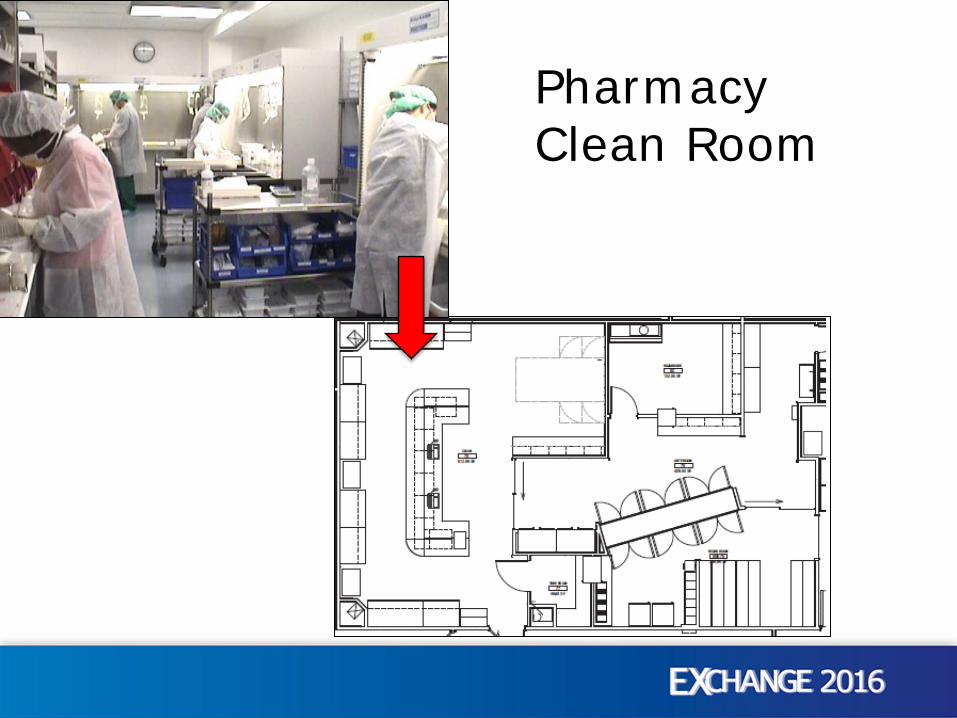
Pharmacy Clean Room

Sharps containers next to Laminar Hoods

• United States Pharmacopeia and The National Formulary (USP-NF) – Public pharmacopeial standards
• Monographs • General Chapters • General Notices
• General Chapters – USP795 – Non-Sterile Preparations – USP797 – Sterile Preparations – USP800 – Hazardous Preparations
Pharmacy Standards and Guidelines
USP-NF. U.S. Pharmacopeial Convention. Accessed 2016-06-15. Available from: http://www.usp.org/usp-nf

– First published 2004; Revised 2008 – Currently being revised
Chapter Objective: “Describe conditions and practices to prevent harm, including death, to patients”
• Contamination (microbial, chemical, physical) • Strength variability • Inappropriate quality
“USP797 – Sterile Preparations”
<797> Pharmaceutical Compounding – Sterile Preparations. USP-NF. U.S. Pharmacopeial Convention.

Describes standards for: – Facility design and environmental control – ISO Classification requirements for air particles – Compounding risk levels and beyond-use-dating – Personal protective equipment – Finished product release checks
• +/- testing • +/- sterilization
– Cleaning requirements – Training requirements – Monitoring methods and requirements
USP797 – Sterile Preparations (cont)
<797> Pharmaceutical Compounding – Sterile Preparations. USP-NF. U.S. Pharmacopeial Convention.

• State Boards of Pharmacy/Depts of Health – Wide variation among states – Best practice specific text in state regulations
• Centers for Medicare/Medicaid Services (CMS)
• Accreditation organizations – The Joint Commission (accredits CHOP to CMS) – DNV Group – American Osteopathic Association
USP797 Standards Enforcement

• Fungal infection outbreak in September 2012 – Meningitis, paraspinal infection, peripheral joint infection
• Resulted from contaminated CSPs of preservative-free methylprednisolone acetate - recalled Sept 26, 2012
• Recall of all CSPs on October 6, 2012 – 753 cases with 64 deaths in 20 states
• Dept of Justice indicted 14 individuals with 131 counts (2nd degree murder, racketeering, conspiracy, FD&C Act violations)
• Civil suit by victims and families - $200 million settlement
New England Compounding Center
• Multistate Outbreak of Fungal Meningitis and Other Infections. Centers for Disease Control and Prevention. Accessed 2016-06-15. http://www.cdc.gov/hai/outbreaks/meningitis.html • 14 Indicted in Connection with New England Compounding Center and Nationwide Fungal Meningitis Outbreak. Food and Drug Administration Office of Criminal Investigations. December 17,
2014. Accessed 2016-06-15. http://www.fda.gov/ICECI/CriminalInvestigations/ucm427577.htm. • Judge approves $200 million settlement over meningitis outbreak. CBS News. Accessed 2016-06-15. http://www.cbsnews.com/news/judge-approves-200-million-settlement-over-meningitis-
outbreak/.
When PCR QA goes wrong…
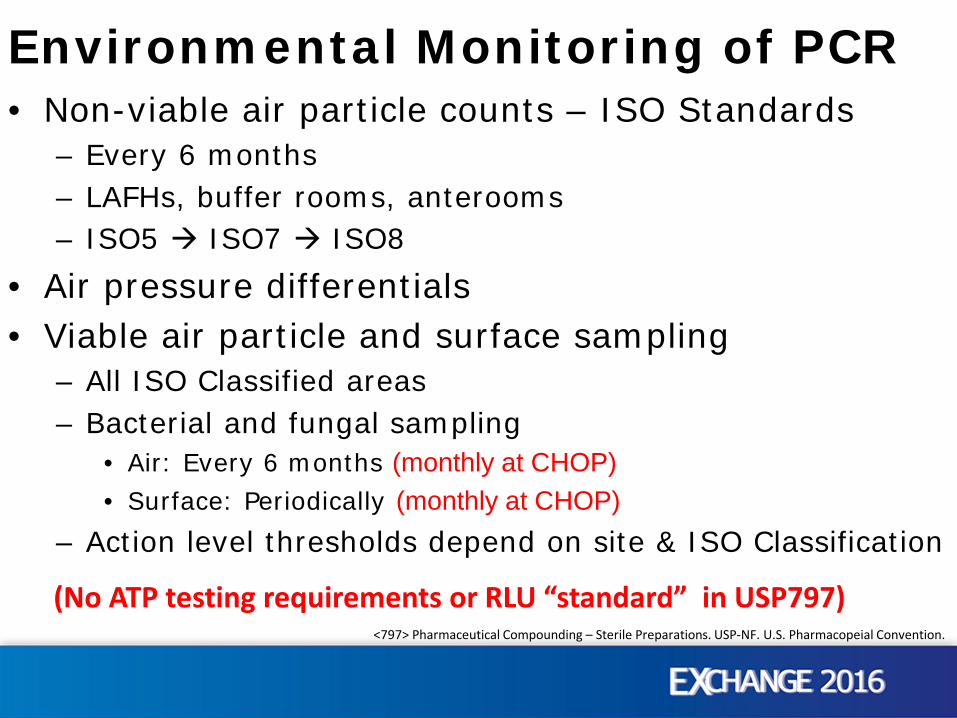
• Non-viable air particle counts – ISO Standards – Every 6 months – LAFHs, buffer rooms, anterooms – ISO5 ISO7 ISO8
• Air pressure differentials • Viable air particle and surface sampling
– All ISO Classified areas – Bacterial and fungal sampling
• Air: Every 6 months (monthly at CHOP) • Surface: Periodically (monthly at CHOP)
– Action level thresholds depend on site & ISO Classification
Environmental Monitoring of PCR
<797> Pharmaceutical Compounding – Sterile Preparations. USP-NF. U.S. Pharmacopeial Convention.
(No ATP testing requirements or RLU “standard” in USP797)

Recommended Action levels for Microbial Contamination1
1<797> Pharmaceutical Compounding – Sterile Preparations. USP-NF. U.S. Pharmacopeial Convention. 2Leas B, Sullivan N, Han J, Pegues D, Kaczmarek J, Umscheid C. Environmental Cleaning for the Prevention of Healthcare-Associated Infections. Technical Brief No. 22 AHRQ 15-EHC020-EF. Rockville, MD. 2015. www.effectivehealthcare.ahrq.gov/reports/final/cfm. Jul 3 2016.
Classification Air Sample (cfu/m3air per plate)
Surface Sample (Contact plate) (cfu per plate)
ISO Class 5 (laminar cabinets) >1 >3* ISO Class 7 (room with Sharps Container)
>10 >5
ISO Class 8 or worse >100 >100
*NB. <2.5 CFU/cm2 regarded as “microbiologically clean”2
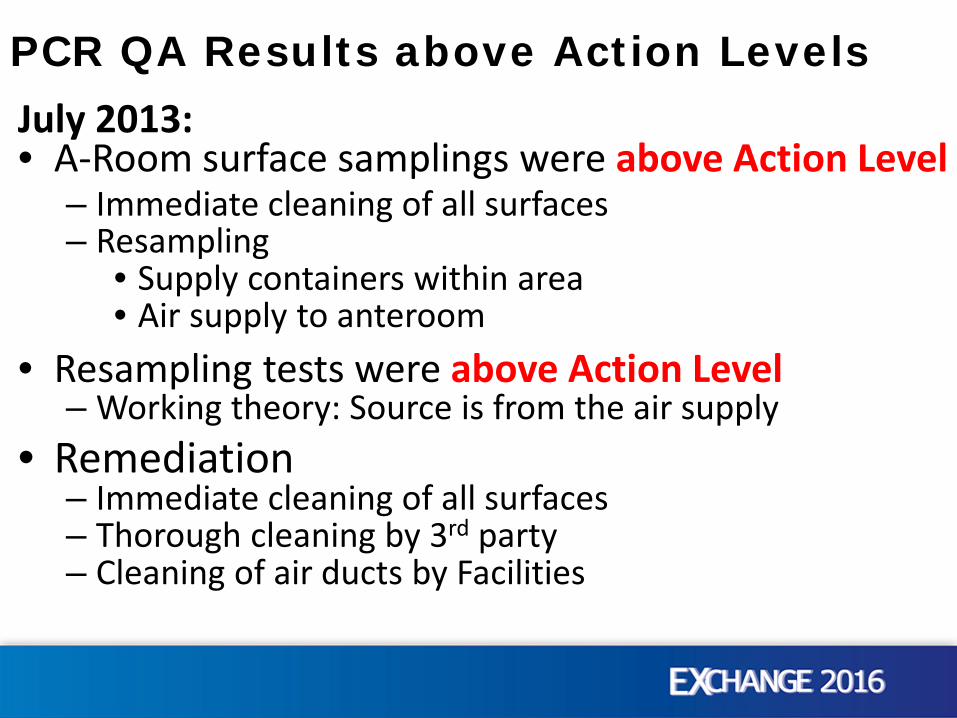
• Resampling tests were above Action Level – Working theory: Source is from the air supply
• Remediation – Immediate cleaning of all surfaces – Thorough cleaning by 3rd party – Cleaning of air ducts by Facilities
PCR QA Results above Action Levels July 2013: • A-Room surface samplings were above Action Level
– Immediate cleaning of all surfaces – Resampling
• Supply containers within area • Air supply to anteroom

• Noticed gown-tie in sharps bin “moving” during facilities inspection and testing – Located across from Buffer Area entry door – Buffer area positive-pressure in relation to anteroom
• Sharps containers against adjacent wall – Air flowing from under door – Air impacting sharps containers and wall – Carrying contamination to work benches
• Lead to testing of sharps containers
Light Bulb Moment

Microbial Sampling Investigation Testing Date
Colony Forming Units
Action Level
Sharps Container 1 8/23/2013 7 >10 Sharps Container 2 TNTC >10 Sharps Container 3 TNTC >10 Sharps Container 4 11 >10 Sharps Container 5 TNTC >10 Sharps Container 6 TNTC >10 Sharps Container 7 TNTC >10 Inside delivery cart 9/20/2013 TNTC ? Sharps container (outer) TNTC >10 Sharps container (inner) 2 >10 Truck internal fastening rail TNTC ? Truck inside wall TNTC ?
TNTC = Too numerous to count (>1,000); Red values = exceed Action Level Threshold

Sampling After Vendor A Informed
Investigation Testing Date Colony
Forming Units Action Level Inside delivery cart 3 days
post
11 ? Sharps container - outer 58 >10 Truck wall/rail 1 ? Sharps container 1 6 weeks
post
TNTC >10 Sharps container 2 TNTC >10 Sharps container Lid TNTC >10 TNTC = Too numerous to count (>1,000)

• Nested containers (entraps moisture) • Warmth + moistness = bacterial growth in container • Placed in Pharmacy clean room underneath air vent • Aerosol “piston effect” when large items deposited
Explanation of Vendor A Contamination
• Likely explanation of problem: Sub-optimal decontamination during Factory wash process Warmth in factory/trucks + nested containers = org. amplification Contamination spread by plumed aerosols + air currents
• Surface Contamination species Pseudomonas sp. (common water-organism) Bacillus sp. (envir. spores) Staphylococcus sp. (non-aureus) (commonly hand contact) gram-negative rods and gram-positive rods (envir./water)
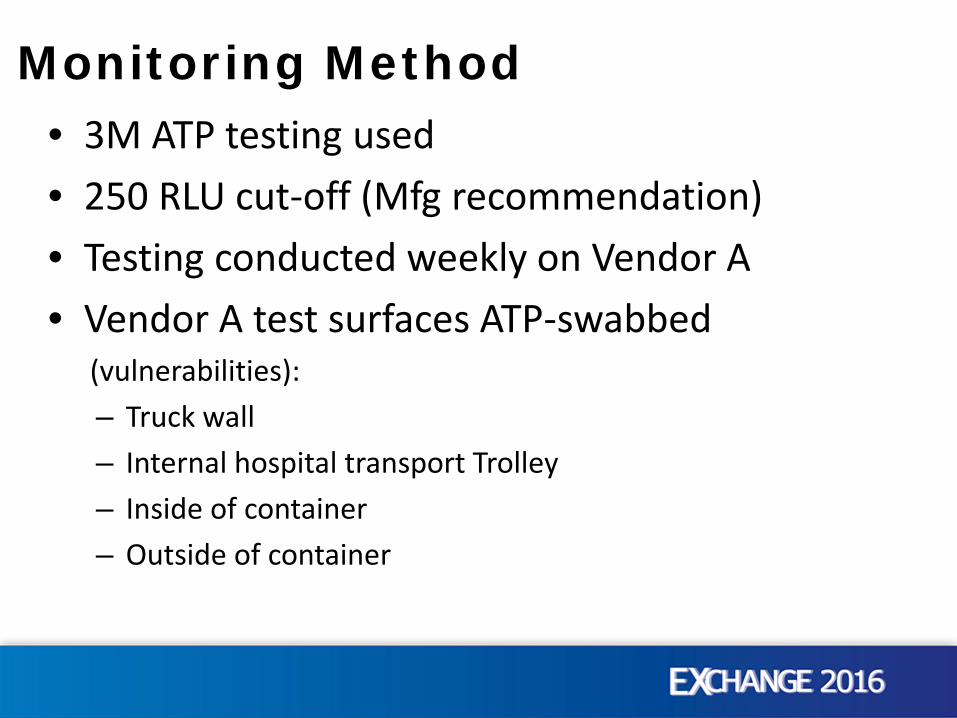
• 3M ATP testing used • 250 RLU cut-off (Mfg recommendation) • Testing conducted weekly on Vendor A • Vendor A test surfaces ATP-swabbed
(vulnerabilities): – Truck wall – Internal hospital transport Trolley – Inside of container – Outside of container
Monitoring Method

Initial RLU ranged from 173 - >300,000 RLU
ATP Results – Vendor A Containers
Next 3 months ranged from 276 – 4,544 RLU
No month had all tests below required 250 RLU
NB. Need remember: • RLU “250” is arbitrary • These are waste bins! BUT….
This a Pharmacy Clean Room

Vendor A • Failed Micro & ATP results - shared with Vendor A • Vendor A tried 3 mths to meet CHOP requirements
o Water temp o Chemicals used o Dry time
• Could not meet PCR Microb & ATP requirements Vendor B
• Testing begins (2, 4 & 8 galls initially) • Vendor B test surfaces (vulnerabilities):
• Containers; Trolley; Storage transporter
Method cont’d

Containers
Vendor B Vendor A

Internal trolleys Vendor B Vendor A

-
250
500
750
1,000
Sep Oct Nov Dec Jan Feb
Container ATP Comparison: Vendor A & B
Average RLU Per
month
2014 2013
Vendor B adopted
in PCR
Vendor A
Vendor B
38,000

Container Average ATP: Vendors compared 2013-2016
But we wanted highest RLU to be less than 250 (Some Vendor B containers >1,000 RLU)
2014 2013 2013 2016
0
1000
2000
3000
4000
Sep
Oct
Nov De
c
Jan
Feb
Mar Ap
r
May Jun Jul
Aug
Sep
Oct
Nov De
c
Jan
Feb
Mar Ap
r
May Jun Jul
Aug
Sep
Oct
Nov De
c
Jan
Feb
Mar Ap
r
May Jun
Average RLU Per
Month
Vendor A
Vendor B
>

0
1000
2000
3000
4000
Sep
Oct
Nov De
c
Jan
Feb
Mar Ap
r
May Jun Jul
Aug
Sep
Oct
Nov De
c
Jan
Feb
Mar Ap
r
May Jun Jul
Aug
Sep
Oct
Nov De
c
Jan
Feb
Mar Ap
r
May Jun
Vendor A Containers: Highest RLU (2013-2016)
Highest RLU
2014 2013 2016 2015
Threshold met 3 times; 1 in 2016
>

0
1000
2000
3000
4000
Sep
Oct
Nov De
c
Jan
Feb
Mar Ap
r
May Jun Jul
Aug
Sep
Oct
Nov De
c
Jan
Feb
Mar Ap
r
May Jun Jul
Aug
Sep
Oct
Nov De
c
Jan
Feb
Mar Ap
r
May Jun
Vendor B Containers: Highest RLU (2013-2016)
Highest RLU
2014 2013 2016 2015 Threshold met 19 times; every month since Aug 2015
0
1000
2000
3000
4000
Sep
Oct
Nov De
c
Jan
Feb
Mar Ap
r
May Jun Jul
Aug
Sep
Oct
Nov De
c
Jan
Feb
Mar Ap
r
May Jun Jul
Aug
Sep
Oct
Nov De
c
Jan
Feb
Mar Ap
r
May Jun
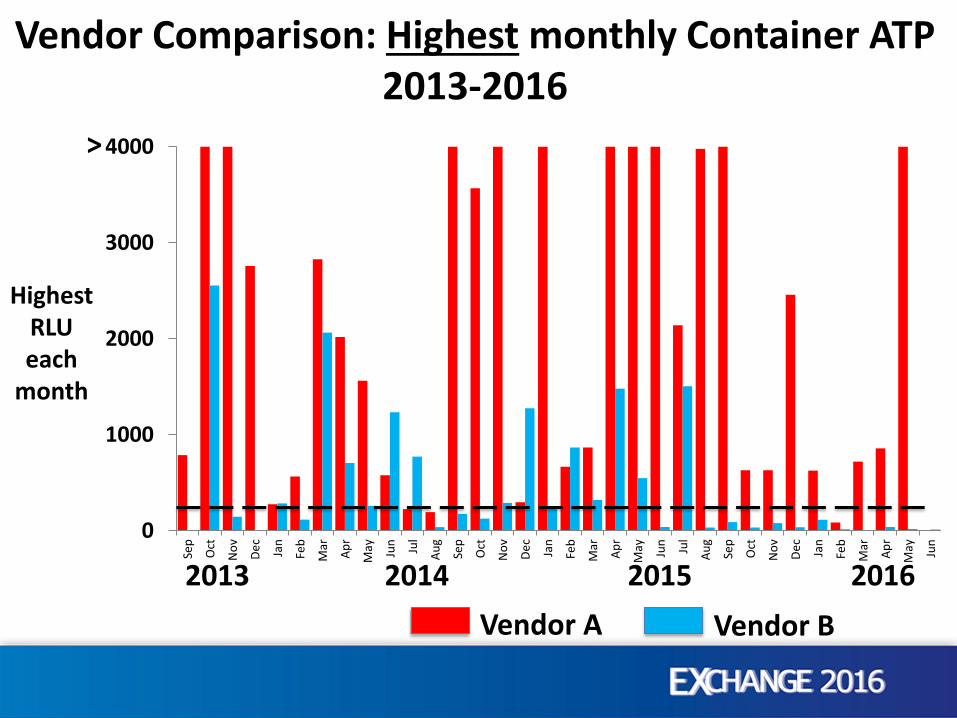
Vendor Comparison: Highest monthly Container ATP 2013-2016
Highest RLU each
month
2014 2013 2016 2015 Vendor A Vendor B
>

Vendor A: 14,844
Average of highest monthly readings (RLU) 2013-2016
Vendor B: 103 Interestingly, the literature says… “100 RLU offered closest correlation with … <2.5 cfu/cm2”*
*Mulvey D, Redding P, Robertson C, et al. Finding a benchmark for monitoring hospital cleanliness. J Hosp Infect. 2011 Jan;77(1):25-30. doi: 10.1016/j.jhin.2010.08.006.

– Initially no physical separation of clean & dirty in truck – Trolley has large, difficult surfaces to clean – Nested containers impedes adequate drying
• Inside of container contacts outside of another container • Issues of warmth, moisture through restricted airflow
– Issues with supplying satisfactory SOP and SDS – Could not respond to cleanliness levels in PCR – ATP tests remained high in less critical areas of hospital
Considerations– Vendor A

– On-site storage room for sharps containers - currently provides inpatient sharps exchanges
– 2 on-site personnel 7 days/week 7am – 7pm – Containers arrive on site inside transporters
– Numbers range from 36 to 72 depending on size (2,4,8 gal) – Transporters have separation wall down middle (clean/dirty)
– Containers come assembled with attached lids (no nesting)
– Trolley makes minimal contact with containers – Responded to PCR requirements – ATP consistently low
Other Considerations – Vendor B

Since conversion to Vendor B in PCR • No container has caused microbiological tests to
exceed the USP Action Level (in 27 months) • No concurrent ATP test has exceeded 250 RLU
• PCR Microbiology conducted monthly (USP requirement)
• ATP testing of containers, etc, conducted weekly
In Summary…
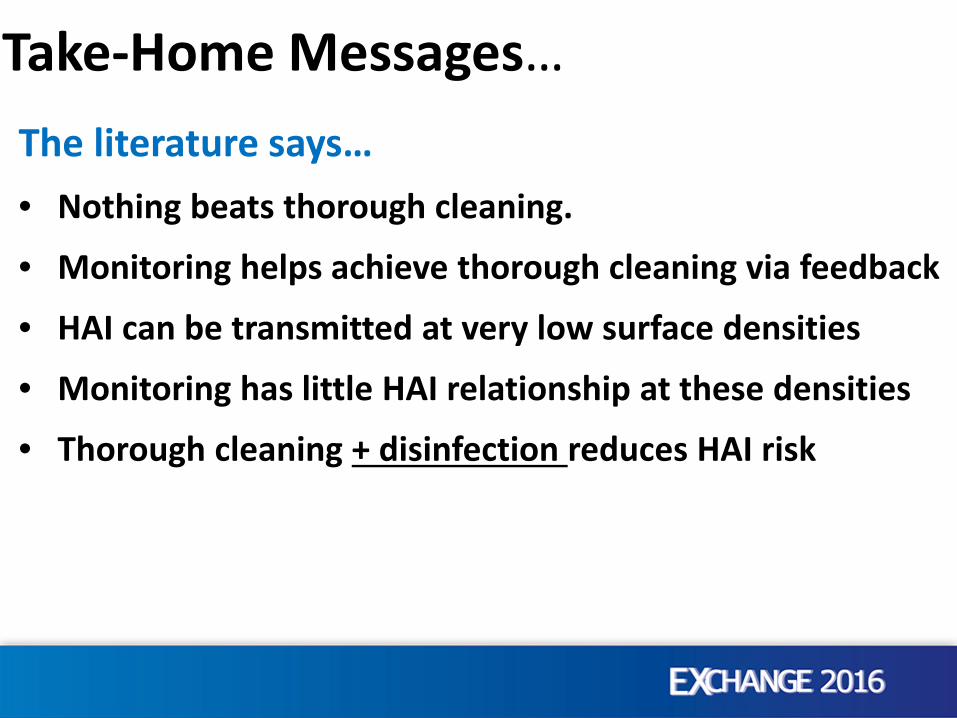
Take-Home Messages… The literature says… • Nothing beats thorough cleaning.
• Monitoring helps achieve thorough cleaning via feedback
• HAI can be transmitted at very low surface densities
• Monitoring has little HAI relationship at these densities
• Thorough cleaning + disinfection reduces HAI risk

Take-Home Messages… In our case study… • We cannot say 250 RLU equates with ISO-6 (10cfu/cm2)
• We can say…
“Setting a container RLU standard of <250 was associated with PCR achieving its ISO-6 (10cfu/cm2) surface standard”
• “An average container RLU of 250 has not been associated with PCR failure in the 3 years since adoption.”
• “3M ATP 250 RLU is a useful, achievable, economical alert”
1. Discuss crucial role cleaning plays in reducing HAI
2. Identify 4 monitoring systems to validate cleaning.
3. Workshop a monitoring system that meets your facility's resources and HAI goals
4. Present a case-study of ATP monitoring in a Pharmacy Clean Room
Learning Objectives

QUESTIONS & COMMENTS?


