• Resonance • Bode Plots • Wires – theory vs reality • Amplitude Modulation • Diodes 6.101 Spring 2018 Lecture 2 1 Acknowledgements: Lecture material adapted from Prof Qing Hu & Prof Jae Lim, 6.003 Figures and images used in these lecture notes by permission, copyright 1997 by Alan V. Oppenheim and Alan S. Willsky 2 handouts lecture notes pset1
Transcript
• Resonance• Bode Plots• Wires – theory vs reality• Amplitude Modulation• Diodes
6.101 Spring 2018 Lecture 2 1
Acknowledgements: Lecture material adapted from Prof Qing Hu & Prof Jae Lim, 6.003Figures and images used in these lecture notes by permission,copyright 1997 by Alan V. Oppenheim and Alan S. Willsky
2 handoutslecture notespset1
Lab Check‐off Policies
• Lab check‐offs – done during staff hours • Please don’t assume that you can wait until the last minute!
– No check‐offs on Friday & Saturday• Lab grade = checkoff + lab report; grades on course website
– Lab report grade = data, neatness, quality, working circuit– On‐time check‐off grade: up to 5 points
• 20%/day late penalty after slack days• Very late check‐off: 1 point (minimum)
– Students may use up to 5 slack days (penalty free) for late checkoffs – self administered.
• Lab located next to lockers.
6.101 Spring 2018 2Lecture 2
Decibel (dB) – 3dB point
i
o
VVdB log20
i
o
PPdB log10
6.101 Spring 2018 3
3 dB point = ?
log10(2)=.301
Lecture 2
100 dB = 100,000 = 105
80 dB = 10,000 = 104
60 dB = 1,000 = 103
40 dB = 100 = 102half power point
Resonance (Series RLC) – Key points
6.101 Spring 2018 4
R LC
+V-
)1(1C
LjRsC
sLRZ
• Applies to more complex RLC circuits
• At resonance: power is maximum
• At resonance: phase angle zero, i.e. capacitive reactance = inductive reactance, or impedance is real
Lecture 2
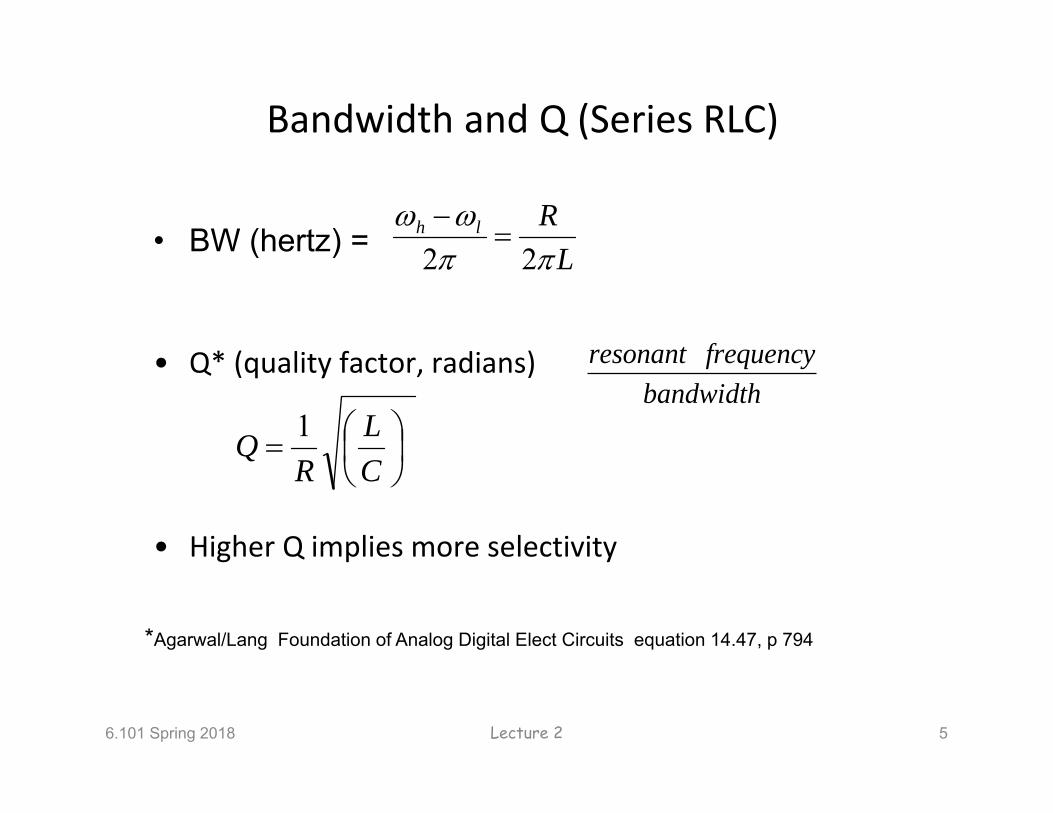
Bandwidth and Q (Series RLC)
6.101 Spring 2018 5Lecture 2
• BW (hertz) =
• Q* (quality factor, radians)
• Higher Q implies more selectivity
LRlh
22
resonant frequencybandwidth
*Agarwal/Lang Foundation of Analog Digital Elect Circuits equation 14.47, p 794
• A Bode plot is a graph of the magnitude (in dB) or phase of the transfer function versus frequency.
• Magnitude plot on log‐log scale– Slope: 20dB/decade, same as 6dB/octave
• Bode plot provides insight into impact of RLC in frequency response.
• Stable networks must always have poles and zeroes in the left‐half plane.
6.101 Spring 2018 9Lecture 2
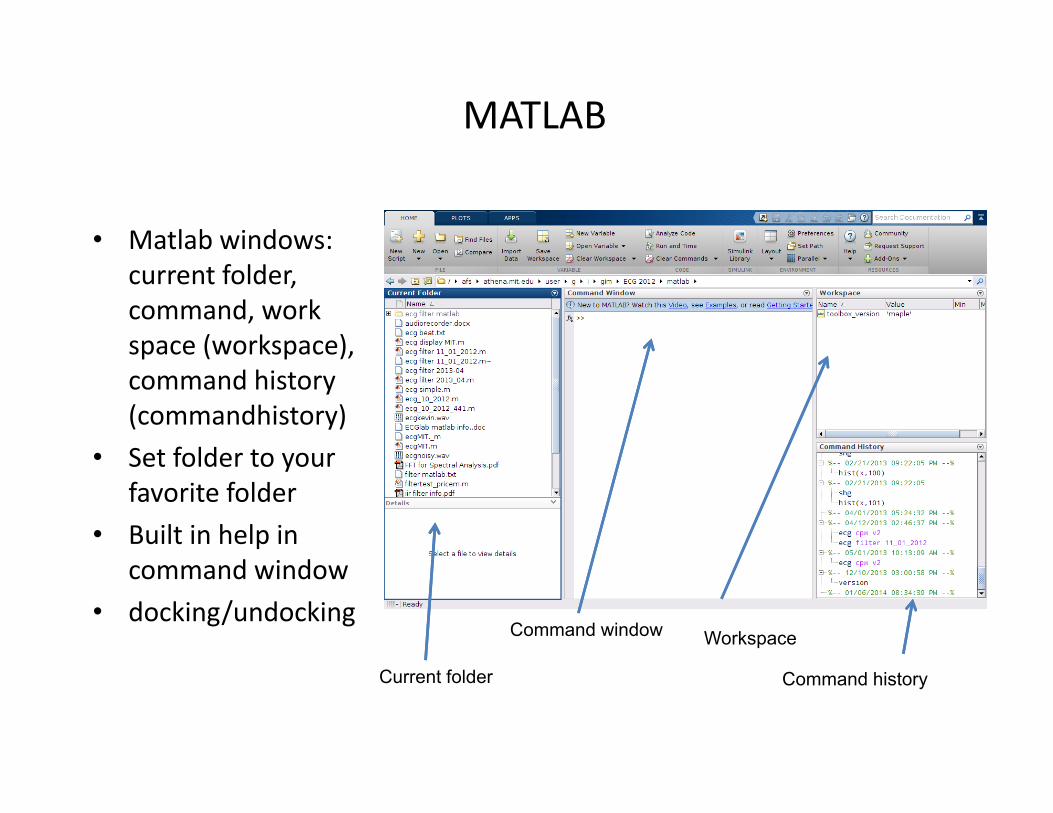
MATLAB
• Matlab windows: current folder, command, work space (workspace), command history (commandhistory)
• Set folder to your favorite folder
• Built in help in command window
• docking/undocking
Current folder
Command window Workspace
Command history
MATLAB commands
• % comment delimiter• MATLAB arrays starts with index=1
– a = [4,5,6] is a row vector a(2)=5– b = [7;8;9] is a column vector
• “;” don’t print values• Variables are case sensitive • Variables must start with a letter• who/whos: list the current variables in short/long form• shg – show recent graph, pop to the front• use apostrophes for FILENAME• format shortENG – display engineering notation
aA
MATLAB
pi 3.14159265i,j sqrt(-1) imaginary unit
zeros(n,m) an n x m matrix of zerosones(n,m) an n x m matrix of ones
+ - addition, subtraction*/ ^ multiplication, division, power
sqrt square root
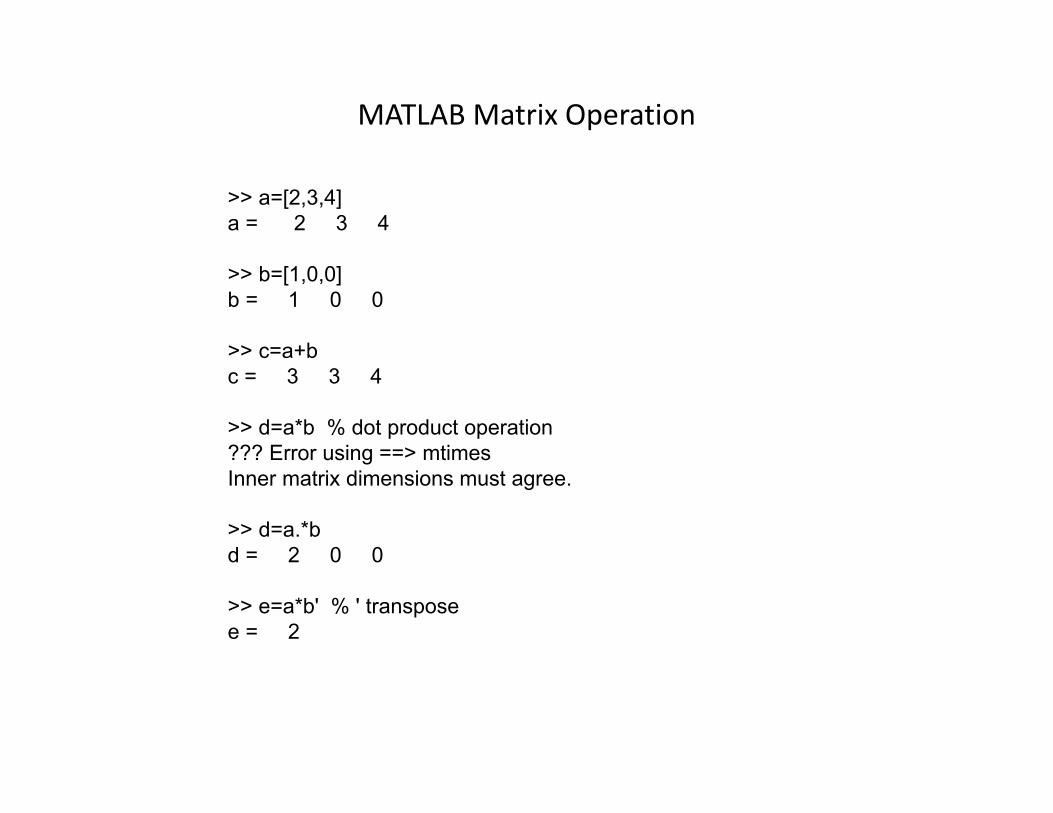
MATLAB Matrix Operation
>> a=[2,3,4]a = 2 3 4
>> b=[1,0,0]b = 1 0 0
>> c=a+bc = 3 3 4
>> d=a*b % dot product operation??? Error using ==> mtimesInner matrix dimensions must agree.
>> d=a.*bd = 2 0 0
>> e=a*b' % ' transposee = 2
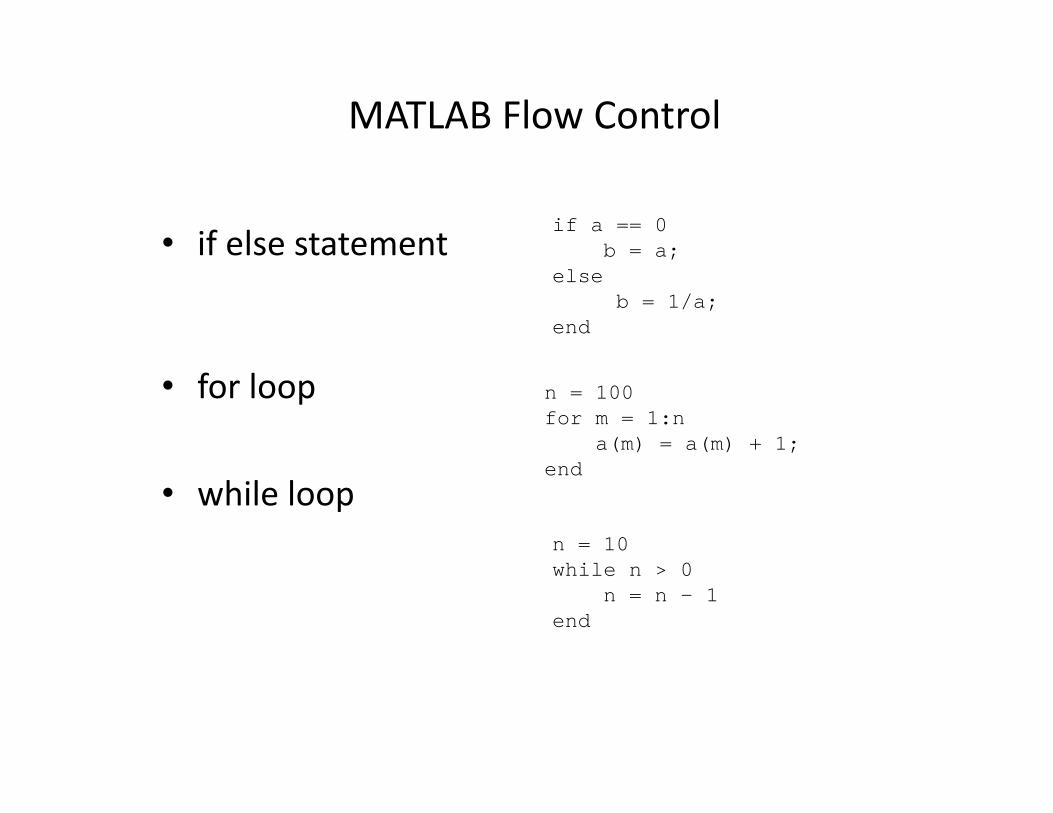
MATLAB Flow Control
• if else statement
• for loop
• while loop
if a == 0b = a;
elseb = 1/a;
end
n = 100for m = 1:n
a(m) = a(m) + 1;end
n = 10while n > 0
n = n – 1end
MATLAB example sin(x)
>> t=[0:1/100:1-1/100]; % create t from 0 to .99, 100 values>> x=sin(2*pi*t);>> plot(t, x);>> stem(t,x);>> shg
6.101 Spring 2018 16
MATLAB Functions bode, freqs
• BODE(SYS,W) uses the vector W of frequencies (in radians/TimeUnit) to evaluate the frequency response
• [MAG,PHASE] = BODE(SYS,W) and [MAG,PHASE,W] = BODE(SYS) return the response magnitudes and phases in degrees (along with the frequency vector W if unspecified).
• SYS is the transfer function expressed as numerator and denominator in the form
• bode(num,denom,range)num=[d e], denom=[a b c], range= desired freqencies in radians
• freqs(num,denom,range) plots frequency response and phase angle
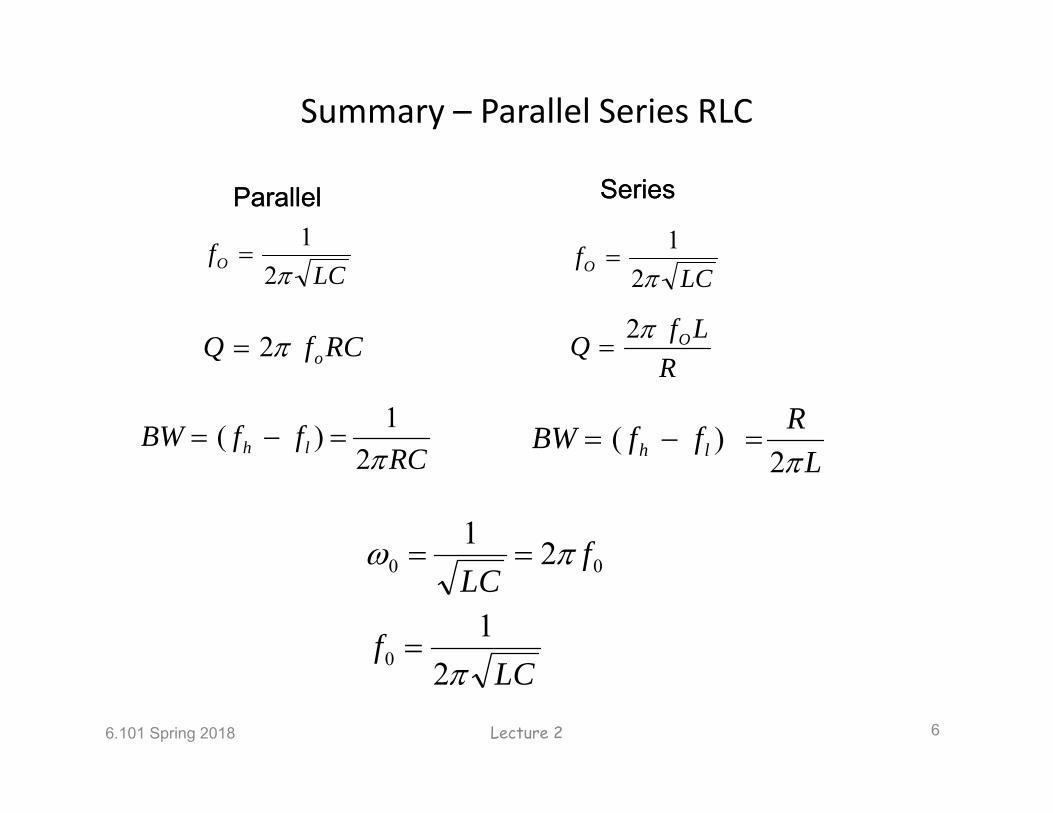
• Resonance, Q, bandwidth• Transformers and impact on load and bandwidth
• Diode detector, demodulation• Simple AM transmitter and receiver
6.101 Spring 2018 21
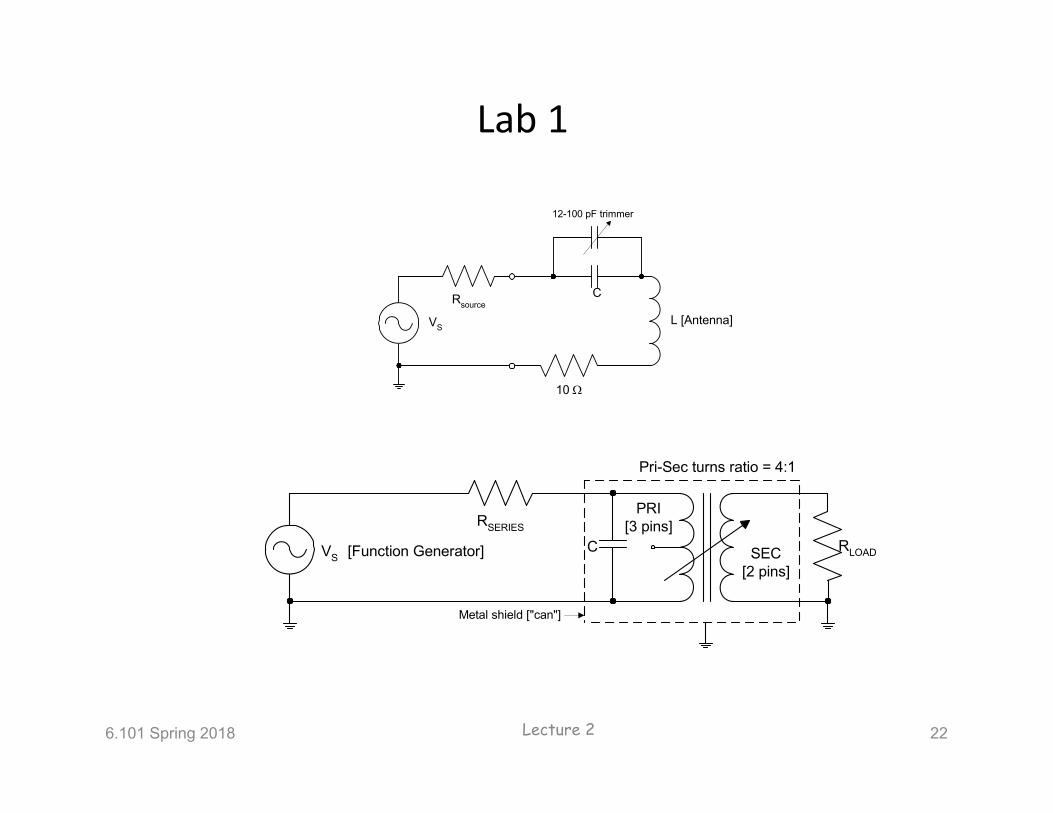
Lab 1
6.101 Spring 2018 22
CRsource
VS
10
L [Antenna]
12-100 pF trimmer
RSERIES
VS [Function Generator]
Pri-Sec turns ratio = 4:1
PRI[3 pins]
SEC[2 pins]
C RLOAD
Metal shield ["can"]
Lecture 2
Proper External Grounding forLab 1 IF Transformer
6.101 Spring 2018 23
NC
Can
PC Boardpri sec
Lecture 2
6.101 Spring 2018 24
Schematics & Wiring• IC power supply connections generally not drawn.
All integrated circuits need power!• Use standard color coded wires to avoid confusion.
– red: positive – black: ground or common reference point– Other colors: signals
• Circuit flow, signal flow left to right• Higher voltage on top, ground negative voltage on
bottom• Neat wiring helps in debugging!
6.101 Spring 2018 25
Wire Gauge
• Wire gauge: diameter is inversely proportional to the wire gauge number. Diameter increases as the wire gauge decreases. 2, 1, 0, 00, 000(3/0) up to 7/0.
• Resistance– 22 gauge .0254 in 16 ohm/1000 feet– 12 gauge .08 in 1.5 ohm/1000 feet– High voltage AC used to reduce loss
• 1cm cube of copper has a resistance of 1.68 micro ohm (resistance of copper wire scales linearly : length/area)
Wires Theory vs Reality ‐ Lab 1
6.101 Spring 2018 Lecture 2 26
Wires have inductance and resistance
noise during transitions
Voltage drop across wires
LC ringing after transitions
30-50mv voltage drop in chip
power supply noise
Bypass (Decoupling) Capacitors
6.101 Spring 2018 Lecture 2 27
Bypass capacitor0.1uf typical
• Provides additional filtering from main power supply
• Used as local energy source – provides peak current during transitions
• Provided decoupling of noise spikes during transitions
• Placed as close to the IC as possible.
• Use small capacitors for high frequency response.
• Use large capacitors to localize bulk energy storage
Electrolytic Capacitor 10uf
Through hole PCB (ancient) shown for clarity.
6.101 Spring 2018 28
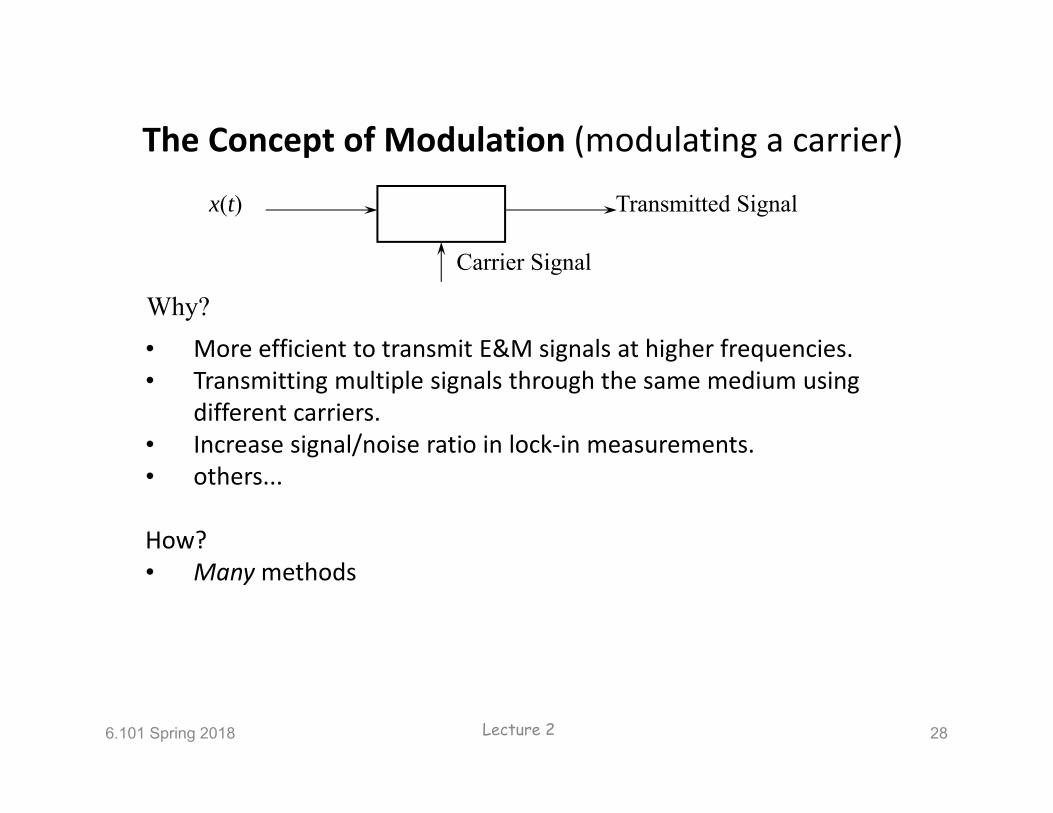
The Concept of Modulation (modulating a carrier)
Why?• More efficient to transmit E&M signals at higher frequencies.• Transmitting multiple signals through the same medium using
different carriers.• Increase signal/noise ratio in lock‐in measurements.• others...
How?• Manymethods
x(t) Transmitted Signal
Carrier Signal
Lecture 2
Two of Many Methods of Modulation
6.101 Spring 2018 29
Focus is on Amplitude Modulation (AM)
Fourier Series
6.101 Spring 2018 30
T= 1/f1
V=|Asin(ω0t)| ω0 = 2π f1
?
?
?
1(n1)
n
Time Domain Analysis
6.101 Spring 2018 31
])cos()[cos(2
cos
cos*)cos(
ttKAtAv
ttKAAv
mcmcm
cc
cmmc
Lecture 2
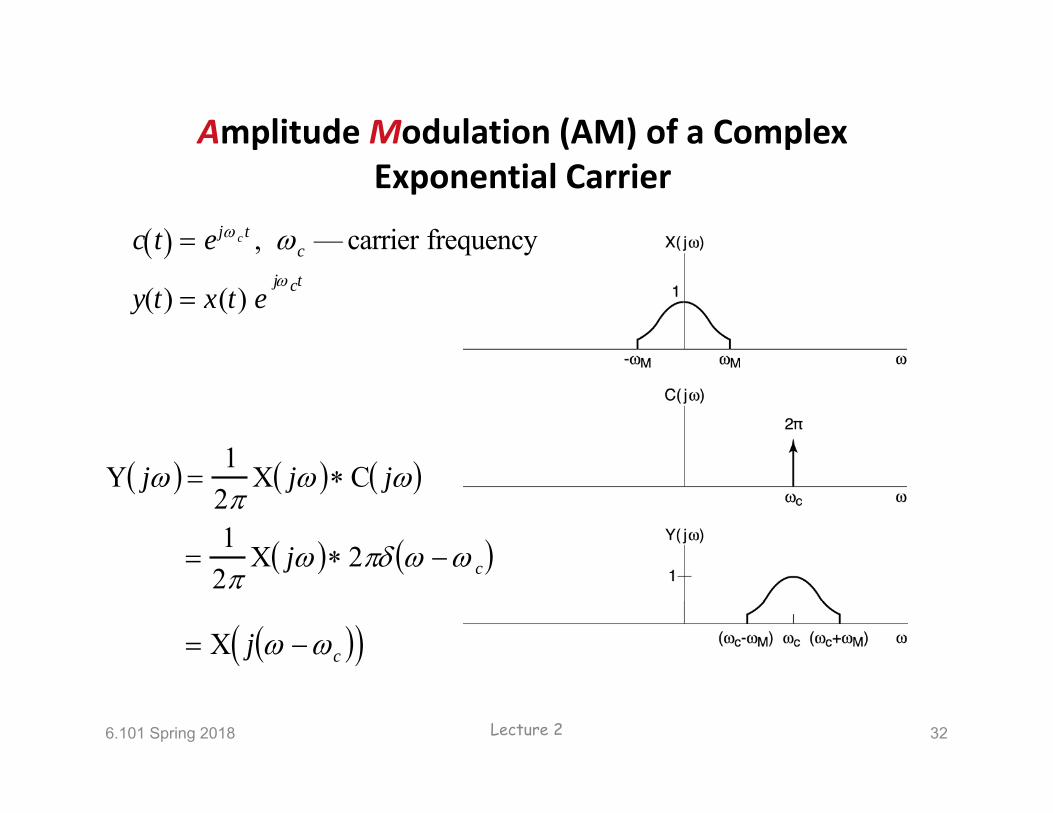
6.101 Spring 2018 32
Amplitude Modulation (AM) of a Complex Exponential Carrier
c t ej c t , c — carrier frequency
y(t) x(t) ej ct
X j c
Y j 12
X j C j
1
2X j 2 c
Lecture 2
6.101 Spring 2018 33
Asynchronous Demodulation
• Assume c >> M, so signal envelope looks like x(t)• Add same carrier
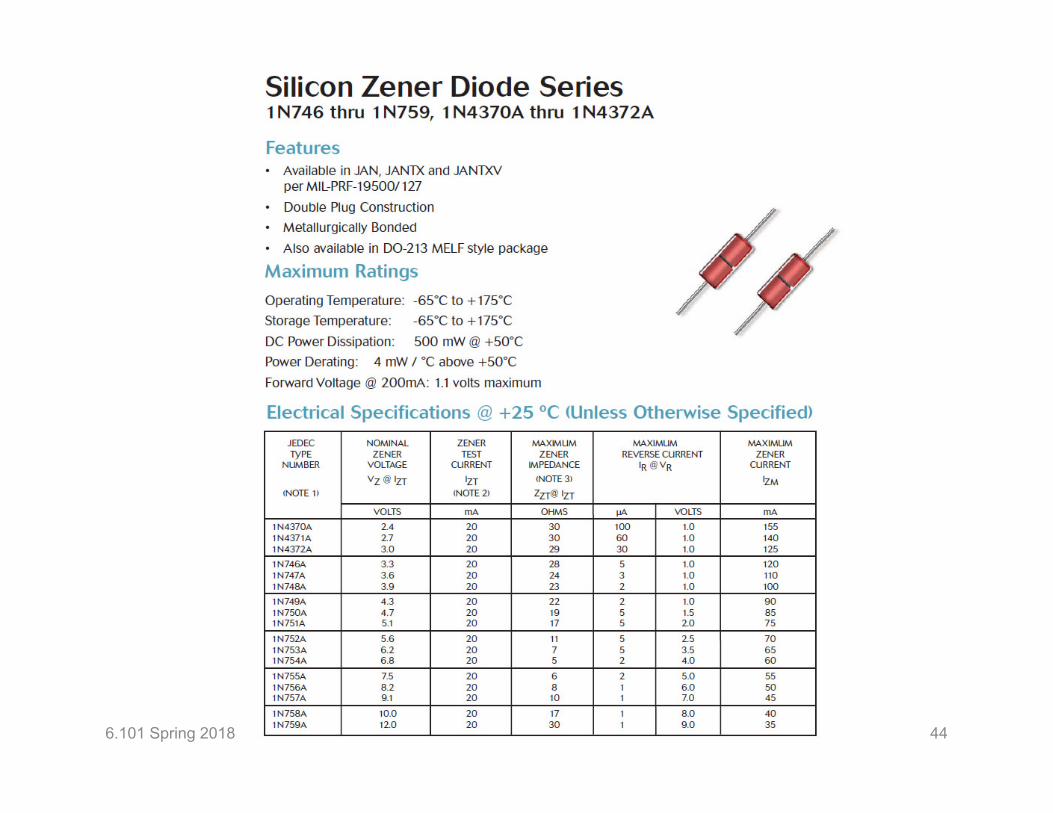
• Zener diodes will maintain a fixed voltage by breaking down at a predefined voltage (zenervoltage).
4.7k
+
V
_
Lecture 2
Zener Breakdown
• Actually caused by two effects: avalanche effect and zener effect.
• Avalanche effect: electron/holes entering depletion region is accelerating by the electric field, collides and creates additional electron/hole pairs – like a snow avalanche; occurs above 5.6V; has positive temperature coefficient
• Zener effect: heavy doping of PN junction results in a thin depletion layer. Quantum tunneling results in current flow; occurs below 5.6V; has negative temperature coefficient
• At 5.6V, two effects balance is near zero temperature coefficient.
6.101 Spring 2018 43
6.101 Spring 2018 44
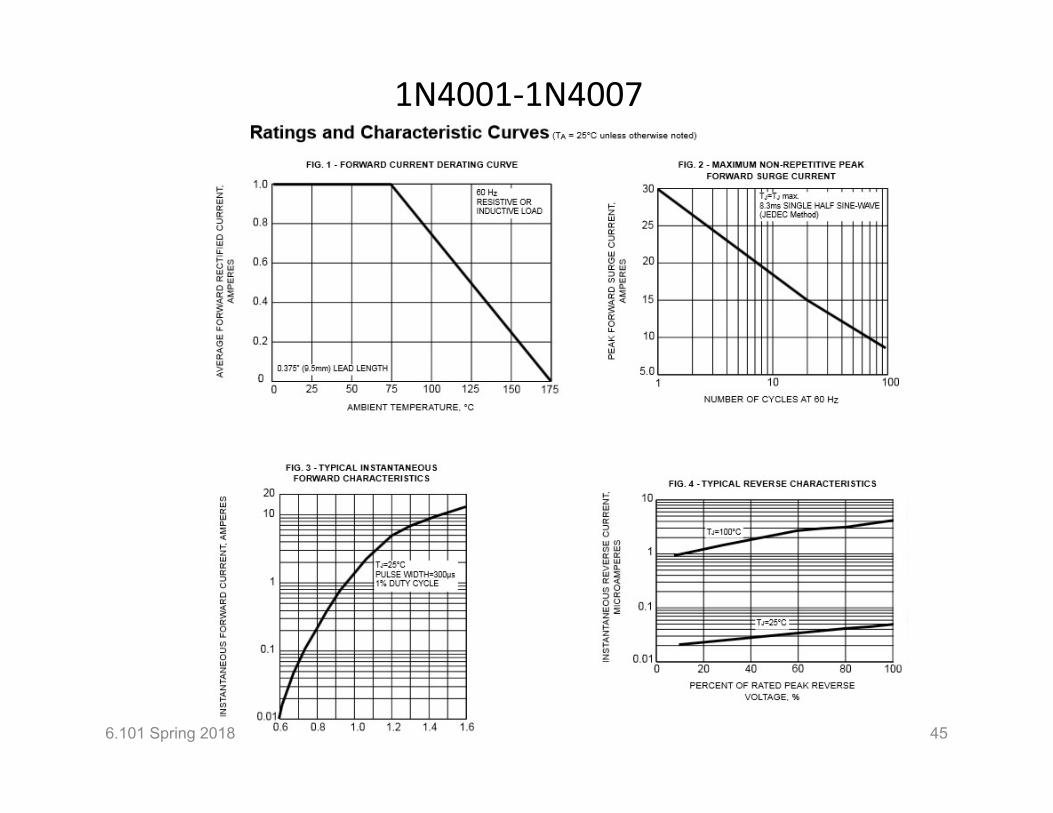
1N4001‐1N4007
6.101 Spring 2018 45
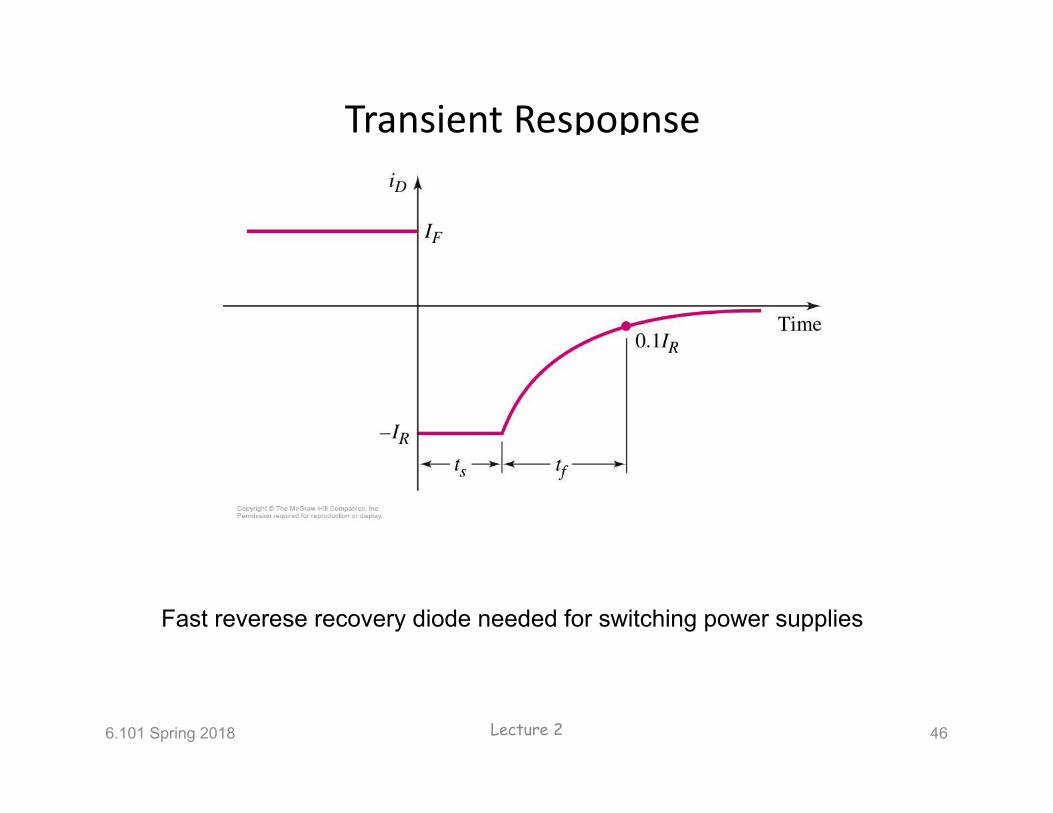
Transient Respopnse
6.101 Spring 2018 46
Fast reverese recovery diode needed for switching power supplies
Lecture 2
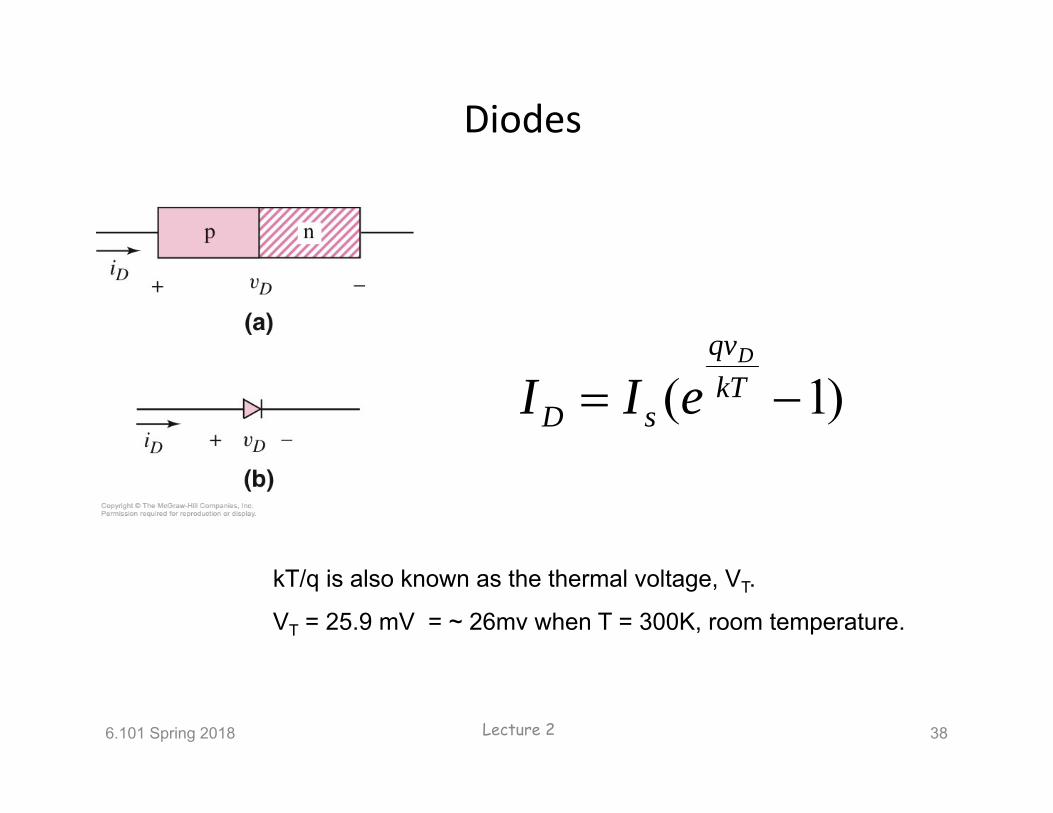
Diodes
6.101 Spring 2018 47
Type Max Vr Max IContinous
Recoverytime
Capaciitance
1N914 75V 10ma 4ns 1.3pf
1N4002 100V 1000ma 3500ns 15pf
1N5625 400 3000ma 40pf
1N1084 4000 30,000ma(peak)
400 50,000ma
Lecture 2
6.101 Spring 2018 48
1N4001
1N914, 1N4148
1N7XX
Pulse Ox
Diode types
Lecture 2
Diode Circuits
6.101 Spring 2018 49Lecture 2
6.101 Spring 2018 50
RC Equation
dtdVC c
cc V
dtdVRC
Vs = 5 V
Switch is closed t<0
Switch opens t>0
Vs = VR + VC
Vs = iR R+ Vc iR =
Vs =
R
+Vc-
Vs = 5 V
RCt
sc eVV 1
RCt
c eV 15
Is RC in units of time?
Lecture 2
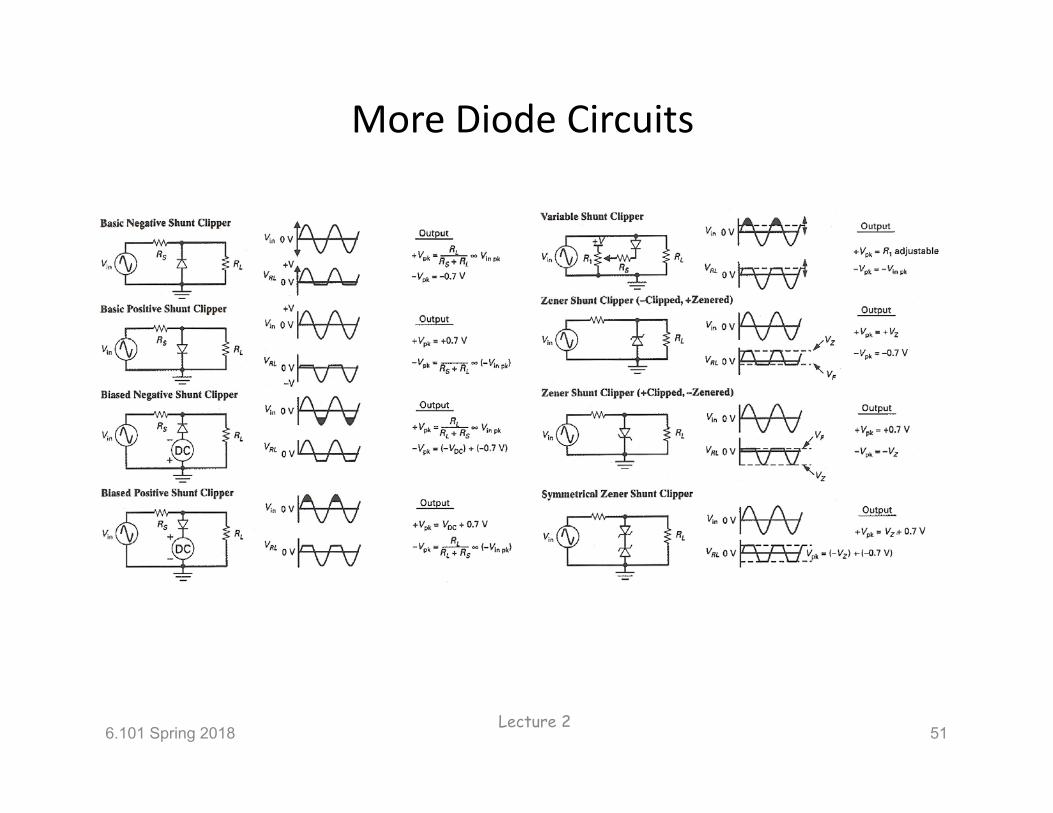
More Diode Circuits
6.101 Spring 2018 51Lecture 2
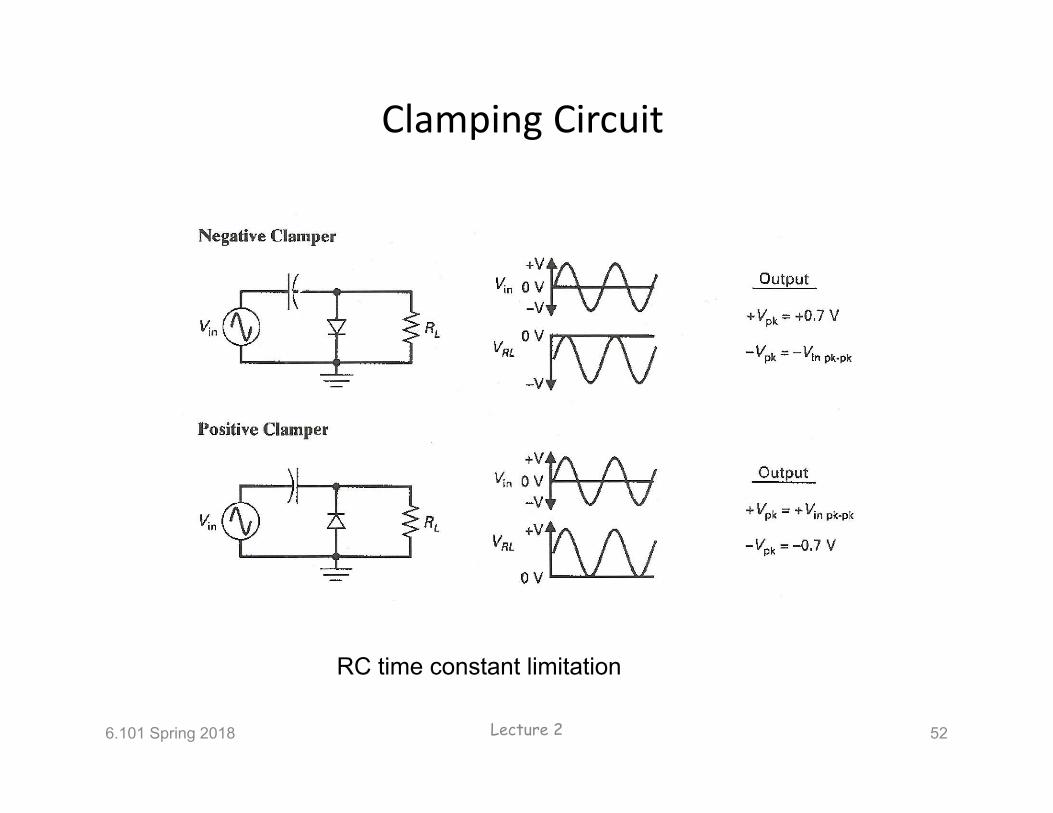
Clamping Circuit
6.101 Spring 2018 52
RC time constant limitation
Lecture 2
6.101 Lecture 2 53
Light Emitting Diode
• LED’s are pn junction devices which emit light. The frequency of the light is determined by a combination of gallium, arsenic and phosphorus.
• Red, yellow and green LED’s are in the lab• Diodes have polarity• Typical forward current 10‐20ma
6.101 2018 Lecture 2 54
Optical Isolators
• Optical Isolators are used to transmit information optically without physical contact.
• Single package with LED and photosensor (BJT, thyristor, etc.)
• Isolation up to 4000 Vrms
• Used in pulse‐oximetryNellcor DS-100 Pulse-ox
Pulse‐Oximetery
• A non‐invasive photoplethysmographical (PPG) approach for measuring pulse rate and oxygen saturation in blood.
• Oximetry developed in 1972, by Takuo Aoyagi and Michio Kishi
• Commercialized by Biox in 1981 and Nellcor in 1983.