32 Global Facility for Disaster Reduction and Recovery Resource Mobilization and Management The GFDRR is a unique, long-term partnership, and the only global financing mechanism for systematically integrating disaster risks and climate change impacts into poverty reduction and other country strategies. Using a three-track operation (described below), it offers a complete range of services, both before and after a disaster. Its financing structure is flexible and innovative, and caters to requirements of bilateral donors, U.N. agencies, international finance institutions, and private sector partners. GFDRR Funding Track I Track I, which is managed through ISDR, targets knowledge sharing and advocacy. Examples include regional cooperation on disaster risk reduction in Central America, Sub-Saharan Africa, southeastern Europe, and South Asia; and partnerships with north and south universities, academic institutions, and scientific organizations to promote disaster risk reduction in education, training, and research. Financing of Track I activities comes from the World Bank. For fiscal years 2007-09, the World Bank, through the Development Grant Facility (DGF), is contributing a total of
Transcript
32 Global Facility for Disaster Reduction and Recovery
Resource Mobilization and Management
The GFDRR is a unique, long-term partnership, and the only global financing mechanism for systematically integrating disaster risks and climate change impacts into poverty reduction and other country strategies. Using a three-track operation (described below), it offers a complete range of services, both before and after a disaster. Its financing structure is flexible and innovative, and caters to requirements of bilateral donors, U.N. agencies, international finance institutions, and private sector partners.
GFDRR Funding
Track ITrack I, which is managed through ISDR, targets knowledge sharing and advocacy. Examples include regional cooperation on disaster risk reduction in Central America, Sub-Saharan Africa, southeastern Europe, and South Asia; and partnerships with north and south universities, academic institutions, and scientific organizations to promote disaster risk reduction in education, training, and research.
Financing of Track I activities comes from the World Bank. For fiscal years 2007-09, the World Bank, through the Development Grant Facility (DGF), is contributing a total of
Integrating Disaster Risk Reduction into the Fight Against Poverty 33
US$15 million (or US$5 million per year). DGF resources are usually allocated for start-up programs like GFDRR; therefore, subsequent funding after FY09 will require the approval of the World Bank Board of Directors.
Track II Track II supports the development of national strategies and capacity building interventions. It provides ex ante support, primarily through three-year technical assistance programs, to enhance investments in risk reduction and risk transfer mechanisms. Currently it is helping to develop models for the design of risk financing projects in 11 countries, national strategies for disaster risk reduction in 24 countries, and disaster prevention and preparedness projects in seven countries.
Financing of Track II activities is made possible by contributions from various donors in the form of trust funds administered by the World Bank. To maximize flexibility in terms of contributions, GFDRR follows a two-tier financial structure: core and non-core funds. The core fund consists of untied funds that can be used to support any activity falling within the Track II mandate. Non-core funds are usually subject to donor restrictions regarding themes, activities, or regions. As of June 30, 2007, only Australia has established a non-core fund (to finance activities in Bangladesh, Cambodia, Timor-Leste, and Vanuatu). Japan and Spain have also indicated they will establish non-core funds in fiscal year 2008.
Track IIITrack III’s SRFF is a mechanism to support accelerated disaster recovery in low-income countries. The Callable Fund will accept donor funds after a specific disaster. The funds are used to bridge the gap between immediate relief efforts and longer-term reconstruction and development programs. The USAID Office of U.S. Foreign Disaster Assistance (OFDA) and the EC have expressed interest in channeling funds through the Callable Fund for quick disbursement of resources for disaster recovery.
Contributions to the GFDRR are in cash. In-kind resources may also be considered in limited cases. Under the GFDRR program charter, membership is open to eligible organizations and recipient or developing country governments. Official donors who contribute a minimum of US$3 million per year and developing countries contributing US$500,000 for a three-year period to either Track II core funds or Track III funds become members of the Consultative Group.
34 Global Facility for Disaster Reduction and Recovery
Donor Contributions
As of June 30, 2007, the GFDRR had received a total of almost US$9.4 million from Australia, Switzerland, the United Kingdom, and the World Bank (Table 1).
Table 1. Member Contributions to GFDRR Received as of June 30, 2007 (In US$ Thousands)
MEMBER CORE NON- CORE TOTAL RECEIVED
Australia 1,027 376 1,403
Switzerland 850 850
United Kingdom 1,957 1,957
World Bank 5,147 5,147
TOTAL 8,981 376 9,357
Eight donors—Australia, Switzerland, the United Kingdom, the World Bank, Denmark, Japan, Spain, and Sweden—have pledged US$55,219 million (including the US$9.4 million already received), which would cover the period until June 2010 (Table 2). Other donors, such as Canada, Luxembourg, the European Commission, France, Finland, Germany, Italy, India, Norway, and USAID are also expected to join GFDRR during fiscal year 2008.
Integrating Disaster Risk Reduction into the Fight Against Poverty 35
Table 2. Member Contributions to GFDRR Pledged as of June 30, 2007 (In US$ Thousands)
MEMBER CORE NON-CORE
Australia 3,081 1,128 a /
Denmark 7,250
Japan 3,000 3,000 b /
Spain 3,000 3,000 c /
Sweden 7,150
Switzerland 850
United Kingdom 8,760
World Bank 15,000 d /
SUBTOTAL 48,091 7,128
TOTAL 55,219
NOTE: Pledged amounts include receipts as of June 30, 2007. Except for Switzerland, all pledged amounts are for three years. Switzerland is for one year.a / Targeted to the following specific countries: Bangladesh, Cambodia, Timor-Leste, and Vanuatu.b / Targeted to the following specific countries: Sri Lanka, Pakistan, and LAO PDRc / Targeted to the following countries: Costa Rica, Ecuador, and Guatemalad / US$5 mil l ion per year for three years (FY07 to FY10) is provided as a grant to ISDR under Track I financing.
36 Global Facility for Disaster Reduction and Recovery
Expenditures
The GFDRR’s expenditures fall into the following main categories: program activities and the secretariat. As of June 30, 2007, GFDRR expenditures totaled US$7.108 million (Table 3). Of this total, US$6.762 million was earmarked for program activities—US$5 million under Track I and US$1.762 million under Track II. The Track I contribution was provided as a grant to ISDR.
A total of US$347,000 was spent on secretariat operations, including meetings of the Consultative Group, dialogue with partners of the ISDR system, and participation in advocacy events. A detailed breakdown is provided in Table 4.
Integrating Disaster Risk Reduction into the Fight Against Poverty 37
Table 3. GFDRR Expenditures for Program Activities and Secretariat Costs as of June 30, 2007 (In US$ Thousands)
EXPENSE CATEGORY EXPENDITURE
Program Activities 6,762
o /w Track I 5,000
Track II 1,762
Secretariat 347
TOTAL 7,108
Table 4. GFDRR Secretariat Expenditures (In US$ Thousands)
EXPENSE CATEGORY EXPENDITURE
Administration
Staff Costs1 225
Travel2 92
Overhead3 4
Other4 26
TOTAL 347
1 Staff Costs includes salaries and benefits of GFDRR secretariat headquarters staff (including Extended Term Consultants and Extended Term Temporaries)
2 Travel includes travel expenses of the secretariat headquarters staff, candidates / interviewees for GFDRR positions, annual meeting participants, other participants in GFDRR-sponsored events.
3 Overhead includes office space, communications & IT, computers, and other office equipment of Washington-based PMU + representation and hospitality.
4 Other includes the use of short-term consultants and other contractual services (e.g. translation, graphic design, publishing and printing, etc.)
38 Global Facility for Disaster Reduction and Recovery
Of the total of US$1.565 million transferred to fund disaster reduction efforts under Track II, a total of US$262,817 was disbursed and an additional US$105,092 was committed (Table 5). As the activities were approved by the second half of the fiscal year, an average burn rate of 24 percent was achieved. Disbursements are expected to pick up in fiscal year 2008.
Table 5. Approved Activities under Track II for FY07 – FY10, as of June 30, 2007 (by Region (In US$ Thousands)
REGIONS APPROVED TRANSFERREDDISBURSEMENT a /
(Actuals + Commitments)BURN RATE b /
Africa 2,128 496 122 25%
East Asia and Pacific 1,194 273 17 6%
Europe and Central Asia 235 20 10 52%
Latin America and Caribbean 1,169 273 109 40%
Middle East and North Africa 210 20 20 98%
South Asia 1,214 328 34 10%
Global 270 155 57 37%
TOTAL 6,420 1,565 369
a / This would refer to actual payments made and contracts already entered in the Bank’s SAP system.b / Disbursement rate as a percentage of actual amount transferred during the first year of activity.
Integrating Disaster Risk Reduction into the Fight Against Poverty 39
Annex 1: Abbreviations and AcronymsACS Association of Caribbean StatesADPC Asian Disaster Preparedness CenterADRC Asian Disaster Reduction CenterAUC African Union CommissionAU African UnionCAPRA Central American Probabilistic Risk AssessmentCAS Country Assistance StrategyCRID Regional Disaster Information Center for Latin America
and the CaribbeanDFID Department for International DevelopmentDGF Development Grant FacilityEC European CommissionECHO European Commission’s Humanitarian Aid OfficeECLAC Economic Commission for Latin America and the CaribbeanECOSOC United Nations Economic and Social CouncilECOWAS Economic Community of West African StatesEU European UnionFAO Food and Agriculture OrganizationFORSUR Fondo para la Reconstruccion del Sur
40 Global Facility for Disaster Reduction and Recovery
GFDRR Global Facility for Disaster Reduction and RecoveryHFA Hyogo Framework for Action IFIs International Financial InstitutionsIFRC International Federation of Red Cross and Red Crescent SocietiesICIMOD International Centre for Integrated Mountain DevelopmentICPAC Climate Prediction and Applications CentreIDB Inter-American Development BankIGAD Intergovernmental Authority on DevelopmentIPCC Intergovernmental Panel on Climate ChangeILO International Labor OrganizationISDR International Strategy for Disaster ReductionNGO Nongovernmental OrganizationNMHSs National Meteorological and Hydrological ServicesOECD Organization for Economic Co-operation and DevelopmentOCHA Office for the Coordination of Humanitarian AffairsPRS Poverty Reduction StrategyPRSP Poverty Reduction Strategy PaperRBMS Results-Based Management SystemREC Regional Economic CommunitiesSADC Southern African Development CommunitySida Swedish International Development Cooperation AgencySRFF Standby Recovery Financing FacilityUN United NationsUNDAF United Nations Development Assistance FrameworkUNDP United Nations Development ProgrammeUNEP United Nations Environment ProgrammeUNCCD United Nations Convention to Combat DesertificationUNFCCC United Nations Framework Convention on Climate ChangeUSAID US Agency for International DevelopmentWEF World Economic ForumWFP World Food ProgrammeWHO World Health OrganizationWMO World Meteorological Organization
Integrating Disaster Risk Reduction into the Fight Against Poverty 41
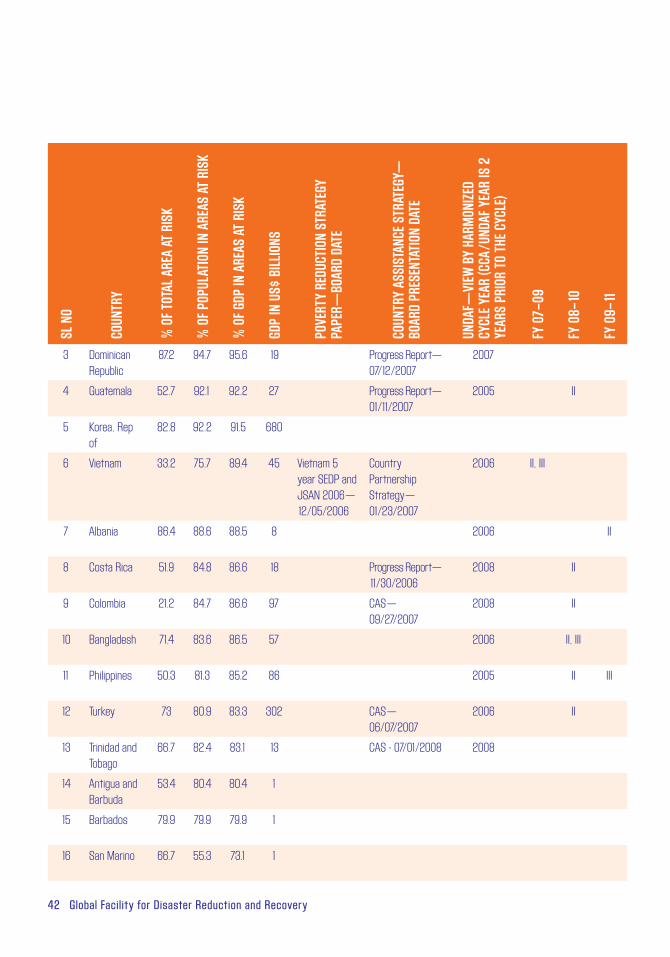
Annex 2: Natural Disaster Hot-Spot CountriesPipeline PRSs/CASs/UNDAFs in Natural Disaster Hot-Spot Countries with More than 30% GDP in Areas at Risks Due to Two or More HazardsTechnical Assistance under Tracks II and III of GFDRR
SL N
O
COUN
TRY
% O
F TOT
AL A
REA
AT R
ISK
% O
F POP
ULAT
ION
IN A
REAS
AT R
ISK
% O
F GDP
IN A
REAS
AT R
ISK
GDP
IN U
S$ B
ILLIO
NS
POVE
RTY
REDU
CTIO
N ST
RATE
GY
PAPE
R—BO
ARD
DATE
COUN
TRY
ASSI
STAN
CE S
TRAT
EGY—
BO
ARD
PRES
ENTA
TION
DAT
E
UNDA
F—VI
EW B
Y HA
RMON
IZED
CYCL
E YEA
R (C
CA/U
NDAF
YEA
R IS
2
YEAR
S PR
IOR
TO T
HE C
YCLE
)
FY 0
7–09
FY 0
8–10
FY 0
9–11
1 El Salvador 88.7 95.4 96.4 16 Progress Report— 08/30/2007