23
TEP and UES Resource Planning Workshop 1 Resource Overview Victor Aguirre Lead Supply-Side Planner

TEP and UES Resource Planning Workshop 1
Resource Overview
Victor AguirreLead Supply-Side Planner

Phoenix
Tucson
500 kV
345 kV
Luna 2005
190 MW
San Juan 1973
322 MW
SouthVail
Phil Young
Westwing
Navajo 1974169 MW
Saguaro
Four Corners 1969
112 MW
Springerville 1985-1991
800 MW
Existing Resources - Remote
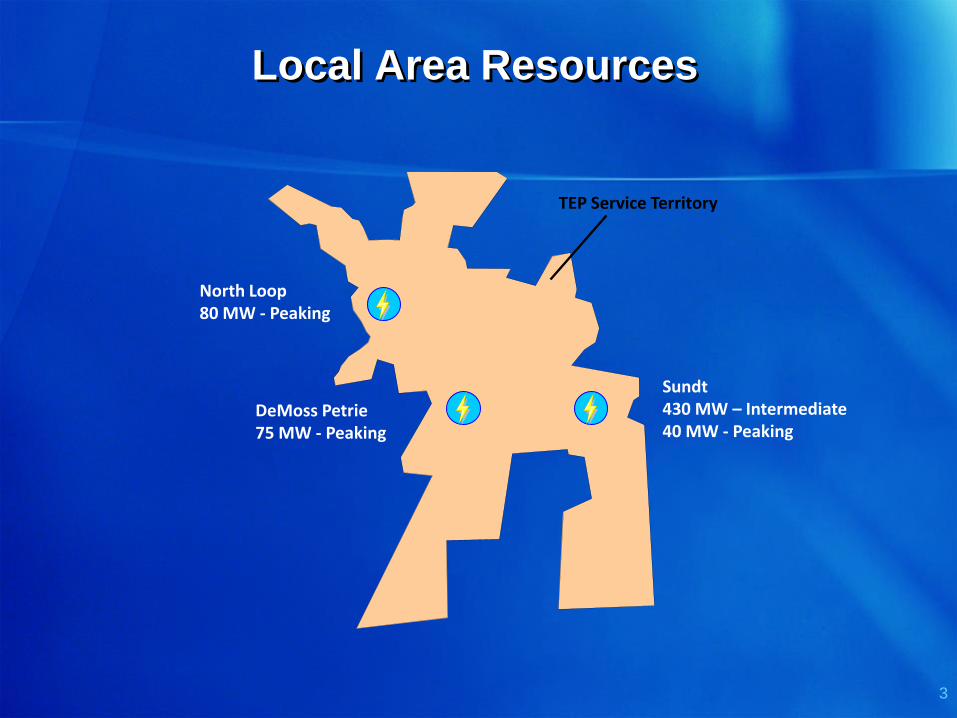
Local Area Resources
3
North Loop80 MW - Peaking
Sundt430 MW – Intermediate40 MW - Peaking
DeMoss Petrie75 MW - Peaking
TEP Service Territory

Unisource Energy Services
4
Black Mountain90 MW
Valencia 60 MW
Kingman
Nogales
Palo Verde Market

Existing Resources
Base Capacity – Coal
» Remote
» 1400 MW
Intermediate - Combined Cycle & Gas/Steam
» Local
» 620 MW
Peaking – Combustion Turbines
» Local
» 200 MW (TEP)
» 150 MW (UES)

Resource Mix - Energy
6
Coal42%
Gas35%
Nuclear 15%
Other8%
WECC Subregion - Arizona, New Mexico & So. Nevada
Coal80%
Gas20%
Tucson Electric Power
Coal70%
Gas30%
UES and TEP Aggregated

Renewable Resources
Springerville PV – 5,000 kW
Landfill Gas – 5,000 kW
Customer Sited Solar
» Residential – 2,500 kW
» Commercial – 1,500 kW

http://www.tep.com/Green/GreenWatts/SolarStats/SolarDescr.asp
Launched in 2003
Designed for staged
construction
Offsets coal burn
Reduced emissions
8
Springerville PV– 5,000 kW

http://www.tep.com/Green/Business/Solar/losreales.asp
Launched in Aug 1999
Methane byproduct of
decay
20 year plus supply
Offsets coal burn
Reduced emissions
9
Los Reales Landfill – 5,000 kW

TEP and UES Resource Planning Workshop 1
Energy Efficiency Program Overview
Denise Richerson-Smith
Director - Energy Efficiency and Renewable Programs

http://www.tep.com/Green/Business/Solar/community.asp
750 kW Global Solar
1 MW City of Tucson
2.5 MW residential systems
Community Projects:
» Reid Park Zoo
» Pima Air Museum
» Tucson Airport Auth.
» Local School Districts
» University of Arizona
11
Distributed Generation Projects – 4,000 kW

Renewable Energy Programs
Commercial & Residential
Residential Non-Residential
Biomass/Biogas
Daylighting
Geothermal
Small hydro
Solar electric-PV
Solar water heating
Solar pool heating
Wind

Residential DSM Programs
Programs TEP UNSE UNSG
Low-Income Weatherization
New Home Construction
Residential HVAC Retrofit
Shade Tree
CFL Bulb Program

Commercial DSM Programs
Programs TEP UNSE UNSG
Large Business
Small Business
Building Design
TEP and UES Resource Planning Workshop 1
Workshop 2 Thursday, October 22nd 2009
Energy Efficiency and Renewables

TEP and UES Resource Planning Workshop 1
Resource Overview
Victor AguirreLead Supply-Side Planner

Total Firm Load Obligations vs. Firm Capacity Resources
17
-
500
1,000
1,500
2,000
2,500
3,000
3,500
4,000
4,500
2010 2012 2014 2016 2018 2020 2022 2024 2026 2028
Pea
k D
eman
d (
MW
)
Remaining Peak Demand Requirements
Existing Firm PPAs
Current Resource Capacity
Total Firm Load Obligations (Retail, Firm & Planning Reserves)

2010 - TEP Load Duration & Resource Type
18
0
500
1000
1500
2000
2500
3000
0% 10% 20% 30% 40% 50% 60% 70% 80% 90%
Ho
url
y D
ema
nd
, MW
620 MW Intermediate Resources
Retail
TEP Retail & Firm Demand
Peaking Capacity Factor
1400 MW Baseload Resources
Intermediate Capacity Factor Baseload Capacity Factor
600 MW Peaking Resources (CTs & PPA)

2010 - TEP Peak Requirement
19
2000
2100
2200
2300
2400
2500
2600
2700
0% 1% 2% 3% 5% 6%
Ho
url
y D
ema
nd
, MW
TEP Retail & Firm Demand
600 MW Peaking Resources (CTs & PPA)

Future Resources
20
Need for Peaking Resources
Short Lead-Time
Responsive
Support Renewables
Reliable Technology
Market
Short-term
Flexible
Availability?
Merchant Plant Surplus?

WECC 2008 Power Supply Assessment
Power Supply Margin - 6% Operating Reserves
21
2010 2011 2012 2013 2014 2015 2016 2017 2018
Southern California - - - - - (411) (660) (917) (1,574)
Desert Southwest 7,023 6,328 4,897 2,564 330 (477) (2,089) (3,795) (5,142)
Total 7,023 6,328 4,897 2,564 330 (888) (2,749) (4,712) (6,716)
(8,000)
(6,000)
(4,000)
(2,000)
-
2,000
4,000
6,000
8,000
Po
we
r Su
pp
ly M
arg
in (M
W)

WECC 2009 Power Supply Assessment (Preliminary)
Power Supply Margin - 6% Operating Reserves
22
2010 2011 2012 2013 2014 2015 2016 2017 2018
Southern California 3,657 3,866 3,460 2,251 1,019 30 - - -
Desert Southwest 4,829 4,388 4,053 3,467 2,528 1,255 7 3 -
Total 8,486 8,254 7,513 5,718 3,547 1,285 7 3 -
-
1,000
2,000
3,000
4,000
5,000
6,000
7,000
8,000
9,000
Po
we
r Su
pp
ly M
arg
in (M
W)

TEP and UES Resource Planning Workshop 1


