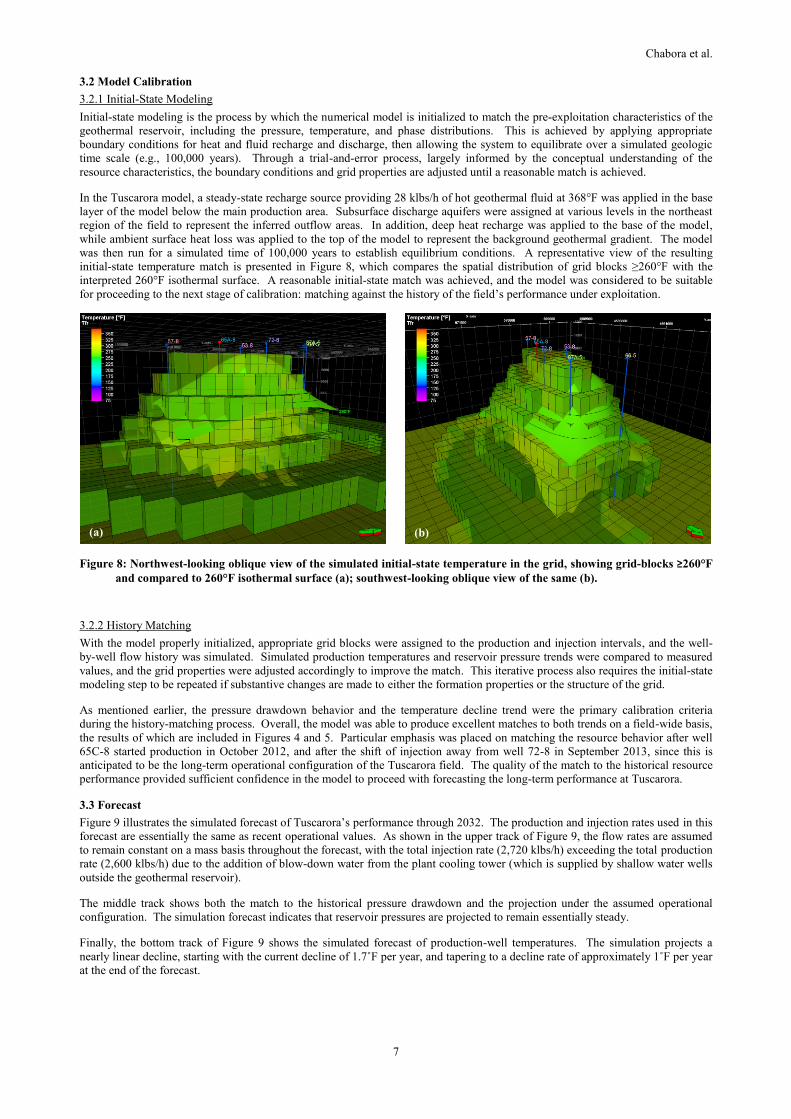
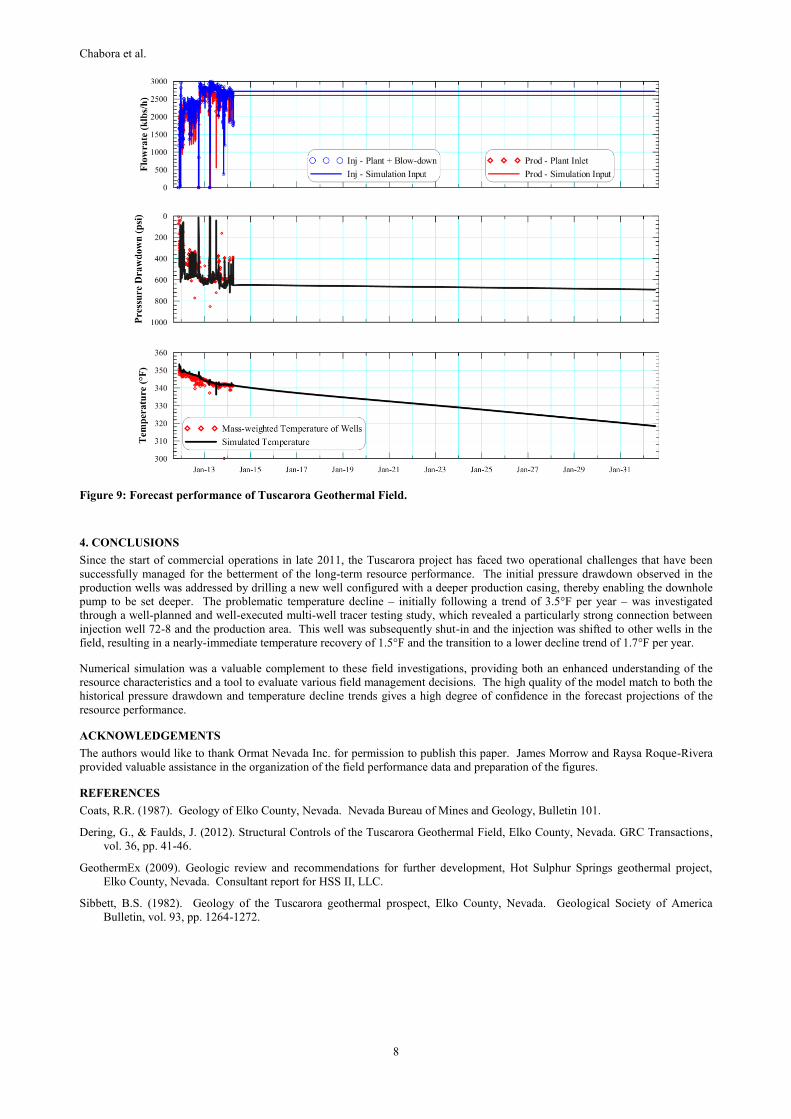
Proceedings World Geothermal Congress 2015 Melbourne, Australia, 19-25 April 2015 1 Resource Performance at Ormat's Tuscarora Geothermal Project, Nevada USA Ethan Chabora 1 , James Lovekin 1 , Paul Spielman 2 , and Zvi Krieger 2 1 GeothermEx, a Schlumberger Company, 3260 Blume Dr., Suite 220, Richmond, CA 94806 USA 2 Ormat Nevada, Inc., 6225 Neil Road, Reno, Nevada 89511 USA [email protected]Keywords: Tuscarora, tracer testing, numerical modeling, history-matching, injection strategy ABSTRACT In late 2011, Ormat Nevada, Inc. started up an 18-MW binary plant at its Tuscarora geothermal project in northeastern Nevada, USA. The project has successfully overcome two resource challenges since start-up. First, the initial drawdown in reservoir pressure was too large to allow use of the original discovery well when a downhole production pump was installed. This was rectified by drilling an additional production well with a casing configuration that allowed a greater pump-setting depth, and the plant is now operating with stable reservoir pressures. Second, the project experienced an undesirable decline in plant inlet temperatures in its first year and a half of operation. This was addressed by shutting in one injection well that was shown by tracer testing to be communicating too directly with production wells. Temperature declines at the plant inlet have now been reduced to a level compatible with long-term commercial operations. Numerical modeling of the reservoir has closely matched the trends in reservoir pressures and temperatures and has been valuable in forecasting project performance. 1. INTRODUCTION In 2010, Ormat Nevada Inc. acquired the Tuscarora geothermal project located in the north-central Basin and Range province of Nevada, USA (Figure 1). Building on exploration efforts from the late 1970s to the early 2000s by previous developers (some of whom referred to the project as Hot Sulphur Springs), Ormat drilled three commercially productive wells (65A-8, 65B-8, and 65C-8; see Figure 1), which have been supplying all of the production to the 18-MW binary plant since March 2012. Single-phase liquid at a recent average temperature of 342°F is produced from a fractured, permeable zone in the Paleozoic basement sediments between 4,500 and 5,000 feet below ground surface. Re-injection of the cooled production brine generally occurs in a shallower interval within Tertiary volcanics (between 2,000 and 3,000 feet below ground surface) and is more widely distributed between four wells to the north of the production area (66-5, 66A-5, 87A-5, and 53-8). One well to the south (57-8) injects predominantly blow-down water from the power-plant cooling towers. This operational configuration has evolved over the course of the historical production period as a result of the initial drawdown in reservoir pressure in the production area along with a prolonged period (nearly 2 years) of production temperature decline of approximately 3.5°F per year. Multi-well tracer testing was an important key to understanding the hydrogeologic connections between the wells, and the results were used in conjunction with numerical simulation to revise the operational scheme, which reduced the rate of temperature decline by a factor of two starting in September 2013. 1.1 Geologic and Structural Setting Tuscarora is located approximately 50 miles northwest of Elko, Nevada, in the north-central part of the Basin and Range province, in an area between the Independence and Tuscarora mountain ranges known as Independence Valley. Surface expressions of the geothermal system include a long, narrow, silica-sinter terrace (~1,000 m long by ~35 m wide) which follows a NNE trend along Hot Creek, as well as a cluster of boiling springs and fumaroles located about half a mile NE of the main production area (Figure 1). The geology of the field has been described in several prior studies, including Sibbett (1982), Coats et al. (1987), GeothermEx (2009), and Dering and Faulds (2012). The geothermal reservoir is contained in both Tertiary and Paleozoic (basement) rock. The Paleozoic rocks in this area consist of a deep marine sedimentary/volcanic sequence (sandstone, shale, chert, quartzite, and basalt) which has been thrust over a shallow marine sequence (silty limestone and dolomite). Because of their age, the Paleozoic rocks are more indurated, have generally lower porosity and permeability, and have been subjected to far more disruption by faulting and folding compared to the overlying Tertiary rocks. Although the Paleozoic rocks tend to have low porosity, they are relatively strong and brittle compared to the Tertiary rocks, and consequently they can generally sustain open fractures better than the Tertiary rocks. As a result, fracture permeability in the Paleozoics can be a major source of fluid flow to geothermal wells. In contrast, the stratigraphy of the Tertiary rocks is simpler. Most of the Tertiary rocks are of volcanic origin and include thick sequences of tuff, fine sediments, and interstratified lava flows. Although these rocks can be quite porous, they tend to have low permeability except in fractured lava flows or in stratified zones of coarse volcanic breccia. Wells in the Tuscarora field have also encountered permeable entries at the unconformable contact between the Tertiary and Paleozoic rocks. Dering and Faulds (2012) have characterized the structural features of the Tuscarora field as a semi-continuous system of NNE- to NNW-striking, west-dipping normal faults, kinematically linked by a broad left step-over and relay ramp. The geothermal system is interpreted to lie along the hinge line of an anticlinal accommodation zone, in which a series of west-dipping faults overlap with east-dipping faults. The pattern of faulting within the step-over is diffuse, with most individual faults being discontinuous along strike and exhibiting relatively minor offsets. These sets of oppositely dipping, small-offset normal faults within the hinge zone are
Transcript
Proceedings World Geothermal Congress 2015
Melbourne, Australia, 19-25 April 2015
1
Resource Performance at Ormat's Tuscarora Geothermal Project, Nevada USA
Ethan Chabora1, James Lovekin
1, Paul Spielman
2, and Zvi Krieger
2
1GeothermEx, a Schlumberger Company, 3260 Blume Dr., Suite 220, Richmond, CA 94806 USA
2Ormat Nevada, Inc., 6225 Neil Road, Reno, Nevada 89511 USA