Resources, Conservation and Recycling xxx (2010) xxx–xxx
Contents lists available at ScienceDirect
Resources, Conservation and Recycling
journa l homepage: www.e lsev ier .com/ locate / resconrec
pen-loop recycling: A LCA case study of PET bottle-to-fibre recycling
i Shena,∗, Ernst Worrellb, Martin K. Patela
Department of Science, Technology and Society, Faculty of Science, Utrecht University, Heidelberglaan 2, 3584CS Utrecht, NetherlandsDepartment of Innovation and Environmental Sciences, Faculty of Geosciences, Utrecht University, Netherlands
r t i c l e i n f o
rticle history:eceived 11 December 2009eceived in revised form 30 June 2010ccepted 30 June 2010
This study assesses the environmental impact of polyethylene terephthalate (PET) bottle-to-fibre recy-cling using the methodology of life-cycle assessment (LCA). Four recycling cases, including mechanicalrecycling, semi-mechanical recycling, back-to-oligomer recycling and back-to-monomer recycling wereanalysed. Three allocation methods are applied for open-loop recycling, i.e. the “cut-off” approach, the“waste valuation” approach and the “system expansion” approach. Nine environmental impact indicatorswere analysed, i.e. non-renewable energy use (NREU), global warming potential (GWP), abiotic depletion,acidification, eutrophication, human toxicity, fresh water aquatic ecotoxicity, terrestrial ecotoxicity andphotochemical oxidant formation. The LCA results are compared with virgin PET fibre and other com-modity fibre products, i.e. cotton, viscose, PP (polypropylene) and PLA (polylactic acid). The LCA resultsshow that recycled PET fibres offer important environmental benefits over virgin PET fibre. Depending
nvironment impactechanical recycling
hemical recyclingHG emissions
on the allocation methods applied for open-loop-recycling, NREU savings of 40–85% and GWP savings of25–75% can be achieved. Recycled PET fibres produced by mechanical recycling cause lower environmen-tal impacts than virgin PET in at least eight out of a total of nine categories. Recycled fibres produced fromchemical recycling allow to reduce impacts in six to seven out of a total of nine categories compared tovirgin PET fibres. Note that while mechanical recycling has a better environmental profile than chemicalrecycling, chemically recycled fibres can be applied in a wider range of applications than mechanicallyrecycled fibres.
. Introduction
Polyethylene terephthalate (PET) bottles have experiencedapid growth since the 1970s when the technique of blow mould-ng was introduced (Glenz, 2007). Today, bottle grade PET isne of the most important packaging plastics. In 2007, theorldwide consumption of bottle grade PET was 15 million met-
ic tonnes (106 metric tonnes or Mt) (Simon and Schnieders,009), representing 8% of the total demand of standard plastics.1
eanwhile, recycling of post-consumer PET bottles has becomewell-established system with its own logistic chain includ-
Please cite this article in press as: Shen L, et al. Open-loop recycling: A L(2010), doi:10.1016/j.resconrec.2010.06.014
ng bottles collection, flake production and pellet production.n 2007, approximately 4.5 Mt of PET bottles were collectednd recycled into 3.6 Mt of flakes worldwide (Thiele, 2009).ost of the recycled PET flakes were converted into fibres
1 According to PlasticsEurope’s definition, “Standard Plastics” refer to stan-ard thermoplastics, including PE (polyethylene), PP (polypropylene), PVCpolyvinylchloride), PS (polystyrene), EPS (expanded polystyrene) and PET (bottlerade).
(Fig. 1). Recycled PET fibre accounted for approximately 8% ofthe world PET fibre production in 2007 (JCFA, 2008; Thiele,2009).
In Europe, the amount of collected post-consumer PET bottlewaste has increased from 0.2 Mt in 1998 to 1.26 Mt in 2008 (Petcore,2008), representing an annual growth rate of approximately 19%(see Fig. 2). About 40% of all used PET bottles in Europe were col-lected for recycling in 2009 (PlasticsEurope, 2009a). It is expectedthat PET bottle waste collection in Europe will continue to increaseby 10% p.a. in the near future (Glenz, 2007) (see Fig. 2).
The primary purpose of this study is to understand the envi-ronmental impacts of recycled PET fibre compared to virgin PET.Several studies reported the environmental impacts of PET recy-cling (Arena et al., 2003; Detzel et al., 2004; Song and Hyun, 1999).In these studies, PET recycling was seen as a post-consumer wastemanagement option and was compared with other options such aslandfilling and incineration. The goal of this study is not to anal-yse different waste management options, but to understand the
CA case study of PET bottle-to-fibre recycling. Resour Conserv Recy
environmental impact of making recycled PET fibres.The second purpose of this study is to apply different alloca-
tion methods for this open-loop-recycling case. In LCA, there hasbeen so far no standardised procedure for open-loop recycling. Sev-eral studies have discussed this methodological problem (Ekvall,
Please cite this article in press as: Shen L, et al. Open-loop recycling: A L(2010), doi:10.1016/j.resconrec.2010.06.014
ARTICLE ING Model
RECYCL-2313; No. of Pages 19
2 L. Shen et al. / Resources, Conservation a
Fig. 1. Application of recycled PET flakes, worldwide 2007, based on data fromNoone (2008).
Fig. 2. Collected post-consumer waste PET bottles in Europe over the last 10 yearsbased on data from Forum-PET (2009) and Petcore (2009b) and the estimate for thenear future based on 10% p.a. growth rate (Glenz, 2007). Virgin PET consumptiondata were obtained from (Glenz, 2004; PlasticsEurope, 2009a).
Table 1Product systems in this study, comparing type of fibre, property and application.
Recycling case 1 Recycling case 2 R
Technology Mechanical Semi-Mechanical Cb
Current technology level Large scale production Large scale production S
Inventory data Wellman InternationalLtd. (Wellman)
Long John Group (LJG) FaC
Geographic scope Western Europe Taiwan TType of fibre studied Staple Filament (POY) Fi
Property High to medium denier High to medium denier MStaple Staple and filament MNo-microfibre Limited microfibre M
Application Non-woven Footwear ATechnical end use Technical textile S
Bags MLia
Abbreviations: BHET: bis-hydroxylethylene terephthalate; DMT: dimethyl terephthalate;a See data sources in Sections 2.2 and 3.3.2.b See data sources in Section 2.2.
PRESSnd Recycling xxx (2010) xxx–xxx
2000; Ekvall and Tillman, 1997; Klöpffer, 1996; Werner and Richter,2000). A common practice is to follow the “cut-off” principle whichdistinguishes the first life (virgin product) and the second life (recy-cled product) as separate systems; the post-consumer waste fromthe first life does not bear any environmental burden when it isused as the feedstock in the second life. The cut-off rule has beenwidely applied for recycled or recovered products. For example inthe Ecoinvent database, heat recovered from waste incinerationis considered free of environmental impact (Frischknecht et al.,2007a). Another example is the EU Directive 2009/28/EC, in whichcrude glycerol is treated as waste and is considered to be free ofgreenhouse gas emissions (EU Directive, 2009). The cut-off methodis considered simple and easy to apply, because no data of the firstlife is needed.
In this study, we started the analysis with the “cut-off” approach.Two alternative methods were introduced in order to furtherdevelop the methodology for open-loop recycling. The first alter-native method is the “waste valuation” method, which follows theprinciple of economic allocation. The second alternative methodis the “system expansion” method, in which the entire system(cradle-to-grave) is analysed.
Four PET recycling cases are investigated in this study,including mechanical recycling, semi-mechanical recycling, back-to-oligomer recycling and back-to-monomer recycling. For eachof the first three types of recycling technologies, the respectiveprocess data for the year 2008 were provided by three compa-nies. Due to confidentiality issues, no plant data were available forback-to-monomer recycling. Therefore, the analysis was performedbased on publicly available information. Virgin PET fibre producedin Western Europe was taken as the reference system. In addition,the LCA result was compared with commodity fibres, i.e. cotton,viscose and polypropylene (PP) as well as novel bio-based fibres,i.e. man-made cellulose fibres (Viscose and Tencel) and polylacticacid (PLA) fibres.
2. Methodology
CA case study of PET bottle-to-fibre recycling. Resour Conserv Recy
LCA has been standardised by the ISO 14040 series, namely:
• ISO 14040: 2006 – Principles and framework (ISO, 2006a); and• ISO 14044: 2006 – Requirements and guidelines (ISO, 2006b).
ecycling case 3 Recycling case 4 Reference
hemical,ack-to-BHET recycling
Chemical,back-to-DMT recycling
Single-use Virgin PET
mall scale production Small scale or pilotscale production
Large scale production
r Eastern Newentury Co. (FENC)
Literature dataa Literature datab
aiwan Western Europe Western Europelament (POY) Filament (POY) Staple and filament (POY)
edium to low denier Medium to low denier Full denier rangeainly filament Mainly filament Staple and filamenticrofibre Microfibre Microfibre
pparel Performance apparel Non-wovenoft hand feel Soft hand feel Appareloisture management Moisture management Performance apparelmited colours
L. Shen et al. / Resources, Conservation and Recycling xxx (2010) xxx–xxx 3
F ET bo
2
2
ruiaytpasoP
cmvtmvodvmfi
the “cradle” stage of the recycled product. As default case, wechoose the conventional “cut-off” approach to define the systemboundary.2 Fig. 3 illustrates the concept of the “cut-off” approach:the first life and second life are cut into two independent product
ig. 3. Cradle-to-factory gate system boundary of recycling PET fibres from waste P
.1. Goal, functional unit and system boundary
.1.1. Goal and functional unitThe goal of this LCA is to assess the environmental impacts of
ecycled PET fibre compared with virgin PET fibre. The functionalnit is defined as “one metric tonne of fibre”. Fibres are important
ntermediate products for the textile and nonwoven industry. Therere two types of PET fibre, staple fibre and POY (partially orientedarn, which is generally called filament fibre). It should be notedhat staple fibre and POY are different products in terms of materialroperties and consequently, they are used for different end-usepplications (see Table 1). The goal of this LCA is not to comparetaple fibre with POY, but to understand the environmental impactsf recycled PET fibres compared with the two main types of virginET fibres.
The chosen functional unit implies the assumption that recy-led PET fibre and virgin PET fibre are functionally equivalent. Oneay argue that recycled fibre might not reach the same quality as
irgin fibre. However, it depends on the recycling technology andhe scope of such a comparison. For chemical recycling back-to-
onomers, the quality of the recycled polymer is identical withirgin polymer. PET fibre produced by chemical recycling back-to-
Please cite this article in press as: Shen L, et al. Open-loop recycling: A L(2010), doi:10.1016/j.resconrec.2010.06.014
ligomers has very similar properties as virgin fibres except foryeability, which is generally inferior to that of virgin fibre (Pri-ate communication with Far Eastern New Century Co., Ltd.). Forechanical and semi-mechanical recycling, the quality of recycled
bre strongly depends on the purity of the waste stream. According
ttles, splitting the first life and the second life based on the “cut-off” approach.
to one of the recycling companies investigated in this study, recy-cled staple fibre can reach the same quality as virgin staple fibreif a clean bottle source is used, bottles are properly sorted and theimpurities are carefully removed. In addition, because polyesterhas such a wide range of applications, it is always possible to findsuitable applications for recycled fibres, where virgin fibres are alsoused.
2.1.2. System boundaryThe scope of this LCA is cradle-to-factory gate. For a virgin prod-
uct, this includes all steps from the extraction and transportationof raw materials and fuels, followed by all conversion steps untilthe product – i.e. fibre – is delivered at the factory gate. The pro-duction of the end product (e.g. a shirt), the use phase and thepost-consumer waste management are excluded. A cradle-to-graveanalysis, including the waste disposal phase but excluding the usephase, is discussed in Section 5.2.
For open-loop recycling, it is typically a problem to define
CA case study of PET bottle-to-fibre recycling. Resour Conserv Recy
2 It is considered “conventional” because this method has been applied for manyrecycled products, such as secondary steel, aluminium and glass (Frischknecht etal., 2007a; ISO, 2006a).
4 L. Shen et al. / Resources, Conservation and Recycling xxx (2010) xxx–xxx
Table 2Data sources of this study.
Data Sources Note
PET bottle-to-fibre recycling Collected from three recycled PET fibreproducers (Wellman, LJG and FENC).
Site-specific, for year 2008.
Grid electricity Ecoinvent v2.0 (Frischknecht et al., 2007b); Country-specific.OECD and non-OECD country energybalances 2005/2006 (IEA, 2008a; 2008b).
European electricity mix: 65% from theUCTEa grid, 13% from the NORDELa grid, 9%from the CENTRELa grid, 12% from the UKgrid and 1% from the Irish grid.Taiwan electricity fuel mix: 58% coal, 20%nuclear, 12% natural gas, 8% oil and 3%renewables.
Production and combustion ofnatural gas, LPG, fuel oil anddiesel
Ecoinvent v2.0 (Jungbluth, 2007; FaistEmmenegger et al., 2007); EIAstatistics(EIA, 2008); US EPA report(USEPA, 2008).
Country-specific energy profiles, except forLPGa for which global data is used based onEcoinvent database.
Production of chemicals Ecoinvent v2.0 (Althaus et al., 2007a). Western Europe mid-2000 technologylevel.
Transportation distances andmeans for raw materials,chemicals and intermediateproducts
Collected from three recycled PET fibreproducers (Wellman, LJG and FENC).
Road and water transportation Ecoinvent v2.0 (Spielmann et al., 2007). 32 t lorry for road transportation.Water transportation refers totransoceanic shipping.
Rail transportation Ecoinvent v2.0 (Frischknecht et al., 2007b;Spielmann et al., 2007).
Only occurs in France, modified by Frenchgrid electricity data in Ecoinvent.
Virgin polymer production Plastics Europe Eco-Profiles (Boustead,2005a,b).
Western Europe polymer production.
Energy use for staple andfilament fibre spinningprocess (for melt-spinningvirgin PET fibre)
Assumption based on (Brown et al., 1985):0.64 kWh electricity and 5 MJ heat (fromfossil fuel) per kg fibre.
This data was cross-checked by polyesterindustry experts.
f ElectS , Nethc TRELP
sfirto
tavit
2
dnLb“atmPeb2
a Abbreviation: UCTE stands for Union for the Co-ordination of Transmission owitzerland, Germany, Spain, France, Greece, Croatia, Italy, Luxemburg, Macedoniaountries power association, including Denmark, Norway, Finland and Sweden. CENoland and Slovakia. LPG stands for Liquefied Petroleum Gas.
ystems. Based on the cut-off principle, the used bottles from therst life are considered to be waste; waste does not bear any envi-onmental burden from the first life. We follow this rule and definehe “cradle” of the second life as the collection and transportationf used PET bottles.
Next to the “cut-off” approach we introduce, apply and discusswo alternative methods, in Chapter 5, namely the “waste valu-tion” method and the “system expansion” method. The “wastealuation” method has the same scope as the “cut-off” approach,.e. cradle-to-factory gate. The “system expansion” method covershe entire system from cradle-to-grave.
.2. General data and assumptions
The geographic boundary covers Western Europe and Taiwanepending on the product system (Table 1). All three compa-ies recycle PET bottles on a large scale. Wellman Internationaltd. (in short “Wellman”) recycles about 10% of the collectedottles in Europe every year. Both Long John Group (in shortLJG”) and Far Eastern New Century Co., Ltd. (in short “FENC”)re among the largest recycling companies in Taiwan. Thus,he result of this analysis is expected to be representative for
Please cite this article in press as: Shen L, et al. Open-loop recycling: A L(2010), doi:10.1016/j.resconrec.2010.06.014
echanical recycling of PET in Europe and in Taiwan. The virginET fibre produced in Western Europe is chosen as the refer-nce system. The LCI data of virgin PET polymer production isased on average technology in Western Europe (PlasticsEurope,009b). The transportation of raw materials, intermediate prod-
ricity; countries included in UCTE are Austria, Bosnia and Herzegovina, Belgium,erlands, Portugal, Slovenia and Serbia and Montenegro. NORDEL stands for Nordicstands for Central European power association, including Czech Republic, Hungary,
ucts and fuel is included in the system boundaries. A detaileddescription of the recycling process can be found in Chapter3.
For all three recycling companies, the inventory data was pro-vided for the year of 2008. For both virgin polymer production andthe inventory data from the Ecoinvent database, the productionrepresents the technologies in the 2000s (Frischknecht et al., 2007a;PlasticsEurope, 2009b).
The data for heat and power generation, chemical pro-duction, transportation, waste management and virgin poly-mer production were obtained from various sources includingLCA databases, scientific publications, governmental statisticsand personal communication. Table 2 provides a summaryof the general data and assumptions. For chemical recy-cling back to dimethyl terephthalate (DMT), our attempt toobtain data was not successful due to confidentiality issues.The analysis was carried out based on the information avail-able from the public domain. The detailed assumptions anddata sources used for this case are described in Section3.4.2.
Since the chosen allocation methods may strongly influence theoutcome of LCA studies we summarize here which methods are
CA case study of PET bottle-to-fibre recycling. Resour Conserv Recy
applied and which system they refer to:
1. As mentioned in Section 2.1, the “cut-off” approach is appliedas the default method for open-loop recycling. An alternativeallocation based on economic values (“waste valuation” method)
and an approach which follows the “system expansion” principlewill be discussed in Chapter 5.
. By-products from the flake production, mainly consisting ofcoloured bottles and polyethylene (PE) and accounting for about6–11% of the total mass of the input, are allocated based on eco-nomic values. The average selling prices of both by-products andmain products (flakes) were provided by the companies for theyear 2008, resulting in the economic value of the by-products oftypically 5–6% of the total value of the products.
. The system expansion method is applied for the process wasteand for post-consumer solid waste which is assumed to bedisposed of in a municipal solid waste incineration (MSWI)facility with energy recovery. Credits were assigned to therecovered electricity and/or heat since the production of thegrid electricity and/or heat can be avoided. In Western Europe,the energy recovery rate in primary energy terms is approx-imately 60% in primary energy term (private communicationwith Dr. Reimann of CEWEP) (IEA, 2008b; Reimann, 2006). InTaiwan, the energy recovery rate of an average waste-to-energyfacility is approximately 43% in primary energy term (TWEPA,2009a,b).
.3. Environmental impact assessment
In life-cycle impact assessment (LCIA), the life-cycle inventoryata, which represent all emissions released by the product sys-em to the environment and all raw material requirements, areonverted into environmental impact categories. The results areenerally referred to as LCA mid-point results. In this study, thenvironmental indicators are: NREU (non-renewable energy use),WP (global warming potential) (IPCC, 2007) and the indicators
rom the CML 2 baseline 20013 impact assessment method (Guinéet al., 2001; CML, 2008), namely abiotic depletion, acidification,utrophication, human toxicity, fresh water aquatic ecotoxicity,errestrial ecotoxicity and photochemical oxidant formation. Forhemical recycling via the DMT route, due to the limited data avail-bility, only NREU and GWP were assessed.
In addition, normalisation was performed using CML normalisa-ion factors for World 2000 (see Table 3). This step determines theelative contribution of the product system to the impact categoriest a global level. The normalised results do not imply weightingf the impact categories, they merely give an indication to whichxtent the product system contributes to the total environmentaloads of a region for a given year.
Please cite this article in press as: Shen L, et al. Open-loop recycling: A L(2010), doi:10.1016/j.resconrec.2010.06.014
3 CML: Centrum voor Milieuwetenschappen Leiden (Institute of Environmentalciences), Leiden University, the Netherlands.
PRESSnd Recycling xxx (2010) xxx–xxx 5
3. Recycling PET bottles into fibre
3.1. Collection of used PET bottles
In Western Europe, used PET bottles are collected eitherunder the GreenDot scheme (http://www.gruener-punkt.de), orunder other schemes, such as a mandatory deposit system(PlasticsEurope, 2008). In Taiwan, used PET bottles are collectedeither together with other household waste before they are sortedout manually (http://www.epa.gov.tw), or via the deposit–refundsystem (TWEPA, 2004). In all cases, used PET bottles are collectedon a local scale, e.g. they are from consumers and brought to awaste separation centre where bottles are sorted out, baled andcompacted. The energy consumption related to sorting, baling andcompacting is very small compared to the energy requirements ofthe recycling process (Arena et al., 2003; Detzel et al., 2004). Inthis study we assume that the energy requirements associated withsorting, baling and compacting are negligible.
The major environmental burdens from the collection step arerelated to the fuel consumption and air emissions from the trans-portation of baled bottles (i.e. from waste separation centres to flakeproduction facilities). In the case of Wellman’s recycling operationin Western Europe, the baled bottles are transported by truck overa distance of about 300–400 km. In the case of the two recyclingcompanies in Taiwan, the baled bottles are transported by truckfor about 100–350 km.
3.2. Production of recycled PET flakes
Fig. 4 shows the flowsheet of the production of recycled PETflakes. After baled bottles are opened, loose bottles are sorted bycolour and material type. Transparent (uncoloured) bottles have ahigher economic value than blue and green ones. The unwantedcolour fractions and unwanted materials (e.g. paper and metal) areeither sold as by-products, or disposed of in local municipal solidwaste (MSW) management facilities or landfilled, depending onthe available local infrastructure. MSW can be incinerated with orwithout energy recovery. Next, the bottles are sorted. The typicalplant in Europe uses automated sorting (through colour recogni-tion technology), while the Asian producers use manual sorting.Some producers wash the bottles with hot water to remove thelabels before the sorting process. The plastics labels are either soldas by-products (mainly consisting of LDPE and/or PVC), or sent tolocal MSW management. The bottles are then chopped into flakes,followed by a float separation step to separate PET from other plas-tics (e.g. HDPE caps) based on density differences. PE obtained fromthis step is sold as a by-product. The PET flakes are then washed ina cleaning solution, rinsed and dried. In some production lines, asecond chopping step (also called “fine crushing”) is required toensure that the PET flakes meet the quality requirements. Finally,the dried PET flakes are ready to be transported to a pellet plant ora fibre plant.
3.3. Mechanical and semi-mechanical recycling
Mechanical recycling is the physical conversion of flakes intofibre or other products by melt-extrusion. Currently, there are twoways to produce recycled fibre from mechanical recycling:
(1) directly extrude flakes into fibre; or more commonly,(2) first convert flakes into pellets or chips (pelletizing) and then
CA case study of PET bottle-to-fibre recycling. Resour Conserv Recy
melt-extrude pellets or chips into fibre.
3.3.1. Flake to fibre (mechanical, Wellman International Ltd.)Wellman produces recycled PET staple fibre directly from melt
extrusion of recycled PET flakes (see the left graph of Fig. 5). After
6 L. Shen et al. / Resources, Conservation and Recycling xxx (2010) xxx–xxx
ET fla
flattwbi
3G
eutaitpfigtca2
Fig. 4. Producing recycled P
akes are off-loaded, they are dried in a column dryer before theyre melt-extruded. The extruded polymer is filtered before it passeshrough the spinneret where filament spinning takes place. Afterhe filaments pass a denier setter, they enter the finishing processhere the spun filaments are drawn, dried, cut into staple fibre and
aled. Approximately 1% of the flakes end up as solid waste whichs disposed of in a landfill.
.3.2. Flake to pellet, then to fibre (semi-mechanical, Long Johnroup)
In many other mechanical recycling plants, flakes are firstxtruded into pellets and then converted into fibre and other prod-cts. LJG (Long John Group) produces recycled PET fibre throughhe flake-pellet-fibre route (see the right graph of Fig. 5). PET flakesre dried prior to the melt-extrusion step. The extruded polymers further purified through a filtration step. After a cooling process,he polymer is pelletized and dried. The PET pellets are then trans-orted to the fibre spinning plant where they are melt-spun intolament fibre (POY). In LJG’s process, a small amount of ethylene
Please cite this article in press as: Shen L, et al. Open-loop recycling: A L(2010), doi:10.1016/j.resconrec.2010.06.014
lycol (EG) is added to meet the final quality requirements. Weherefore classify LJG’s process as a semi-mechanical recycling pro-ess. The solid waste from the recycling process is disposed of inMSWI with electricity recovery (recovery rate = 43%, see Section.2).
kes from baled PET bottles.
3.4. Chemical recycling
In chemical recycling, PET polymer is broken down intomonomers or oligomers via various depolymerisation technolo-gies. Chemical recycling is more expensive than mechanicalrecycling. It usually requires a large scale in order to becomeeconomically feasible (Petcore, 2009a). The important advan-tage of chemical recycling is that the quality of virginPET can be achieved. Current commercially available chemi-cal recycling technologies include glycolysis, methanolysis andalkaline hydrolysis (Petcore, 2009a). In our study, recycledPET produced via the glycolysis route was analysed basedon data received from Far Eastern New Century (FENC). Themethanolysis route was analysed based on publicly availabledata.
3.4.1. Glycolysis to BHET (chemical recycling, back-to-oligomer,Far Eastern New Century Co., Ltd. (FENC))
Fig. 6 shows the back-to-oligomer recycling by FENC. The glycol-ysis of PET yields the oligomer bis-hydroxyl ethylene terephthalate
CA case study of PET bottle-to-fibre recycling. Resour Conserv Recy
(BHET). The process is usually conducted in a temperature rangebetween 180 and 250 ◦C with excess EG and in the presence ofcatalysts (Paszun and Spychaj, 1997). After the glycolysis pro-cess, the oligomer passes through a fine filtration step before itis repolymerised into PET. The recycled polymer is then spun
L. Shen et al. / Resources, Conservation and Recycling xxx (2010) xxx–xxx 7
ia me
if2
3m
aarc1ti
it(ae
dtaC
P
Fig. 5. Producing recycled PET fibre from PET flakes v
nto fibre. The process solid waste is disposed of in a MSWIacility with electricity recovery (recovery rate = 43%, see Section.2).
.4.2. Methanolysis to DMT (chemical recycling, back toonomer)
In methanolysis, PET is depolymerised with methanol to DMTnd EG in the presence of catalysts under a pressure of 2–4 MPand a temperature of 180–280 ◦C (Paszun and Spychaj, 1997). Theeaction mix is cooled and DMT is recovered from the mix via pre-ipitation, centrifugation and crystallization (Paszun and Spychaj,997). Fig. 7 shows the flowsheet for chemical recycling of PET viahe methanolysis route. The recycled polymer is then convertednto fibre via spinning and finishing processes.
A recent patent by Teijin (Nakao et al., 2003) illustrates that PETs depolymerised with EG and sodium carbonate to yield BHET;he BHET is then further broken down into DMT with methanolDelattre et al., 1976). This process is considered more economicallyttractive than the direct methanolysis of PET into DMT (Lorenzettit al., 2006).
The methanolysis route is commercially operated but no processata could be obtained. In this study, we use publicly available data
Please cite this article in press as: Shen L, et al. Open-loop recycling: A L(2010), doi:10.1016/j.resconrec.2010.06.014
o estimate the NREU and GWP (the available data did not allow tolso include the environmental impact categories according to theML method).
Our estimate is primarily based on the LCA published byatagonia (2005) for recycled DMT. According to Patagonia’s LCA
chanical (left) and semi-mechanical (right) recycling.
results, the cradle-to-factory gate non-renewable energy require-ments (NREU) and GHG emissions of 1 t of recycled DMT are11.96 GJ and 0.98 t CO2 equiv., respectively. The “cradle” of Patago-nia’s LCA follows the “cut-off” rule since the cradle was defined ascollection of PET waste.
Based on the stoichiometric equation, depolymerising 1000 kgof PET requires 333 kg methanol and yields 1010 kg of DMT (or76% by weight) and 323 kg EG (or 24% by weight). Patagonia’s LCAresults were allocated based on the weight of the products. Usingthis information we estimate that the NREU and GWP values forthe total process yielding 1 t of DMT and 0.32 t of EG are 15.78 GJ/tDMT and 1.29 t CO2 equiv./t DMT, respectively (here, the energy useand the emissions related to EG production have been assigned toDMT).
The material efficiencies and the monomer recovery rates arenot published by Patagonia. We assume three cases, namely, a lowcase, a high case and an average case. In the low case, the PET lossis assumed zero, which is the theoretical optimum (stoichiomet-ric conversion). In the high case, we assume 10% PET loss basedon Marathe et al. (1980) who reported that the yield of methanol-ysis does not exceed 90%. The loss of 10% refers to rather cleanand sorted PET waste, while the losses may be substantially larger
CA case study of PET bottle-to-fibre recycling. Resour Conserv Recy
for other products, e.g. finished textiles (due to the use of textileauxiliaries, dyes, etc.). As average case, we assume that the lossis somewhere in-between, i.e. 5%. Furthermore, the net methanolinput (the “make-up” in Fig. 7) is assumed to be zero for the lowcase, 10% for the high case and 5% for the average.
8 L. Shen et al. / Resources, Conservation and Recycling xxx (2010) xxx–xxx
PET v
ntopampere
Fig. 6. Chemical recycling
Since Patagonia’s study only reports the production of DMT, it isot known whether and how much EG is recovered and reused inhe repolymerisation step. In the low case, the recovery and reusef EG is assumed to be 100% (stoichiometric conversion and com-lete recovery). In the high case, we assume that EG is not recoveredt all and that the EG required for repolymerisation, which is esti-ated at 323 kg EG/t PET based on the stoichiometric equation, is
Please cite this article in press as: Shen L, et al. Open-loop recycling: A L(2010), doi:10.1016/j.resconrec.2010.06.014
urchased. In industrial practice the unrecovered EG may be incin-rated together with other compounds, with or without energyecovery. In the low case, we assume that there is no energy recov-ry. In the average case, 50% of EG is assumed to be recovered and
Fig. 7. Chemical recycling PET via the methano
ia the glycolysis process.
the rest 50% is purchased externally. Finally, in the high case, noenergy credits are assigned to the lost amounts of EG. The environ-mental impact of the purchased EG is obtained from the Ecoinventdatabase for “Ethylene glycol, at plant” (Althaus et al., 2007a): thecradle-to-factory gate NREU and GWP100a of EG are 52 GJ/t and0.82 t CO2 equiv./t.
The repolymerisation step is technically identical with the
CA case study of PET bottle-to-fibre recycling. Resour Conserv Recy
polymerisation process leading to virgin PET. According to anearlier publication of AMPE (Boustead, 2002), the NREU for syn-thesizing 1 t of PET via the PTA/EG route is 10.16 GJ and theGWP100a is 0.61 t CO2 equiv. We assume that the repolymerisa-
Data source: Patagonia (2005). The allocation is based on mass.b Assumed based on Marathe et al. (1980).c Own estimate or assumption.d Data source: Boustead (2002).
ion of recycled PET via the DMT/EG route has the same energyequirements.
Next, the recycled amorphous PET polymer is sent to the fibreroduction plant. It is assumed that the energy requirement of fibrepinning is the same as for virgin fibre production (see Table 2). Typ-cally, monomer recycling is combined with filament productionecause the value of the high purity of the recycled compounds
s fully exploited; this will be taken into account in the interpre-ation of this study. Table 4 shows the summary of the data andssumptions for chemical recycling via the methanolysis route.
. LCA results based on the “cut-off” approach
Table 5 shows the cradle-to-factory gate LCA results for 1 t ofecycled PET fibre based on the “cut-off” approach. Recycled fibresffer 45–85% of NREU savings compared to the virgin fibre. Notehat due to the cut-off approach, the embedded energy (calorificalue) of the recycled PET is set to zero, whereas for virgin PET fibre,he embedded energy accounts for about 40% of its total NREU.
As Table 5 shows, recycled PET fibres offer significant GWP sav-ngs compared to virgin PET fibres. The GWP of recycled PET fibress 76% (mechanical recycling), 54% (semi-mechanical recycling),6% (back-to-oligomer recycling) and 24% (back-to-monomer recy-ling) lower than that of virgin PET.
Compared to virgin fibres, mechanically and semi-mechanicallyecycled fibres offer lower impacts for all seven CML envi-onmental categories except for freshwater aquatic ecotoxicity.ack-to-oligomer recycling offers a lower impact in six out of nine
Please cite this article in press as: Shen L, et al. Open-loop recycling: A L(2010), doi:10.1016/j.resconrec.2010.06.014
ategories. The exceptions are eutrophication, freshwater ecotoxi-ity and terrestrial ecotoxicity. For all three recycling companiesnvestigated, the impact of freshwater aquatic ecotoxicity origi-ates from the incineration of solid waste from flake production.ore than 90% of the freshwater ecotoxicity impact can be traced
able 5CA result for 1 t of recycled PET fibre, based on the “cut-off” approach, cradle-to-factory
Recycling route Mechanical Semi-mecha
Company Wellman LJGFibre type Staple POYNon-renewable energy use (GJ equiv.) 13 23Global warming potential 100a (t CO2 equiv.) 0.96 1.88Abiotic depletion (kg Sb equiv.) 6 11Acidification (kg SO2 equiv.) 3 9Eutrophication (kg PO4
a For chemical recycling via the DMT route only NREU and GWP were assessed. The ran
back to the water emission of a small amount of vanadium. Vana-dium oxides are commonly used in municipal waste incinerationplants as catalysts to treat NOX emissions (Doka, 2007). About50% of the eutrophication impact of FENC’s fibre originates fromthe production of chemicals (e.g. EG) used for the chemical recy-cling process. Atmospheric emissions of vanadium (from fuel oilcombustion) are responsible for more than 60% of its terrestrialecotoxicity impact.
Mechanical recycling (Wellman) causes the lowest impact ineight out of nine environmental categories, compared to the otherthree product systems shown in Table 5. Process energy use isresponsible for the major part of the environmental impacts,represented by NREU, GWP, abiotic depletion, acidification, ter-restrial ecotoxicity and photochemical oxidant formation. Theprocess waste management in flake production, including bothemissions from waste water treatment (e.g. COD) and from solidwaste management (e.g. MSWI), is the most important factorfor eutrophication, human toxicity and freshwater aquatic eco-toxicity. The production of chemicals and the transportationof raw materials, intermediate products and solid waste treat-ment contributes very little (<10%) to the overall environmentalimpact.
The process energy use of the semi-mechanical recycling (LJG)is the most important factor for eight out of nine environmen-tal indicators. The exception is freshwater aquatic ecotoxicity.The process energy use for fibre production from flakes is themost important contributor (40–70%) to NREU, GWP, abioticdepletion and photochemical oxidant formation. The process
CA case study of PET bottle-to-fibre recycling. Resour Conserv Recy
energy use of flake production is the most important contrib-utor (40–80%) to acidification, eutrophication, human toxicityand terrestrial ecotoxicity. Fresh aquatic ecotoxicity is mainlycaused by the solid waste which is sent to MSWI. Compared toflake production and fibre production, pellet production causes
10 L. Shen et al. / Resources, Conservation and Recycling xxx (2010) xxx–xxx
h, cra
st(
ccft
Fig. 8. Normalised results for 1 t of PET fibre, “cut-off” approac
maller environmental impacts. Transportation and the produc-ion of chemicals (e.g. small amount of EG) have minor impact<5%).
For back-to-oligomer recycling by FENC, the glycolysis pro-
Please cite this article in press as: Shen L, et al. Open-loop recycling: A L(2010), doi:10.1016/j.resconrec.2010.06.014
ess contributes most to the overall environmental profile. Thehemicals and energy use (electricity and fuels) are responsibleor the major part of NREU, GWP, abiotic depletion, acidifica-ion, eutrophication, human toxicity, terrestrial ecotoxicity and
Fig. 9. System boundary based on t
dle-to-factory gate for second life, normalised to World 2000.
photochemical oxidant formation. Like Wellman and LJG, FENC’sfreshwater aquatic ecotoxicity originates from solid waste man-agement.
For back-to-monomer recycling, only NREU and GWP were anal-
CA case study of PET bottle-to-fibre recycling. Resour Conserv Recy
ysed because of the lack of information (see Section 2.1.1). Thedepolymerisation process contributes most to the overall impact,with shares of 30–40% of the total NREU and 45–50% of the totalGWP.
Fig. 8 shows the LCA results normalised to World 2000. Com-ared to virgin production, recycled PET fibres cause substantially
ower environmental impacts. Particularly, the impact reductionf abiotic depletion, acidification and human toxicity is substan-ial. Furthermore, for all PET fibres studied (both recycled andirgin), eutrophication, terrestrial ecotoxicity and photochemicalxidant formation are negligible in a global context. Recycled fibresause a relatively high environmental impact on freshwater aquaticcotoxicity compared to virgin PET because following the cut-ff approach, all impacts from post-consumer waste managementncluding fresh water ecotoxicity are exclusively assigned to theecycled product. Thus, the allocation method and the chosen sys-em boundary have strong influence on the results of this open-loopecycling case.
. Alternative approaches for open-loop recycling
.1. “Waste valuation” method
Until now, we have only discussed the LCA results based on thecut-off” approach. The environmental burden of the first life wasot considered in the system boundary (see Fig. 3). However, onean argue that this method is oversimplified, because in reality bot-le waste is traded and it does have a commercial value. In otherords, waste is a valuable resource. Thus the environmental impact
f the production of virgin polymer should be shared between therst life and the second life (see the illustration in Fig. 9).
ISO 14044 (2006) suggests the following order of allocation pro-edures for reuse and recycling (see Clause 4.3.4.3.4): “physicalroperties (e.g. mass); economic value (e.g. market value of thecrap material or recycled material in relation to market value ofrimary material); or the number of subsequent uses of the recy-
Please cite this article in press as: Shen L, et al. Open-loop recycling: A L(2010), doi:10.1016/j.resconrec.2010.06.014
led material.”In this study, allocation based on mass is not a feasible choice,
ecause bottles and fibres are different products. We thereforepply the second approach, i.e. economic allocation. In this articlee name this alternative method “waste valuation” method. This
Fig. 10. Breakdown of NREU and GWP for 1 t recycled staple fibre, based on
700 2030 439050 305 58
17 12.6 0.8 1.0
represents a variant of the “cut-off” approach which makes use ofeconomic values (prices):
Ewv = Ecut-off + AF × EvPET resin
where Ewv stands for the environmental impact of recycled PETfibre; Ecut-off is the environmental impact of recycled PET fibrebased on the “cut-off” approach; EvPET resin is the environmentalimpact of virgin PET bottle grade resin; and AF is the allocationfactor. AF × EvPET resin is the environmental burden which is shiftedfrom the first to the second life.
The determination of the allocation factor is the key step for the“waste valuation” method. We define the allocation factor (AF) asthe ratio of the market value of baled bottle waste to the marketvalue of virgin PET bottle grade resin:
AF = Price of baled bottle wastePrice of virgin PET bottle grade resin
The price of baled bottle waste was collected from three compa-nies as average value for the year 2008. The price of virgin PET bottlegrade resin was obtained from the monthly prices of North Amer-ica plastics resins published by Plastics Online Technology (PTO,2009). Due to the regional differences and the strong fluctuation ofcrude oil prices in 2008, the AFs differ by companies, although notsubstantially. In general, the AF is in the range of 21–40%; the aver-age AF is approximately 32%. For the “waste valuation” method, wetherefore assumed that 32% (21–40%) of the environmental burdenof virgin PET bottle grade resin is shifted to the recycled PET fibres.The LCA results are shown in Table 6.
Compared to virgin fibre, mechanically and semi-mechanicallyrecycled PET fibres still offer environmental benefits in allcategories except for freshwater aquatic ecotoxicity. Back-to-oligomer recycling offers an impact reduction in six out of
CA case study of PET bottle-to-fibre recycling. Resour Conserv Recy
nine categories. By analogy with the “cut-off” approach, recy-cled fibre produced from chemical recycling back-to-BHEThas a relatively high impact on eutrophication, freshwateraquatic ecotoxicity and terrestrial ecotoxicity compared to vir-gin fibre. Due to lack of data, it is not possible to analyse
the “waste valuation” method, cradle-to-factory gate for second life.
12 L. Shen et al. / Resources, Conservation and Recycling xxx (2010) xxx–xxx
Fig. 11. Change of environmental impact from the “cut-off” method to the “waste valuation” method, cradle-to-factory gate for second life, for 1 t of recycled staple fibre,CML 2001 baseline method.
F it 1 tb
tm
ioFeChdadf
oa
ig. 12. “System expansion” method applied for open-loop recycling, functional unalances shown in the graph are indicative).
he back-to-monomer recycling based on the “waste valuation”ethod.Fig. 10 shows that the shifted environmental impact has a strong
nfluence on NREU and GWP. The shifted NREU accounts for 40–65%f the total NREU and the shifted GWP is 30–50% of the total GWP.ig. 11 shows the increase of the environmental impact (which isqual to the shifted burden from the virgin bottle grade) for theML indicators. The shifted burden has the strongest influence onuman toxicity which increases by 170–350%, because the pro-
Please cite this article in press as: Shen L, et al. Open-loop recycling: A L(2010), doi:10.1016/j.resconrec.2010.06.014
uction of PET has relatively high impact on human toxicity.4 Forbiotic depletion, acidification, eutrophication, photochemical oxi-ant formation, together with NREU and GWP, the increase rangesrom 30% to 200%. For freshwater aquatic ecotoxicity and terrestrial
4 The relatively high human toxicity of virgin PET fibre can be also seen in Table 6r Fig. 8. More than 90% of the impact is caused by the air emission of PAH (polycyclicromatic hydrocarbon) in virgin PET resin production (Boustead, 2005a).
of PET bottle and 1 t of PET fibre, cradle-to-grave without the use phase (the mass
ecotoxicity, the impact from the shifted environmental burden isnegligible (≤5%).
5.2. “System expansion” method (cradle-to-grave)
Open-loop recycling faces two methodological problems. Thefirst problem is how to allocate the environmental impact of theproduction of the original product throughout several life cycles.In this study, we have so far discussed two methods: the “cut-off”method and the “waste valuation” method. However, both methodsare not entirely satisfactory. The “cut-off” method cannot be justi-fied if waste is considered to be a valuable resource. The result fromthe “waste valuation” method depends on market prices, which are
CA case study of PET bottle-to-fibre recycling. Resour Conserv Recy
determined by supply and demand, the crude oil price and othereconomic aspects; they can therefore fluctuate considerably overtime.
The second methodological problem is how to allocate theenvironmental burden of the ultimate “grave” of the product
L. Shen et al. / Resources, Conservation and Recycling xxx (2010) xxx–xxx 13
Fig. 13. “System expansion” method applied for the open-loop recycling, pruned from Fig. 12, functional unit 1 t of PET fibre, cradle-to-grave without the use phase (themass balances shown in the graph are indicative).
Table 7LCA result for 1 t of recycled PET fibre, based on the “system expansion” approach, cradle-to-grave, excluding the use phase.
gin PET bottle grade, 100 kg PE (for caps and labels)5 and 1000 kgof virgin fibre are produced and incinerated, i.e. the life cyclesare complete.6 In the bottle-to-fibre (B2F) product system, it isassumed that 1000 kg of virgin PET bottle grade is produced and
ig. 14. Breakdown of NREU and GWP100a for 1 t of PET fibre for the three pro2F = bottle-to-fibre).
hroughout several life cycles. So far this has not been includedecause the primary system boundary of this study is “cradle-to-actory gate”. If we extend the product system to the “grave” stage,ccording to the “cut-off” principle, the environmental impact ofnd-of-life waste management (e.g. incineration) would be entirelyllocated to the last recycled product, the recycled PET fibre. Therst life (the virgin PET bottle) does not bear any environmentalurden originating from the ultimate waste management.
In short, these two problems are both caused by allocation. The
Please cite this article in press as: Shen L, et al. Open-loop recycling: A L(2010), doi:10.1016/j.resconrec.2010.06.014
llocation problem for open-loop recycling has not been resolvedn current ISO standards. In this study, we propose a method whichollows the principle of system expansion.
In a complete cradle-to-grave bottle-to-fibre recycling system,wo products are delivered in two lives, i.e. bottles and fibres. If a
ystems, cradle-to-grave without use phase (the life cycles are shown in Fig. 13;
reference system is to be established for comparison, this systemmust deliver identical products: bottles and fibres. This conceptis illustrated in Fig. 12. In the reference system, 1000 kg of vir-
CA case study of PET bottle-to-fibre recycling. Resour Conserv Recy
5 According to Detzel et al. (2004) depends on the size of bottles, the weight ofcaps and labels is approximately 10% (ranging from 7% to 13%) of the weight of PETin a bottle.
6 The use phase is excluded, because it is the same for both product systems.
ecycled into approximately 800 kg of PET fibre.7 The 100 kg of PEs separated and either sold as a by-product or disposed of in a
SWI plant with energy recovery. The 800 kg of recycled PET fibres used and incinerated; and the life cycles are complete. In such
product system, 1000 kg of bottle grade and 800 kg of fibre arehe output function of the product system. In order to make theunctional unit comparable with the reference system in terms of
ass, an additional 200 kg of fibre is required, which is assumed toe produced from crude oil (see Fig. 12).
To summarize, both the reference system and the B2F sys-em have the same output in terms of mass, i.e. 1000 kg of PETottle grade and 1000 kg of PET fibre. The difference is that
n the reference system, 2000 kg of PET waste and 100 kg PEaste are incinerated, whereas in the B2F system, only 1000 kg
f PET waste is incinerated (PE leaves the system either as ay-product or it is incinerated). In this way, it is possible totudy the environmental impact of recycling versus single-useithout cutting off life cycles. We name this method the “sys-
em expansion” method. An important pre-assumption of thisethod is that the quality of virgin PET fibre is assumed to be
dentical to the quality of recycled fibre. In other words, the000 kg (800 kg recycled + 200 kg virgin) of fibre from the B2Fystem is assumed to be fully comparable to the 1000 kg of vir-in fibre from the reference system (see also Section 2.1 andable 1).
Taking a close look at the two product systems in Fig. 12, wend that several unit processes are the same in the reference sys-em and in the B2F system, for example, the production of virginolymers (PET, PE), bottle production and the incineration of PETaste (see dashed boxes in Fig. 12). Since our primary focus is on
he differences between the two product systems, removing thedentical unit processes does not change the result of the compari-on. Therefore, the dashed boxes in Fig. 12 can be trimmed out. Theruned product systems are shown in Fig. 13. In these two prod-ct systems, the production of virgin bottle is not presented. Inther words, only fibres are studied. We could, in theory, renamehe functional unit back to “one tonne of fibre” with the systemoundary of cradle-to-grave (excluding the use phase).
The LCA results based on the “system expansion” method arehown in Table 7. Recycled fibres produced by mechanical andemi-mechanical recycling (Wellman and LJG) offer low environ-ental impacts for all nine indicators, compared to the single-use
irgin fibre. Back-to-oligomer recycling (FENC) has a low envi-onmental impact in all categories except for eutrophication anderrestrial ecotoxicity.
From cradle-to-grave, the NREU of recycled fibre is 70% (Well-an), 60% (LJG) and 40% (FENC) lower than that of virgin fibre; the
Please cite this article in press as: Shen L, et al. Open-loop recycling: A L(2010), doi:10.1016/j.resconrec.2010.06.014
WP of recycled fibre is 76% (Wellman), 60% (LJG) and 50% (FENC)ower compared to virgin fibre. Fig. 14 shows the breakdown ofREU and GWP based on different life-cycle phases. In the cradle-
7 This recycling efficiency (80%) is indicative; it does not coincide exactly withhe values received from the companies. In general, the recycling efficiency of theET material flow is about 80–90%, according to the inventory data provided by theompanies.
7% 5%2.7 n/a635 n/a
is avoided. The major part of the impact on energy and GHG emis-sions is related to the recycling processes which are referred to as“r-PET fibre” in Fig. 14. For each recycling system, the impact fromthe virgin PET fibre is different (see “V-PET fibre” in the figure for thethree recycling companies), depending on the recycling efficiency,it ranges from 80% to 90%.
6. Discussion
6.1. Comparison with other studies
As mentioned in the introduction, most PET recycling studieshave focused on waste management rather than the production ofrecycled products (Detzel et al., 2004; Song and Hyun, 1999; Songet al., 1999). The results of these LCA studies are not directly com-parable with our results because the goal and the functional unitsare different. Moreover, a transparent dataset on PET recycling ishardly available in public domain. A few studies reported inven-tory data of flake production. The comparison of flake productionshows that the inventory data and the results reported by this studyfit well with those reported by Arena et al. (2003) and Detzel et al.(2004) (see Table 8).
6.2. Use of LCA results from the three methods
In this study, three methods were applied for the B2F open-loop recycling case. The three methods take different perspectives.The “cut-off” approach follows the natural business-to-businessboundary and is the most commonly used LCA method for recycledproducts. It is easy to apply and no data is required from outsideof the investigated product system. The disadvantage is that themethod oversimplifies the environmental impact of the “cradle”and the “grave” stages.
The “waste valuation” method uses economic values to elabo-rate the “cradle stage” by shifting part of the environmental impactfrom the virgin polymer to the second life cycle. It is also a methodwhich is easy to apply. However, the allocation factor stronglydepends on the market prices that are determined by demand andsupply and the macroeconomic development. It is possible to fur-ther elaborate the “waste valuation” method by introducing morecomprehensive economic indicators (e.g. long-term price elastic-ity) (Ekvall, 2000; Werner and Richter, 2000). These methods areusually more complicated and require data from economic models.
The third approach we applied, the “system expansion” method,takes the real “cradle” and “grave”, merges two life cycles into oneproduct system and compares systems with and without recycling.The most important advantage of this method is that it avoids allo-cation. This method applies life-cycle thinking to the whole system.It is our preferred method for open-loop recycling. The disadvan-tage of this method is that it is not easy to apply; it results in largesystems and the data requirements from extended product systemscan be demanding (Ekvall and Tillman, 1997).
CA case study of PET bottle-to-fibre recycling. Resour Conserv Recy
The use of these LCA results depends on the perspective of adecision maker. From a manufacturer’s point of view, it is importantto reduce the environmental impact of the production process andthe suppliers. The system boundary of cradle-to-factory gate (the“cut-off” and “waste valuation” methods) fits well to the business
oundary. Both methods are easy to apply and to communicate.rom a life-cycle-thinking perspective, the benefit of recycling ishe improvement of the material utilization efficiency by avoidingurther resource extraction and waste management. The overallmpact can only be assessed when the entire system and the effectf the system are considered. Therefore, the “system expansion”ethod represents a life-cycle-thinking perspective.
.3. Comparison with other commodity fibres and renewablelternatives
So far, we only compared PET fibres. It is also interesting tonderstand the position of recycled PET fibre among other com-odity fibres, such as cotton, viscose and PP, as well as novel
io-based fibres, such as Tencel and PLA. Figs. 15 and 16 showhe comparisons of NREU and GWP among these fibres. TheCA results of Lenzing Viscose and Tencel fibres were obtainedrom Shen and Patel (2010). The cotton data is a weighted aver-ge of Chinese and US cotton (Althaus et al., 2007b; Dinkelnd Stettler, 2008 (unpublished work)). The eco-profiles of PPesin and PLA resin are obtained from Plastics Europe (Boustead,005c) and NatureWorks LLC (NatureWorks LLC, 2009; NREL,009), respectively. The energy consumption of melt-spinningP and PLA is assumed to be the same as that of PET (seeable 2).
Fig. 15(a) shows the results for the system boundary cradle-to-actory gate. For recycled fibres, the default method is the “cut-off”
ethod (for the second life), with the error bar showing the resultsased on the “waste valuation” method. For recycled fibre pro-uced from the DMT route, only the “cut-off” method was applied;he error bar shows the results based on the high and low casesssumptions (see Section 3.3). Fig. 15(b) shows the cradle-to-graveomparison without the use phase. For recycled PET fibres, the “sys-em expansion” method is applied (except for chemical recycledbre produced via the DMT route). For other fibres, it is assumedhat all the fibre products are used and disposed of in Westernurope in an average MSWI plant with energy recovery (recoveryate = 60%, see Section 2.2).
Based on the “cut-off” approach, staple fibre produced fromechanical recycling (Wellman) has the lowest cradle-to-factory
ate NREU among all fibre studied; recycled PET fibre producedrom semi-mechanical recycling (LJG) has slightly higher NREUhan Lenzing Viscose Austria; the NREU of chemically recycledbre produced by FENC is slightly higher compared to cotton;nd chemical recycled fibre via the DMT route has a higher NREUalue than Tencel Austria. All recycled PET fibres have lower NREUalues than virgin PET and virgin PP, based on the three meth-ds.
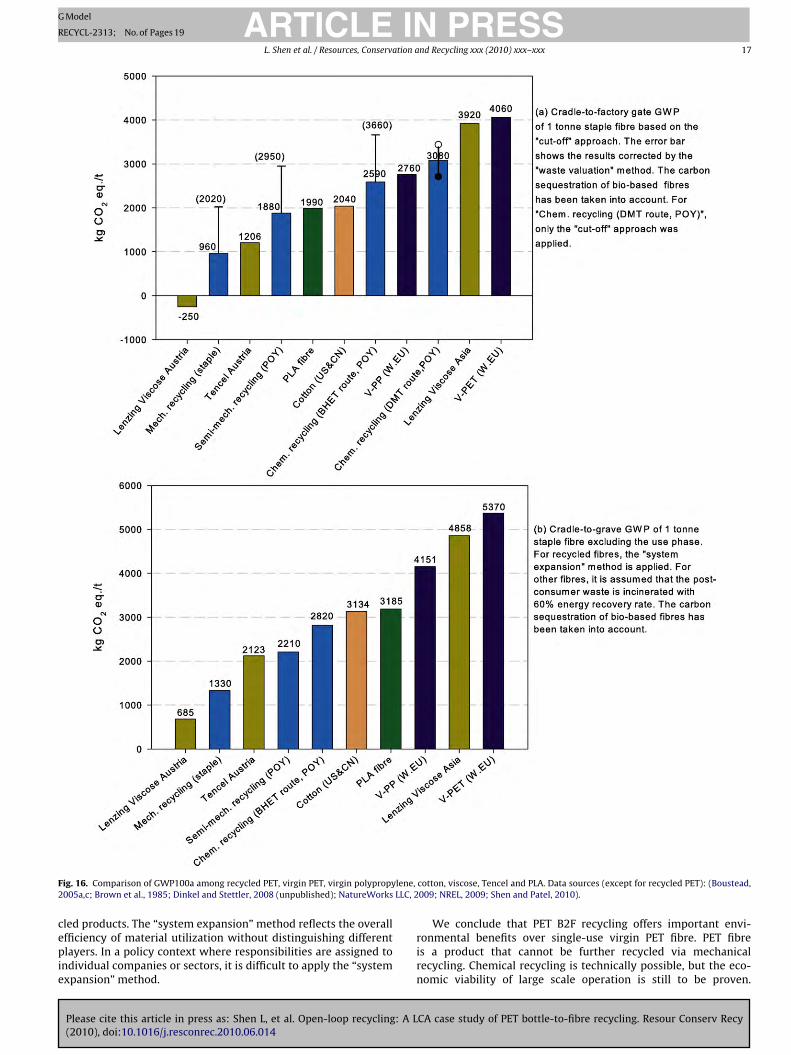
Fig. 16(a) presents the comparison of cradle-to-factory gateWP100a based on the “cut-off” method with the error bar showing
he results based on the “waste valuation” method. For chemicallyecycled fibres based on the DMT route, only the “cut-off” approachas applied. Fig. 16(b) shows the cradle-to-grave comparison with-
ut the use phase. For recycled PET fibres, the “system expansion”ethod is applied. For other fibres in the case study, it is assumed
hat the fibre products are single-use and the post-consumer wastes incinerated with energy recovery.
Based on the “cut-off” approach (Fig. 16a), recycled fibre pro-uced via mechanical recycling (Wellman) has a lower GWP valuehan all the other fibres listed except for Lenzing Viscose Austria;ecycled fibre produced from semi-mechanical recycling (LJG) is
Please cite this article in press as: Shen L, et al. Open-loop recycling: A L(2010), doi:10.1016/j.resconrec.2010.06.014
as a slightly lower GWP than PLA and cotton; recycled fibresroduced via chemical recycling (BHET route and DMT route) areomparable with virgin PP. Based on all three methods applied, alltudied recycled PET fibres have lower GWP than Lenzing Viscosesia and virgin PET.
PRESSnd Recycling xxx (2010) xxx–xxx 15
When we compare the energy use and GWP of various fibreproducts (as in Figs. 15 and 16), it should also be taken intoaccount that fibres are intermediate products. The fibres studiedare designed to delivery different functionalities and to fulfill vari-ous end-use purposes, and they cannot always replace each other.Table 9 shows that the mechanical, thermal and water retentionproperties of fibres compared are very different. Therefore, if fibreA has a higher environmental impact than fibre B, it does not imme-diately imply that fibre A should be replaced by fibre B.
Furthermore, in both Figs. 15(b) and 16(b) the use phase isexcluded. Here, the use phase includes the fabric and the end prod-uct (e.g. shirt) manufacturing stages and the use of the end product.Depending on the type of fibre, the environmental impacts in theuse phase can be substantially different. For example, differenttypes of fibres have different energy requirements, chemical useand generate different types of waste in dyeing, finishing, washingand drying processes; the type of fibre/fabric also determines thelife time of product.
7. Summary, conclusions and future research
In this study, the environmental impacts of bottle-to-fibre (B2F)recycling were assessed. We investigated four recycling tech-nologies, namely mechanical recycling, semi-mechanical recycling,back-to-oligomer recycling and back-to-monomer recycling. TheLCA results were compared with the eco-profile of virgin PET fibre.Three methods were applied for this open-loop recycling case,namely, the “cut-off”, “waste valuation” and “system expansion”methods. The “cut-off” and the “waste valuation” methods followthe system boundary of cradle-to-factory gate. The cradle-to-gravesystem is analysed based on the “system expansion” method. Theuse phase is excluded in this LCA.
Based on all three methods, recycled PET fibre offers 40–85%non-renewable energy savings and 25–75% GWP savings comparedto virgin PET, depending on the technology, the chosen allocationmethod and/or system boundaries. Based on all three methods,bottle-to-fibre recycling reduces impacts for most of the envi-ronmental categories studied. In addition, in terms of NREU andGWP100a, recycled PET fibres are comparable to cotton, modernviscose (i.e. Lenzing Viscose Austria), Tencel and PLA, and they arebetter than PP, traditional viscose (i.e. Lenzing Viscose Asia) andvirgin PET. Both mechanical and semi-mechanical recycling havelower impacts than chemical recycling via the BHET route. How-ever, it must be acknowledged that fibres produced from chemicalrecycling can be applied more widely than fibres produced from(semi-) mechanically recycled fibres. This also applies to chemicalrecycling via methanolysis, which has the highest impacts on NREUand GWP100a among the four recycling technologies investigated,but yields the highest product quality.
The three methods applied in this study take different perspec-tives. The “cut-off” method is easy to apply and straightforward tocommunicate. It focuses only on the recycled product and no datais required outside of the investigated product system. However,it simplifies the open-loop allocation issues especially for the “cra-dle” and the “grave” stages. The “waste valuation” method can beseen as an elaborated “cut-off” method. It uses economic valuesto allocate the environmental impacts of the production of virginpolymer (which is used for both life cycles). This method followsthe suggested procedures by ISO/TR 14049 for recycling. However,the price fluctuation may lead to significant uncertainties for this
CA case study of PET bottle-to-fibre recycling. Resour Conserv Recy
method. The “system expansion” takes the perspectives of life-cyclethinking. The “system expansion” method is our preferred methodto deal with open-loop recycling, although this method is not easyto apply because it requires detailed data outside of the life cycleof the investigated product.
16 L. Shen et al. / Resources, Conservation and Recycling xxx (2010) xxx–xxx
F ne, co2 LLC, 2
rcai
ig. 15. Comparison of NREU among recycled PET, virgin PET, virgin polypropyle005a,c; Brown et al., 1985; Dinkel and Stettler, 2008 (unpublished); NatureWorks
Please cite this article in press as: Shen L, et al. Open-loop recycling: A L(2010), doi:10.1016/j.resconrec.2010.06.014
Among the three methods we applied, the “cut-off” approacheflects current environmental policy (e.g. emission trading), whereompanies or sectors are addressed as individual actors and theirctual energy use and emissions are fully taken into account. Thiss not the case for the “waste valuation” method because it shifts
tton, viscose, Tencel and PLA. Data sources (except for recycled PET): (Boustead,009; NREL, 2009; Shen and Patel, 2010).
CA case study of PET bottle-to-fibre recycling. Resour Conserv Recy
part of the impacts from primary to secondary production. Com-pared to the “cut-off” approach the “waste valuation” method is lessfavourable for the recycling industry. However, it can encouragethe product design for recyclability because producing recyclableproduct results in a credit by shifting part of the impacts to the recy-
L. Shen et al. / Resources, Conservation and Recycling xxx (2010) xxx–xxx 17
F lene,2 LLC, 2
cepie
ig. 16. Comparison of GWP100a among recycled PET, virgin PET, virgin polypropy005a,c; Brown et al., 1985; Dinkel and Stettler, 2008 (unpublished); NatureWorks
Please cite this article in press as: Shen L, et al. Open-loop recycling: A L(2010), doi:10.1016/j.resconrec.2010.06.014
led products. The “system expansion” method reflects the overallfficiency of material utilization without distinguishing differentlayers. In a policy context where responsibilities are assigned to
ndividual companies or sectors, it is difficult to apply the “systemxpansion” method.
cotton, viscose, Tencel and PLA. Data sources (except for recycled PET): (Boustead,009; NREL, 2009; Shen and Patel, 2010).
CA case study of PET bottle-to-fibre recycling. Resour Conserv Recy
We conclude that PET B2F recycling offers important envi-ronmental benefits over single-use virgin PET fibre. PET fibreis a product that cannot be further recycled via mechanicalrecycling. Chemical recycling is technically possible, but the eco-nomic viability of large scale operation is still to be proven.
PPe Staple Herculon® 0.9–0.92 25–60 25–60 0 160–175PLAh Staple IngeoTM 1.25 n/a b 32–36 n/a b 170
a Tenacity is expressed in relative to the fineness (1 tex = 1 g/1000 m). Figures for tenacity are based on both fibre fineness (tex) and cross-sectional area of the sample.b n/a = data not available or not applicable.c Private communication with Wellman International Ltd. (2009).d Private communication with Far Eastern New Century Co. (2009).e Schultze-Gebhardt and Herlinger (2002).
Abrbicot
A
tgnTm
R
A
A
A
A
B
B
B
B
B
C
D
D
D
D
f Abu-Rous and Schuster (2006).g Lenzing (2006).h NatureWorks LLC (2006).
nother important way of recycling PET bottles is bottle-to-ottle recycling (see Fig. 1). This is an example for closed-loopecycling system. In theory, PET can be recycled multiple timesefore it is finally converted into fibre. The environmental
mpact of such recycling systems, the effect of the number ofycles and the influence from different allocation methods forpen-loop and/or closed-loop recycling should be further inves-igated.
cknowledgements
The authors thank adidas AG, Lenzing AG and Wellman Interna-ional Ltd., who funded and supported this study. We also are veryrateful for the data and comments provided by Wellman Inter-ational Ltd., Far Eastern New Century Co. and Long John Group.he authors also thank Dr. Evert Nieuwlaar for his help on theethodology development of this study.
eferences
bu-Rous M, Schuster KC. Technical fibre formation: processes, fibre structure, fibreproperties EPNOE summer school 2006. Austria: Lenzing; 2006.
lthaus HJ, Chudacoff M, Hischier R, Jungbluth N, Osses M, Primas A. Life CycleInventories of Chemicals. Ecoinvent final report no. 8. Swiss Centre for Life CycleInventories; Duebendorf, Switzerland; 2007a.
lthaus HJ, Dinkel F, Stettler C, Werner F. Life Cycle Inventories of Renewable Mate-rials, Ecoinvent final report no. 21. Swiss Centre for Life Cycle Inventories;Duebendorf, Switzerland; 2007b.
rena U, Mastellone M, Perugini F. Life cycle assessment of a plastic packagingrecycling system. Int J LCA 2003;8(2):92–8.
oustead I. Eco-profiles of the European Plastics Industry—polyethylene tereph-thalate (PET) (amorphous grade). Brussels, Belgium: Association of PlasticsManufacturers in Europe (APME); 2002.
oustead I. Eco-profiles of the European Plastics Industry—polyethylene terephtha-late (PET) (amorphous grade). Brussels, Belgium: PlasticsEurope; 2005a.
oustead I. Eco-profiles of the European Plastics Industry—polyethylene terephtha-late (PET) (bottle grade). Brussels, Belgium: PlasticsEurope; 2005b.
oustead I. Eco-profiles of the European Plastics Industry: polypropylene (PP). Brus-sels, BE: PlasticsEurope; 2005c.
rown HL, Hamel BB, Hedman BA. Energy analysis of 108 industrial processes, S.207–209. U.S. Department of Energy; 1985.
ML. CML-IA – CML characterization factors version 3.4. Centrum voor Milieuweten-schappen Leiden (Institute of Environmental Science), Leiden University, Leiden,the Netherlands; 2008.
elattre J, Raynaud R, Thomas C, inventor; Rhone-Poulenc-Textile, assignee. Processfor obtaining dimethyl terephthalate from polyester scrap. US patent US Patent4163860; 1976.
etzel A, Giegrich J, Krüger M, Möhler S, Ostermayer A. Life cycle assessment of PET-OW systems taking into account secondary products. Heidelberg, Germany: IFEU
Please cite this article in press as: Shen L, et al. Open-loop recycling: A L(2010), doi:10.1016/j.resconrec.2010.06.014
GmbH; 2004.inkel F, Stettler C. Life cycle inventory of Cotton (China and US) (in excel). Carbotech
AG, Basel, Switzerland, 2008 (unpublished).oka G. Life Cycle Inventories of Waste Treatment Services. Ecoinvent final report
no. 13. Swiss Centre for Life Cycle Inventories; Duebendorf, Switzerland;2007.
EIA. Worldbook Contents: Spot prices for crude oil and petroleum prod-ucts. Energy Information Administration, US Department of Energy; 2008.http://tonto.eia.doe.gov/dnav/pet/pet pri spt s1 m.htm [accessed on 4 Novem-ber 2008].
Ekvall T. A market-based approach to allocation at open-loop recycling. ResourConserv Recycl 2000;29(1–2):91–109.
Ekvall T, Tillman AM. Open-loop recycling: criteria for allocation procedures. Int JLCA 1997;2(3):155–62.
EU Directive. DIRECTIVE 2009/28/EC OF EUROPEAN PARLIAMENT AND OF THECOUNCIL of 23 April 2009 on the promotion of the use of energy from renew-able sources and amending and subsequently repealing Directives 2001/77/ECand 2003/30/EC Official Journal of the European Union. Official Journal of theEuropean Union, 2009.
Faist Emmenegger M, Heck T, Jungbluth N, Tuchschmid M. Erdgas. In: Dones R,editors. Sachbilanzen von Energiesystemen: Grundlagen für den ökologischenVergleich von Energiesystemen und den Einbezug von Energiesystemen inÖkobilanzen für die Schweiz. Ecoinvent final report no. 6-V. Paul Scherrer Insti-tut Villigen. Swiss Centre for Life Cycle Inventories: Duebendorf, Switzerland;2007.
Forum-PET. Forum PET Statistik, 2009. http://www.forum-pet.de/statistik 4263.html?psid=75a8d1856c1985e1a2291519ef74a064 [accessed on 26 Feb 2009].
Frischknecht R, Jungbluth N, Althaus H-J, Doka G, Heck T, Hellweg S, Hischier R,Nemecek T, Rebitzer G, Spielmann M, Wernet G. Overview and Methodology.Ecoinvent report no. 1. Swiss Centre for Life Cycle Inventories; Duebendorf,Switzerland; 2007a.
Frischknecht R, Tuchschmid M, Faist Emmeneger M, Bauer C, Dones R. Strommix undStromnetz. In: Dones R, editors. Sachbilanzen von Energiesystemen: Grundlagenfür den ökologischen Vergleich von Energiesystemen und den Einbezug vonEnergiesystemen in Ökobilanzen für die Schweiz. Ecoinvent report no. 6 PaulScherrer Institut Villigen. Swiss Centre for Life Cycle Inventories; Duebendorf,Switzerland; 2007b.
Glenz W. Polyethylenterephthalat (PET). Kunststoffe 2004(10):76–8.Glenz W. Polyethylene Terephthalate (PET). Kunststoffe 2007(10):76–80.Guinée JB, Gorrée M, Heijungs R, Huppes G, Kleijn R, de Koning A, van Oers L,
Wegener Sleeswijk A, Suh S, Udo de Haes HA, de Bruijn H, van Duin R, Hui-jbregts MAJ. LCA—an operational guide to the ISO-standards—Part 2a. Leiden:Center of Environmental Science; 2001.
IEA. Energy Balances of non-OECD Countries 2005/2006. Paris, France: InternationalEnergy Agency (IEA); 2008a.
IEA. Energy Balances of OECD Countries 2005/2006. Paris, France: InternationalEnergy Agency (IEA); 2008b.
IPCC. IPCC Fourth Assessment Report (AR4) by Working Group 1 (WG1), Chapter2 Changes in Atmospheric Constituents and in Radiative Forcing. Intergovern-mental Panel on Climate Change; 2007.
ISO. ISO 14040: 2006. Environmental management – life cycle assessment– principles and framework. International Standardization Organisation;2006a.
ISO. ISO 14044: 2006. Environmental management – life cycle assessment– requirements and guidelines. International Standardisation Organisation;2006b.
JCFA. Worldwide Chemical Fibre Production in 2007. Japan Chemical Fibres Associ-ation (JCFA); 9 May 2008.
Jungbluth N. Erdöl. In: Dones R, editors. Sachbilanzen von Energiesystemen: Grund-lagen für den ökologischen Vergleich von Energiesystemen und den Einbezugvon Energiesystemen in Ökobilanzen für die Schweiz. Ecoinvent report no. 6-IV.
CA case study of PET bottle-to-fibre recycling. Resour Conserv Recy
Swiss Centre for Life Cycle Inventories; Duebendorf, Switzerland: 2007.Klöpffer W. Allocation rule for open-loop recycling in life cycle assessment—a
review. Int J LCA 1996;1(1):27–31.Lenzing AG. Sustainability in the Lenzing Group. Lenzing, Lenzing, 2006.
http://www.lenzing.com/sites/nh/english/e index.html [accessed on 6 Oct2006].
USEPA. Chapter 1 External Combustion Sources, last update July 2008. In: Emissionfactors & AP42. 5th edition, vol. 1 Office of Air Quality Planning and Standards
ARTICLEModel
ECYCL-2313; No. of Pages 19
L. Shen et al. / Resources, Conserva
orenzetti C, Manaresi P, Berti C, Barbiroli G. Chemical recovery of useful chemicalsfrom polyester (PET) waste for resource conservation: a survey of state of theart. J Polym Environ 2006;14(1):89–101.
arathe MN, Dabholkar DA, Jain MK. Process for the recovery of dimethyl tereph-thalate from polyethylene terephthalate. GB Patent 2 041 916; 1980.
akao T, Chikatsune T, Nakashima M, Suzuki M, Nagano H. Method for recycling PETbottle. Patent WO/2003/033581; 2003.
atureWorks LLC. Technical Bulletins of Ingeo (TM) fibre: Basic Fibre Prop-erties; 2006. http://www.ingeofibers.com/ingeo/technical bulletins.asp [accessed 31 Jan 2008].
atureWorks LLC. Improving the Ingeo (TM) Eco-Profile. NatureWorks LLC;2009. http://www.natureworksllc.com/copy%20of%20our-values-and-views/environmental-attributes/eco-profile/∼/media/Our%20Values%20and%20Views/LifeCycleAssesment/External LCA/New Ingeo Eco Profile IntroductionWeb 2 22 09 pdf.ashx [accessed on 18 Jun 2010].
oone A. Collected PET bottles. In: Proceedings of 13th International Polyester Recy-cling Forum; 2008.
REL. U.S. Life-cycle inventory database (Polylactide Biopolymer Resin, NebraskaUSA, at plant). National Renewable Energy Laboratory, 2009. www.nrel.gov/lci.
aszun D, Spychaj T. Chemical recycling of poly(ethylene terephthalate). Ind EngChem Res 1997;36(4):1373–83.
atagonia. Patagonia’s Common Threads Garment Recycling Program: Adetailed analysis; 2005. http://www.patagonia.com/pdf/en US/commonthreads whitepaper.pdf [accessed 18 May 2009].
etcore. PETCORE COLUMN - European PET collection, vol. 7–8;August 2008. http://www.petcore.org/intranet/Common/GetFile.asp?PortalSource=558&DocID=11731&mfd=off&pdoc=1 [accessed on 3 Mar2009].
etcore. PET and the Environment – Processing; 2009a. http://www.petcore.org/Content/Default.asp?PageID=18 [accessed on 30 Jul 2009].
etcore. PETCORE publishes PET collection figures for 2008; 2009b.http://www.petcore.org/intranet/Common/GetFile.asp?PortalSource=558&DocID=12352&mfd=off&pdoc=1 [accessed on 26 Nov 2009].
lasticsEurope. The Compelling Facts About Plastics 2007. Published in October2008.
lasticsEurope. The Compelling Facts About Plastics 2009: an analysis of Europeanplastics production, demand and recovery for 2008. Published in September2009; 2009a.
lasticsEurope. Eco-profiles and environmental declarations: life cycle inventory(LCI) Methodology and product category rules (PCR) for uncompounded poly-mer resins and reactive polymer precursors. Brussels: PlasticsEurope AISBL; 12
Please cite this article in press as: Shen L, et al. Open-loop recycling: A L(2010), doi:10.1016/j.resconrec.2010.06.014
May 2009; 2009b. http://lca.plasticseurope.org/index.htm [accessed on 20 May2009].
TO. Plastics Technology Online: Resin Prices Jan–Dec 2008; 2009.http://www.ptonline.com/pricing/ [accessed on 13 Feb 2009].
eimann DO. CEWEP Energy report: results of specific data for energy, efficiencyrates and coefficients, plant efficient factors and NCV of 97 European W-t-E
PRESSnd Recycling xxx (2010) xxx–xxx 19
plants and Determination of the main energy results. Bamberg, Germany: Con-federation of European Waste-to-Energy plants (CEWEP); 2006.
Shen L, Patel MK. Life cycle assessment of man-made cellulose fibres. Departmentof Science, Technology and Society (STS), University Utrecht; 2010, Revised ver-sion, March.
Simon C-J, Schnieders F. Business Data and Charts 2007 by PlasticsEu-rope Market Research Group (PEMRG). Status September 2008; 2009.http://www.plasticseurope.org/Content/Default.asp?PageID=989 [accessed on16 Feb 2009].
Sleeswijk AW, van Oers LFCM, Guinée JB, Struijs J, Huijbregts MAJ. Nor-malisation in product life cycle assessment: an LCA of the global andEuropean economic systems in the year 2000. Sci Total Environ 2008;390(1):227–40.
Song HS, Hyun JC. A study on the comparison of the various waste managementscenarios for PET bottles using the life-cycle assessment (LCA) methodology.Resour Conserv Recycl 1999;27(3):267–84.
Song HS, Moon KS, Hyun JC. A life-cycle assessment (LCA) study on thevarious recycle routes of pet bottles. Korean J Chem Eng 1999;16(2):202–7.
Spielmann M, Bauer C, Dones R, Tuchschmid M. Life cycle inventories of trans-port services. Ecoinvent report no. 14. Swiss Centre for Life Cycle Inventories;Duebendorf, Switzerland; 2007.
Thiele U. In: 13th international polyester recycling symposium; 2009. p. 22–3.TWEPA. Good Practices Inventory: Deposit-Refund Systems for PET
bottles in Taiwan. Asia-Pacific Environmental Innovation Strate-gies (APEIS), Research on Innovative and Strategic Policy Options(RISPO). Taiwan Environmental Protection Administration, Taipei, 2004.www.iges.or.jp/APEIS/RISPO/inventory/db/pdf/0133.pdf [accessed on 15 Apr2010].
TWEPA. The Sampling and Analysis of Municipal Solid Waste Composi-tion in Taiwan for 2008. Taiwan Environmental Protection Administra-tion (TWEPA); 2009a. Report No.: EPA-97-Z102-02-201. http://epr.epa.gov.tw/query/KO1040000.aspx?DocNo=99976633 [accessed on 7 Apr 2009].
TWEPA. Year statistics of Taiwan municipal solid waste incineration plant withelectricity recovery for 2008. Taiwan Environmental Protection Administra-tion (TWEPA); 2009b. http://ivy4.epa.gov.tw/swims/report/biz statistics Y2.asp[accessed on 7 Apr 2009].
CA case study of PET bottle-to-fibre recycling. Resour Conserv Recy
Office of Air and Radiation. U.S. Environmental Protection Agency, ResearchTriangle Park, North Carolina; 2008.
Werner F, Richter K. Economic allocation in LCA: a case study about aluminumwindow frames. Int J LCA 2000;5(2):79–83.