Respiratory Bacteria Vaccines: Model Analyses for Vaccine and Vaccine Trial Design Jim Koopman MD MPH Ximin Lin MD MPH Tom Riggs MD MPH Dept. of Epidemiology & Center for Study of Complex Systems University of Michigan
Transcript
Respiratory Bacteria Vaccines: Model Analyses for Vaccine and
Vaccine Trial Design
Jim Koopman MD MPH
Ximin Lin MD MPH
Tom Riggs MD MPH
Dept. of Epidemiology &
Center for Study of Complex Systems
University of Michigan
Questions Addressed
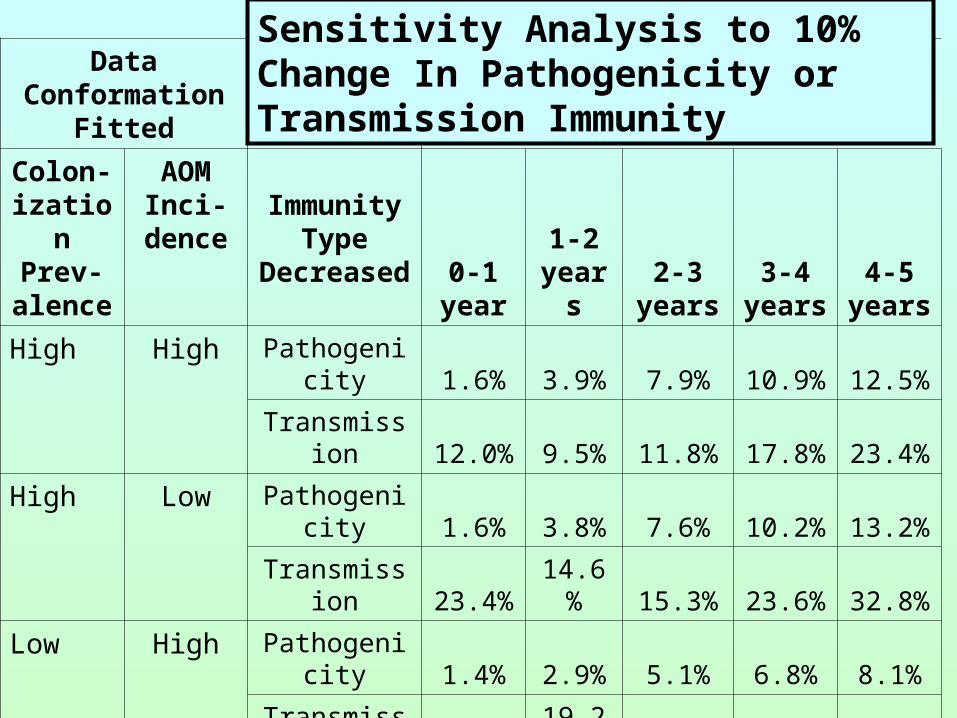
• What role does immunity affecting pathogenicity vs. transmission play in the sharp drop with age in NTHi otitis media?
• What vaccine effects should be sought and measured in trials?
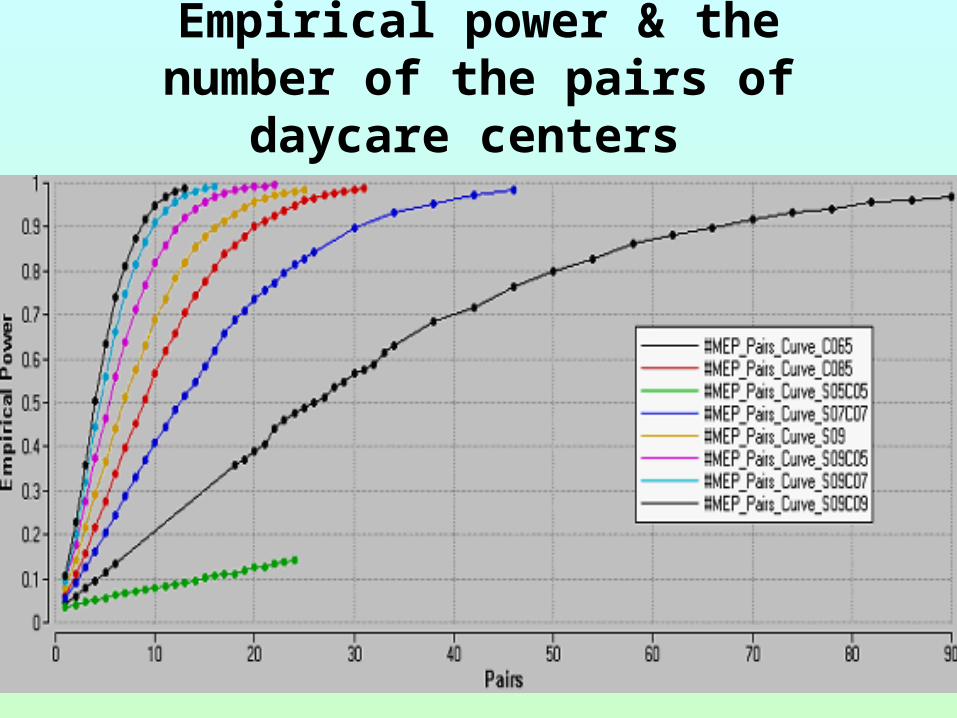
• How should vaccine trials be designed to insure adequate power to detect important effects?
General Issues Regarding NTHi
• Causes 20-40% of acute otitis media• Vaccine market 1 billion $ per year in U.S.• Infection, immunity, and disease data is
meager, non-specific, & highly variable• Knowledge of natural history of infection
and immunity is deficient• Unquestioned assumption that vaccine trials
will be individual based and assess disease outcomes
Aspects of NTHi (& many other bacterial) infections
• Partial immunity, rarely sterilizing– IgA proteases show evolutionary importance of
immunity
• Many variants arise due to transformation competency– No permanent strains yet identified
• Immunity to colonization or infection, disease, & transmission can be distinct
Using NTHi Models for Inference• Models with diverse natural Hx of infection and
immunity, age groupings, and contact patterns were constructed
• Deterministic compartmental (DC) models built first• Gradual acquisition of immunity with each colonization and continuous
loss over time
• All models were fit to the full range of data conformations deemed plausible using least squares
• Projections of vaccine effects made for all fits of all models (about 1000 total)
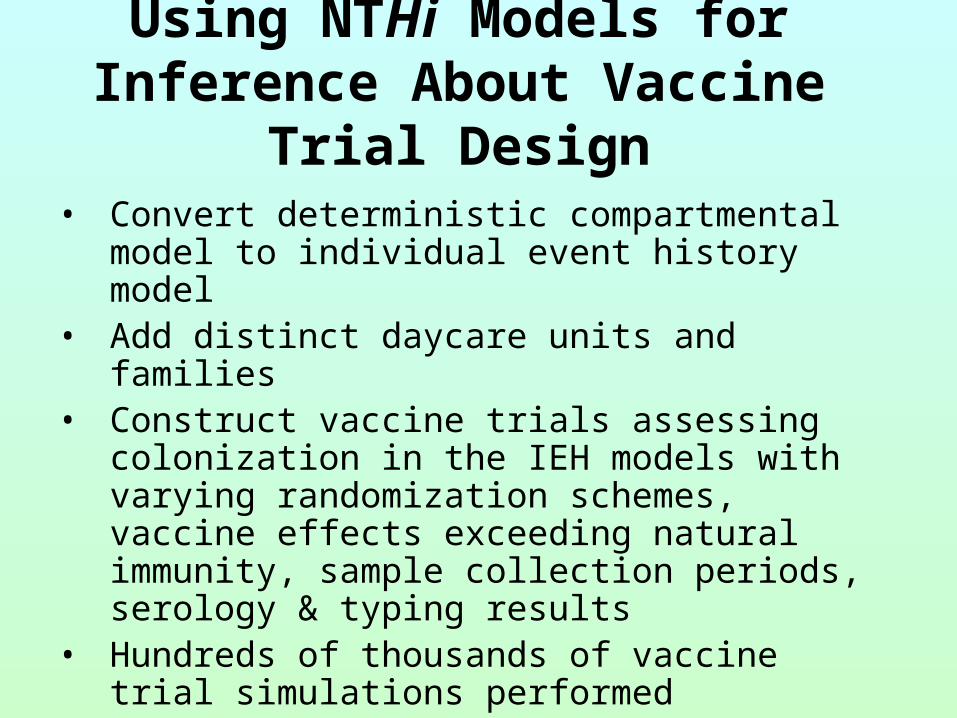
• Individual event history stochastic models corresponding to the DC models were used for vaccine trial design
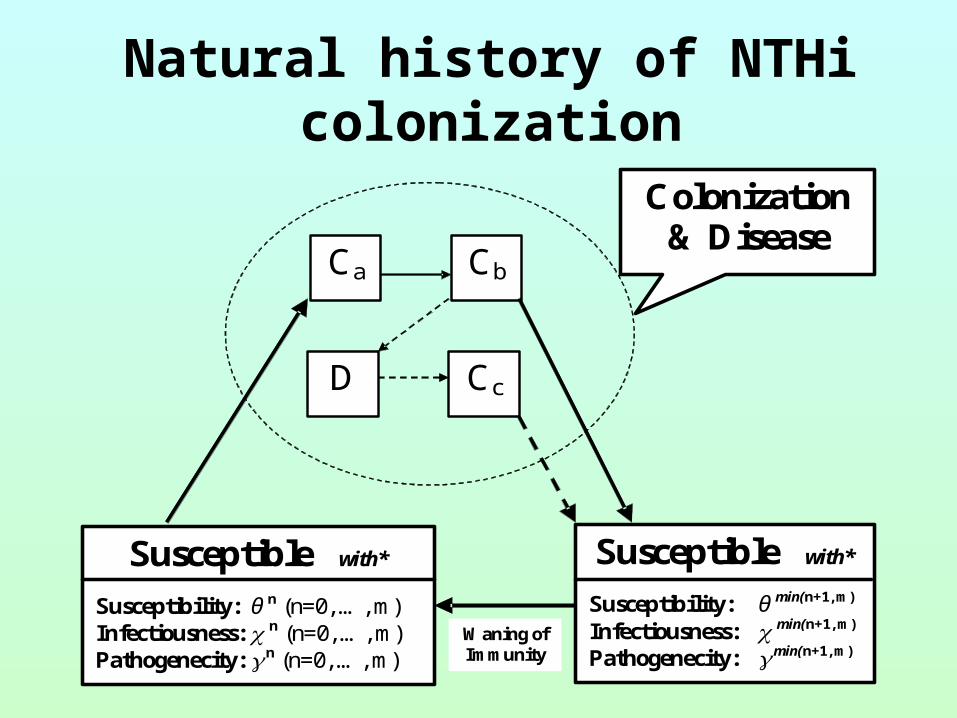
Natural history of NTHi colonization
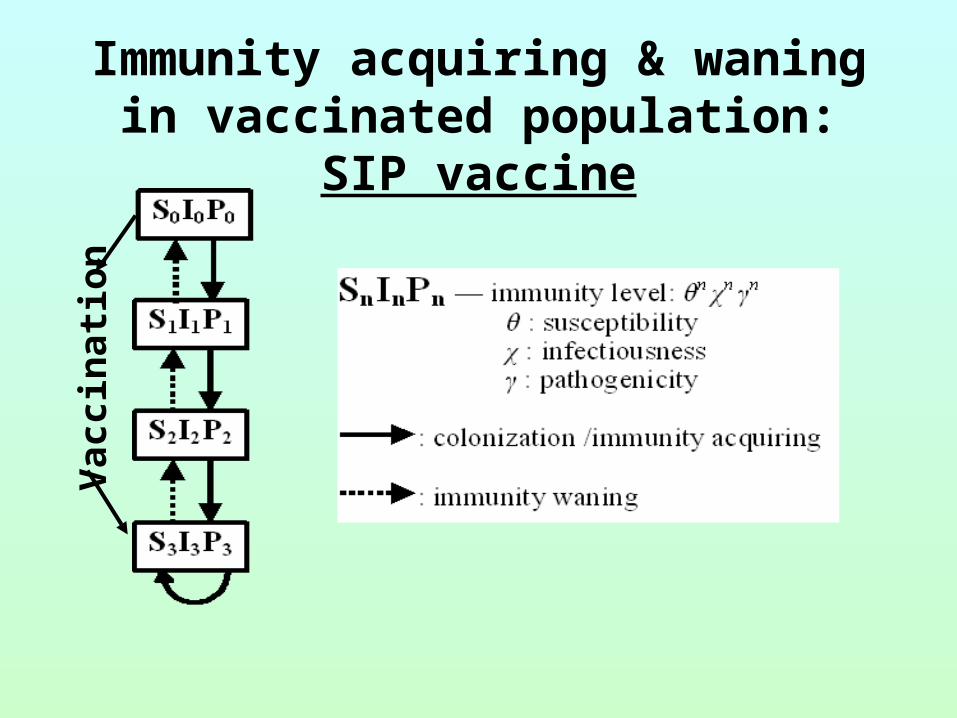
Susceptible with* Susceptibility: θ n (n=0, …, m) Infectiousness: n (n=0, …, m) Pathogenecity: n (n=0, …, m)
Ca Cb
Cc
D
Colonization & Disease
Susceptible with* Susceptibility: θ min(n+1, m) Infectiousness: min(n+1, m) Pathogenecity: min(n+1, m)
Waning of Immunity
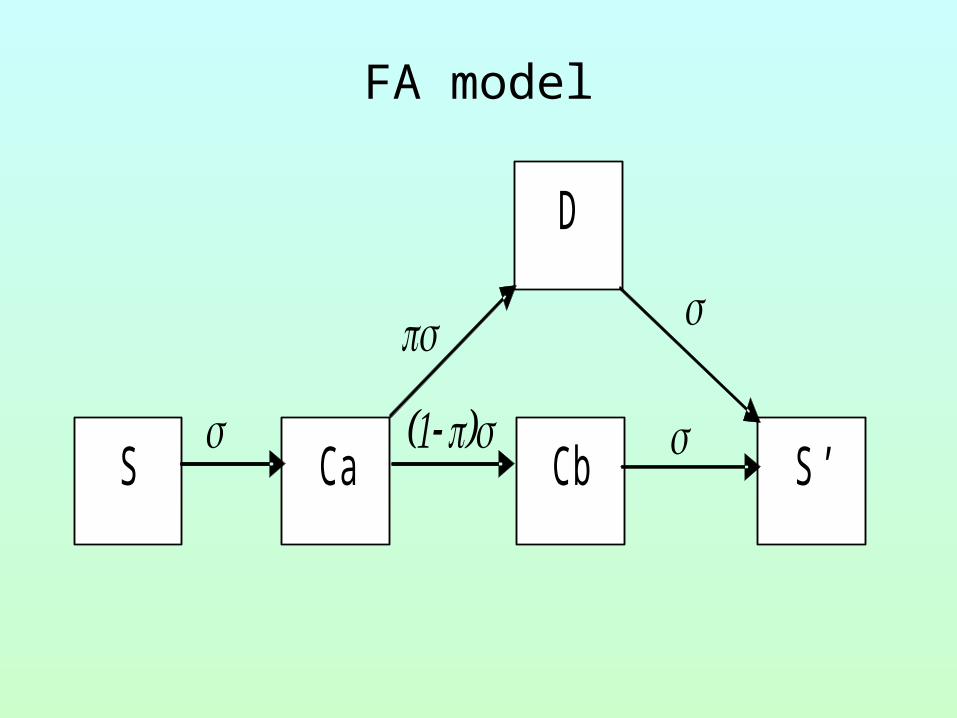
FA model
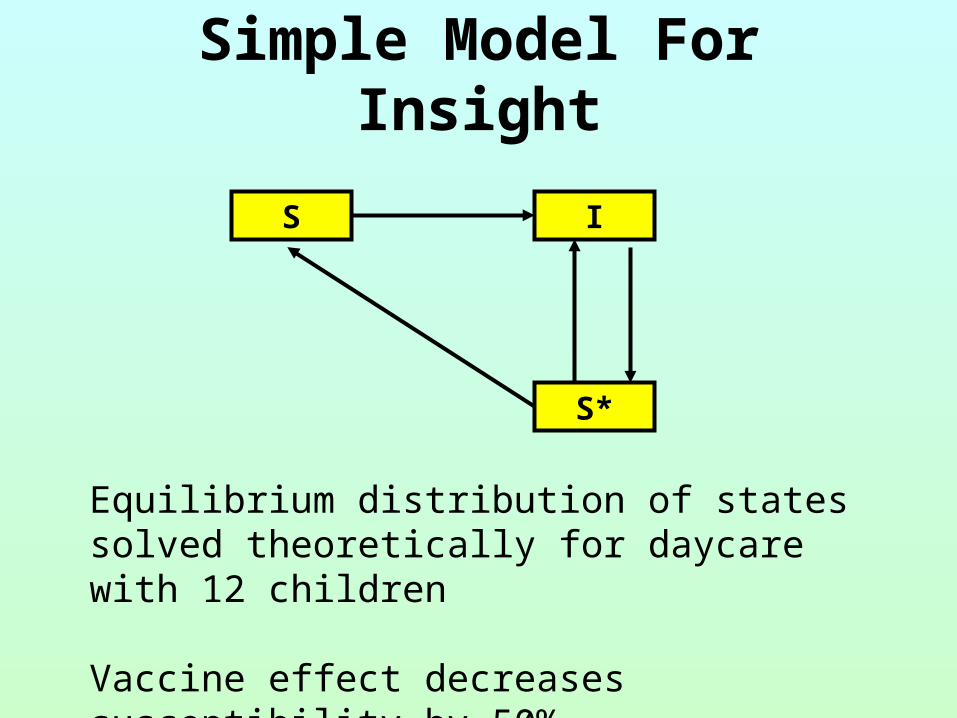
S
D
Cb Ca S ’
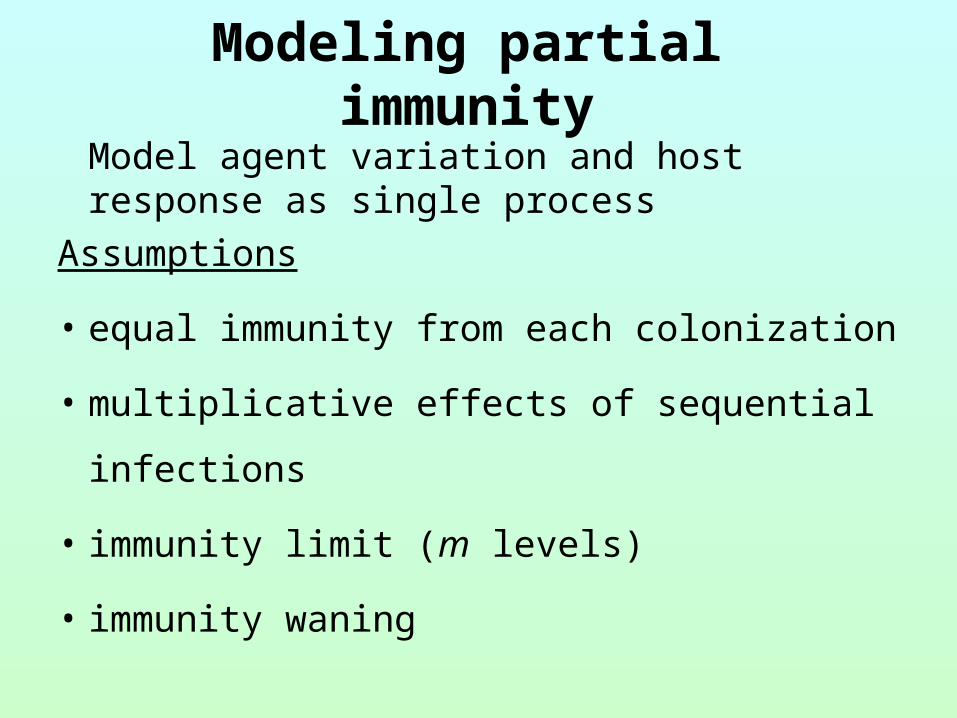
Modeling partial immunity
Model agent variation and host response as single process
Assumptions
• equal immunity from each colonization
• multiplicative effects of sequential infections
• immunity limit (m levels)
• immunity waning
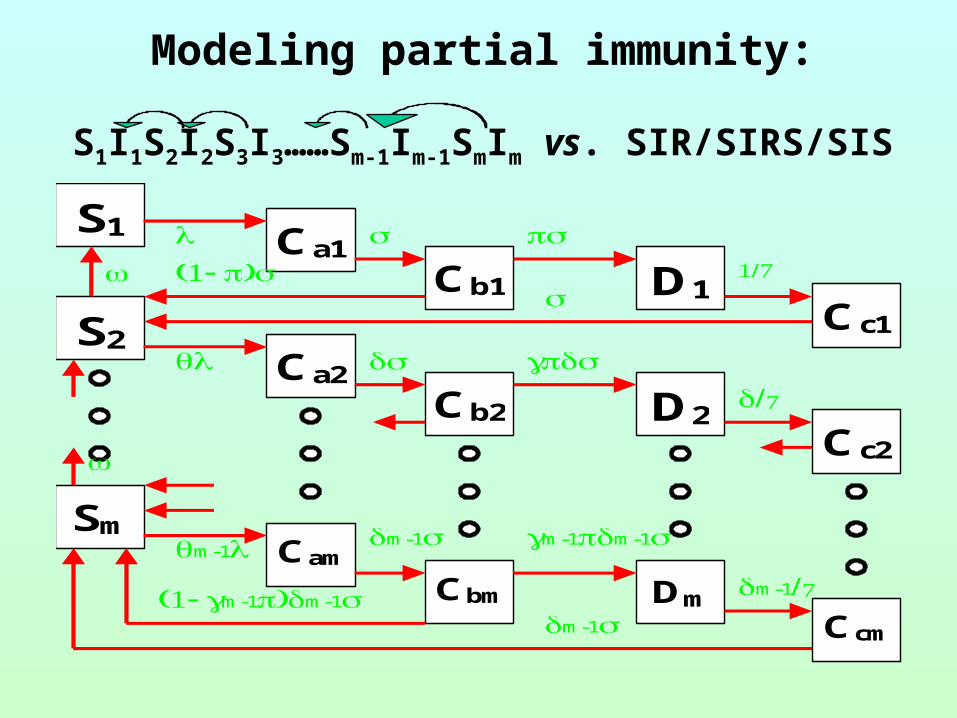
Modeling partial immunity:
S1I1S2I2S3I3……Sm-1Im-1SmIm vs. SIR/SIRS/SIS
S1 Ca1 Cb1 D1
Cc1
S2 Ca2
Cb2 D2 Cc2
Sm Cam
Cbm Dm Ccm
m-1 m-1 m-1m-1
m-1 m-1m-1m-1
Aspects of Immunity Modeled
• Susceptibility
• Contagiousness
• Pathogenicity
• Duration
• Preschool children (0.5-5 years)
1. Day-care + Non-day-care
2. 9 age groups with 6-month interval
• School children (5-15 years)
• Adults
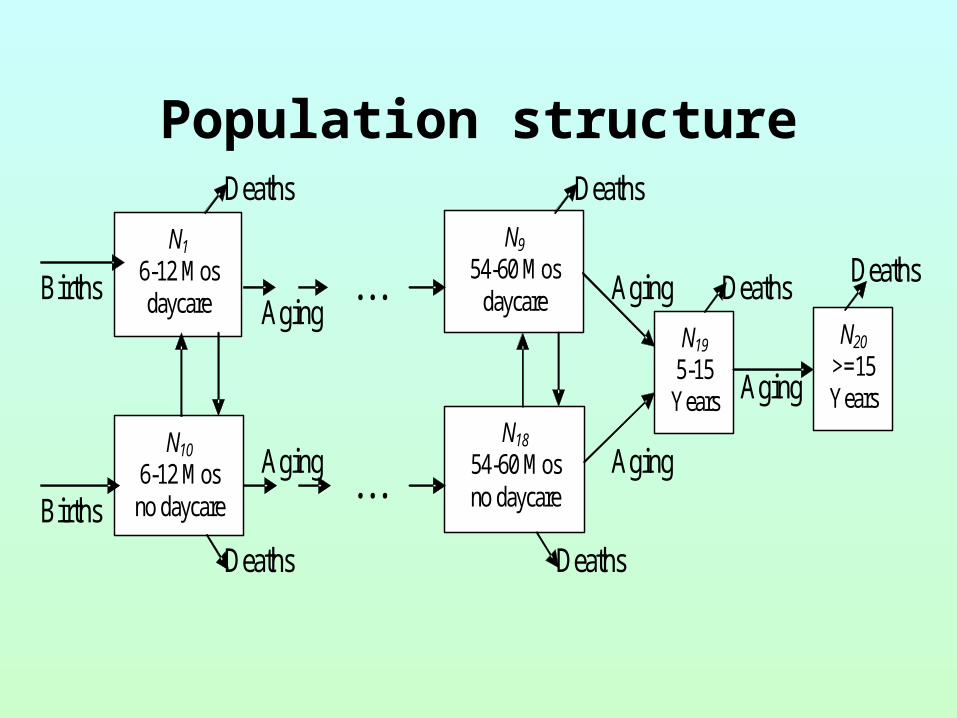
Population structure
Population structure
N1
6-12 Mos daycare
N10
6-12 Mos no daycare
N20
>=15Years
N19 5-15
Years N18
54-60 Mos no daycare
N9
54-60 Mos daycare
Deaths
Deaths Deaths
Deaths
Deaths
Deaths
Aging
Aging
Aging
. . .
. . . Aging
Aging
Births
Births
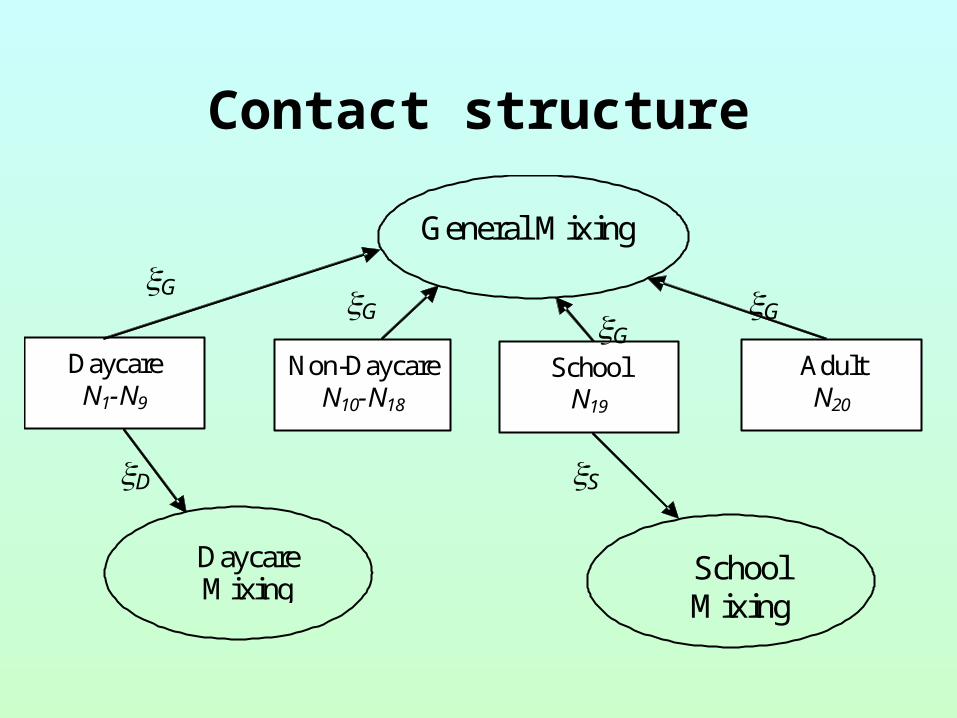
Contact structure
Daycare N1-N9
Non-Daycare N10-N18
School N19
Adult N20
General Mixing
Daycare Mixing
School Mixing
G G GG
D S
Death rate of individuals less than 1 year 0.00181
Death rate of individuals aged 1-2 years 0.00036
Death rate of individuals aged 3-4 years 0.00036
Death rate of individuals aged 5-15 years 0.00021
Death rate of individuals aged 15 years and over 0.01086
Annual birth rate into 7-12 month age group 0.00938
Rate at which children enter daycare 0.174
Rate at which children leave daycare 0.0358
Day-care attendance at 6 months 0.0785
* The units of all rates are year-1.
Population parameters
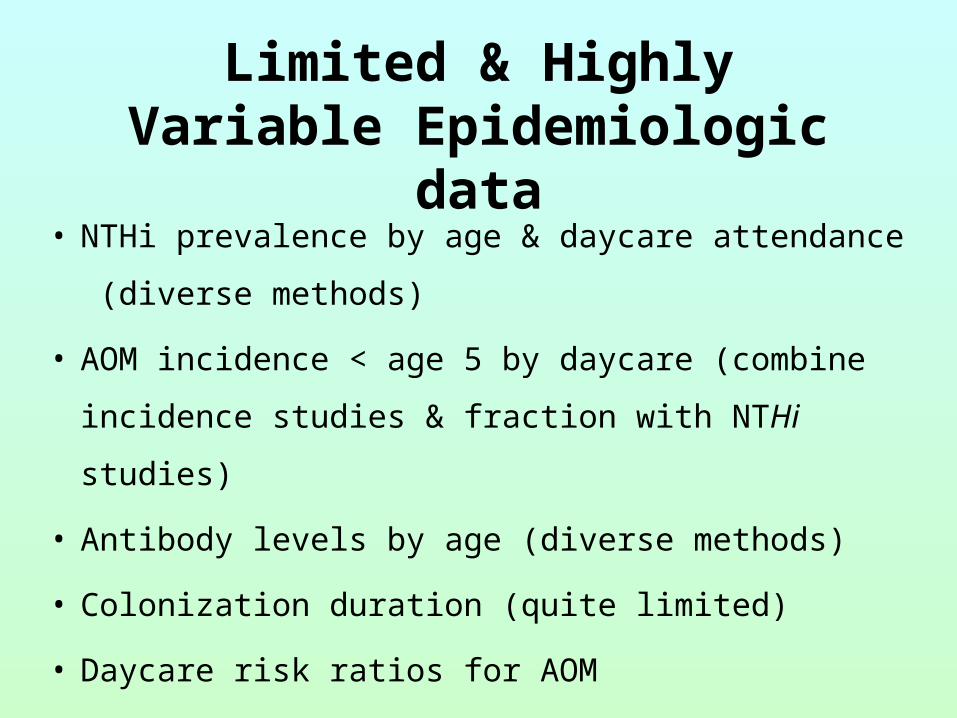
Limited & Highly Variable Epidemiologic data
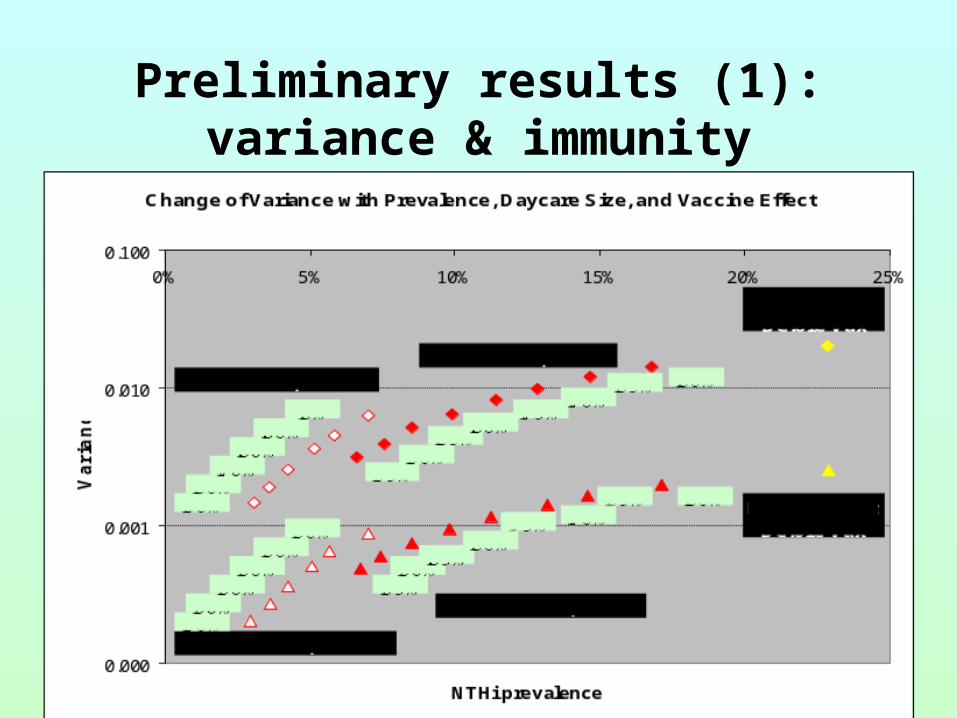
• NTHi prevalence by age & daycare attendance
(diverse methods)
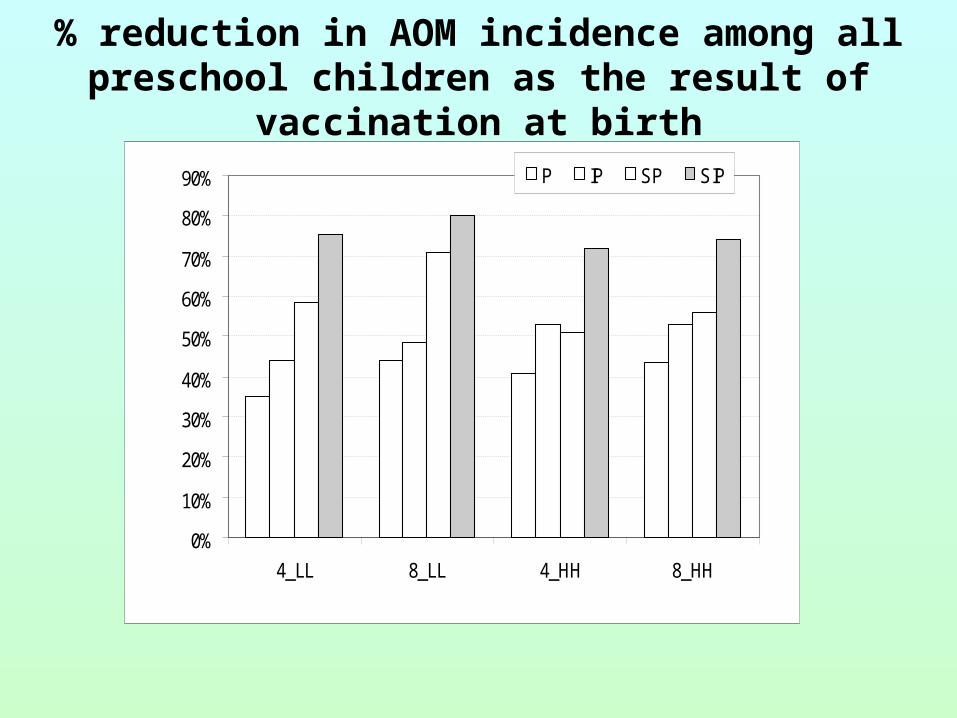
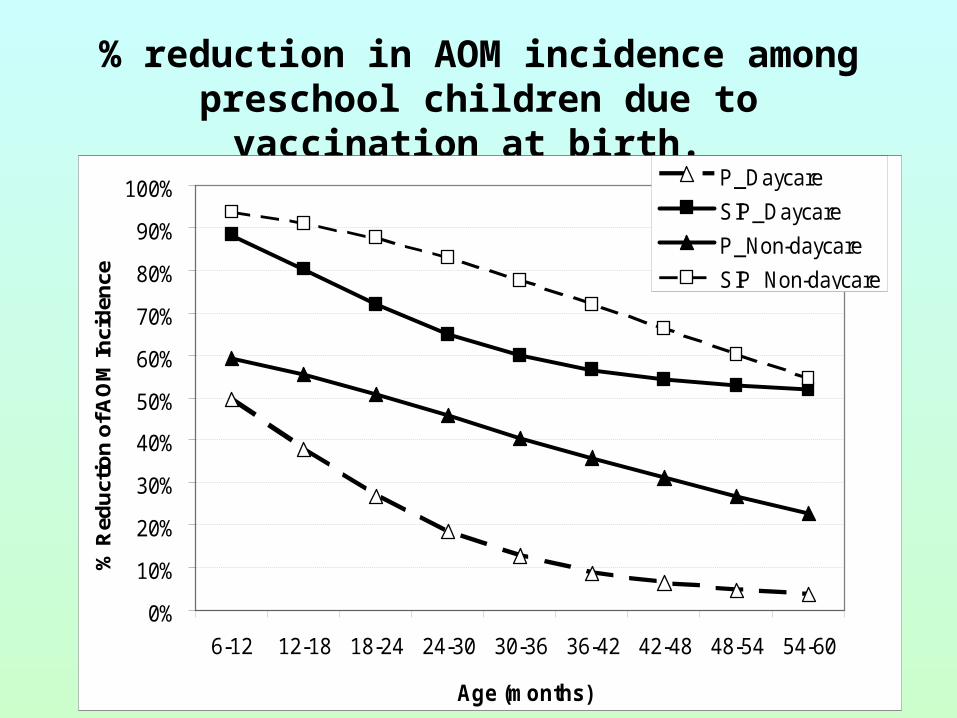
• AOM incidence < age 5 by daycare (combine incidence
studies & fraction with NTHi studies)
• Antibody levels by age (diverse methods)
• Colonization duration (quite limited)
• Daycare risk ratios for AOM
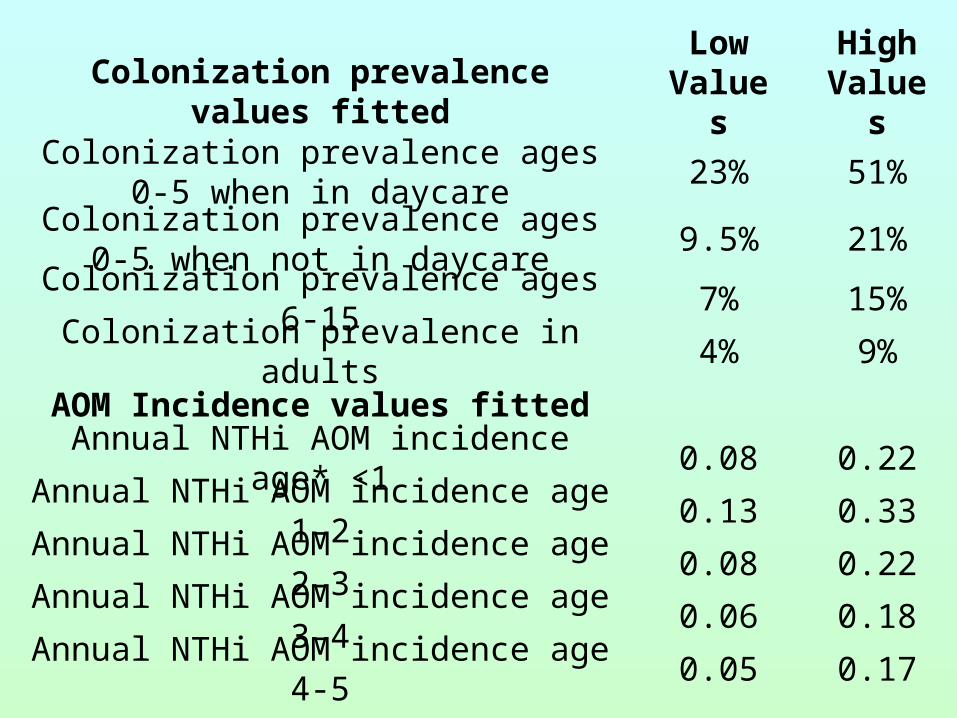
Low Values
High ValuesColonization prevalence values fitted
Colonization prevalence ages 0-5 when in daycare
23% 51%
Colonization prevalence ages 0-5 when not in daycare
9.5% 21%
Colonization prevalence ages 6-15 7% 15%
Colonization prevalence in adults 4% 9%
AOM Incidence values fitted
Annual NTHi AOM incidence age* <1 0.08 0.22
Annual NTHi AOM incidence age 1-2 0.13 0.33
Annual NTHi AOM incidence age 2-3 0.08 0.22
Annual NTHi AOM incidence age 3-4 0.06 0.18
Annual NTHi AOM incidence age 4-5 0.05 0.17
Other Data
• Antibody levels peak during elementary school
• Daycare Risk Ratios from 2 to 3
• Colonization mean of 2 months but many transient episodes and some long (limited data)
• Waning “seems” to be relatively fast
Presumptions Before Our Work
• Very different from Hi Type B
• Colonization is so frequent, even at older ages, that immunity to transmission cannot be important
• Trials should assess effects on AOM, not colonization
General assumptions of our model
• Every colonized individual is infectious
• Acute otitis media (AOM) is the only relevant
disease (Unlike Hi Type B or Strep pneumo)
• Maternal immunity (Children aged 0-6
months totally immune from colonization)
Fitting model to epidemiologic data
• Berkeley Madonna: “boundary value ODE…” & optimize functions
• Empirical identifiability checking
• Extensive robustness assessment for both data conformation and model conformation rather than estimating variance of estimates