Respiratory syncytial virus increases lung cellular bioenergetics in neonatal C57BL/6 mice Ahmed R. Alsuwaidi a,n , Alia Albawardi b , Saeeda Almarzooqi b , Sheela Benedict a , Aws R. Othman a , Stacey M. Hartwig c , Steven M. Varga c,nn , Abdul-Kader Souid a a Departments of Pediatrics, College of Medicine and Health Sciences, United Arab Emirates University, P.O. Box 17666, Al Ain, United Arab Emirates b Departments of Pathology, College of Medicine and Health Sciences, United Arab Emirates University, P.O. Box 17666, Al Ain, United Arab Emirates c Department of Microbiology, Department of Pathologyand Interdisciplinary Graduate Program in Immunology, University of Iowa, Iowa City, IA 52242, USA article info Article history: Received 14 December 2013 Returned to author for revisions 31 January 2014 Accepted 28 February 2014 Available online 21 March 2014 Keywords: Respiratory syncytial virus Cellular respiration Oxygen consumption Cellular ATP Mitochondria Neonates Mice C57BL/6 abstract We have previously reported that lung cellular bioenergetics (cellular respiration and ATP) increased in 4–10 week-old BALB/c mice infected with respiratory syncytial virus (RSV). This study examined the kinetics and changes in cellular bioenergetics in r2-week-old C57BL/6 mice following RSV infection. Mice (5–14 days old) were inoculated intranasally with RSV and the lungs were examined on days 1–10 post-infection. Histopathology and electron microscopy revealed preserved pneumocyte architectures and organelles. Increased lung cellular bioenergetics was noted from days 1–10 post-infection. Cellular GSH remained unchanged. These results indicate that the increased lung cellular respiration (measured by mitochondrial O 2 consumption) and ATP following RSV infection is independent of either age or genetic background of the host. & 2014 Elsevier Inc. All rights reserved. Introduction Cellular bioenergetics including mitochondrial O 2 consumption and ATP synthesis is necessary for viral survival. Viruses com- monly alter host cellular processes including gene expression, protein synthesis and membrane structure to facilitate viral replication (Maynard et al., 2010). Abundant nutrients and effi- cient flux of metabolic fuels are essential to support this process. Poliomyelitis virus, for example, stimulates glycolysis and ATP synthesis (Green et al., 1958; Levy and Baron, 1957). Similarly, human cytomegalovirus promotes glycolysis, citric acid cycle and nucleotide biosynthesis (Munger et al., 2006). Influenza virus infection exerts compound effects on host cell glycolysis (Fisher and Ginsberg, 1956; Klemperer, 1961). Thus, the metabolic impact of a viral infection within a host cell is complex and can vary widely between different viruses. Cellular bioenergetics includes all metabolic processes involved in energy conversion. Cellular respiration, on the other hand, implies delivery of O 2 and metabolic fuels to the mitochondria, oxidation of reduced metabolic fuels and passage of electrons to O 2 to form H 2 O (water of oxidation). We have previously reported that RSV induces increased cellular respiration and ATP in the lungs of adult BALB/c mice during the first week of infection (Alsuwaidi et al., 2013c). Following clearance of the virus, both cellular respiration rates and ATP levels return to pre-infection levels. In this study, we evaluated lung cellular respiration and ATP in neonatal C57BL/6 mice following RSV infection. Results Impact of RSV on lung cellular respiration and ATP in mouse neonates Fig. 1 shows representative runs of lung cellular mitochondrial O 2 consumption on days 2, 4 and 10 post-infection. O 2 concentra- tion decreased linearly with time. The rate of respiration (k c in mM Contents lists available at ScienceDirect journal homepage: www.elsevier.com/locate/yviro Virology http://dx.doi.org/10.1016/j.virol.2014.02.028 0042-6822 & 2014 Elsevier Inc. All rights reserved. n Corresponding author. Tel.: þ971 3 713 7411; fax: þ971 3 767 2022. nn Corresponding author. Tel.: þ319 335 8433. E-mail addresses: [email protected](A.R. Alsuwaidi), [email protected](A. Albawardi), [email protected](S. Almarzooqi), [email protected](S. Benedict), [email protected](A.R. Othman), [email protected](S.M. Hartwig), [email protected](S.M. Varga), [email protected](A.-K. Souid). Virology 454-455 (2014) 263–269
Ahmed R. Alsuwaidi a,n, Alia Albawardi b, Saeeda Almarzooqi b, Sheela Benedict a,Aws R. Othman a, Stacey M. Hartwig c, Steven M. Varga c,nn, Abdul-Kader Souid a
a Departments of Pediatrics, College of Medicine and Health Sciences, United Arab Emirates University, P.O. Box 17666, Al Ain, United Arab Emiratesb Departments of Pathology, College of Medicine and Health Sciences, United Arab Emirates University, P.O. Box 17666, Al Ain, United Arab Emiratesc Department of Microbiology, Department of Pathology and Interdisciplinary Graduate Program in Immunology, University of Iowa, Iowa City, IA 52242, USA
a r t i c l e i n f o
Article history:Received 14 December 2013Returned to author for revisions31 January 2014Accepted 28 February 2014Available online 21 March 2014
We have previously reported that lung cellular bioenergetics (cellular respiration and ATP) increased in4–10 week-old BALB/c mice infected with respiratory syncytial virus (RSV). This study examined thekinetics and changes in cellular bioenergetics in r2-week-old C57BL/6 mice following RSV infection.Mice (5–14 days old) were inoculated intranasally with RSV and the lungs were examined on days 1–10post-infection. Histopathology and electron microscopy revealed preserved pneumocyte architecturesand organelles. Increased lung cellular bioenergetics was noted from days 1–10 post-infection. CellularGSH remained unchanged. These results indicate that the increased lung cellular respiration (measuredby mitochondrial O2 consumption) and ATP following RSV infection is independent of either age orgenetic background of the host.
& 2014 Elsevier Inc. All rights reserved.
Introduction
Cellular bioenergetics including mitochondrial O2 consumptionand ATP synthesis is necessary for viral survival. Viruses com-monly alter host cellular processes including gene expression,protein synthesis and membrane structure to facilitate viralreplication (Maynard et al., 2010). Abundant nutrients and effi-cient flux of metabolic fuels are essential to support this process.Poliomyelitis virus, for example, stimulates glycolysis and ATPsynthesis (Green et al., 1958; Levy and Baron, 1957). Similarly,human cytomegalovirus promotes glycolysis, citric acid cycle andnucleotide biosynthesis (Munger et al., 2006). Influenza virusinfection exerts compound effects on host cell glycolysis (Fisherand Ginsberg, 1956; Klemperer, 1961). Thus, the metabolic impact
of a viral infection within a host cell is complex and can vary widelybetween different viruses.
Cellular bioenergetics includes all metabolic processes involvedin energy conversion. Cellular respiration, on the other hand,implies delivery of O2 and metabolic fuels to the mitochondria,oxidation of reduced metabolic fuels and passage of electrons toO2 to form H2O (water of oxidation).
We have previously reported that RSV induces increasedcellular respiration and ATP in the lungs of adult BALB/c miceduring the first week of infection (Alsuwaidi et al., 2013c).Following clearance of the virus, both cellular respiration ratesand ATP levels return to pre-infection levels. In this study, weevaluated lung cellular respiration and ATP in neonatal C57BL/6mice following RSV infection.
Results
Impact of RSV on lung cellular respiration and ATP in mouse neonates
Fig. 1 shows representative runs of lung cellular mitochondrialO2 consumption on days 2, 4 and 10 post-infection. O2 concentra-tion decreased linearly with time. The rate of respiration (kc in mM
Contents lists available at ScienceDirect
journal homepage: www.elsevier.com/locate/yviro
Virology
http://dx.doi.org/10.1016/j.virol.2014.02.0280042-6822 & 2014 Elsevier Inc. All rights reserved.
O2 min�1 mg�1) in mock infected lungs on day 2 was 0.17(Fig. 1A); the corresponding rate in the infected lungs was 0.24representing a 40% increase (Fig. 1B). The values of kc on days4 and 10 post-infection were 0.32 (Fig. 1C) and 0.20 (Fig. 1D),respectively. O2 consumption was inhibited by cyanide (Fig. 1C),confirming this zero-order kinetic process occurred mainly in themitochondrial respiratory chain. The reversible inhibition of cyto-chrome c oxidase by cyanide was incomplete, reflecting a known“leak” past the cyanide block (Slater, 1967). The addition of glucoseoxidase (catalyzing the reaction: D-glucoseþO2-D-glucono-δ-lactoneþH2O2) depleted remaining O2 in the solution.
Fig. 2A and B shows the kinetics of changes in cellularrespiration (panel A) and ATP (panel B) as a function of dayspost-inoculation with either RSV or PBS in 5–9 day-old-mice. Themeasured bioenergetic markers were higher from days 1–10post-infection. For days 1–10, the average (7SD) rate ofcellular respiration (kc in mM O2 min�1 mg�1) in mock infectedlungs was 0.11970.046 (n¼24) and in infected lungs it was0.16170.072 (n¼29, 35% higher, p¼0.052), Fig. 2A. Cellular ATPcontent (pmol mg�1) in mock infected lungs was 184760 (n¼14)and in infected lungs it was 294798 (n¼18, 75% higher,po0.001), Fig. 2B. Both lung cellular respiration and ATP nearlydoubled on day 4 post-infection (p¼0.010 and p¼0.057,respectively).
Fig. 2C and D shows the kinetics of changes in cellularrespiration (panel C) and ATP (panel D) as a function of dayspost-inoculation with either RSV or PBS in 13-day-old-mice.Similarly, the bioenergetic markers were also higher from days2–10 post-infection. For days 2–10, the value of kc in mock infectedlungs was 0.09070.028 mM O2 min�1 mg�1 (n¼11) and ininfected lungs it was 0.16770.028, representing an 85% increase(n¼15, p¼0.002), Fig. 2C. Cellular ATP in mock infected lungs was175754 pmol mg�1 (n¼9) and in infected lungs it was 3187178(n¼12, 82% higher, p¼0.001), Fig. 2D. Both lung cellular respira-tion and ATP content peaked after day 4 post-infection. Therefore,lung cellular respiration and ATP were significantly increased fromdays 1–10 post-infection in both age groups (r9-day-old and13-day-old mice).
In C57BL/6 mice of Z4 weeks of age, the rate of respiration (kcin mM O2 min�1 mg�1) in mock infected lungs on days 3–5 post-inoculation was 0.0770.02 (n¼7) and in RSV infected mice it was0.1470.06 (n¼8, p¼0.004).
The augmented cellular respiration in RSV infection is lung-specific. The heart muscle cellular respiration was unaffected byRSV infection (data not shown). For example, on day 7 post-inoculation, the rate of cardiomyocyte respiration in a mockinfected mouse was 0.22 mM O2 min�1 mg�1 and in a RSV infectedmouse it was 0.18 mM O2 min�1 mg�1.
0
50
100
150
200
0 5 10 15 20 25 30
min
[O2],
µM
[O2],
µM
[O2],
µM
[O2],
µM
Mock infected - Day 2
25.6 mg specimen
k = 0.17 M O min mg
0
50
100
150
200
0 5 10 15 20 25 30
29.0 mg specimen
min
k = 0.24 M O min mg
RSV infected - Day 2
0
50
100
150
200
0 5 10 15 20 25 30
NaCNglucoseoxidase
RSV infected - Day 4
22.0 mg specimen
k = 0.32 M O min mg
k = 0.05
(76% inhibition)
min
0
50
100
150
200
250
0 5 10 15 20 25 30 35
25.0 mg specimen
min
k = 0.20 M O min mg
RSV infected - Day 10
µµ
µ
µ
Fig. 1. Lung tissue cellular respiration in RSV infected and mock infected mice. Representative runs of cellular mitochondrial O2 consumption by lung specimens are shown.The O2 measurements were performed at 37 1C immediately after sample collection. The lung fragments were placed in a sealed glass vial containing Krebs-Henseleit buffersupplemented with 3 mM Pd phosphor and 0.5% fat-free albumin. The rate of respiration (k in μM O2 min�1) was the negative of slope of [O2] vs. t. The values of k werecorrected for sample weight (kc in μM O2 min�1 mg�1). The additions of 10 mM NaCN and 50 mg/mL glucose oxidase are shown.
A.R. Alsuwaidi et al. / Virology 454-455 (2014) 263–269264
Impact of RSV on pneumocyte architectures and organelles in mouseneonates
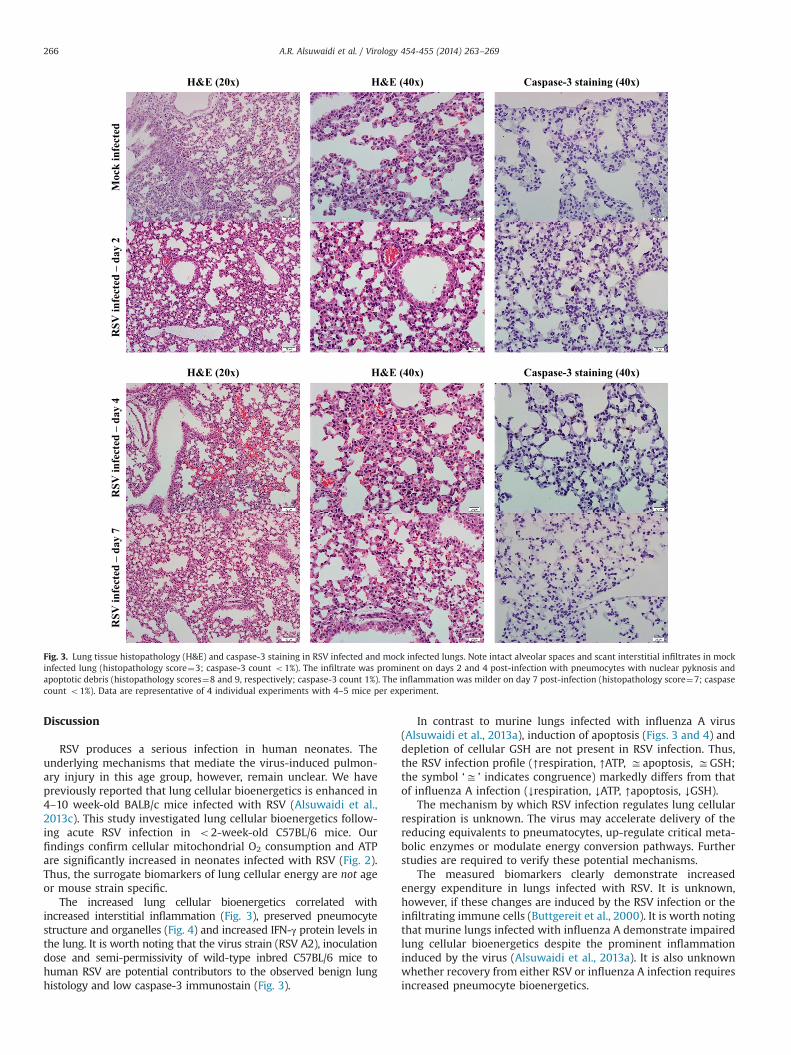
Fig. 3 shows representative histopathology in infected andmock infected lungs. In mock infected lungs, intact alveolar spaceswith sparse interstitial mononuclear cells are present and a fewpneumocytes with nuclear pyknosis and apoptotic debris werenoted (histopathology score¼3); caspase-3 count was o1%. Ininfected lungs on days 2 and 4, an interstitial mononuclear cellinfiltrate was prominent with more pneumocytes exhibitingnuclear pyknosis and an increase in apoptotic debris (histopathol-ogy scores¼8 and 9, respectively); caspase-3 count was 1%. Ininfected lungs on day 7, the inflammation was milder and thecaspase count was o1% (histopathology score¼7), Fig. 3. Repre-sentative EM images of mock infected and infected lungs on days2, 4, 7 and 10 after inoculation are shown in Fig. 4. Thepneumocyte architectures and organelles were preserved in allstudied specimens.
Impact of RSV on lung tissue GSH and IFN-γ protein levels in mouseneonates
Cellular GSH levels were unchanged throughout the course ofinfection (7 separate experiments involving 17 mice); the GSHlevel was 9767170 pmol mg�1 (n¼6) in mock infected lungs and10297297 (n¼11) in infected lungs (p¼0.884). IFN-γ protein level(pg mg�1) increased in the lung tissue on day 4 post-infection(0.37470.164 vs. 0.60070.360, n¼9, p¼0.482, 5 separate experi-ments involving 38 mice), Fig. 6D.
Lung tissue reverse transcriptase PCR (RT-PCR) in mouse neonates
Fig. 5 shows representative RT-PCR of lung tissue from 14-day-old mock infected and RSV infected C57BL/6 mice. The RSVgenome (334 base pair) was evident on days 2, 4 and 7 post-infection and was absent from mock infected lungs.
Fig. 2. Lung tissue cellular respiration and ATP in RSV infected and mock infected mice. Rates of cellular respiration (panels A and C) and ATP (panels B and D) as a function ofdays post-inoculation with the RSV or PBS for 5–9 day old (panels A and B) and 13-day-old mice. Ten experiments (98 mice) included measurements of respiration. Twelveexperiments (72 mice) included measurements of cellular ATP.
A.R. Alsuwaidi et al. / Virology 454-455 (2014) 263–269 265
Discussion
RSV produces a serious infection in human neonates. Theunderlying mechanisms that mediate the virus-induced pulmon-ary injury in this age group, however, remain unclear. We havepreviously reported that lung cellular bioenergetics is enhanced in4–10 week-old BALB/c mice infected with RSV (Alsuwaidi et al.,2013c). This study investigated lung cellular bioenergetics follow-ing acute RSV infection in o2-week-old C57BL/6 mice. Ourfindings confirm cellular mitochondrial O2 consumption and ATPare significantly increased in neonates infected with RSV (Fig. 2).Thus, the surrogate biomarkers of lung cellular energy are not ageor mouse strain specific.
The increased lung cellular bioenergetics correlated withincreased interstitial inflammation (Fig. 3), preserved pneumocytestructure and organelles (Fig. 4) and increased IFN-γ protein levels inthe lung. It is worth noting that the virus strain (RSV A2), inoculationdose and semi-permissivity of wild-type inbred C57BL/6 mice tohuman RSV are potential contributors to the observed benign lunghistology and low caspase-3 immunostain (Fig. 3).
In contrast to murine lungs infected with influenza A virus(Alsuwaidi et al., 2013a), induction of apoptosis (Figs. 3 and 4) anddepletion of cellular GSH are not present in RSV infection. Thus,the RSV infection profile (↑respiration, ↑ATP, ffiapoptosis, ffiGSH;the symbol ‘ffi ’ indicates congruence) markedly differs from thatof influenza A infection (↓respiration, ↓ATP, ↑apoptosis, ↓GSH).
The mechanism by which RSV infection regulates lung cellularrespiration is unknown. The virus may accelerate delivery of thereducing equivalents to pneumatocytes, up-regulate critical meta-bolic enzymes or modulate energy conversion pathways. Furtherstudies are required to verify these potential mechanisms.
The measured biomarkers clearly demonstrate increasedenergy expenditure in lungs infected with RSV. It is unknown,however, if these changes are induced by the RSV infection or theinfiltrating immune cells (Buttgereit et al., 2000). It is worth notingthat murine lungs infected with influenza A demonstrate impairedlung cellular bioenergetics despite the prominent inflammationinduced by the virus (Alsuwaidi et al., 2013a). It is also unknownwhether recovery from either RSV or influenza A infection requiresincreased pneumocyte bioenergetics.
H&E (20x) H&E (40x) Caspase-3 staining (40x)
Moc
k in
fect
edR
SV in
fect
ed –
day
2
H&E (20x) H&E (40x) Caspase-3 staining (40x)
RSV
infe
cted
–da
y 4
RSV
infe
cted
–da
y 7
Fig. 3. Lung tissue histopathology (H&E) and caspase-3 staining in RSV infected and mock infected lungs. Note intact alveolar spaces and scant interstitial infiltrates in mockinfected lung (histopathology score¼3; caspase-3 count o1%). The infiltrate was prominent on days 2 and 4 post-infection with pneumocytes with nuclear pyknosis andapoptotic debris (histopathology scores¼8 and 9, respectively; caspase-3 count 1%). The inflammation was milder on day 7 post-infection (histopathology score¼7; caspasecount o1%). Data are representative of 4 individual experiments with 4–5 mice per experiment.
A.R. Alsuwaidi et al. / Virology 454-455 (2014) 263–269266
Viral-induced reactive O2 species (ROS) are known to depletecellular GSH depletion and induce apoptosis (Snelgrove et al.,2006). The findings that GSH and caspase levels remainunchanged suggest a minimum role for ROS in RSV infection.Influenza A virus, on the other hand, is associated with GSHdepletion (ROS production) and induction of apoptosis(Alsuwaidi et al., 2013a; Snelgrove et al., 2006).
The impact of changes in lung cellular bioenergetics on theunderstanding of RSV infection requires further investigation.Intact mitochondria and lack of caspase activities are required to
support increased cellular energy demand (expenditure) in thelungs following acute RSV infection. Adequate nutrition of infantsinfected with RSV is essential to meet these increased metabolicrequirements. The increased nutrient demand cannot be fully metduring influenza A virus infection due to mitochondrial dysfunc-tion as indicated by inhibition of cellular respiration and decreasedof cellular ATP (Alsuwaidi et al., 2013a).
In conclusion, intact mitochondrial function (pneumocytebioenergetics) and structure are hallmarks of RSV infected lungs,supporting the increased energy demand set by the virus orassociated inflammation.
Materials and methods
Reagents and solutions
Pd(II) complex of meso-tetra-(4-sulfonatophenyl)-tetrabenzo-porphyrin (Pd phosphor) was purchased from Porphyrin Products(Logan, UT). Monobromobimane (mBBr, 271.111) was purchasedfrom Molecular Probes (Eugene, Oregon). Completes proteaseinhibitor cocktail was purchased from Roche Applied Science(Indianapolis, IN). Avidin-biotin immunoperoxidase was pur-chased from Cell Signaling Technology (Boston, MA). Glucose,GSH (mol. wt. 307.43), HPLC-grade methanol, trifluoroacetic acid,
A (Mock infected) B (RSV infected - Day 2) C (RSV infected - Day 4)
D (RSV infected - Day 7) E (RSV infected - Day 7) F (RSV infected - Day 10)
Pn
Fig. 4. Electron microscopy (EM) images of RSV infected and mock infected lungs. Panel A: mock infected lung showing well-preserved pneumocyte structure (arrow) andcellular organelles (magnification �4900). Panel B: infected lung (Day 2) showing preserved cellular organelles including lamellar bodies (arrow) of type-II pneumocytes(magnification �27,500). Panel C: infected lung (Day 4) showing the cellular organelles being well-preserved. Note the nucleus of type-II pneumocyte (Pn) and lamellarbodies (arrow) (magnification �18,000). Panel D: infected lung (Day 7); the arrow demonstrates pleomorphic round viral particles (arrow) present outside a cell adjacent tofilamentaous viral particles just superior to it (magnification �14,000). Panel E: infected lung (Day 7) showing that most cells contained a relatively well-preservedmitochondria; only some had swollen mitochondria (m) as seen in image. Note the cytoplasmic vesicle with viral particles (arrow) (magnification �275,000). Panel F:infected lung (Day 10) showing the cellular details and integrity are preserved (magnification �4900). Pn—pneumocyte, and m—mitochondria. One experiment (12 mice)was performed.
334 bp
MW
M
Moc
k in
fect
ed
RSV
infe
cted
day
2
RSV
RSV
infe
cted
day
4
RSV
infe
cted
day
7
Fig. 5. Reverse transcriptase (RT) PCR of lung tissue from 14-day-old mock infectedand RSV infected C57BL/6 mice. Molecular weight markers (MWM): 250, 350 and450 base pair (bp) were used. The molecular weight of RSV is shown (334 bp).Representative of two separate experiments (10 mice) is shown.
A.R. Alsuwaidi et al. / Virology 454-455 (2014) 263–269 267
N-ethylmaleimide (NEM, forms thioether bonds with sulfhydryls)and remaining reagents were purchased from Sigma-Aldrich(St. Louis, MO).
Pd phosphor, NaCN, GSH, glucose oxidase and Krebs-Henseleitbuffer were prepared as described (Alsuwaidi et al., 2013b, 2013c;Jocelyn, 1987; Souid et al., 2001). NEM (0.1 M) was made inethanol and stored at �20 1C. One tablet of the Completes
protease inhibitors was dissolved in 2.0 mL dH2O and stored at�20 1C. For O2 measurement, the lung specimens were immedi-ately placed in 1 mL glass vials containing 1.0 mL Krebs-Henseleitbuffer with 3 mM Pd phosphor and 0.5% albumin. The vials weresealed from air and O2 concentrations were determined at 37 1C asa function of time as described (Alsuwaidi et al., 2013b). Speci-mens were immediately processed for ATP, IFN-γ, and PCR aspreviously described (Alsuwaidi et al., 2013b, 2013c). GSH waslabeled with mBBr and analyzed on HPLC as described (Souidet al., 2001).
RSV infection
RSV A2 was propagated in HEp-2 cells as previously described(Alsuwaidi et al., 2013c). C57BL/6 mice, 5–14 days old, (JacksonLaboratory, Bar Harbor, ME) were housed in a room maintained at22 1C with 60% relative humidity. All protocols received approvalfrom the Animal Ethics Committee—UAE University—College ofMedicine and Health Sciences (Protocol no. A12/11). Mice wereinoculated intranasally with 4.8�105 pfu, equivalent to
approximately 0.5–1.0�105 pfu per gram body weight, in 15 mltotal volume of either RSV A2 or phosphate buffered saline (PBS).Mice were grouped into RSV infected and mock infected andremained with their mothers in separate cages. The mice wereanesthetized by sevoflurane inhalation (100 ml per 10 g) andsacrificed on days 1–10 following infection (Alsuwaidi et al.,2013b). Sixteen separate experiments involving 147 mice wereperformed.
Histology
Specimens were immediately processed for histology as pre-viously described (Alsuwaidi et al., 2013b, 2013c). Each section wasgraded based on the following categories: (A) peribronchiolar andbronchial infiltrates (none, o25%, 25–75%, and 475%); (B) qualityof peribronchiolar and bronchial infiltrates (none, interruptedcollar, complete collar o5 cells thick, and complete collar 45cells thick); (C) bronchiolar and bronchial luminal exudates (none,r25% luminal occlusion, and Z25% luminal occlusion);(D) perivascular infiltrates (none, o10%, 10–50%, and 450%),and (E) parenchymal pneumonia (none, patchy parenchymalinfiltrates, and heavy parenchymal infiltrates). A numeric scorethat ranged from 0 to 26 was calculated as: “Aþ3(BþC)þDþE”(Cimolai et al., 1992; Hardy et al., 2001).
Staining for apoptosis was performed using avidin-biotinimmunoperoxidase, which detected active caspase-3. The proce-dure was performed on 3 μm paraffin sections using rabbit
0
200
400
600
800
1000
12 13 14 15 16 17 18
200pmol
100pmol
Flou
resc
ent i
nten
sity
min
GSH y = 3.8096e+5x
500
1000
1500
Cel
lula
r G
SH (p
mol
mg-1
)
Mock infected RSV infected
p=.884
0
2000
4000
6000
8000
10000
10 12 14 16 18 20
Mock infectedRSV infected
Fluo
resc
ent i
nten
sity
min
GSH
0
0.2
0.4
0.6
0.8
1
1.2
1.4 Mock infectedRSV infected
Day 2(n = 6)
Day 4(n = 12)
Day 7(n =11)
Day 10(n = 9)
p=.482
Lun
g tis
sue
IFN
- (p
g m
g-1)
γ
Fig. 6. Lung tissue GSH and IFN-γ. Panel A: representative HPLC runs of 100 and 200 pmol GSH (retention time¼�14.2 min). Panel B: representative HPLC runs of cellularGSH in mock infected and RSV infected lungs. Panel C: summary results of GSH (7 separate experiments involving 17 mice). Panel D: lung tissue IFN-γ protein levels.
A.R. Alsuwaidi et al. / Virology 454-455 (2014) 263–269268
anti-cleaved caspase-3 (Alsuwaidi et al., 2013b). Samples were alsoprocessed for electron microscopy (EM) as previously described(McDowell and Trump, 1976).
IFN-γ
The mouse cytokine ELISA kit (E-Biosciences, San Diego, CA)was used to detect IFN-γ. Lung specimens were homogenized in1.0 mL of KH buffer supplemented with 40 ml Completes proteaseinhibitors. The supernatants were collected by centrifugation(1000� g at 4 1C for 20 min) and assayed in duplicate. Thestandard curve (15–2000 pg/ml) was linear (R40.99) and thedetection sensitivity was 15 pg/ml.
Statistical analysis
The nonparametric test (2 independent variables) of Mann-Whitney was used (SPSS statistical package, version 19).
Acknowledgments
This research is supported by a grant from the United ArabEmirates University (31M117).
References
Alsuwaidi, A.R., Almarzooqi, S., Albawardi, A., Benedict, S., Kochiyil, J., Mustafa, F.,Hartwig, S.M., Varga, S.M., Souid, A.K., 2013a. Cellular bioenergetics, caspaseactivity and glutathione in murine lungs infected with influenza A virus.Virology 446, 180–188.
Alsuwaidi, A.R., Benedict, S., Kochiyil, J., Mustafa, F., Hartwig, S.M., Almarzooqi, S.,Albawardi, A., Rizvi, T.A., Varga, S.M., Souid, A.K., 2013c. Bioenergetics of murinelungs infected with respiratory syncytial virus. Virol. J. 10, 22.
Buttgereit, F., Burmester, G.R., Brand, M.D., 2000. Bioenergetics of immune func-tions: fundamental and therapeutic aspects. Immunol. Today 21, 192–199.
Cimolai, N., Taylor, G.P., Mah, D., Morrison, B.J., 1992. Definition and application of ahistopathological scoring scheme for an animal model of acute Mycoplasmapneumoniae pulmonary infection. Microbiol. Immunol. 36, 465–478.
Fisher, T.N., Ginsberg, H.S., 1956. The reaction of influenza viruses with guinea pigpolymorphonuclear leucocytes. II. The reduction of white blood cell glycolysisby influenza viruses and receptor-destroying enzyme (RDE). Virology 2,637–655.
Green, M., Henle, G., Deinhardt, F., 1958. Respiration and glycolysis of human cellsgrown in tissue culture. Virology 5, 206–219.
Hardy, R.D., Jafri, H.S., Olsen, K., Wordemann, M., Hatfield, J., Rogers, B.B., Patel, P.,Duffy, L., Cassell, G., McCracken, G.H., Ramilo, O., 2001. Elevated cytokine andchemokine levels and prolonged pulmonary airflow resistance in a murineMycoplasma pneumoniae pneumonia model: a microbiologic, histologic, immu-nologic, and respiratory plethysmographic profile. Infect. Immun. 69,3869–3876.
Jocelyn, P.C., 1987. Spectrophotometric assay of thiols. Methods Enzymol. 143,44–67.
Levy, H.B., Baron, S., 1957. The effect of animal viruses on host cell metabolism. II.Effect of poliomyelitis virus on glycolysis and uptake of glycine by monkeykidney tissue cultures. J. Infect. Dis.100, 109–118.
Maynard, N.D., Gutschow, M.V., Birch, E.W., Covert, M.W., 2010. The virus asmetabolic engineer. Biotechnol. J. 5, 686–694.
McDowell, E.M., Trump, B.F., 1976. Histologic fixatives suitable for diagnostic lightand electron microscopy. Arch. Pathol. Lab. Med. 100, 405–414.
Munger, J., Bajad, S.U., Coller, H.A., Shenk, T., Rabinowitz, J.D., 2006. Dynamics of thecellular metabolome during human cytomegalovirus infection. PLoS Pathog. 2,e132.
Slater, E.C., 1967. Application of inhibitors and uncouplers for a study of oxidativephosphorylation. In: Estabrook, R.W., Pullman, M.E. (Eds.), Method Enzymol.,10. Academic Press, New York and London, pp. 48–57.
Snelgrove, R.J., Edwards, L., Rae, A.J., Hussell, T., 2006. An absence of reactive oxygenspecies improves the resolution of lung influenza infection. Eur. J. Immunol. 36,1364–1373.
Souid, A.K., Fahey, R.C., Aktas, M.K., Sayin, O.A., Karjoo, S., Newton, G.L., Sadowitz, P.D., Dubowy, R.L., Bernstein, M.L., 2001. Blood thiols following amifostine andmesna infusions, a pediatric oncology group study. Drug Metab. Dispos.: Biol.Fate Chem. 29, 1460–1466.
A.R. Alsuwaidi et al. / Virology 454-455 (2014) 263–269 269