Response of an isolated structure with deteriorating hysteretic isolator model Gökhan Özdemir*, Beyhan Bayhan Online Publication Date: 7 Feb 2015 URL: http://www.jresm.org/archive/resm2014.01st1216.html DOI: http://dx.doi.org/10.17515/resm2014.01st1216 Journal Abbreviation: Res. Eng. Struct. Mat. To cite this article Özdemir G, Bayhan B. Response of an isolated structure with deteriorating hysteretic isolator model. Res. Eng. Struct. Mat., 2015; 1: 1 – 10. Disclaimer All the opinions and statements expressed in the papers are on the responsibility of author(s) and are not to be regarded as those of the journal of Research on Engineering Structures and Materials (RESM) organization or related parties. The publishers make no warranty, explicit or implied, or make any representation with respect to the contents of any article will be complete or accurate or up to date. The accuracy of any instructions, equations, or other information should be independently verified. The publisher and related parties shall not be liable for any loss, actions, claims, proceedings, demand or costs or damages whatsoever or howsoever caused arising directly or indirectly in connection with use of the information given in the journal or related means.
Article history: Received 16 Dec 2014Revised 26 Jan 2015 Accepted 27 Jan 2015
Cyclicmotionofleadrubberbearings(LRBs)leadstoincreasingtemperatureinleadcore initiating the reduction in strength of LRB. This reduction results in adeterioratingbi‐linearforcedeformationrelationforLRB.Inthisstudy,responseofLRBs(withdeterioratinghysteresis loopsduetotemperaturechange)subjectedtonear‐field ground motions with distinct pulse‐type behavior is studied. Groundmotionsareappliedbi‐directionallyandLRBsaremodeledwithdueconsiderationofcoupledbehavior in the twoorthogonalhorizontaldirections.ResponseofLRBswith deteriorating hysteresis is compared with that of non‐deteriorating ones byconsideringboundinganalyses(upperandlowerbound).Thus,nonlinearresponsehistory analyses areperformed for each selectedgroundmotion record.Boundinganalyses result in over predicted displacement demands for LRBs compared toresults obtained by implemented deteriorating bi‐linear LRB model. By means ofnew deteriorating model, engineers may come up with more efficient isolationsystemdesigns.
Keywords: Lead rubber bearing Isolator model Bounding analysis Lead core heating
1.Introduction
As being a well‐established technology now, seismic isolation has been used in manystructureswhereisolationsystemsaremainlycomposedoftwosystemsi.e.elastomericbearingsandslidingbearings.Asanelastomericbearing,leadrubberbearing(LRB)isthemost widely used isolator type in those systems. LRBs are constructed by bondingalternatelayersofrubberandsteelwithacenterholeinwhichaleadcoreisplugged[1].Inserted lead core improves the behavior of bearing by providing additional energydissipationandincreasingverticalloadcarryingcapacity.
Theidealizedbi‐linearforce‐deformationrelationsusedtodefinehystereticbehaviorofLRBs consist of two parameters: (i) post‐yield stiffness and (ii) characteristic strengththatisdefinedastheforceintersectatzerodisplacement.Formerprimarilycorrespondstomechanicalpropertiesofrubberwhereaslatterstandsforthemechanicalpropertiesoflead. Experimental studies revealed that both characteristic strength and energydissipation capacity (EDC) of LRBs reduce with increasing number of cycles [2]. Thatreductionemergesfromreducedyieldstressofleadduetotemperatureincreaseundercyclicmotion[3].
Two companion papers have been published to describe [3] and verify [4] amathematicalmethod to predict the reduction in both characteristic strength andEDCunder cyclicmotion. Proposedmodel is a function of displacement history of LRB andcapable of updating the effective yield stress of lead due to increased temperature,instantly.Updatedeffectiveyieldstressisthenusedtocalculatetheresistingforceatanytimeinstant.Theinterestedreaderisreferredtorelatedstudiesforfurtherdetails.
Thestudypresentedhereininvestigatestheresponseofanisolationsystem(composedofLRBsmountedundera3‐storysteel frame)subjected tobi‐directionalexcitationsofnear‐field records with distinct pulse type behavior, in terms of maximum isolatordisplacements.Hence,asetofnonlinearresponsehistoryanalyses(NRHA)areconductedwith bothdeteriorating andnon‐deteriorating idealized hysteresis for LRBs.NRHAareperformedwithcarefullyselectedandscaledgroundmotionrecordscompatiblewiththechosentargetspectrum.
2.SelectionandScalingofGroundMotions
Elevengroundmotion recordswere selected fromwell‐knownandextensively studiedseismiceventsoccurredinUnitedStates,Turkey,andTaiwan.Thoserecordshaveclearpulsesintheirvelocitytracesasanindicatorofthenear‐fieldcharacteristics.MagnitudeMwoftherecordsareinbetween6and7.6andclosestdistancedoftherecordstofaultruptureis lessthan20km.Theaverageshearwavevelocitiesofthegroundmotionsatthe upper most 30 m soil deposit are in the range of 180 m/sec and 360m/sec., andclassified as soil typeD as perNEHRP.Groundmotion records employed in this studywere selected so that they represent a scenario earthquakewhichmay result in largeisolatordisplacements.Consequently,groundmotionswithpropertiesthatcorrespondtosoiltypeD,whichistheallowableworstsoilclassforseismicisolationapplication,wereselectedtohavesevereisolatordisplacements.Propertiesofthenear‐fieldrecordsusedinthisstudyaregiveninTable1includingpeakgroundacceleration(PGA),peakgroundvelocity(PGV),andpeakgrounddisplacement(PGD)values.
Scaling of the selected records were performed in two complimentary steps. Theprocedure followed in the first stepwas alsoutilized inOzdemir andConstantinou [5]andseekstominimizeasum()oftheweightedsquarederrorsbetweenthegeometricmeanofthetwohorizontalcomponentsandthetargetspectralvaluesatasetofperiods.Errorisdefinedas:
∑ . (1)wherebiistheweightingfactorforthesquarederroratperiodTi;aisthescalingfactorfor the pair of ground motions of interest; yi is the geometric mean of the spectralordinatesforthepairatperiodTi;yTiisthetargetspectralordinateatperiodTi;andnisthenumberoftargetspectralvaluesconsidered.Thescalingfactor(a)thatresultsintheminimumvalue of is calculated by setting thederivative of Eqn. (1) equal to zero asgiveninEqn.(2).
that of the target spectrum under consideration. To achieve this goal, a series ofcombinationsofweightfactorsweretestedandbestcombinationwaschosen.Asaresult,weight factors for theperiodsof concernwere selected tobe0.1, 0.1, 0.2, 0.3, and0.3,respectively. These weight factors are same for all of the ground motion recordsconsidered.
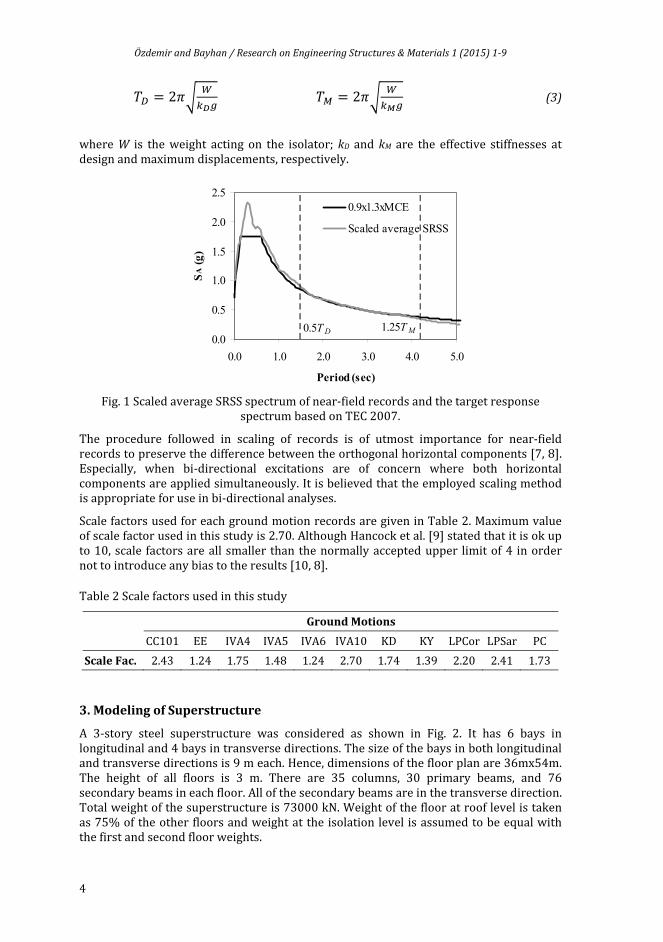
Inthesecondstepofscaling,recordswerefurtherscaledsothatforeachperiodbetween0.5TD and1.25TM, theaverageofsquare‐root‐of‐sum‐of‐squares (SRSS) spectra fromallground motion pairs does not fall below 1.3 times the corresponding ordinate of thetargetresponsespectrumbymorethan10%.
Target response spectrum considered in this study was taken from the TurkishEarthquake Code (TEC) [6] for the corresponding soil class and presented in Fig. 1togetherwith scaled average SRSS of the considered records. Here,TD andTM are theeffective periods of the isolated structure for design earthquake (DE) and maximumconsideredearthquake(MCE),respectivelyandcalculatedasfollows:
The procedure followed in scaling of records is of utmost importance for near‐fieldrecordstopreservethedifferencebetweentheorthogonalhorizontalcomponents[7,8].Especially, when bi‐directional excitations are of concern where both horizontalcomponentsareappliedsimultaneously.Itisbelievedthattheemployedscalingmethodisappropriateforuseinbi‐directionalanalyses.
A 3‐story steel superstructure was considered as shown in Fig. 2. It has 6 bays inlongitudinaland4baysintransversedirections.Thesizeofthebaysinbothlongitudinalandtransversedirectionsis9meach.Hence,dimensionsofthefloorplanare36mx54m.The height of all floors is 3 m. There are 35 columns, 30 primary beams, and 76secondarybeamsineachfloor.Allofthesecondarybeamsareinthetransversedirection.Totalweightofthesuperstructureis73000kN.Weightoftheflooratrooflevelistakenas75%oftheotherfloorsandweightattheisolationlevelisassumedtobeequalwiththefirstandsecondfloorweights.
Superstructurewasmodeledaselasticand itwasassumed thatallbeam‐column jointsare fully rigid. Modulus of elasticity and Poisson ratio of steel are 200 GPa and 0.3,respectively.Floormasseswereequallydistributedtojointsateachfloorlevelandrigiddiaphragms were assigned to joints in the same floor. Having a symmetricsuperstructure,anyeccentricresponseisnotaddressed.
4.ModelingofIsolators
Therearebasically threeparametersused toconstruct the idealized force‐deformationrelationofLRBsasshowninFig.3:(i)postyieldstiffnesskd;(ii)characteristicstrengthQ; (iii) yield displacement Dy. Post‐yield stiffness primarily depends on the rubbercharacteristicsandcalculatedbyEqn. (4)whereT is the isolationperiod.On theotherhand, characteristic strength depends on properties of lead and calculated by Eqn. (5)wherelandaareeffectiveyieldstressandradiusoflead,respectively.Itisstatedthatyield displacement has no significant effect on behavior of isolators [11] and it waschosenas10mmwhichisreportedtobeanappropriatevalueforLRBs[12].
TheconventionaldesignofLRBsconsistsofaniterativemethodtopredictthemaximumisolator displacement and corresponding effective damping ratio. The iteration startswith theassumptionsmade for isolationperiod,Q/Wratioanddisplacement.Once theassumedanditeratedvaluesarecloseenough,theidealizedhysteresisloopforaLRBissettled.ThatloopdoesnotchangeduringtheanalysisandtherecannotbeanyreductionintheEDCcapacitywhichisequaltototalareaunderthehysteresisloops.However,testsconducted with LRBs subjected to cyclic motion revealed that both characteristicstrength and EDC reduce gradually with displacement. That variation is tried to becovered by performing bounding (upper and lower bound) analyses. Upper boundanalysisisbasedontheeffectiveyieldstressofleadinthefirstcycleandusedtoestimatethemaximumshearforce(MSF)carriedbyLRB.Ontheotherhand,lowerboundanalysisis based on the effective yield stress which is calculated by taking the average valueobtainedinthefirstthreecyclesandusedtoestimatemaximumisolatordisplacements(MIDs).Relationbetweentheeffectiveyieldstressesconsideredinupper(up)andlower(low)boundanalysesisstatedasup=1.35low[2].
The gradual reduction of strength and EDC is recently modeled by Kalpakidis andConstantinou [3] and implemented by Ozdemir [13] in a freeware structural analysisprogramnamely,OpenSystemforEarthquakeEngineeringSimulation[14].AccordingtothestudyofKalpakidisandConstantinou[3]mainreasonofreductioninbothstrengthand EDC is the temperature increase in lead due to cyclicmotion. Hence, the effectiveyieldstressisupdatedateachtimestepasafunctionof temperatureriseandresistingforceofLRBiscalculatedaccordingly.ThatmodeldependsongeometricalpropertiesofLRB which is not considered in conventional analysis. Fig.4. shows force‐deformationrelation of a typical LRB with gradual reduction in strength. Table 3 presents thepropertiesoftheconsideredLRBforalloftheupper,lower,andproposedcases.Inthisstudy,theisolationperiodToftheconsideredsystemis3.0sec.andlowwaschosenas10MPa.
InTable3,NAwasusedforthepropertieswhicharenotconsideredduringtheanalysisof the corresponding cases. With the given properties, thirty five LRBs were locatedunder every column of the superstructure (Fig. 2). Isolators were connected tosuperstructurebymeansofZeroLengthelementsinOpenSeeswithdueconsiderationofcoupledhystereticbehaviorintheorthogonalhorizontaldirections.CoupledbehaviorofisolatorsimplementedinOpenSeeswastestedandverifiedinOzdemir[13]andbasedontheequationsderivedbyParketal.[15].
5.AnalysesConducted
To compare the responseof LRBs (in termsofMSFandMID)obtained fromboundinganalysis and from analysiswhereproposedmodel is used, a set of nonlinear responsehistory analyses (NRHA)were conducted. Considered 3‐story isolated steel framewassubjected tobi‐directional excitationsof selectednear‐field recordsas shown inFig.5.Since,boththesuperstructureandisolationsystemaresymmetricabouteachorthogonalhorizontalaxis,responseofisolatedstructurearethesameforloadingsshowninFig.5.Hence,onlyoneofthoseloadingsisconsidered.
33 NRHA were conducted (11 for each case – upper bound, lower bound, proposedmethod)inOpenSees.MSFandMIDobtainedfromanalysesconsideringproposedmodelarecomparedwiththoseofupperandlowerboundanalyses,respectively.Comparisons
aredonefortheaverageofresponsevaluesunderconsiderationobtainedforallofthe11groundmotions(Table4).MIDsarethemaximumoftheSRSSofdisplacementsobtainedin the twoorthogonalhorizontaldirectionsateach timestep.On theotherhand,MSFsare simply equal to maximum value obtained in any of the horizontal directions.Comparison of MSFs is presented in terms of normalized base shears wherenormalizationisdonebydividingtheMSFswiththeweightofthesuperstructure.
InTable4, it is clear that theaverageofnormalizedMSFsobtained fromupperboundanalysis and the proposed model are identical. On the other hand, average of MIDsobtained from lower bound analysis is higher (about 13%) than that of the proposedmodel.Itisbecause,theeffectiveyieldstressofleadconsideredinlowerboundanalysisisbasedontheaverageoffirstthreecycles.Thisassumptionmaybevalidwhenthereisahighseismicitywithatleastthreecyclesoflargeamplitudemotionbut,whenthemotionhave smaller number of cycles as in the case of near‐fieldmotions with high velocitypulses,lowerboundanalysesresultinconservativeestimationofMIDs.
Fig. 6 shows hysteresis loops obtained from NRHA under selected ground motionexcitationsforallofthethreecases.Presentedforce‐deformationhistoriescorrespondto“dominant”directiondefinedasthedirectionwhereisolatordisplacementishigherthantheotherorthogonalone.As it isseen inFig.6,with the initiationofmotion,proposedmodel first follows almost the same path with that of upper bound analysis, but thencoincideswiththepathcorrespondingtolowerboundanalysis.
Table 4 Average of the results obtained from NRHA performed for all of the casesconsidered.
MID(cm) MSF/W
Lower Proposed Upper Proposed
53 47 0.29 0.29
7.Conclusion
The studypresentedherein focusedon the responseof an isolated3‐story steel frameunder bi‐directional excitations of near‐field groundmotionswith clear pulses in theirvelocity traces. Isolation system was composed of LRBs with due consideration oftemperaturedependentbehaviorof leadcoreundercyclicmotion.AsetofNRHAwereconductedinOpenSeesinwhichthetemperaturedependentbehaviorwasimplemented.Results are then compared with those obtained from bounding analyses whereconventionalidealizedforce‐deformationrelationisusedformodelingofLRBs.
This study revealed that bounding analyses yield conservative estimations for MIDsunder near‐field conditions. The MSFs estimated by both upper bound analysis andproposedmodelare thesame.Thoseresults indicate thatengineersmaycomeupwithmoreefficientisolationsystemdesignsbyusingimplementedmodel.ItisalsoclearthatusingtheimplementedmodelforLRBbehaviorismorepracticalandtimesavinginsteadofperformingboundinganalysiswhereengineershavetodosameanalysestwice.
However, further efforts are needed to clarify the response of LRBs presented in thisstudy. Future efforts should be directed on behavior of temperature dependent LRBmodelbyconsideringawiderangeofparameterssuchas isolationperiod,Q/Wratios,andgroundmotionrecordswithdifferentcharacteristics.