Page 1
Iran. J. Chem. Chem. Eng. Research Article Vol. 39, No. 5, 2020
Research Article 293
Response Surface Methodology Based on Central Composite Design
for Investigation of the Mean Drop Behaviors
in Reactive Extraction System with Presence of Uranium
in a Horizontal Pulsed Column
Khanramaki, Fereshte
Faculty of Nuclear Engineering, Shahid Beheshti University, P.O. Box 1983969411, Tehran, I.R. IRAN
Torkaman, Rezvan
Material and Nuclear Fuel Research School, Nuclear Science and Technology Research Institute,
PO Box 14155–1339, Tehran, I.R. IRAN
Shirani, Amir Saeed*+
Faculty of Nuclear Engineering, Shahid Beheshti University, P.O. Box 1983969411, Tehran, I.R. IRAN
Safdari, Jaber
Material and Nuclear Fuel Research School, Nuclear Science and Technology Research Institute,
PO Box 14155–1339, Tehran, I.R. IRAN
ABSTRACT: To carry out this investigation, drop behavior in a horizontal pulsed sieve-plated
column was measured under with and without reactive extraction situations. Central composite
design, a subcategory of response surface methodology, was utilized to survey the influence
of the operational parameters on the drop behavior. The effect of the reactive extraction situation
was also observed on droplet behavior. According to the experimental results, the effect of pulse intensity
on the droplet behavior was greater than the phase flow rates. For the prediction of the Sauter mean
drop diameter in a reactive extraction situation, a new correlation was determined. The results
obtained via the proposed correlation were closely matched with the experimental results (AARE
is about 6.64%). Also, to determine a predictive correlation for drop size distribution, log-normal, and
normal probability density function were examined. The constant parameters at these probability
density functions are specified by the obtained results as well as the mathematical approach.
KEYWORDS: Sauter Mean Drop Diameter; Probability Density Function; Horizontal Pulsed
Column; Extraction Efficiency; Central Composite Design.
* To whom correspondence should be addressed.
+ E-mail: [email protected]
Other Address: Material and Nuclear Fuel Research School, Nuclear Science and Technology Research Institute,
PO Box 14155–1339, Tehran, I.R. IRAN
1021-9986/2020/5/293-305 13/$/6.03
Page 2
Iran. J. Chem. Chem. Eng. Khanramaki F. et al. Vol. 39, No. 5, 2020
294 Research Article
INTRODUCTION
Uranium is a fundamental element in the nuclear fuel
cycle, but its ores are very limited. This element is
a radioactive material on ground and surface water that
is very reactive. Therefore, the uranium extraction from
the sources is essential [1]. The solvent extraction process
generally is used for recovery of the hazardous metal
from the waste. Hence, solvent extraction is a major technique
for uranium extraction from the ores on the industrial scale
[2-5]. Solvent extraction has various advantages, including
effortless to handle, low cost at setup process, minimum
waste production, product with high purity and maximum
production capacity [6]. According the presented
literature, it can be said that the tertiary amine extractants
such as Alamine 336 are suitable for uranium extraction
from sulfate solutions [7-10].
The solvent extraction method is an industrial method
for the separation of elements. Thus, lately a large number
of extractors widely have been investigated and developed [11].
In the liquid-liquid extractor system, the mass
transfer rate is directly proportional to the interfacial area
and degree of turbulence [12, 13]. It can be said that
in terms of safety and cost-effectiveness, the pulse columns
are preferable to other extractors. The main advantages
of pulsed columns are: they have no moving parts, therefore,
the cost of design, repair and maintenance in such columns
is low. Furthermore, they are usable in corrosive materials
and radioactive solutions. These advantages caused
to the development of the pulsed columns for application
in chemical, petrochemical and specially nuclear industries [14].
The pulsed columns are divided two categories:
vertical and horizontal types. The horizontal and vertical
columns are appropriate for industries that have height and
surface area restrictions, respectively [14-18]. Although
the vertical type has enough requirements for applications
in the nuclear industry, the horizontal type can be replaced
the vertical type according to additional advantages.
The most important advantages of this type of column are:
the decrease in building height, the reduction in the operating
costs for shielding, the modification in the process control,
availability of quick and easy column in the radioactive
processes and the decrement in the risk of radioactive
contamination of equipment [18].
The design of the extraction columns is very important
to achieve the appropriate flow rates of two phases
and mass transfer performance [2]. Knowledge of drop
behavior is an essential parameter for the scale up
and design of the extraction columns. It affects the residence
time of the dispersed drops, the dispersed phase holdup
and throughput of the column [19-21]. In the liquid-liquid
extraction columns, an average volume surface diameter
of the organic droplets is generally utilized to determine
the contact times, interfacial area and mass transfer
coefficient of both the continuous and dispersed phase [22, 23].
Therefore, the various drop size distributions which have
different interfacial areas can be determined the same
mean drop size in the extraction columns [20, 21, 24].
The changes of drop size distribution in the extraction column
lead to a hold-up profile, which can be used to determine
the column flooding [25]. The knowledge of drop behavior
along the equipment as a function of the operational
parameters and physical characteristics of the systems
is fundamental to get a realistic explanation of column
performance and to develop this column in the extraction
process [26]. Many studies were carried out on drop
behavior in the vertical columns [20, 27-30]. Nonetheless,
for the horizontal columns, there are few reports about the
droplet behavior in without reactive extraction situation
[31, 32].
According to previous studies, there is few data
for design and scale up of the horizontal pulsed columns under
reactive extraction conditions. Also, due to the importance
of droplets behavior in the extraction columns design,
the aim of this study is measuring the droplet behavior
and probability density function in this column with changing
operating parameters (pulse intensity, flow rate of
continuous and disperse phases). In this investigation, two
different chemical systems were used to study the effect of
the reactive extraction and without reactive extraction
conditions on the droplet behavior. Furthermore, using
the obtained experimental results, the empirical correlations
for drop behavior were derived in the reactive extraction
situation. It can be deduced that this column is a suitable
option for the uranium extraction from a sulfate solution
with about 99% efficiency.
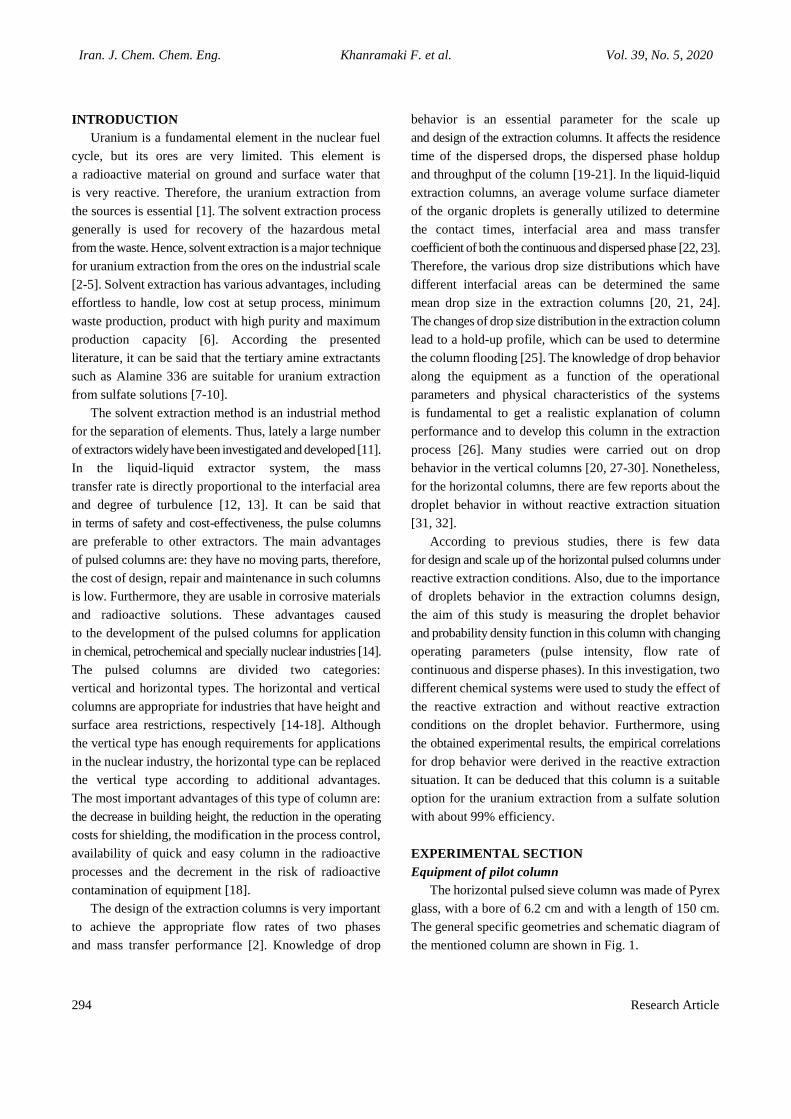
EXPERIMENTAL SECTION
Equipment of pilot column
The horizontal pulsed sieve column was made of Pyrex
glass, with a bore of 6.2 cm and with a length of 150 cm.
The general specific geometries and schematic diagram of
the mentioned column are shown in Fig. 1.
Page 3
Iran. J. Chem. Chem. Eng. Response Surface Methodology based on Central Composite Design ... Vol. 39, No. 5, 2020
Research Article 295
Fig. 1: Schematic diagram of the pilot plant horizontal pulsed sieve-plate extractor.
The active section of the column was containing
25 pairs of sieve plates that built of 304 stainless steel.
The holes on the sieve plate near the inlets of dispersed
and continuous phase were placed down and up, respectively.
After the contact of two phases in the active section of
the column, the dispersed and continuous phases are separated
and collected in two settlers with 5 cm radius. Also,
the aqueous and organic phase flow rates were measured
by Rotameter. An air pulsing system created a pulse
in the column. The interface of the two phases was controlled
by an optical sensor that located at the top of the aqueous
phase inlet and under the organic phase outlet in the upper
settler.
Reagents
Commercial grade of Alamine 336 from NetSun
Company of China and kerosene were used as an organic
phase. Also, AR grade isodecanol from Merck was
employed as a modifier. The leach liquor containing
250 mg/L uranium used in the reactive experimental system
as an aqueous phase was generated in the Ghachin site of
Bandar Abbas. Sulfuric acid with analytical grade
as an aqueous phase was used in without reactive extraction
situation. In this research work, two liquid-liquid system
were utilized for experiments. The physical characteristics
of the two systems (with and without reactive extraction
systems) are summarized in Table 1.
Analysis apparatus
Through the process of our experimentation,
an Inductively Coupled Plasma Atomic Emission
Spectrophotometer (ICP-AES Perkin-Elmer-7300 DV)
was employed to determine the concentration of uranium
in the continuous phase. The quantity of viscosity and
interfacial tension were measured by DVI-Prime
viscometer and a Krüss tensiometer, respectively. Also,
the measurement of the solutions density data was carried
out by the pycnometer method.
Procedure
The startup of the column in all the experimental runs
without and with reactive extraction was far from flooding
conditions. After filling the column with the continuous
phase, the organic phase was entered to the column
as dropwise. All experiments were done at the temperature
up to 20 ˚C.
In this study, Response Surface Methodology (RSM)
with three input variables such as pulse intensity (at range
0.8-1.2 cm/s), continuous and dispersed phase flow rates
(within the range 1-5 l/h) are used to study the effects
Page 4
Iran. J. Chem. Chem. Eng. Khanramaki F. et al. Vol. 39, No. 5, 2020
296 Research Article
Table 1: Physical characteristics of the two systems used in this research.
properties Phase Viscosity
(×103 kg/m.s)
Density
(kg/m3)
Interfacial tension
(×103 N/m)
With reactive extraction
Sulfate leach liquor
(as continuous phase) 0.86 1058
9.9 Saturated organic phase
(as dispersed phase) 1.84 820
Without reactive extraction
Diluted sulfuric acid
(as continuous phase) 0.76 1009
12.2 Alamine, isodecanol and kerosene
(as dispersed phase) 1.52 803
Table 2: The CCD matrix and the response values for two systems.
Run Qc (L/h) Qd (L/h) af (cm/sec)
Without reactive
extraction system
With reactive
extraction system
d32 (mm) (Exp.) d32 (mm) (Exp.) EU (%) (Exp.)
1 4 2 0.9 1.29 1.14 94
2 3 3 1 1.13 0.98 97.5
3 4 4 0.9 1.42 1.31 95.4
4 4 2 1.1 0.87 0.73 97.8
5 3 3 1.2 0.64 0.45 99.16
6 3 3 1 1.14 0.95 97.35
7 2 2 1.1 0.77 0.62 98.1
8 3 3 1 1.12 0.99 97.6
9 1 3 1 1.06 0.92 98.46
10 2 4 1.1 0.87 0.69 98.96
11 3 5 1 1.30 1.11 98.75
12 3 3 1 1.11 0.97 97.65
13 2 2 0.9 1.19 1.04 95.1
14 5 3 1 1.24 1.19 96.5
15 3 1 1 1.07 0.92 96.72
16 3 3 0.8 1.55 1.44 93.42
17 3 3 1 1.15 0.98 97.2
18 4 4 1.1 0.97 0.82 98.3
19 2 4 0.9 1.36 1.18 97.4
20 3 3 1 1.14 0.99 97.8
on Sauter mean drops diameter (d32), drops distribution
(Pn) and uranium extraction efficiency (%Eu). Design
Expert software 7.0 was used to design the experiments.
The statistical testing is done by ANOVA analysis with
p-Value, R-Squared, adjusted R-Squared and predicted
R-Squared. The operating conditions as suggested by Central
Composite Design and responses at each run are reported
in Table 2.
Measurement of drop diameter
After reaching steady-state situations at the end of each
experimental run, the photographic method with a Nikon
digital camera (D5000 model) was applied for
measurement of the drop diameters. The drop diameter
was measured by analyzing the recorded photos
with AutoCAD 2016 software. The Sauter mean drop diameter
(d32) is determined as follows:
Page 5
Iran. J. Chem. Chem. Eng. Response Surface Methodology based on Central Composite Design ... Vol. 39, No. 5, 2020
Research Article 297
N 3
i ii 0
3 2 N 2
i ii 0
n dd
n d
(1)
where ni is the numbers of droplets and di is mean
diameter within range i.
Measurement of extraction efficiency
At the steady-state conditions with Sampling from
the seven valves installed in 25 cm distances on the column
and determination of uranium in samples, the uranium
extraction efficiency at the end of each run is calculated
by the following equation:
1 7
*
1 7
x xU r a n i u m E x t r a c t i o n E f f i c i e n c y % 1 0 0
x x
(3)
Where x1 and x7 are uranium concentrations of the
aqueous phase at input and output valve streams. Also, x*7
is the equilibrium uranium concentration of the aqueous
phase across the output valve stream. The uranium
concentration in the aqueous phase at the column length
(x1 to x7) was measured by ICP-AES spectrophotometer.
RESAULTS AND DISCUSSION
Variation of sauter mean drop diameter
Effects of Operating Parameters
The results of ANOVA for the Sauter mean drop
diameter in two systems are presented in Table 3.
The p-value is <0.001 that obviously confirms the experimental
results. The value of correlation coefficient “R-square”,
“adjusted R-square” and “predicted R-square” shows
the accuracy of the experiment design within two systems.
The effect of changing operational parameters on the
Sauter mean drop diameter is presented in Fig. 2. At all flow
rates of the continuous phase as shown in Fig. 2(a), the Sauter
mean drop diameter significantly decreases with increasing
pulse intensity. An increase in the pulse intensity gave rise
to the interfacial forces of the dispersed phase drops, therefore,
the breakage of drops occurred and consequently the Sauter
mean drop diameter decreased along the column. At all
the pulse intensity, a smooth increase in the Sauter mean diameter
of the drop is observed with the increase in flow rates
of the continuous phase. As shown in Fig. 2(b) at all the pulse
intensity, the Sauter mean drop diameter slightly increases
with the increase in the dispersed phase flow rates. The effect
of the dispersed and continuous phase flow rates on Sauter
mean drop diameter are shown in Fig. 2(c) for the two systems.
It should be noted that a slight increase in the Sauter mean
drop diameter is observed with the increase in flow rates of
the dispersed and continuous phase. Therefore, it is observed
from these figures that the effect of pulsing intensity is
stronger than that of the phase flow rate on the Sauter mean
drop diameter. As shown in Fig. 2, the Sauter mean drop
diameter in without reactive extraction system is larger than
that the with reactive extraction system because the interfacial
tension in without reactive extraction system is higher than
the other system.
New correlation for prediction of sauter mean diameter
of drop
Many correlations have been suggested for determination
of the Sauter mean diameter of drop in various vertical pulsed
extractors [27]. Nevertheless, these correlations do not have
enough accuracy to predict Sauter mean diameter of drops
and cannot be used in the horizontal pilot plant columns and
the reactive extraction situation.
The comparison of the experimental results of this
investigation with the values obtained from the empirical
correlation recommended in previous works. The AARE
values between experimental results of this investigation
and the suggested equations by Khajenoori et al. and
Panahinia et al. were 38.51 and 30.80%, respectively.
Therefore, the previous correlations are not proper
to predict the mean drop size because the mentioned
equation doesn’t consider the reaction situations, whereas
the reaction between uranium and Alamine 336 is included
in the experimental data. Consequently, a novel modified
correlation with consideration of the reactive extraction
situation is derived by using the Buckingham's pi-theorem
as follows:
1 . 9 52
43 2 c c
2
c c c
c
d Q . .a f3 . 0 7 1 0
Q .
(5)
1 . 2 70 . 5 1 1 6 7 . 6 2 2 5 . 6 12
d d d c c
3
c c c c
Q Q . .2
Q
The AARE between the produced results by Eq. (5) and
experimental results for this research column is 6.64%.
Therefore, the experimental and predicted data were near
enough to the bisector line which confirms the accuracy
of the proposed correlation.
Page 6
Iran. J. Chem. Chem. Eng. Khanramaki F. et al. Vol. 39, No. 5, 2020
298 Research Article
Table 3: The ANOVA to RSM variables for the Sauter mean drop diameter in two systems.
Source Sum of Squares Degree freedom F Value p-Value
Without reactive extraction system
Model 0.91 9 71.16 < 0.0001
A-af 0.81 1 570.03 < 0.0001
B-Qc 0.032 1 22.31 0.0032
C-Qd 0.058 1 40.77 0.0007
AB 1.96×10⁻⁴ 1 0.14 0.7229
AC 1.447×10⁻³ 1 1.02 0.3521
BC 2.86×10⁻⁴ 1 0.20 0.6696
A^2 6.556×10⁻⁴ 1 0.46 0.5226
B^2 6.578×10⁻⁴ 1 0.46 0.5219
C^2 3.885×10⁻³ 1 2.73 0.1495
Residual 8.536×10⁻³ 6 - -
Lack of Fit 8.374×10⁻³ 5 10.31 0.2319
Pure Error 1.624×10⁻³ 1 - -
Cor Total 0.92 15 - -
R-Squared 0.9907 - - -
Adj R-Squared 0.9768 - - -
Pred R-Squared 0.9283 - - -
With reactive extraction system
Model 0.96 9 37.49 0.0001
A-af 0.84 1 295.67 < 0.0001
B-Qc 0.055 1 19.50 0.0045
C-Qd 0.052 1 18.36 0.0052
AB 3.381×10⁻⁴ 1 0.12 0.7416
AC 1.314×10⁻³ 1 0.46 0.5213
BC 6.301×10⁻⁶ 1 2.223×10⁻³ 0.9639
A^2 5.484×10⁻⁴ 1 0.19 0.6754
B^2 4.703×10⁻³ 1 1.61 0.2451
C^2 7.72×10⁻⁴ 1 0.27 0.6204
Residual 0.017 6 - -
Lack of Fit 0.017 5 70.94 0.0899
Pure Error 4.78×10⁻⁵ 1 - -
Cor Total 0.97 15 - -
R-Squared 0.9825 - - -
Adj R-Squared 0.9563 - - -
Pred R-Squared 0.8615 - - -
Page 7
Iran. J. Chem. Chem. Eng. Response Surface Methodology based on Central Composite Design ... Vol. 39, No. 5, 2020
Research Article 299
Fig. 1: The effect of operational parameters on the Sauter mean
drop size for two systems.
Variation of drop size distribution
Effects of operating parameters
In this section, the effect of the operational parameters
such as the pulse intensity and flow rate of the phases
on the drop size distribution was investigated. The various pulse
intensities on the drop size distribution at the constant flow
rates of continuous and dispersed phases for the two
systems were surveyed that results are presented in Fig. 3.
With more turbulent conditions, homogeneous
distributions and smaller droplets are generated for two
systems. Thus, the increasing pulse intensity leads
to a narrower and more symmetric distribution around
the mean drop size value. Also, the distributions of drop size
shift to the left within both systems. The influence
of various dispersed and continuous phase flow rates
on the drop size distribution for the two systems was investigated,
the results of which are shown in Fig. 4. As can be observed
in this figure, with increasing in both phase flow rates,
the distribution shape of drop size in these systems shifts
to the right. But, with changing these parameters without
mass transfer system, the drop size distribution shifts
towards larger drops. This phenomenon can be explained
by the existence of the higher interfacial tension and the absence
of reactive extraction in this system.
New correlation for prediction of drop size distribution
As shown in the previous studies [23, 33-35],
the probability density of drops used for predicting of drop
size distribution in liquid–liquid extractors. The ratio of
the droplets number with a specific diameter to the total
droplets number is called the probability density of
droplets. The analysis of the drop size distribution is often
done by log-normal and normal probability density
functions. Therefore, the mentioned probability density
functions (Eqs. (6) and (7)) were investigated to predict
the experimental data on the drop size distributions.
2
n
d1P d e x p
2 2
(6)
2
l g
l n d1P d e x p
2 d 2
(7)
Where di is the drop diameter and α and β denote
the constant parameters. In order to predict the drop size
distribution, a nonlinear regression analysis was used to fit
these functions to the experimental results, then
the constant parameters for these functions are determined.
Qc (L/h)
2
1.5
1
0.5
0
d3
2 (
mm
)
6
4
2
0 0.8 1
1.2
af (cm/s)
(a)
Qd (L/h)
2
1.5
1
0.5
0
d32 (
mm
)
6
4
2
0 0.8
1 1.2
af (cm/s)
(a)
Qd (L/h)
1.6
1.4
1.2 1
0.8
0.6
d32 (
mm
)
6
4
2
0 0 2
4
Qc (L/h)
(c)
6
1.6
1.4
1.2
1
0.8
0.6
1.6
1.4
1.2
1
0.8
0.6
1.35 1.3 1.25 1.2 1.15
1.1 1.05 1 0.95 0.9
0.85
Page 8
Iran. J. Chem. Chem. Eng. Khanramaki F. et al. Vol. 39, No. 5, 2020
300 Research Article
Fig. 3: The effect of pulse intensity on the drop size distribution.
Fig. 4: The effect of dispersed and continuous phase
flow rates on the drop size distribution. (a): various
dispersed phase flow rate. (b): various continuous phase
flow rate.
In addition, the new correlations for the evaluated parameters
with consideration of the reactive extraction conditions are
derived by using the Buckingham's pi-theorem based on
physical characteristics and operational parameters as follows:
𝛼 = 7.89 × 10⁻⁷ (𝑄𝑐.𝜌𝑐
2.𝑎𝑓
𝜇𝑐2 )1.054 (2 +
𝑄𝑑
𝑄𝑐)−0.206 (
𝜌𝑑
𝜌𝑐)−35.58 (
𝜇𝑑
𝜇𝑐)19.9 (
𝑄𝑐 .𝜌𝑐2.𝜎
𝜇𝑐3 )−1.15 (8)
𝛽 = 6.75 × 10⁻⁸ (𝑄𝑐.𝜌𝑐
2.𝑎𝑓
𝜇𝑐2 )1.206 (2 +
𝑄𝑑
𝑄𝑐)0.035 (
𝜌𝑑
𝜌𝑐)−35.56 (
𝜇𝑑
𝜇𝑐)19.87 (
𝑄𝑐.𝜌𝑐2.𝜎
𝜇𝑐3 )−1.103 (9)
𝛼 = 3.98 × 10⁴ (𝑄𝑐.𝜌𝑐
2.𝑎𝑓
𝜇𝑐2 )2.03 (2 +
𝑄𝑑
𝑄𝑐)−0.132 (
𝜌𝑑
𝜌𝑐)348.84 (
𝜇𝑑
𝜇𝑐)77.47 (
𝑄𝑐 .𝜌𝑐2.𝜎
𝜇𝑐3 )1.96
(10)
𝛽 = 3.96 × 10⁴ (𝑄𝑐 .𝜌𝑐
2.𝑎𝑓
𝜇𝑐2 )1.55 (2 +
𝑄𝑑
𝑄𝑐)0.41 (
𝜌𝑑
𝜌𝑐)265.58 (
𝜇𝑑
𝜇𝑐)48.92 (
𝑄𝑐.𝜌𝑐2.𝜎
𝜇𝑐3 )1.81 (11)
Eqs. (8) and (9) and Eqs. (10) and (11) depict the constant
parameters of the log-normal and normal functions, respectively.
The AARE values to estimation of α and β parameters
for log-normal and normal distribution functions are equal
to 6.54, 9.28, 6.78 and 10.35 %, respectively. The results
of comparison between these correlations and the present
experimental investigation outcomes are depicted in Fig. 5.
It is observed that these probability density functions
are closely matched with the experimental results.
Extraction of uranium
In Eq. (3), the equilibrium uranium concentration is
necessary for the determination of uranium extraction efficiency.
As shown in Fig. 6, the uranium extraction isotherm with
different ratios of the aqueous and organic phases (such as
A/O= 40, 20, 10, 5, 2, 1 and 0.5) and constant concentrations
of uranium in the aqueous phase (250 mg/L) was drawn.
Also, the extraction efficiency against the dimensionless
length of the column are depicted in Fig. 7.
Effects of operating parameters on the extraction
efficiency
The results of ANOVA with the reactive extraction
system are shown in Table 4. The p-value is <0.001 that
obviously confirms the experimental results. The value of
correlation coefficient “R-square”, “adjusted R-square”
and “predicted R-square” shows the accuracy of
the experiment design within two systems.
d (mm)
0.4
0.3
0.2
0.1
0.0
Nu
mb
er d
en
sity
0 1 2 3 4
d (mm)
0.4
0.3
0.2
0.1
0
Nu
mb
er d
en
sity
0 0.5 1 1.5 2 2.5 3 3.5
d (mm)
0.4
0.3
0.2
0.1
0
Nu
mb
er d
en
sity
0 0.5 1 1.5 2 2.5 3 3.5
Page 9
Iran. J. Chem. Chem. Eng. Response Surface Methodology based on Central Composite Design ... Vol. 39, No. 5, 2020
Research Article 301
Fig. 5: Comparison of drop size distribution between
experimental results and theoretical distribution functions
for reaction system (af=1cm/s, Qc=5 l/h, Qd=3 l/h).
Fig. 6: Uranium extraction isotherm from sulfate solution
using Alamine 336.
Fig. 7: Uranium extraction efficiency against dimensionless
column length (af=1 cm/s, Qc=Qd=3 L/h).
In Fig. 8, the effect of altering operational conditions
on the extraction efficiency is presented. The influence of
the pulse intensities and continuous phase flow rates on the
uranium extraction efficiency is illustrated in Fig. 8(a).
The extraction efficiency significantly increases with
increasing pulse intensity, at all continuous flow rates.
The increasing of the pulse intensity is led to the variation
of the drop sizes and holdup with axial mixing. Therefore,
the mass transfer performance increases at this column.
As shown in Fig. 8(a), with an increase in the energy supplied
via pulse intensity and the breakage of the drops, the drop
size decreases. The formation of smaller drops leads
to turbulence in the droplet and increases the interfacial
area between the two phases. Therefore, the extraction
efficiency of uranium increases. With increasing
continuous phase flow at all pulse intensity, the mean drop
size increases in the extraction column. Therefore,
the residence time of droplets is reduced and the droplets
passed the column length rapidly. Consequently,
the uranium extraction efficiency reduces with increasing
the continuous phase flow rate. The influence of the dispersed
phase flow rate and pulse intensity on the uranium
extraction efficiency is presented in Fig. 8(b). As depicted
in this figure, by increasing the dispersed phase flow rate,
the fresher organic phase contacts the leach liquor solution.
Therefore, at all pulse intensity, an increase the dispersed
phase flow rate caused to the increase in the uranium
extraction efficiency. The influence of the phase flow rates
on the variation of uranium extraction efficiency
is illustrated in Fig. 8(c). At all flow rates of the continuous
phase as shown this figure, the increasing the flow rates
of the dispersed phase leads to the increase the uranium
extraction efficiency. Though, the uranium extraction
efficiency decreases with increasing the flow rates of
the continuous phase at all flow rates of the dispersed phase.
CONCLUSIONS
In the present work, variations of operational
parameters by using the central composite design method
on the drop behavior and extraction efficiency of uranium
in a horizontal pulsed sieve-plate extractor were
comprehensively studied. The results achieved from
the experimental data were drawn:
-The relation between the Sauter mean drop diameter
and uranium extraction efficiency are directly proportional
to the pulse intensity.
d (mm)
0.35
0.30
0.25
0.20
0.15
0.10
0.05
0.00
Nu
mb
er d
en
sity
(%
)
0.5 0.7 0.9 1.1 1.3 1.5 1.7 1.9 2.1
[Uranium]aq (mg/L)
750
600
450
300
150
0
[Ura
niu
m] o
rg (
mg/L
)
0 50 100 150 200 250
Z (-)
100
80
60
40
20
0
%E
ura
niu
m
0.0 0.2 0.4 0.6 0.8 1.0
(Exp. Conditions: 6% (v/v) Alamine 336, 5% (v/v) isodecanol, 250 mg/L U,
0.22 mol/L sulfate ion, pH = 1.4, time 5 min, T = 25 °C)
With reaction system (cd): Alamine 336, decanol, kerosene – Sulfate leach liqor
Page 10
Iran. J. Chem. Chem. Eng. Khanramaki F. et al. Vol. 39, No. 5, 2020
302 Research Article
Table 4: The ANOVA to RSM variables for uranium efficiency in reactive extraction system.
Source Sum of Squares df Mean Square F Value p-Value
Model 45.48 9 5.05 44.52 < 0.0001
A-af 32.21 1 32.21 283.75 < 0.0001
B-Qc 3.98 1 3.98 35.07 0.0010
C-Qd 5.20 1 5.20 45.80 0.0005
AB 0.57 1 0.57 5.04 0.0658
AC 0.68 1 0.68 6.03 0.0494
BC 0.20 1 0.20 1.75 0.2342
A^2 1.61 1 1.61 14.21 0.0093
B^2 4.9×10⁻³ 1 4.9×10⁻³ 0.043 0.8423
C^2 0.034 1 0.034 0.30 0.6027
Residual 0.68 6 0.11
Lack of Fit 0.68 5 0.14 27.04 0.1449
Pure Error 0.005 1 0.005
Cor Total 46.16 15
R-Squared 0.985246
Adj R-Squared 0.963115
Pred R-Squared 0.884835
- A uniform drop size distribution and smaller drop
size achieved because of the increasing the pulse
intensity.
- The dispersed and continuous phase flow rates
slightly affect the drop behavior.
- With increasing continuous phase flow rate, uranium
extraction efficiency from the sulfate leach liquor by using
Alamine 336 initially reduced, but increased with
increasing dispersed phase flow rate.
- In the reactive extraction system, the interfacial
tension influenced on drop size. In addition, the log-
normal and normal distribution functions have a good
agreement with these experimental results to predict
the drop size distribution.
- The present work has provided useful information on
the uranium extraction efficiency (approximately %99)
and the drop behavior in a pilot plant horizontal pulsed
sieve-plate column. The mentioned column can be applied
in the extraction process in the nuclear industries.
Moreover, in places with limited height, this column
is a suitable alternative in radioactive processes.
Nomenclature
AARE Average absolute relative error
CCD Central composite design
RSM Response surface methodology
af Pulse intensity (m/s)
Q Volumetric flow rate (m3/s)
d32 Sauter mean drop diameter (m)
ni Number of droplets of mean diameter di
P Probability of number density
Greek letters
x Mass fraction of uranium in the continuous phase
y Mass fraction of uranium in the dispersed phase
X Dimensionless solute concentrations of
the continuous phase
Y Dimensionless solute concentrations of
the dispersed phase
z Column length (cm)
Z Dimensionless length of the column
ρ Density (kg/m3)
μ Viscosity (Pa s)
Page 11
Iran. J. Chem. Chem. Eng. Response Surface Methodology based on Central Composite Design ... Vol. 39, No. 5, 2020
Research Article 303
Fig. 8: The effect of operational parameters on the uranium
extraction efficiency in with reaction system.
σ Interfacial tension (N/m)
α Constant parameter of probability of density function
β Constant parameter of probability of density function
Subscript
aq Aqueous phase
org Organic phase
c Continuous phase
d Dispersed phase
* Equilibrium value
n Normal probability density function
ln Log-normal probability density function
Received : Feb. 3, 2019 ; Accepted :Jun. 10, 2019
REFERENCES
[1] Kumar J. R., Kim J., Lee J., Yoon H., A Brief
Review on Solvent Extraction of Uranium From Acidic
Solutions, Sep. & Purify. Reviews, 40: 77-125 (2011).
[2] Rydberg J., Musikas C., Choppin G. R., “Solvent
Extraction Principles Practice”, CRC Press, New York,
(2004).
[3] Kislik V. S., Advances in Development of Solvents
for Liquid-Liquid Extraction, “Solvent Extraction
Classical and Novel Approaches", Elsevier (2012).
[4] Khanramaki F., Shirani A.S., Safdari J., Torkaman R.,
Investigation of Liquid Extraction and Thermodynamic
Studies on Uranium from Sulfate Solution by Alamine 336
as an Extractant, International Journal of Environmental
Science And Technology, 15: 1467-1476 (2017).
[5] Khanramaki F., Safdari J., Shirani A. S., Torkaman R.,
Investigations on the Complete Removal of Iron(Iii)
Interference on the Uranium(Vi) Extraction
from Sulfate Leach Liquor Using Alamine 336 in
Kerosene, Radiochimica Acta, 106: 631-643 (2018).
[6] Benedict M., Pigford T. H., H. W. Levi, Nuclear
Chemical Engineering, 2nd ed., Mc Graw Hill Book
Company, (1981).
[7] Behera P., Mishra R., Chakravortty V., Solvent Extraction
of Uranium (Vi) and Molybdenum (Vi) by Alamine 310
and Its Mixtures from Aqueous H3PO4 Solution,
J. Radioanal. Nucl. Chem., 173: 161-169 (1993).
[8] Ramadevi G., Sreenivas T., Navale A.S.,
Padmanabhan N.P.H., Solvent Extraction of Uranium
from Lean Grade Acidic Sulfate Leach Liquor
with Alamine 336 Reagent, J. Radioanal Nucl.
Chem., 294: 13-18 (2012).
Qc (L/h)
100
95
90
85
%E
ura
niu
m
6
4
2 0.8
0.9 1
1.2
af (cm/s)
(a)
98
97
96
95
94
93
92
1.1
Qd (L/h)
100
95
90
85
%E
uran
ium
6
4
2
0.8 0.9
1
1.2
af (cm/s)
(a)
98
96
94 92
1.1
0
Qd (L/h)
100
98
96
94
92
%E
uran
ium
6
4
2 2
4
Qc (L/h)
(c)
6
100
99
98
97
96
Page 12
Iran. J. Chem. Chem. Eng. Khanramaki F. et al. Vol. 39, No. 5, 2020
304 Research Article
[9] Quinn J.E., Wilkins D., Soldenhoff K.H., Solvent
Extraction of Uranium from Saline Leach Liquors
Using Dehpa/Alamine 336 Mixed Reagent,
Hydrometallurgy, 134: 74-79 (2013).
[10] Zahakifar F., Charkhi A., Torab-Mostaedi M.,
Davarkhah R., Kinetic Study of Uranium Transport
via a Bulk Liquid Membrane Containing Alamine 336
as a Carrier, Journal of Radioanalytical and Nuclear
Chemistry, 316: 247-255 (2018).
[11] Godfrey J.C., Slater M.J., “Liquid-Liquid Extraction
Equipment”, New York: John Wiley & Sons, Inc.
(1994).
[12] Jaradat M., Attarakih M., Bart H., Population Balance
Modeling of Pulsed (Packed and Sieve-Plate)
Extraction Columns: Coupled Hydrodynamic and
Mass Transfer, Ind. Eng. Chem. Res., 50: 14121-
14135 (2011).
[13] Samani G., Safdari J., Haghighi-Asl A., Torab-
Mostaedi M., Effect of Structural Parameters on Drop
Size Distribution in Pulsed Packed Columns, Chem.
Eng. Technol., 37: 1155- (2014).
[14] Hussain A.A., Liang T.-B., Slater M.J., Characteristic
Velocity of Drops in a Liquid-Liquid Extraction
Pulsed Sieve Plate Column, Chem. Eng. Res. Des.,
66: 541-554 (1988).
[15] Brauer H., Sucker D., Biological Waste Water
Treatment in a High-Efficiency Reactor, Ger. Chem.
Eng., 2: 77- (1979).
[16] Procházka J., Hafez M.M., The Analysis of
the Dynamic Effects in Vibrating and Pulse Plate
Extraction Columns, Collect. Czech. Chem.
Commun., 37: 3725-3734 (1972).
[17] Logsdail D.H., Thornton J.D., Developments in
Horizontal Pulsed Contactors for Liquid-Liquid
Extraction Processes, Journal of Nuclear Energy, 1:
15- (1959).
[18] Melnyk A.J., Hydrodynamic Behavior of a
Horizontal Pulsed Solvent Extraction Column, Part 1:
flow Characterization, Throughput Capacity and
Holdup, Can. J. Chem. Eng. J., 70: 417-
(1992).
[19] Maaß S., Wollny S., Voigt A., Kraume M.,
Experimental Comparison of Measurement
Techniques for Drop Size Distributions in
Liquid/Liquid Dispersions, Exp. Fluids, 50: 259-269
(2011).
[20] Asadollahzadeh M., Shahhosseini S., Torab-
Mostaedi M., Ghaemi A., Drop Behavior in a
Pilot Plant Oldshue–Rushton Extraction Column for Three
Various Liquid–Liquid Systems, Separation and
Purification Technology, 159: 7-17 (2016).
[21] Thornton J.D., “Science and Practice Of Liquid-
Liquid Extraction”, University Press, Oxford
(1992).
[22] Moreira E., Pimenta L.M., Carneiro L.L., Faria R.C.L.,
Mansur M.B., Ribieron J.P., Hydrodynamic Behavior
of Rotating Disc Contactor Under Low Agitation
Conditions, Chem. Eng. Commun., 192(8): 1017-
1035 (2007).
[23] Oliveira N.S., Silva D.M., Gond M.P.C., Mansur M.B.,
A Study of The Drop Size Distributions and Hold-Up
in Short Kühni Columns, Braz. J. Chem. Eng., 25(4):
729- (2008).
[24] Ashrafmansouri S.S., Esfahany M.N., The Influence
of Silica Nanoparticles on Hydrodynamics and Mass
Transfer in Spray Liquid-Liquid Extraction Column,
Sep. Purify. Technol., 151: 74-81 (2015).
[25] Ousmane S., Isabelle M., Mario M., Mamadou T.,
Jacques A., Study of Mass Transfer and Determination
of Drop Size Distribution in a Pulsed
Extraction Column, Chem. Eng. Res. Des., 89: 60-68
(2011).
[26] Grinbaum B., The Existing Models for Simulation of
Pulsed and Reciprocating Columns – How Well Do
They Work in The Real World?, Solv. Extr. and Ion
Exch., 24: 795-822 (2006).
[27] Yadav R.L., Patwardhan A.W., Design Aspects of
Pulsed Sieve Plate Columns, Chem. Eng. J., 138: 389-
415 (2008).
[28] Usman M.R., Sattar H., Hussain S.N., Muhammad H.,
Asghar A., Afzal W., Drop Size in a Liquid Pulsed
Sieve-Plate Extraction Column, Braz. J. Chem. Eng.,
26: 677- (2009).
[29] Samani M.G., Haghighi-Asl A., Safdari J.,
Torab-Mostaedi M., Drop Size Distribution and
Mean Drop Size in a Pulsed Packed Extraction
Column, Chem. Eng. Res. Des., 90: 2148-2154
(2012).
[30] Torab-Mostaedi M., Ghaemi A., Asadollahzadeh M.,
Flooding and Drop Size in a Pulsed Disc and
Doughnut Extraction Column, Chemical Engineering
Research and Design, 89: 2742-2751 (2011).
Page 13
Iran. J. Chem. Chem. Eng. Response Surface Methodology based on Central Composite Design ... Vol. 39, No. 5, 2020
Research Article 305
[31] Khajenoori M., Haghighi-Asl A., Safdari J.,
Mallah M.H., Prediction of Drop Size Distribution
in a Horizontal Pulsed Plate Extraction Column,
Chemical Engineering and Processing, 92: 25-32
(2015).
[32] Panahinia F., Ghannadi-Maragheh M., Safdari J.,
Amani P., Mallaha M.H., Experimental Investigation
Concerning the Effect of Mass Transfer Direction
on Mean Drop Size and Holdup in a Horizontal
Pulsed Plate Extraction Column, Royal Society of
Chemistry, RSC Advances, 7: 8908-8921 (2017).
[33] Rincon-Rubio L.M., Kumar A., Hartland S., Drop
Size Distribution and Average Drop Size in a Wirz
Extraction Column, Chem. Eng. Res. Des., 72: 493-
502 (1994).
[34] Zhang S.H., Yu S.C., Zhou Y.C., Su Y.F., A Model
for Liquid–Liquid Extraction Column Performance –
the Influence of Drop Size Distribution on Extraction
Efficiency, Can. J. Chem. Eng., 63: 212-226 (1985).
[35] Chen W.L., Zhong L.M., Chen L., Weiyang W.,
Measurement and Analysis of Bimodal Drop Size
Distribution in a Rotor–Stator Homogenizer, Chem.
Eng. Sci., 102: 622-631 (2013).


![Electrocoagulation treatment of the food dye waste ... · using a Response Surface Methodology (RSM), rotatable uniform and central composite design [29]. The Statistical calculations](https://static.documents.pub/doc/80x56/5eb9403e0324ae2f6e03f427/electrocoagulation-treatment-of-the-food-dye-waste-using-a-response-surface.jpg)
