25
Response to Instruction Intervention (RTI²) Karen Jensen and Theresa Nicholls

Response to Instruction Intervention (RTI²)
Karen Jensen and Theresa Nicholls

Lower performing students were not making enough progress to access grade-level expectations
A large contingent of struggling students were being identified with a specific learning disability (SLD) for reasons that were as likely to be related to unmet instructional needs as they were to any definite disability
Poor, minority, and male students were over-represented in the special education population
Background
2

In July 2014, the Tennessee State Board of Education adopted RTI²
This move to a new model for SLD identification required schools to show evidence that students had received a series of increasingly intensive, targeted interventions based on individual needs before becoming eligible for special education
More broadly, RTI² aimed to institutionalize a powerful theory of student progress. If schools were regularly screening all students for skill gaps and if student remediation could be increasingly personalized toward individual needs, core instruction could be more effective and would help keep students from slipping through the cracks
Adoption of RTI²
3
Leadership
Culture of collaboration
Prevention and early intervention
Guiding Principles for the RTI² Framework
4

Tennessee’s RTI² Model
5
TIER III FEW In addition to Tier I, extra help is provided to students who havenot made significant progress in Tier II or who are significantlybelow grade level in basic math and reading skills. Tier IIIinterventions are more explicit and more intensive than Tier IIinterventions.
TIER II SOMEIn addition to Tier I, extra help is provided to students who have been identified as “at risk” in basic math and reading skills. In general, 10-15 percent of student will receive Tier II interventions.
TIER I ALLAll students receive research-based, high-quality, general education instruction. In general, 80-85 percent of students will have their needs met by Tier I instruction.

Problem Solving Process
6
Where are students performing compared to their peers?
What is causing the problem?
What do students need?
How are students responding?

Assessment
7
Universal ScreeningFormative and Summative Assessment
Diagnostic AssessmentProgress Monitoring
Diagnostic AssessmentProgress Monitoring
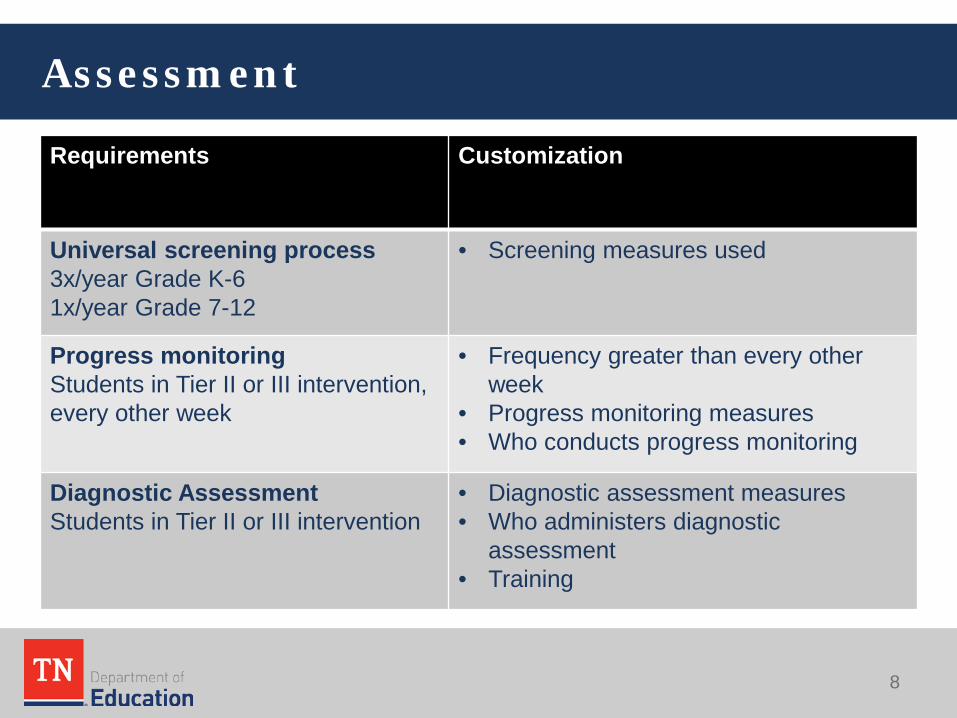
Requirements Customization
Universal screening process3x/year Grade K-61x/year Grade 7-12
• Screening measures used
Progress monitoringStudents in Tier II or III intervention, every other week
• Frequency greater than every other week
• Progress monitoring measures• Who conducts progress monitoring
Diagnostic AssessmentStudents in Tier II or III intervention
• Diagnostic assessment measures• Who administers diagnostic
assessment• Training
Assessment
8
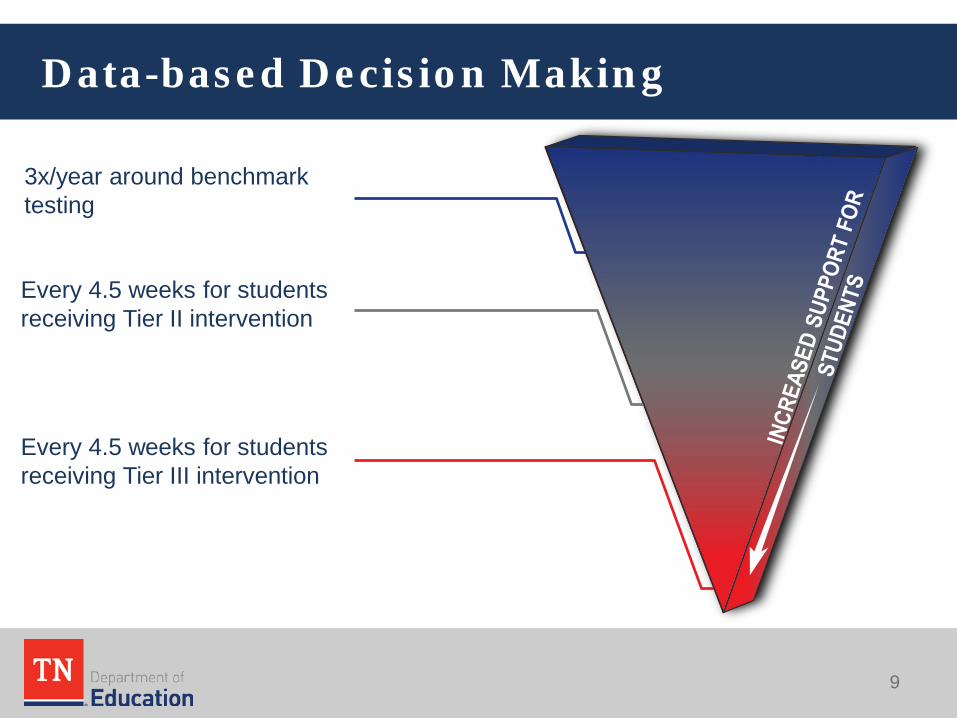
Data-based Decision Making
9
3x/year around benchmark testing
Every 4.5 weeks for students receiving Tier II intervention
Every 4.5 weeks for students receiving Tier III intervention
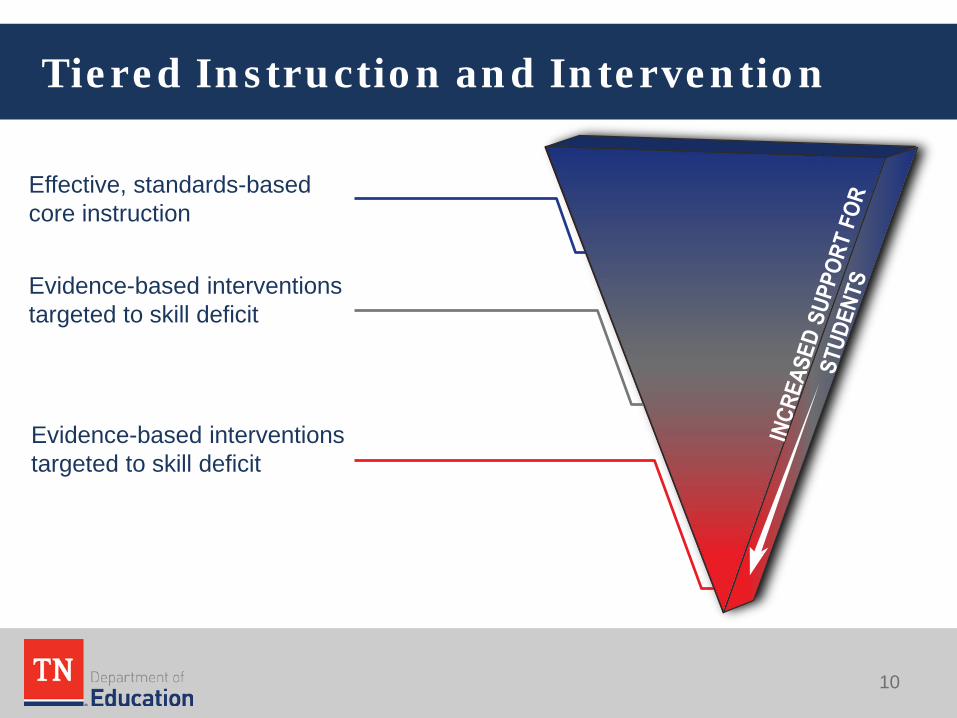
Tiered Instruction and Intervention
10
Effective, standards-based core instruction
Evidence-based interventions targeted to skill deficit
Evidence-based interventions targeted to skill deficit
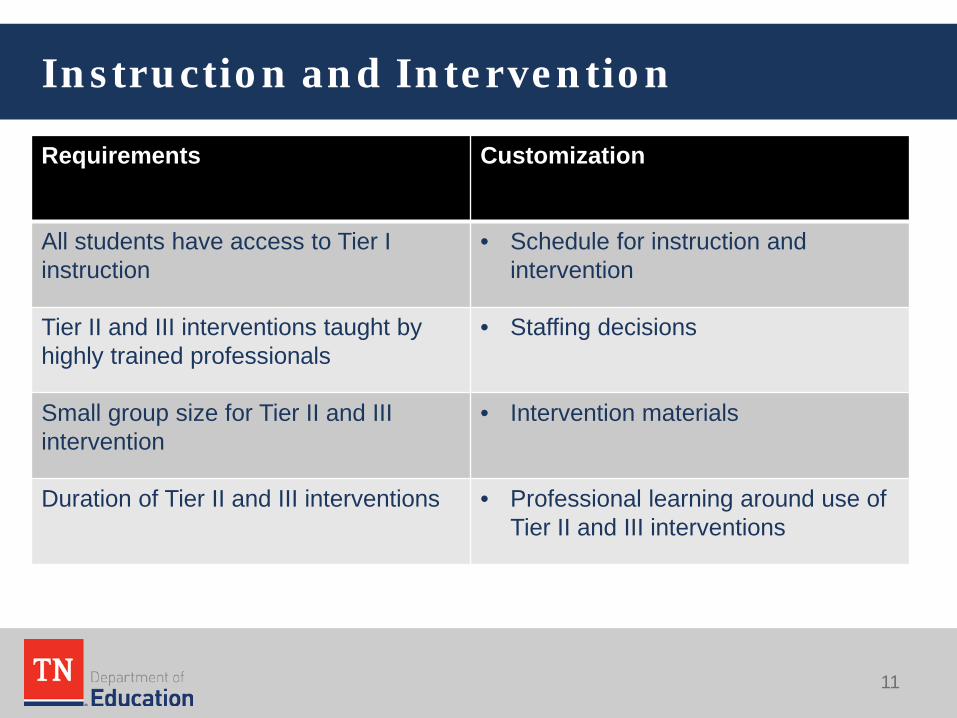
Requirements Customization
All students have access to Tier I instruction
• Schedule for instruction and intervention
Tier II and III interventions taught by highly trained professionals
• Staffing decisions
Small group size for Tier II and III intervention
• Intervention materials
Duration of Tier II and III interventions • Professional learning around use of Tier II and III interventions
Instruction and Intervention
11

Has RTI2 made an impact over the past
three years?

Identifications of specific learning disabilities (SLDs) has dropped by over one third in elementary
13
14.8
16.3 16.4
13.1
5.2
9.1 9.6
6.4
8.5
3.63.5
1.4
0
2
4
6
8
10
12
14
16
18
2011 2012 2013 2014 2015 2016 2017
New SLD identifications per 1000 students
Elementary Middle High

18.119.4 19.5
15.4
6.2
10.2 10.9
11.313.1 13.1
10.7
4.2
7.8 8.2
0.0
5.0
10.0
15.0
20.0
25.0
2011 2012 2013 2014 2015 2016 2017
SLD identifications per 1000 males/females
Males Females
Gaps in SLD identification between males and females in elementary narrowed significantly
14

Gaps in SLD identification between racial subgroups in elementary disappeared
15
17.418.5 18.6
14.9
5.1
8.7 9.313.515.3 15.3
12.2
5.3
9.3 9.8
0
5
10
15
20
25
2011 2012 2013 2014 2015 2016 2017
SLD identifications per 1000 BHN/Non-BHN
BHN Non-BHN

16.4 16.3
13.1 13.2
9.1 9.2
0
2
4
6
8
10
12
14
16
18
Pre RTI Post RTI
Year
s ol
d
Average age at SLD identification
High Middle Elementary
The average age of identification for SLD has not shifted since the policy change
16

14.8
16.3 16.4
13.1
5.2
9.1 9.6
2.3
13.3
4.96.0
0.0
2.0
4.0
6.0
8.0
10.0
12.0
14.0
16.0
18.0
2011 2012 2013 2014 2015 2016 2017
New SPED identifications per 1000 students
SLD Autism Emotional Dist. Speech/Lang Impaired Intellectual Dis. OHI
The identification rate has decreased for SLD, but not for other special education classifications
17

Some districts report decreases in students performing below the 25th percentile on universal screener data.
Some districts also report a decrease in the percentage of students requiring Tier II and III interventions.
However, we also see that some students are staying in tiered interventions for lengthy periods of time and some who exit interventions do not maintain their skills later, requiring further intervention.
Tracking Academic Outcomes
18

Challenges of RTI²Implementation
19

RTI2 is difficult to integrate into already complex school structures.
Staffing to support implementation can be difficult.
Department guidance and support has felt restrictive to some while others have felt they needed more.
Implementing RTI2 at the high school level poses a unique set of challenges.
Challenges

Planning for the Future of RTI2

Examine current guidelines to determine how they could improve implementation.
Enhance resources and support for RTI2 implementation to increase best practices.
Provide differentiated support for high schools.
Looking Forward
Listening Tour
23

Town Halls Educators and community members across the state will
be able to provide feedback around RTI2.
High School Focus Groups Specific high schools around the state were chosen to
conduct student and staff focus groups.
Listening Tour
24

Karen JensenDirector, Response to Instruction and Intervention
Theresa NichollsAssistant Commissioner,
Special Populations and Student [email protected]
Contact Information
25


