Fluctuations in Ground-Water Levels Water levels in aquifers reflect a dynamic balance between ground-water recharge, storage, and discharge. If recharge exceeds discharge, the volume of water in storage will increase and water levels will rise; if discharge exceeds recharge, the volume of water in storage will decrease and water levels will fall. Because recharge and discharge are not distributed uniformly in space and time, ground-water levels are continuously rising or falling to adjust to the resulting imbalances. Water levels in wells reflect these changes and provide the principal means of tracking changes in ground- water storage over time. Water-level measurements also provide insight into the physical properties that control aquifer recharge, storage, and discharge since these factors affect the timing and intensity of responses to hydrologic stresses such as precipitation or pumping. Water levels in the Willamette Basin generally follow a cyclic pattern that mimics seasonal variations in recharge and discharge. High water levels occur in the rainy season when recharge from precipitation exceeds discharge; low water lev- els occur during the dry summer when discharge by pumping, evapotranspiration, and leakage to streams exceeds recharge. The principal factors that affect ground-water levels are pre- cipitation, stream stage, and well pumpage and injection. Response to Precipitation Many wells in the Willamette Basin show a direct, rapid response to short-term precipitation events such as winter storms. This is not unexpected because ground water com- monly occurs at shallow depths and average annual precipita- tion typically exceeds 40 in throughout the basin. In contrast, other wells in the basin show a gradual, or indirect, response to seasonal precipitation. In both cases, the rise in water levels in fall is steeper than the decline in water levels in spring. The hydrograph for well 16S/05W-26AAD near Eugene in the southern Willamette Basin shows a typical direct response to precipitation (fig. 22, pl. 1). A steep seasonal water-level rise occurs in late autumn or early winter, shortly after the beginning of the annual rainy season, followed by discrete peaks that correlate to periodic storms during the rainy season. Seasonal high water levels occur as multiple peaks or as a broad high that coincides with extended periods of rainfall. Water levels begin to drop in late spring as rain- fall diminishes, and continue to fall during the dry summer. The response to rainfall at the beginning of the rainy season is generally delayed by several days or weeks, reflecting the time necessary to bring soil moisture to field capacity (Piper, 1942; Woodward and others, 1998). Once soils are at capac- ity, however, the effects of additional rainfall occur with little or no delay. Annual high water levels are generally constant from year to year and are within 1 ft of land surface except in exceptionally dry years such as the winter of 2000–01, when annual precipitation was about 50 percent less than average. This suggests that mean annual precipitation is more than suf- ficient to recharge the aquifer to its maximum capacity in most years. Wells that show a direct response to precipitation in the Willamette Basin generally tap unconfined or poorly confined aquifers in areas where the water table occurs at shallow depths. These conditions are common in the upper sedimen- tary unit throughout most of the basin and in shallow parts of the middle sedimentary unit in the southern Willamette Basin, 8 Ground-Water Hydrology of the Willamette Basin, Oregon
Transcript
Fluctuations in Ground-Water LevelsWater levels in aquifers reflect a dynamic balance
between ground-water recharge, storage, and discharge. If recharge exceeds discharge, the volume of water in storage will increase and water levels will rise; if discharge exceeds recharge, the volume of water in storage will decrease and water levels will fall. Because recharge and discharge are not distributed uniformly in space and time, ground-water levels
are continuously rising or falling to adjust to the resulting imbalances. Water levels in wells reflect these changes and provide the principal means of tracking changes in ground-water storage over time. Water-level measurements also provide insight into the physical properties that control aquifer recharge, storage, and discharge since these factors affect the timing and intensity of responses to hydrologic stresses such as precipitation or pumping.
Water levels in the Willamette Basin generally follow a cyclic pattern that mimics seasonal variations in recharge and discharge. High water levels occur in the rainy season when recharge from precipitation exceeds discharge; low water lev-els occur during the dry summer when discharge by pumping, evapotranspiration, and leakage to streams exceeds recharge. The principal factors that affect ground-water levels are pre-cipitation, stream stage, and well pumpage and injection.
Response to Precipitation
Many wells in the Willamette Basin show a direct, rapid response to short-term precipitation events such as winter storms. This is not unexpected because ground water com-monly occurs at shallow depths and average annual precipita-tion typically exceeds 40 in throughout the basin. In contrast, other wells in the basin show a gradual, or indirect, response to seasonal precipitation. In both cases, the rise in water levels in fall is steeper than the decline in water levels in spring.
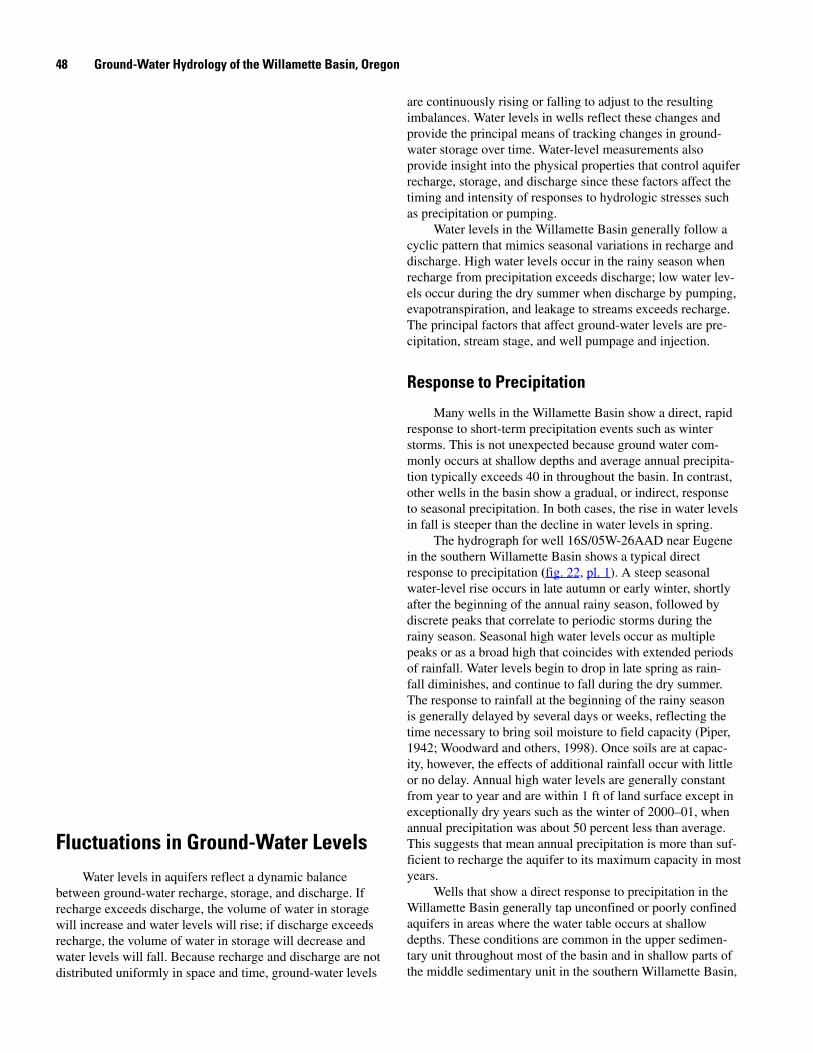
The hydrograph for well 16S/05W-26AAD near Eugene in the southern Willamette Basin shows a typical direct response to precipitation (fig. 22, pl. 1). A steep seasonal water-level rise occurs in late autumn or early winter, shortly after the beginning of the annual rainy season, followed by discrete peaks that correlate to periodic storms during the rainy season. Seasonal high water levels occur as multiple peaks or as a broad high that coincides with extended periods of rainfall. Water levels begin to drop in late spring as rain-fall diminishes, and continue to fall during the dry summer. The response to rainfall at the beginning of the rainy season is generally delayed by several days or weeks, reflecting the time necessary to bring soil moisture to field capacity (Piper, 1942; Woodward and others, 1998). Once soils are at capac-ity, however, the effects of additional rainfall occur with little or no delay. Annual high water levels are generally constant from year to year and are within 1 ft of land surface except in exceptionally dry years such as the winter of 2000–01, when annual precipitation was about 50 percent less than average. This suggests that mean annual precipitation is more than suf-ficient to recharge the aquifer to its maximum capacity in most years.
Wells that show a direct response to precipitation in the Willamette Basin generally tap unconfined or poorly confined aquifers in areas where the water table occurs at shallow depths. These conditions are common in the upper sedimen-tary unit throughout most of the basin and in shallow parts of the middle sedimentary unit in the southern Willamette Basin,
�8 Ground-Water Hydrology of the Willamette Basin, Oregon
where the overlying Willamette silt unit is relatively thin. Similar responses occur in shallow water-bearing zones of the Columbia River basalt and basement confining units in upland areas where these units are exposed at land surface. Piper (1942) noted a similar response in shallow wells completed in the Willamette silt unit (his semiperched, water-table aquifer) in the central Willamette Basin. The rapid response to precipi-tation and the direct correlation to individual storms indicate that recharge is local, infiltration rates are rapid, and recharge paths are short.
An example of an indirect response to precipitation is shown by the hydrograph of water levels for 08S/03W-35DDD (fig. 22), a well located south of Salem (pl. 1) and open to the Columbia River basalt unit. Water levels begin to rise shortly after the start of the annual rainy season and follow a trend that is proportional to cumulative seasonal precipita-tion. Rising ground-water levels correspond to steep increases in the cumulative seasonal precipitation. Annual water levels generally peak and begin to decline in March, when the slope of the cumulative precipitation curve decreases, which is equivalent to a decline in the rate of precipitation. Responses
to individual storms are subdued or absent. The highest sea-sonal water levels generally occur as well-defined peaks that typically coincide with the peak intensity of rainfall during the rainy season. The relative height of seasonal water-level peaks shows a general correlation to annual precipitation. Because seasonal water-level peaks are more than 100 ft below land surface, water levels are free to rise or fall in response to climatic trends. An indirect response to precipitation suggests that infiltration rates are slower or recharge paths are longer relative to wells that show direct responses to precipitation.
Indirect responses to precipitation are common through-out the Willamette Basin in wells that tap unconfined water-bearing zones with deep water tables (generally greater than 40 ft) and in confined water-bearing zones. Examples include wells completed in the confined middle sedimentary unit in the central Willamette Basin and wells completed in the lower part of the middle sedimentary unit in the Portland and south-ern Willamette Basins. In some wells, high seasonal water levels occur several weeks to several months after the peak of the rainy season.
Average precipitation for water years 1960-2002 = 42.75 inches
SALEM
Figure 22. Precipitation and ground-water levels, Willamette Basin, Oregon.
Fluctuations in Ground-Water Levels ��
Response to Stream Stage
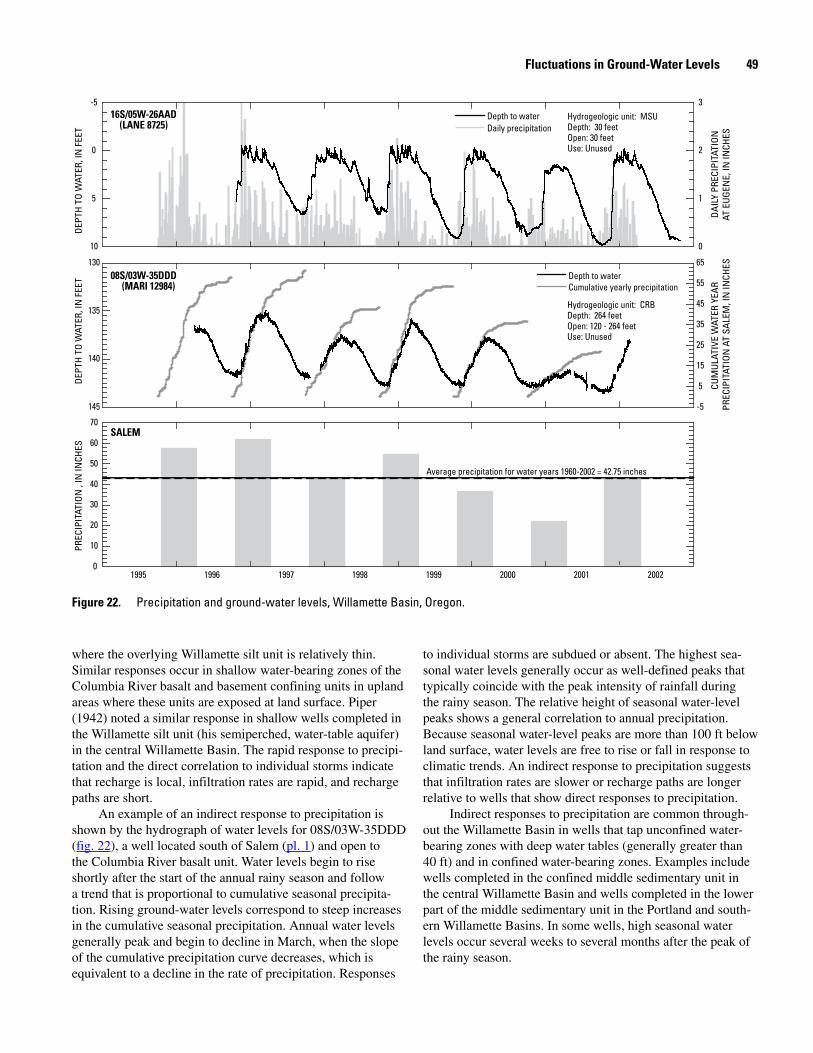
As noted by Piper (1942), water levels in wells adjacent to large streams in the Willamette Basin commonly show a close correlation to stream stage. This behavior is illustrated by water levels in a shallow well (11S/05W-35DDD) com-pleted in floodplain gravels of the upper sedimentary unit, about 1,000 ft east of the Willamette River near Corvallis (fig. 23). At most times, water levels in the well are slightly higher than the river stage, indicating discharge from the aquifer to the river. At high river stage, however, the gradient is com-monly reversed, indicating flow into the aquifer from the river. Most reversals occur during intense rainstorms and persist for short periods of time only. However, because little resistance to flow is expected between large streams and permeable sediments of the upper sedimentary unit, surface water should readily infiltrate into the adjacent aquifer in reaches near the river when gradients are reversed. Studies by Hinkle and others (2001) and Fernald and others (2001) show that local changes in gradient can cause substantial exchanges between large streams and adjacent floodplain aquifers in the Willa-mette Basin.
Response to Pumping
Pumping from wells causes water levels to decline in areas surrounding the well. The magnitude of the decline varies with distance and is dependent upon the pumping rate,
pumping duration, and the geometry and hydraulic properties of the aquifer. These interference effects are reflected in the water levels of nearby wells. The interference from multiple pumping wells is additive.
Sustained, or seasonal, pumping impacts are common in many wells in the Willamette Basin. Unlike the response of water levels to precipitation only, water levels affected by pumping decline steeply in the summer followed by a broad recovery curve that rises throughout the winter and spring (fig. 24). The recovery from pumping begins at the end of the irrigation season, prior to the beginning of the rainy season. Because the shape of the water-level graph and the timing of response differs from the shape and response of water levels to precipitation (fig. 22), these characteristics may be used as a tool to determine if the summer drawdown is a result of natural changes in recharge or the result of a combination of natural changes in recharge and pumping. Seasonal pumping impacts are common in the Columbia River basalt unit and in confined water-bearing zones of the basin-fill sediments in areas where irrigation or public supply wells are in use, such as in the central Willamette Basin.
The hydrographs for 02N/03W-35CDD and 07S/01W-02CAA01 (fig. 24) show seasonal pumping impacts in wells completed in the Columbia River basalt unit. In 07S/01W-02CAA01, the seasonal drawdown consistently begins before water levels have recovered to the levels of prior years, result-ing in a steady, progressive decline of about 5 ft/yr. This is probably caused by consistent annual pumping withdrawals in the surrounding area. The hydrograph for 02N/03W-35CDD
Willamette River stage
Precipitation at Corvallis
185
190
195
200
205
210
215
0
1
2
3
4
5
6
19971996 1998 1999
11S/05W-35DDD (LINN 10841)
WAT
ER-L
EVEL
ELE
VATI
ON,
IN F
EET
ABOV
E N
GVD
1929
DAIL
Y PR
ECIP
ITAT
ION
AT
CORV
ALLI
S, IN
INCH
ES
Figure 2�. Stream stage, precipitation, and water levels in a shallow well near the Willamette River at Corvallis, Oregon.
50 Ground-Water Hydrology of the Willamette Basin, Oregon
shows no systematic annual trends and no correlation to annual precipitation. Water-level trends in this well probably reflect varying annual pumping withdrawals in the area. The hydrograph for 04S/02W-02BBD, completed in the lower sedimentary unit in the central Willamette Basin, shows a seasonal decline of about 65 ft. A comparison to the 10 ft of seasonal fluctuation in the central Willamette Basin prior to development reported by Piper (1942) suggests that ground-water withdrawals in the area contribute approximately 55 ft of additional seasonal fluctuation. Water levels in this well, located close to the Willamette River, do not respond to changes in stream stage, indicating that the fine-grained mate-
rial above the completion interval provides a poor hydraulic connection to the stream.
Response to Injection
Several municipal water utilities, including the Cities of Portland, Tigard, Tualatin, Beaverton, and Salem as well as the Tualatin Valley and Clackamas Water Districts are develop-ing aquifer storage and recovery projects. These projects are designed to inject surface water into aquifers during the winter when demand is low and withdraw it in the summer when demand is high. All of the projects will inject water into the
Average precipitation for water years 1960-2002 = 42.75 in
SALEM
Figure 2�. Response of ground-water levels in selected wells to nearby seasonal pumping, Willamette Basin, Oregon. LSU, lower sedimentary unit, CRB, Columbia River basalt unit.
Fluctuations in Ground-Water Levels 51
Columbia River basalt unit, except for the City of Portland, which plans to inject water into the lower sedimentary unit.
Injection and pumping will cause local transient changes in the ground-water systems in nearby areas. This is illustrated in the hydrograph for 01S/01W-33CBC (fig. 25), a well com-pleted in the lower sedimentary unit. The well is located about 3 miles south of a City of Beaverton injection well that is com-pleted in the Columbia River basalt unit. Anomalous water-level rises in the hydrograph correspond to yearly injections in the basalt well that began in 1999. Water levels rose within a few hours after the beginning of the injection and declined shortly after injections stopped. Fluctuations caused by these injections ranged from 4 to 28 ft and were proportional to the volume of injected water. The response of water levels in this well indicates there is a good hydraulic connection between the Columbia River basalt unit and the lower sedimentary unit.
from the pumped well until it captures natural discharge, or induces additional recharge, that is equal to the pumping rate. A capture of natural discharge, for example, occurs when the cone of depression of a pumping well lowers the horizontal hydraulic gradient (water-table slope) adjacent to a stream and captures ground water that would normally discharge into the stream. If pumpage cannot be offset by captured discharge or induced recharge, water will continue to be removed from storage in the aquifer and water levels will decline over time.
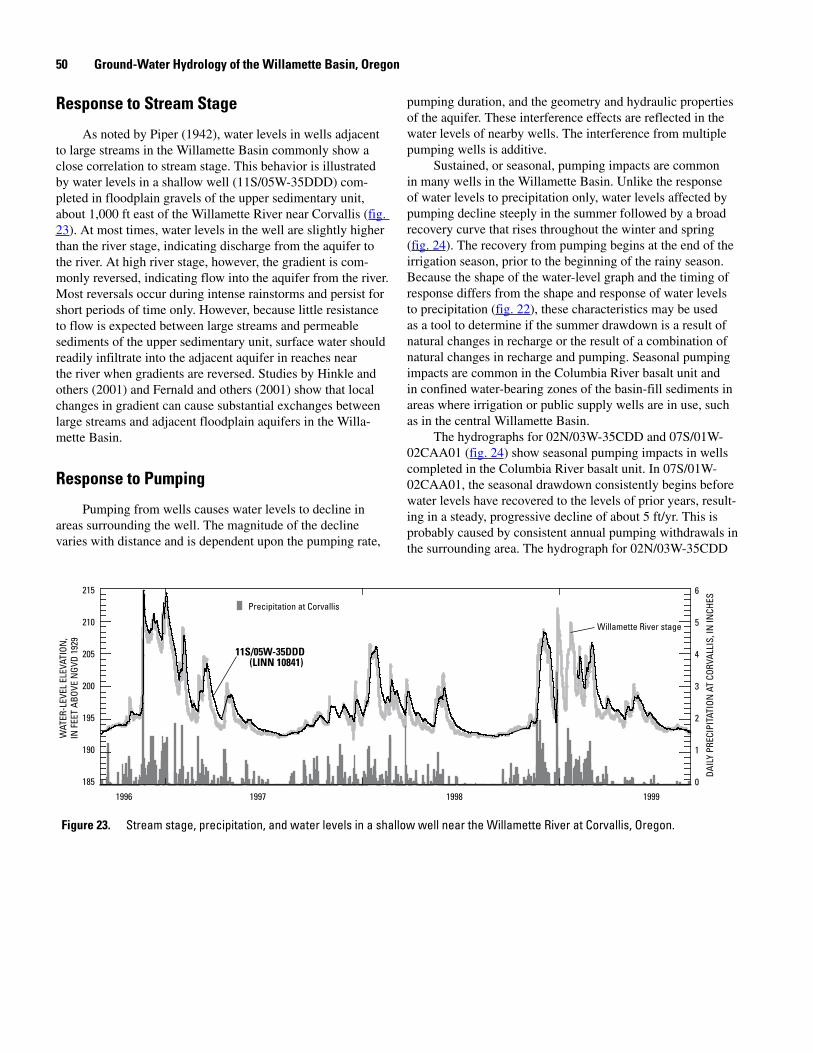
An example of the effect of long-term climatic variability on ground-water levels is illustrated by the hydrograph for well 06S/02W-17DAD, several miles northeast of Salem (fig. 26). The well is 120 ft deep and is completed in the middle sedimentary unit, which is confined by about 60 ft of satu-rated Willamette silt unit. Seasonal high water levels in the well show a general correlation to precipitation trends. Rising water-level trends correspond to periods of above average precipitation and declining water-level trends correspond to periods of lower than average precipitation.
These trends are particularly evident for a 10-year period of below average precipitation between 1984 and 1994 and a subsequent 5-year period of above average precipitation from 1994 to 1999. Although year-to-year changes in seasonal high water levels are generally less than 2 ft and small compared to seasonal fluctuations, cumulative changes over periods of above or below average precipitation range up to 10 ft. The largest year-to-year water-level changes, drops of about 8 ft, occurred during the drought years of 1977 and 2001, when precipitation was almost 50 percent less than normal. Approxi-mately 80 percent of this water-level drop was recovered in the next wet season, which, in both cases, experienced about aver-age amounts of precipitation. A general water-level decline of about 7 ft over the 40-year period of record suggests that some long-term decrease in storage is occurring that cannot be attributed solely to climatic cycles. This long term decline is probably caused by ground-water withdrawals, which have increased considerably since the early 1960s in the central Willamette Basin.
Climatic trends in most long-term observation wells in the Willamette Basin are rarely more pronounced than in the above example. In many cases, annual high water levels are consistent from year to year except during drought years such as 1977 and 2001. In these wells, climatic trends are absent because many shallow long-term observation wells are com-pleted in shallow basin-fill sediments where the water table is near land surface, placing an upper limit on water levels, and therefore, on the available storage. In most years, precipitation appears to be sufficient to fully recharge the shallow aquifer system in most of these areas. Water levels in observation wells in upland areas commonly correlate to climatic trends (e.g., 08S/03W-35DDD in fig. 22) because the water levels are generally deeper in these areas, storage is not limited by the proximity of land surface, and, if other hydraulic boundaries are absent, water levels are free to rise and fall in proportion to annual precipitation.
Figure 25. Response of ground-water levels to nearby injection of water, Tualatin Basin, Oregon. LSU, lower sedimentary unit.
Long-Term Water-Level Variability
Long-term water-level variability can be used to deter-mine the natural range of climate-induced water-level fluctua-tions and to assess the long-term impacts of artificial stresses such as pumping. Under natural conditions, prior to develop-ment, ground-water levels are in a state of dynamic equilib-rium that reflects a balance between recharge and discharge. Because natural recharge is always variable, water levels will rise and fall in response to multiyear trends of above or below normal precipitation. Over long periods of time, however, water levels will fluctuate around an average value that reflects the long-term balance between recharge and discharge.
Pumpage from wells is an additional discharge that disrupts this natural balance (Theis, 1940; Alley and others, 1999; Bredehoeft, 2002; Sophocleous, 2002). As a well is pumped, ground water is removed from storage in the vicinity of the well, causing water levels to decline in the surround-ing aquifer. As pumping continues, the region of lowered water levels forms a cone of depression that expands outward
52 Ground-Water Hydrology of the Willamette Basin, Oregon
Climatic trends are commonly masked in wells that show seasonal pumping impacts in the Willamette Basin. Some of the hydrographs in figure 24, for example, show residual trends that are probably related to precipitation but the climatic signal is largely overwhelmed by pumping impacts.
The above examples set a context for evaluating factors that control long-term water-level trends in the Willamette Basin. In the following sections, representative long-term hydrographs are shown for each part of the basin and the major factors that control long-term trends and water supplies are identified.
Southern Willamette BasinGround water levels in the basin-fill sediments of the
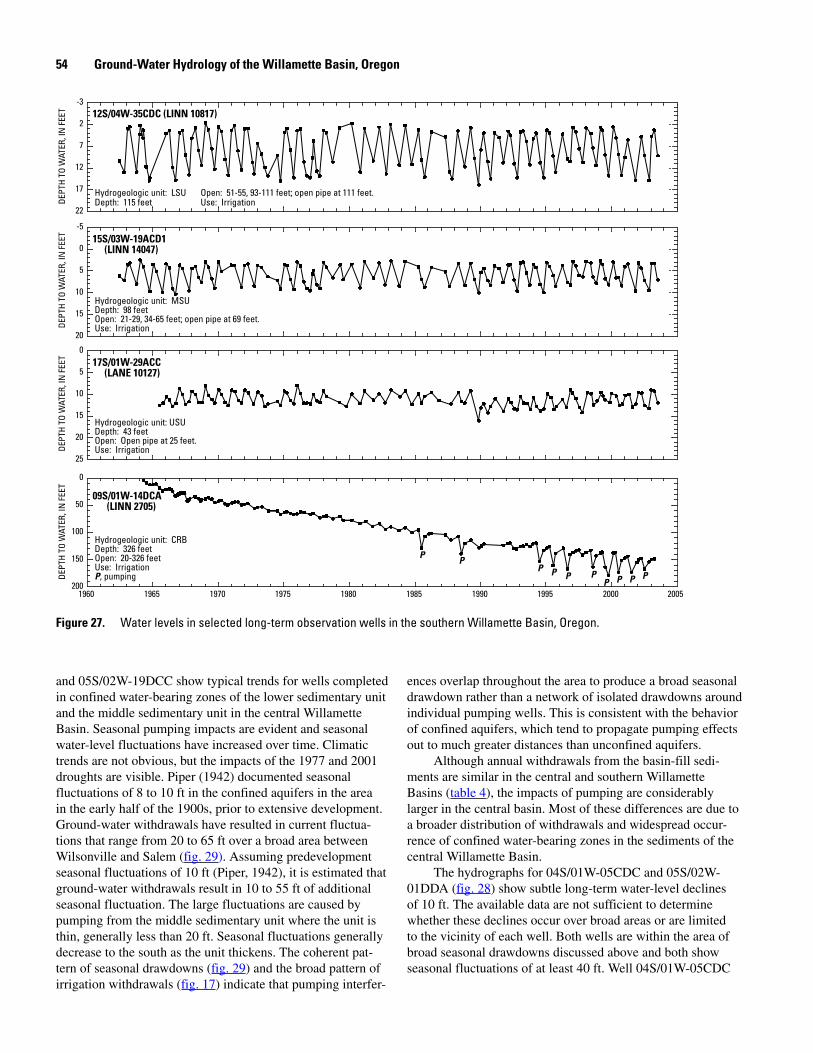
southern Willamette Basin show little variability over the last 50 years. Representative hydrographs (fig. 27) show shal-low water levels and consistent seasonal fluctuations that are generally less than 15 ft. Weak climatic trends are evident in 12S/04W-35CDC, completed in the lower sedimentary unit, and 15S/03W-19ACD1, completed in the middle sedimentary unit, but not in 17S/01W-29ACC, completed in the upper sedimentary unit adjacent to the McKenzie River. Lower peak water levels are discernable in some of the wells during the drought years of 1977 and 2001, but long-term changes in water levels are not evident over the period of record. Seasonal fluctuations are essentially unchanged from natural conditions (Piper, 1942), even though about 106,000 acre-ft of ground water are now pumped from the basin-fill sediments in this part of the valley (table 4).
Several factors probably contribute to this long-term stability in shallow wells. Recharge is relatively direct and efficient throughout the area because water levels show a direct response to precipitation, or a close correlation to stream
stage, and no seasonal pumping impacts. Recharge is sufficient to fully saturate the aquifer during most winters. Ground-water withdrawals do not result in long-term drawdowns or large seasonal fluctuations because the effects of irrigation with-drawals from the upper sedimentary unit adjacent to the flood-plain of the Willamette River are buffered by the stream stage of the Willamette River. Most current pumpage, and any new pumpage, from areas adjacent to the major streams will largely be at the expense of streamflow (Piper, 1942). Depletion of streamflow in the Willamette River from nearby ground-water withdrawals is not measurable because of limited streamflow measurements, flow regulation at upstream reservoirs, and these withdrawals represent a small portion of streamflow.
The Columbia River basalt unit occurs in a limited area in the northern part of the southern Willamette Basin (fig. 10). The overall productive capacity of the basalt unit is limited in this area because the unit is generally less than 500 ft thick and contains only a few interflow zones. These limits are illus-trated by the progressive, long-term declines in the hydrograph for 09S/01W-14DCA (fig. 27), which is dominated by the impacts of nearby pumping.
Central Willamette BasinThe principal aquifers within the central Willamette
Basin occur in the basin-fill sediments and in the Colum-bia River basalt unit. Long-term water-level variability for selected wells is shown in figure 28.
Within the floodplains of the Willamette and Molalla Rivers, ground water is unconfined in the upper sedimentary unit. Outside of these areas, the water table occurs near land surface in the Willamette silt unit and ground water is gener-ally confined in the underlying middle sedimentary unit (Piper, 1942). Hydrographs for 04S/01W-05CDC, 05S/02W-01DDA,
Cumulative departure from mean annual precipitation, Salem, Oregon
Long-term ground-water levels in 06S/02W-17DAD (MARI 4160)
Long-term seasonal high ground-water levels and cumulative departure from mean annual precipitation
Seasonal high water levels (06S/02W-17DAD)
Figure 26. Precipitation and long-term water-level variability in a well near Salem, Oregon.
Fluctuations in Ground-Water Levels 5�
and 05S/02W-19DCC show typical trends for wells completed in confined water-bearing zones of the lower sedimentary unit and the middle sedimentary unit in the central Willamette Basin. Seasonal pumping impacts are evident and seasonal water-level fluctuations have increased over time. Climatic trends are not obvious, but the impacts of the 1977 and 2001 droughts are visible. Piper (1942) documented seasonal fluctuations of 8 to 10 ft in the confined aquifers in the area in the early half of the 1900s, prior to extensive development. Ground-water withdrawals have resulted in current fluctua-tions that range from 20 to 65 ft over a broad area between Wilsonville and Salem (fig. 29). Assuming predevelopment seasonal fluctuations of 10 ft (Piper, 1942), it is estimated that ground-water withdrawals result in 10 to 55 ft of additional seasonal fluctuation. The large fluctuations are caused by pumping from the middle sedimentary unit where the unit is thin, generally less than 20 ft. Seasonal fluctuations generally decrease to the south as the unit thickens. The coherent pat-tern of seasonal drawdowns (fig. 29) and the broad pattern of irrigation withdrawals (fig. 17) indicate that pumping interfer-
ences overlap throughout the area to produce a broad seasonal drawdown rather than a network of isolated drawdowns around individual pumping wells. This is consistent with the behavior of confined aquifers, which tend to propagate pumping effects out to much greater distances than unconfined aquifers.
Although annual withdrawals from the basin-fill sedi-ments are similar in the central and southern Willamette Basins (table 4), the impacts of pumping are considerably larger in the central basin. Most of these differences are due to a broader distribution of withdrawals and widespread occur-rence of confined water-bearing zones in the sediments of the central Willamette Basin.
The hydrographs for 04S/01W-05CDC and 05S/02W-01DDA (fig. 28) show subtle long-term water-level declines of 10 ft. The available data are not sufficient to determine whether these declines occur over broad areas or are limited to the vicinity of each well. Both wells are within the area of broad seasonal drawdowns discussed above and both showseasonal fluctuations of at least 40 ft. Well 04S/01W-05CDC
-3
2
7
12
17
22
12S/04W-35CDC (LINN 10817)
DEPT
H TO
WAT
ER, I
N F
EET
Hydrogeologic unit: LSUDepth: 115 feet
Open: 51-55, 93-111 feet; open pipe at 111 feet.Use: Irrigation
-5
0
5
10
15
20
15S/03W-19ACD1 (LINN 14047)
DEPT
H TO
WAT
ER, I
N F
EET
Hydrogeologic unit: MSUDepth: 98 feetOpen: 21-29, 34-65 feet; open pipe at 69 feet.Use: Irrigation
0
5
10
15
20
25
17S/01W-29ACC (LANE 10127)
DEPT
H TO
WAT
ER, I
N F
EET
Hydrogeologic unit: USUDepth: 43 feetOpen: Open pipe at 25 feet.Use: Irrigation
Figure 2�. Water levels in selected long-term observation wells in the southern Willamette Basin, Oregon.
5� Ground-Water Hydrology of the Willamette Basin, Oregon
is open to a thin interval of middle sedimentary unit in an area that is intensely irrigated with ground water. Well 05S/02W-01DDA is located near several municipal wells that supply the city of Woodburn. Smaller long-term water-level declines are evident in other wells in the central Willamette Basin (e.g. 06S/02W-17DAD in figure 26; also see hydrographs in Orzol and others, 2000) but systematic trends are not apparent. The lack of long-term water-level declines in most of the central basin suggests that ground-water withdrawals are compen-sated each year by a decrease in discharge to streams or by an
induced increase in recharge. Because the low-permeability Willamette silt unit underlies smaller streams, ground-water pumpage is probably at the expense of streamflow in large streams that penetrate coarse-grained basin-fill sediments. Additional pumpage in the central Willamette Basin will probably lead to larger seasonal water-level fluctuations over broader areas, especially in areas where the sands and gravels are thin.
Long-term water-level trends in the Columbia River basalt unit are highly variable in the central Willamette Basin.
Figure 28. Water levels in selected long-term observation wells in the central Willamette Basin, Oregon.
Fluctuations in Ground-Water Levels 55
The hydrographs for 03S/01W-15CAC and 08S/03W-11CCC (fig. 28) show two contrasting trends that illustrate the impact of nearby pumping withdrawals.
A 920-ft deep well, 03S/01W-15CAC, just west of Wil-sonville, shows a water-level decline of about 55 ft between 1960 and 2002. During the same period, seasonal fluctua-tions increased from 5 to 15 ft/yr. These changes coincide with a period of increased withdrawals from basalt wells that provided water to the City of Wilsonville. By 2002, daily withdrawals from these wells totaled 2.7 million gallons, the equivalent of a continuous pumping rate of about 4.2 ft3/s (1,900 gal/min (gallons per minute), 3,000 acre-ft/yr). On April 29, 2002, Wilsonville converted to a surface-water source and stopped pumping from its basalt wells. Within 24 hours, water levels in 03S/01W-15CAC began an abrupt rise which continued throughout most of the summer when water levels generally fall in the area. Within a year of the conver-sion, water levels had risen by 20 ft, the equivalent of about one-third of the total decline of the previous 40 years. Water-level declines and recoveries have been observed in basalt wells as far as 4 miles east and 6 miles south of Wilsonville (fig. 20). These observations indicate that pumping by the city of Wilsonville was the dominant factor controlling long-term water-level declines in the deep Columbia River basalt unit in this area and that pumping impacts occurred at distances
of at least 6 miles in some directions. The long-term declines prior to 2002 and the relatively large area of impact despite the small annual withdrawals suggest that the expanding cone of depression was unable to capture natural discharge or induce additional recharge at levels anywhere near the average pumping rate. This suggests that the deep Columbia River basalt unit is not well connected to the overlying sedimentary aquifers or to nearby surface water sources. In fact, pump-ing impacts occurred up to 5 miles south of the Willamette River even though most of the city of Wilsonville’s pumping wells are located on the north side of the river. These observa-tions are not surprising considering that the main mass of the Columbia River basalt unit consists of thick flow interiors with low vertical permeabilities.
Although substantial recovery has occurred during the first year following the cessation of pumping by Wilsonville, complete recovery is likely to take many years, possibly sev-eral decades. If additional ground water is withdrawn from the basalt for other uses in the future, recovery will be delayed and possibly reversed.
The long-term hydrograph for 08S/03W-11CCC (fig. 28), a relatively shallow basalt well in the Salem Hills, shows a progressive decrease in seasonal fluctuations between the late 1960s and 2002. Seasonal high water levels have remained relatively constant at about 20 ft below land surface for the period of record, and no progressive trends are evident except a 4-ft drop associated with the 2001 drought. Prior to about 1975, the well was located outside of the Salem city limits in an area of rural subdivisions and farmland that were supplied by domestic and irrigation wells completed in the Columbia River basalt unit. The surrounding area is now within the city of Salem, and withdrawals from the unit in the area are much reduced. This suggests that the decrease in seasonal fluctua-tions in 08S/03W-11CCC is the result of a decrease in ground-water pumpage over time. The absence of a long-term decline in the well indicates that withdrawals were small compared to the average annual recharge. The direct and rapid response to precipitation, especially visible between 1996 and 2002 when a recording device was installed, suggests that the well is completed in an unconfined aquifer in the basalt. If pumping is no longer occurring in the area, the average seasonal fluctua-tion of about 8 ft in recent years should represent the average natural seasonal fluctuation in the shallow basalt aquifer.
Tualatin BasinMost ground-water withdrawals in the Tualatin Basin are
from the Columbia River basalt unit. Long-term water-levels in this unit are generally only available for wells in the vicinity of Cooper and Bull Mountains in the southeastern portion of the basin. The hydrograph 01S/02W-23ACB (fig. 30) is typi-cal for many of the deep basalt wells in this area. Water-level declines occurred throughout the 1960s and early 1970s as the unit was developed for public supply and irrigation uses. Water levels recovered throughout most of the late 1970s and 1980s after pumping restrictions were implemented by the
WillametteBasin
OREGON
Area ofthis map
5 MILES
5 KILOMETERS
0
0
2040
60
20
T 4 S
T 6 S
T 8 S
T 3 S
T 5 S
T 7 S
R 2 W R 1 W R 1 ER 4 W R 3 W
45°15'
45°00'
123°00' 122°45'
gindduP
Lit
tle
Pud
ding
Riv
er
Cha
mpo
egC
reek
Creek
Creek
Creek
Abiqua
Zollner
Cr
Mill
Butte
Cas
eC
r
R
River
Drift
Creek
Molalla
Yamhill
WIL
LAM
ETT
ERIVER
River
22
225
5
Salem
Keizer
Woodburn
Newberg
MountAngel
Wilsonville
SaintPaul
AuroraDayton
Lafayette
ScottsMills
Dundee
Silverton
Gervais
Donald
!
!
!!!
! !
!!! !
! ! !!
! ! !! !
!!!
! !!!
!
!
!!! !!
!!
!
!
42 6
8
2
4785
82
5
27
3
15
146560
13
35 47
15 47
1122
2524 1532
3515
18 22
1817 36
27
EXPLANATION!8
Location of water-level measurement— Number is seasonal fluctuation in
water level, in feet.
Line of equal water-level fluctuation—Interval is 20 feet.
20
Figure 2�. Amplitude of seasonal ground-water fluctuations in basin-fill sediments, 1997–98, central Willamette Basin, Oregon.
56 Ground-Water Hydrology of the Willamette Basin, Oregon
OWRD. A subsequent decline of about 20 ft in the late 1980s was caused by the dewatering of a quarry in the unit about one-half mile to the south of 01S/02W-23ACB and is local-ized to the vicinity of the quarry (Marc Norton, OWRD, oral commun., 2003).
The hydrograph for 01N/02W-08BCA (fig. 30) is prob-ably representative of the shallow sediments in the basin. Seasonal fluctuations are typically about 15 ft and show no trends over time. Seasonal high water levels were lower during the 1977 and 2001 droughts and the long-term trend shows a general correlation to climatic trends. In contrast, the hydrograph for well 02S/01E-21CCC (fig. 30), completed in a deeper section of the basin-fill sediments, shows several long-term trends. A decline in the 1960s and early 1970s does not correspond to climatic trends but is roughly coincident with declines in the Columbia River basalt unit near Cooper and Bull Mountains, about 4.5 miles to the northwest. Water levels measured after 1995 show an indirect response to precipita-tion and a general correlation to annual precipitation. Seasonal high water levels were higher during the wet years of 1996 and 1997 and lowest during the 2001 drought. Declining water levels in the 1960s and early 1970s may have been caused by pumping from the underlying basalt unit, whereas the later trend may represent the natural climatic response of the deep sediments when pumping withdrawals are much lower in the basalt unit. Water levels in this well may not be representa-tive of hydraulic conditions of the deeper part of the lower sedimentary unit in the Tualatin Basin because the well is
screened in sediments filling a deep trench in a constricted part of the Tualatin Basin that is not representative of conditions elsewhere in the basin.
Portland BasinMost ground-water withdrawals in the Portland Basin
are from the basin-fill sediments (table 4). Minor amounts are pumped from the Columbia River basalt unit. Long-term hydrographs are available for the sedimentary units but not for the basalt unit.
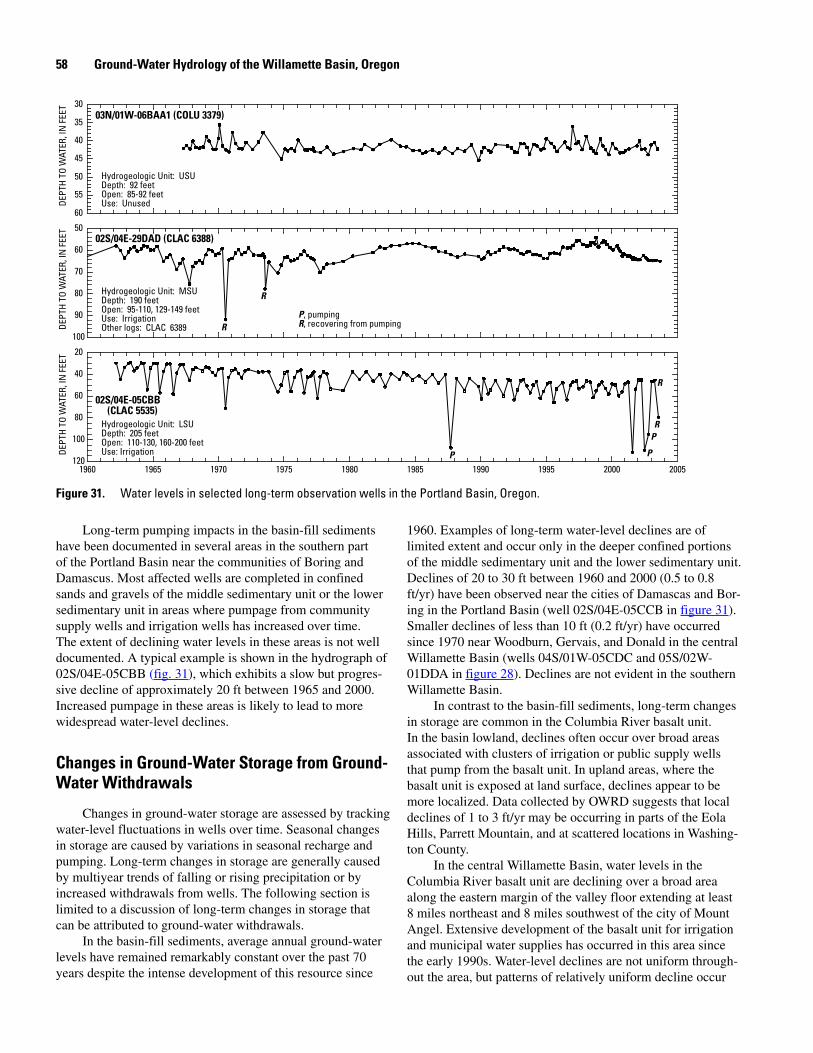
The hydrograph of 03N/01W-06BAA1 (fig. 31) shows long-term water-level variability that is typical of shallow wells completed in the upper sedimentary unit near major streams in low-lying areas of the Portland Basin. Water-level fluctuations are generally less than 10 ft and seasonal high water levels were lower during the droughts of 1977 and 2001. No long-term changes in storage are evident, but water levels show a general correlation to climatic trends or stream stage. These factors suggest that ground-water withdrawals are buff-ered by nearby streams in these areas.
An example of long-term water-level variability in basin-fill sediments in upland areas is illustrated by the hydrograph of 02S/04E-29DAD (fig. 31). This is a relatively shallow well completed in a section of the middle sedimentary unit that is isolated on a narrow terrace between two deeply incised creeks. Long-term water-levels show a general correlation to climatic variability.
Figure �0. Water levels in selected long-term observation wells in the Tualatin Basin, Oregon.
Fluctuations in Ground-Water Levels 5�
Long-term pumping impacts in the basin-fill sediments have been documented in several areas in the southern part of the Portland Basin near the communities of Boring and Damascus. Most affected wells are completed in confined sands and gravels of the middle sedimentary unit or the lower sedimentary unit in areas where pumpage from community supply wells and irrigation wells has increased over time. The extent of declining water levels in these areas is not well documented. A typical example is shown in the hydrograph of 02S/04E-05CBB (fig. 31), which exhibits a slow but progres-sive decline of approximately 20 ft between 1965 and 2000. Increased pumpage in these areas is likely to lead to more widespread water-level declines.
Changes in Ground-Water Storage from Ground-Water Withdrawals
Changes in ground-water storage are assessed by tracking water-level fluctuations in wells over time. Seasonal changes in storage are caused by variations in seasonal recharge and pumping. Long-term changes in storage are generally caused by multiyear trends of falling or rising precipitation or by increased withdrawals from wells. The following section is limited to a discussion of long-term changes in storage that can be attributed to ground-water withdrawals.
In the basin-fill sediments, average annual ground-water levels have remained remarkably constant over the past 70 years despite the intense development of this resource since
1960. Examples of long-term water-level declines are of limited extent and occur only in the deeper confined portions of the middle sedimentary unit and the lower sedimentary unit. Declines of 20 to 30 ft between 1960 and 2000 (0.5 to 0.8 ft/yr) have been observed near the cities of Damascas and Bor-ing in the Portland Basin (well 02S/04E-05CCB in figure 31). Smaller declines of less than 10 ft (0.2 ft/yr) have occurred since 1970 near Woodburn, Gervais, and Donald in the central Willamette Basin (wells 04S/01W-05CDC and 05S/02W-01DDA in figure 28). Declines are not evident in the southern Willamette Basin.
In contrast to the basin-fill sediments, long-term changes in storage are common in the Columbia River basalt unit. In the basin lowland, declines often occur over broad areas associated with clusters of irrigation or public supply wells that pump from the basalt unit. In upland areas, where the basalt unit is exposed at land surface, declines appear to be more localized. Data collected by OWRD suggests that local declines of 1 to 3 ft/yr may be occurring in parts of the Eola Hills, Parrett Mountain, and at scattered locations in Washing-ton County.
In the central Willamette Basin, water levels in the Columbia River basalt unit are declining over a broad area along the eastern margin of the valley floor extending at least 8 miles northeast and 8 miles southwest of the city of Mount Angel. Extensive development of the basalt unit for irrigation and municipal water supplies has occurred in this area since the early 1990s. Water-level declines are not uniform through-out the area, but patterns of relatively uniform decline occur
Figure �1. Water levels in selected long-term observation wells in the Portland Basin, Oregon.
58 Ground-Water Hydrology of the Willamette Basin, Oregon
in several areas. In the area immediately north of the Mount Angel fault, water levels are declining at rates of about 3 ft/year. Farther to the northeast, decline rates vary from 1 to 3 ft/yr. Immediately south of the Mount Angel fault, water levels are declining at rates of 5 to 6 ft/yr (07S/01W-02CAA01, fig. 24). Farther south of Mount Angel, decline rates are generally less than 3 ft/yr. Less areally extensive areas of decline are occurring in the basalt unit south of Stayton, Oregon, where water levels have declined 4 ft/yr since 1964 (fig. 27).
Historic declines of many tens of feet have occurred in the area around the City of Wilsonville (fig. 20) and also in the area around Cooper and Bull Mountains, west of the Cities of Beaverton and Tigard (fig. 30). Water levels in the Cooper-Bull Mountains area, which were declining at a rate of 1 to 8 ft/yr between the early 1960’s and 1974, have recovered to within about 90 percent of their predevelopment levels since controls on pumping were established by OWRD in 1976. Water levels, which declined over 1 ft/yr, have been rising in the Wilsonville area since late April of 2002 when the City of Wilsonville stopped pumping from its basalt wells (fig. 28).
Although ground-water withdrawals from the Columbia River basalt unit represent only 11 percent of total withdrawals in the Willamette Basin, most instances of declining water-lev-els attributable to pumping occur within this unit. Modest rates of withdrawal, such as 2.7 million gallons per year (equivalent to 1,900 gal/min or 3,000 acre-ft/yr) withdrawn by the City of Wilsonville, can lead to substantial ground-water declines over time. This suggests that some unique features of the basalt unit control its sensitivity to pumping stresses.
A limited ability to store water is a contributing factor. Interconnected pore space is largely limited to tabular inter-flow zones, which generally account for less than 10 percent of the total thickness of basalt unit. Because the porosity of these zones is probably less than 25 percent, ground water probably occupies less than 2.5 percent of the bulk volume of the unit. Related to porosity is the storage coefficient of the confined unit, which is quite low, 0.0001, calculated from aquifer tests. The limited ability to store water causes the cone of depression of a pumping well to extend out to considerable distances in order to capture the water that is removed by the well.
The storage coefficient of the basalt unit is similar to that of the confined middle and lower sedimentary units. Yet annual pumpage of about 104,000 acre-ft from the middle and lower sedimentary units in the central basin has not induced widespread water-level declines, whereas annual pumpage of about 19,000 acre-ft from the basalts has caused widespread declines. This suggests that the basalt unit does not capture natural discharge or induce additional recharge as efficiently as the confined middle sedimentary unit.
The basalt unit has no direct connection to major streams in the basin to capture natural discharge, unlike the middle sedimentary unit, which has an efficient connection to the major streams through the adjacent upper sedimentary unit. Its ability to capture additional recharge is less than for the middle sedimentary unit because the layers of low perme-
ability flow interiors inhibit infiltration of precipitation and downward flow of ground water from overlying hydrogeologic units. The middle sedimentary unit is overlain by a consider-able thickness of saturated Willamette silt unit of high bulk porosity. These saturated fine-grained materials contain a considerable volume of water that can be released to adjacent coarse-grained sediments when water is pumped from the lat-ter. These factors suggest that the susceptibility of the Colum-bia River basalt unit to pumping-induced water-level declines is largely controlled by features of the physical geometry of the basalt lava flows that limit the influx of water into the unit.