Rafael Flores Senior Vice President & Chief Nuclear Officer rafaet.flores@ luminant.com Luminant Power P0 Box 1002 6322 North FM 56 Glen Rose, TX 76043 Luminant T 254.897.5590 F 254.897.6652 C 817.559.0403 CP-201000930 Log # TXNB-10052 Ref. # 10 CFR 52 July 16, 2010 U. S. Nuclear Regulatory Commission Document Control Desk Washington, DC 20555 ATTN: David B. Matthews, Director Division of New Reactor Licensing SUBJECT: COMANCHE PEAK NUCLEAR POWER PLANT, UNITS 3 AND 4 DOCKET NUMBERS 52-034 AND 52-035 RESPONSE TO REQUEST FOR ADDITIONAL INFORMATION NO. 4308, 4309, 4310, AND 4311 Dear Sir: Luminant Generation Company LLC (Luminant) submits herein the response to Request for Additional Information (RAI) No. 4308, 4309, 4310, and 4311 for the Combined License Application (COLA) for Comanche Peak Nuclear Power Plant Units 3 and 4. RAI No. 4309 and 4310 involve flooding, while RAI No. 4308 involves surface hydrology and RAI No. 4311 involves potential dam failures. The attachments and marked-up COLA pages referenced in the response are included on the enclosed CD sorted by RAI number. Should you have any questions regarding these responses, please contact Don Woodlan (254-897-6887, [email protected]) or me. There are no commitments in this letter. I state under penalty of perjury that the foregoing is true and correct. Executed on July 16, 2010. Sincerely, Luminant Generation Company LLC Rafael Flores Attachments: 1. Response to Request for Additional Information No. 4308 (CP RAI #138) 2. Response to Request for Additional Information No. 4309 (CP RAI #139) 3. Response to Request for Additional Information No. 4310 (CP RAI #143) 4. Response to Request for Additional Information No. 4311 (CP RAI #140) 5. Electronic Files Included on the Enclosed CD ux~c Ai~O
Transcript
Rafael FloresSenior Vice President &Chief Nuclear Officerrafaet.flores@ luminant.com
Luminant PowerP0 Box 10026322 North FM 56Glen Rose, TX 76043
U. S. Nuclear Regulatory CommissionDocument Control DeskWashington, DC 20555ATTN: David B. Matthews, Director
Division of New Reactor Licensing
SUBJECT: COMANCHE PEAK NUCLEAR POWER PLANT, UNITS 3 AND 4DOCKET NUMBERS 52-034 AND 52-035RESPONSE TO REQUEST FOR ADDITIONAL INFORMATION NO. 4308, 4309, 4310,AND 4311
Dear Sir:
Luminant Generation Company LLC (Luminant) submits herein the response to Request for AdditionalInformation (RAI) No. 4308, 4309, 4310, and 4311 for the Combined License Application (COLA) forComanche Peak Nuclear Power Plant Units 3 and 4. RAI No. 4309 and 4310 involve flooding, whileRAI No. 4308 involves surface hydrology and RAI No. 4311 involves potential dam failures. Theattachments and marked-up COLA pages referenced in the response are included on the enclosed CDsorted by RAI number.
Should you have any questions regarding these responses, please contact Don Woodlan (254-897-6887,[email protected]) or me.
There are no commitments in this letter.
I state under penalty of perjury that the foregoing is true and correct.
Executed on July 16, 2010.
Sincerely,
Luminant Generation Company LLC
Rafael Flores
Attachments: 1. Response to Request for Additional Information No. 4308 (CP RAI #138)
2. Response to Request for Additional Information No. 4309 (CP RAI #139)
3. Response to Request for Additional Information No. 4310 (CP RAI #143)
4. Response to Request for Additional Information No. 4311 (CP RAI #140)
5. Electronic Files Included on the Enclosed CD ux~cAi~O
U. S. NucLear Regutatory CommissionCP-201000930TXNB-100527/16/2010Page 2 of 2
U. S. Nuclear Regulatory CommissionCP-201000930TXNB-100527/16/2010
Attachment 1
Response to Request for Additional Information No. 4308 (CP RAI #138)
U. S. Nuclear Regulatory CommissionCP-201000930TXNB-100527/16/2010Attachment 1Page 1 of 7
RESPONSE TO REQUEST FOR ADDITIONAL INFORMATION
Comanche Peak, Units 3 and 4
Luminant Generation Company LLC
Docket Nos. 52-034 and 52-035
RAI NO.: 4308 (CP RAI #138)
SRP SECTION: 02.04.01 - Hydrologic Description
QUESTIONS for Hydrologic Engineering Branch (RHEB)
DATE OF RAI ISSUE: 2/18/2010
QUESTION NO.: 02.04.01-6
NUREG-0800, Standard Review Plan (SRP), Section 2.4.1, 'Hydrologic Description,' establishes criteriathat Staff intends to use to evaluate whether an Applicant meets the NRC's regulations.
By letter dated October 1, 2009, the NRC staff issued RAI 3663 (RAI 101) Question No. 14240 (02.04.01 -1), where the applicant was asked "provide a description of the process followed to determine how theproposed plant interfaces with the hydrosphere, including determinations of the hydrologic causalmechanisms that may require special plant design basis, current and future surface water uses byComanche Peak Nuclear Power Plant (CPNPP), Units 3 and 4 and other users, conceptual models usedto establish bounding hydrologic conditions, and conceptual models used to quantify uncertainty inhydrological processes and conditions at the site.
The applicant responded in document CP-200901564-Log No TXNB-09067 (ML093230705),dated November 13, 2009. In its response, the applicant stated that it had interpreted the NRC staff'sremarks during an October 16, 2009 conference call to mean that the staff was not interested in theapplicant's "plan or approach" to the determination of hydrosphere-plant interface or hydrologic causalmechanisms. Additionally, the applicant stated that during this conference call the NRC staff did notrequest a summary of the applicant's administrative approach or plan.
The NRC staff reviewed the Comanche Peak Updated Tracking Report, Revision 4 of the FSAR, datedSeptember 2, 2009 and referenced in the applicant's response. The NRC staff determined that theapplicant has provided additional detail and descriptions of basin hydrology and geomorphology. Thestaff noted that the quantitative hydrologic data and information are sufficient, but still lack the conceptualand logical linkage necessary to make safety determination. It is the organization of this information anddata, with the addition of conceptual model and causal mechanism definitions, into a concise andsequenced scoping discussion that are absent in the FSAR and needed to satisfy the requirementsstipulated in this RAI.
In order to make its safety determination, the NRC staff requests a description that provides assurancethat the process followed to determine the interaction of the proposed plant with the hydrosphere andhydrologic causal mechanisms was captured in a conceptual and logical analysis, and that the applicant
U. S. Nuclear Regulatory CommissionCP-201000930TXNB-100527/16/2010Attachment 1Page 2 of 7
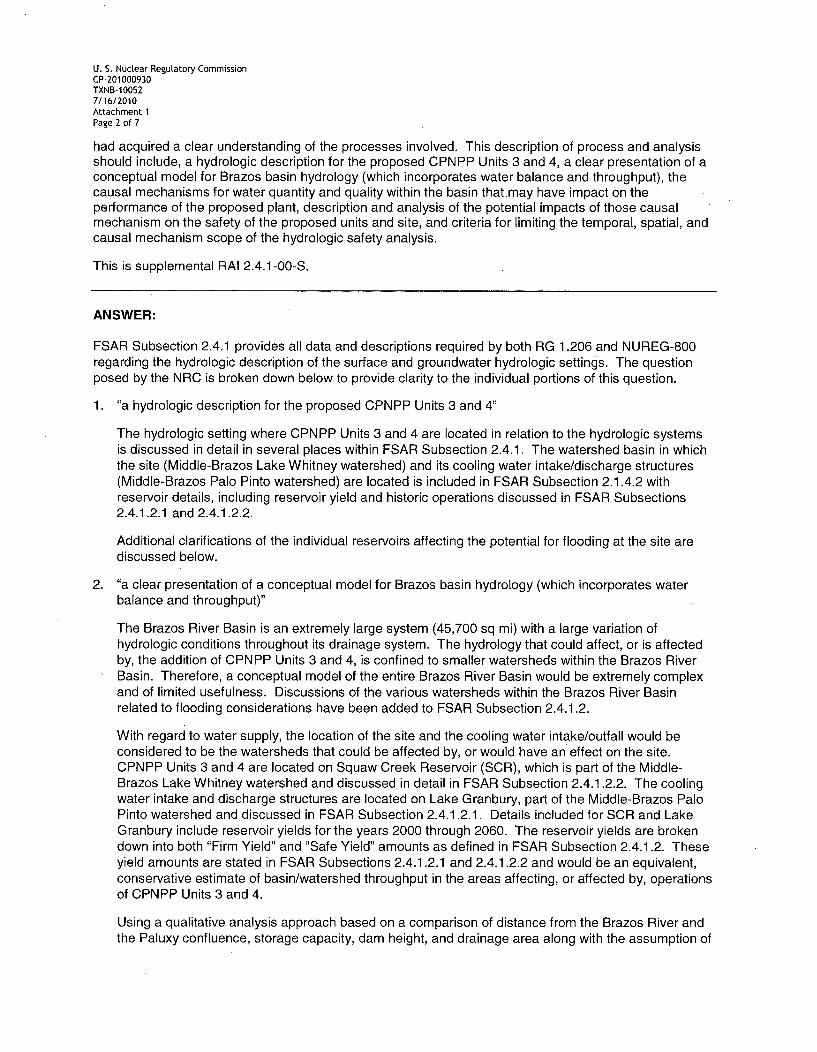
had acquired a clear understanding of the processes involved. This description of process and analysisshould include, a hydrologic description for the proposed CPNPP Units 3 and 4, a clear presentation of aconceptual model for Brazos basin hydrology (which incorporates water balance and throughput), thecausal mechanisms for water quantity and quality within the basin that.may have impact on theperformance of the proposed plant, description and analysis of the potential impacts of those causalmechanism on the safety of the proposed units and site, and criteria for limiting the temporal, spatial, andcausal mechanism scope of the hydrologic safety analysis.
This is supplemental RAI 2.4.1-00-S.
ANSWER:
FSAR Subsection 2.4.1 provides all data and descriptions required by both RG 1.206 and NUREG-800regarding the hydrologic description of the surface and groundwater hydrologic settings. The questionposed by the NRC is broken down below to provide clarity to the individual portions of this question.
1. "a hydrologic description for the proposed CPNPP Units 3 and 4"
The hydrologic setting where CPNPP Units 3 and 4 are located in relation to the hydrologic systemsis discussed in detail in several places within FSAR Subsection 2.4.1. The watershed basin in whichthe site (Middle-Brazos Lake Whitney watershed) and its cooling water intake/discharge structures(Middle-Brazos Palo Pinto watershed) are located is included in FSAR Subsection 2.1.4.2 withreservoir details, including reservoir yield and historic operations discussed in FSAR Subsections2.4.1.2.1 and 2.4.1.2.2.
Additional clarifications of the individual reservoirs affecting the potential for flooding at the site arediscussed below.
2. "a clear presentation of a conceptual model for Brazos basin hydrology (which incorporates waterbalance and throughput)"
The Brazos River Basin is an extremely large system (45,700 sq mi) with a large variation ofhydrologic conditions throughout its drainage system. The hydrology that could affect, or is affectedby, the addition of CPNPP Units 3 and 4, is confined to smaller watersheds within the Brazos RiverBasin. Therefore, a conceptual model of the entire Brazos River Basin would be extremely complexand of limited usefulness. Discussions of the various watersheds within the Brazos River Basinrelated to flooding considerations have been added to FSAR Subsection 2.4.1.2.
With regard to water supply, the location of the site and the cooling water intake/outfall would beconsidered to be the watersheds that could be affected by, or would have an effect on the site.CPNPP Units 3 and 4 are located on Squaw Creek Reservoir (SCR), which is part of the Middle-Brazos Lake Whitney watershed and discussed in detail in FSAR Subsection 2.4.1.2.2. The coolingwater intake and discharge structures are located on Lake Granbury, part of the Middle-Brazos PaloPinto watershed and discussed in FSAR Subsection 2.4.1.2.1. Details included for SCR and LakeGranbury include reservoir yields for the years 2000 through 2060. The reservoir yields are brokendown into both "Firm Yield" and "Safe Yield" amounts as defined in FSAR Subsection 2.4.1.2. Theseyield amounts are stated in FSAR Subsections 2.4.1.2.1 and 2.4.1.2.2 and would be an equivalent,conservative estimate of basin/watershed throughput in the areas affecting, or affected by, operationsof CPNPP Units 3 and 4.
Using a qualitative analysis approach based on a comparison of distance from the Brazos River andthe Paluxy confluence, storage capacity, dam height, and drainage area along with the assumption of
U. S. Nuclear Regulatory CommissionCP-201000930TXNB-100527/16/2010Attachment 1Page 3 of 7
transposition of resulting dam failure effects without attenuation, it was determined that the controllingdam failure scenario would include domino-failure of Morris Sheppard Dam and De Cordova BendDam. Upstream of Morris Sheppard Dam, the significant dams are located on individual tributaries.Using the qualitative approach, Hubbard Creek Dam was determined to be the controlling dam failurescenario upstream of Morris Sheppard Dam. However, considering future conditions, the domino-failure of Fort Phantom Hill Dam and the proposed Cedar Ridge Reservoir Dam, along with thesimultaneous failure of Lake Stamford Dam, was determined to be the controlling dam failurescenario upstream of Morris Sheppard Dam. By quantitative analysis, it was determined that futureconditions provide the controlling dam failure scenario. A complete description of the qualitative andquantitative analyses is provided in FSAR Subsection 2.4.4.
3. "the causal mechanisms for water quantity and quality within the basin that may have impact on theperformance of the proposed plant"
Water quantity and quality may have an impact on performance of the proposed plant; however,FSAR Subsection 2.4.1 is concerned with elements of the hydrosphere which have an effect on thesafety of the plant and the public. Discussions addressing safety-related flooding at the site havebeen added to FSAR Subsections 2.4.1.1, 2.4.1.2, and 2.4.1.2.2. Discussions of the variouswatersheds within the Brazos River Basin related to flooding considerations have been added toFSAR Subsection 2.4.1.2.
Water quantity descriptions are discussed in FSAR Subsection 2.4.1.2.4 and listed in FSARTables 2.4-206 through 2.4-208.
The causal mechanisms considered for flooding are precipitation, dam failures, ice effects, andflooding generated from the Gulf of Mexico. Precipitation flooding for the watershed above the site isevaluated in FSAR Subsection 2.4.4. Dam failure flooding is also considered in the evaluation forexisting and future conditions. Dam failures are considered coincident with probable maximumflooding to maximize the effects of precipitation and dam failures combined. In addition, coincidentwind wave activity is included to maximize resulting flood levels. Flooding from ice effects areconsidered in FSAR Subsection 2.4.7. Ocean surge and tsunami from the Gulf of Mexico areconsidered in FSAR Subsections 2.4.5 and 2.4.6.
Surface and groundwater quality is discussed in detail in Environmental Report Subsection 2.3.3.Reference to the overall poor quality of the surface water (slightly saline) in the vicinity of theproposed plant and plant support systems (cooling water) is mentioned in FSAR Subsection2.4.1.2.4. Additionally, FSAR Subsection 2.4.11.1 states "... there are no safety-related facilities thatcould be affected by low-f low or drought conditions, since the UHS does not rely on the rivers andstreams as a source of water;" therefore, the quantity and quality of water available for plantoperations and performance is independent of the safety-related requirements of the proposed plant.
4. "description and analysis of the potential impacts of those causal mechanism on the safety of theproposed units and site"
No surface water use or mechanism, other than those described in the flooding portions of FSAR,have the potential to adversely affect the safety of the proposed plant. Discussions of causalmechanisms for flooding have been added to FSAR Subsections 2.4.1.1, 2.4.1.2, and 2.4.1.2.2, andare described in detail in FSAR Subsections 2.4.2 through 2.4.10.
As stated in FSAR Subsection 2.4.1.2.3.2; "There is no safety-related equipment in the CirculatingWater System, nor does loss of its normal operating capability adversely affect any safety-relatedcomponents."
U. S. Nuctear Regutatory CommissionCP-201000930TXNB-100527/16/2010Attachment 1Page 4 of 7
5. "criteria for limiting the temporal, spatial, and causal mechanism scope of the hydrologic safetyanalysis"
Discussions addressing the process for limiting the scope of the safety analysis (flooding portions)hdve been added to FSAR Subsections 2.4.1.1, 2.4.1.2, and 2.4.1.2.2. The only hydrologicmechanism considered to have a potential affect on the safety-related features of the proposed plantis flooding, which is described in the added discussions to FSAR Subsections 2.4.1.1, 2.4.1.2, and2.4.1.2.2. Groundwater will be discussed in the response to RAI No.4314 (CP RAI #147)
Reference
Brazos River Authority, The Texas Clean Rivers Program 2009 Basin Highlights Report, Website,http://www.brazos.org/crpHistoricalReports.asp, accessed May 26, 2010. /
Attachment
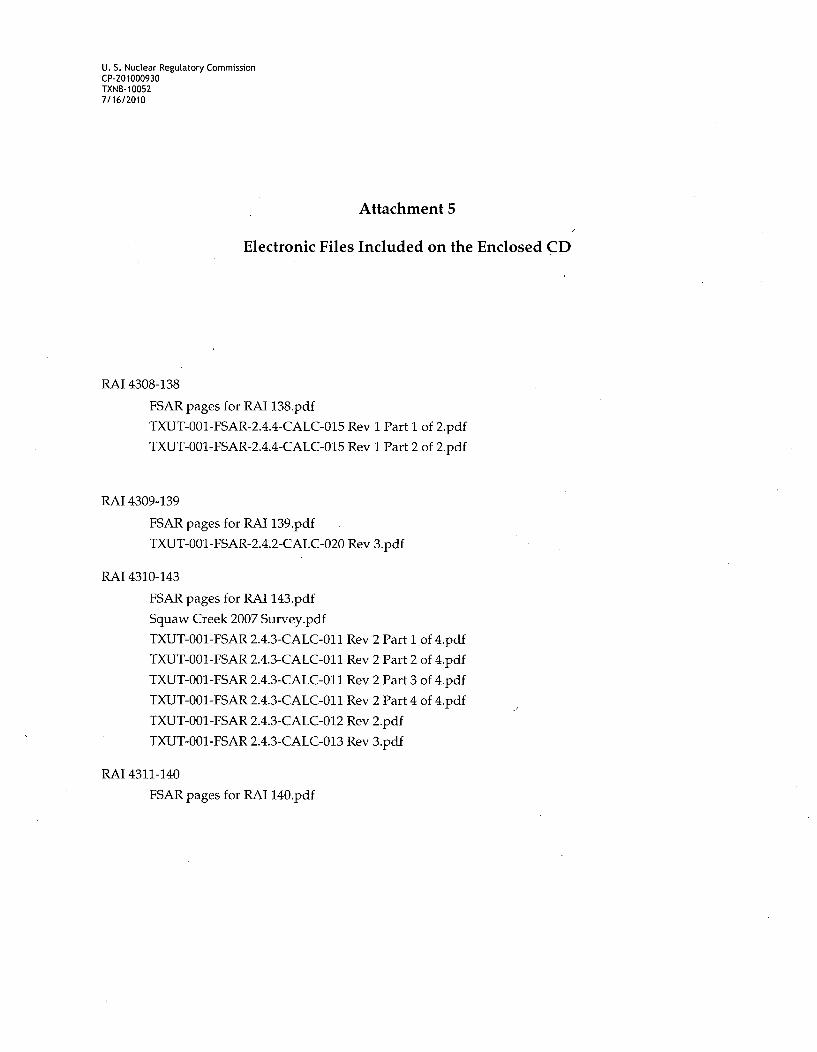
TXUT-001 -FSAR-2.4.4-CALC-01 5 Rev 1, Brazos River Dam Failures Analysis for Comanche PeakNuclear Power Plant Units 3 and 4 (on CD).
Impact on R-COLA
See attached marked-up FSAR Revision 1 pages 2.4-3, 2.4-4, 2.4-5, 2.4-6, 2.4-7, 2.4-12, and 2.4-83(on CD).
Impact on S-COLA
None.
Impact on DCD
None.
U. S. Nuclear Regulatory CommissionCP-201000930TXNB-100527/16/2010Attachment 1Page 5 of 7
RESPONSE TO REQUEST FOR ADDITIONAL INFORMATION
Comanche Peak, Units 3 and 4
Luminant Generation Company LLC
Docket Nos. 52-034 and 52-035
RAI NO.: 4308 (CP RAI #138)
SRP SECTION: 02.04.01 - Hydrologic Description
QUESTIONS for Hydrologic Engineering Branch (RHEB)
DATE OF RAI ISSUE: 2/18/2010
QUESTION NO.: 02.04.01-7
NUREG-0800, Standard Review Plan (SRP), Section 2.4.1, Hydrologic Description,' establishes criteriathat Staff intends to use to evaluate whether an Applicant meets the NRC's regulations.
By letter dated October 1,2009, the NRC staff issued RAI 3663 (RAI 101) Question Number 14244(02.04.01-5), where the applicant was asked "Provide a description of all existing and proposed reservoirswithin the Brazos River Basin and discuss their significance in terms of the design basis flood analysis."
The applicant responded in document CP-200901564-Log No TXNB-09067 (ML093230705),dated November 13, 2009, indicating that the metric used to classify existing reservoirs for inclusion werethe distance from the Brazos-Paluxy confluence and storage volume. The response noted that theproposed South Bend Reservoir would have more than twice the storage of the Hubbard Creek Dam andbe closer to the Brazos-Paluxy confluence than existing reservoirs included in the dam break analysis.The applicant, in its response, cited water quality issues, permitting challenges and the omission of theproject from Brazos G water planning as reasons for omitting the South Bend project from the dam breakanalysis.
The NRC staff noted that water needs, permitting challenges, and likelihood of development are allsubject to change, given the potential serious impact that development of the South Bend project wouldhave on the flooding scenario.
The NRC staff also noted that the two water storage reservoir metrics (distance form the Brazos-Paluxyconfluence and storage volume) are not inherent indicators of the impact of dam failure on the safety ofthe plant site.
In order to make its safety determination, the NRC staff requests the following information.1. The applicant revise the dam break analysis to include failure of a dam impounding the South
Bend reservoir.
2. The FSAR should include description of how (meaning the physical mechanisms) water storagereservoir metrics impact plant safety from flooding and how the quantitative thresholds for the
U. S. Nuclear Regulatory CommissionCP-201000930TXNB-100527/16/2010Attachment 1Page 6 of 7
metrics (for example, greater than 150 miles upstream or greater than 100,00 acre-feet ofstorage) establish the analysis as bounding conservative in terms of the design basis flood.
This is supplemental RAI 2.4.1-04-S.
ANSWER:
1 . During a public conference call on April 20, 2010, representatives from the Brazos River Authority ofTexas described their characterization of the potential source of surface water known as South BendReservoir. In the 1940's and 1950's, Texas authorities assessed the potential sources for surfacewater in the state of Texas, including the Brazos River and the rivers and streams that feed theBrazos. Numerous potential sites were identified, including the potential site referred to as SouthBend Reservoir. These potential sites were identified to assess the potential sources forsurfacewater in the Brazos River Basin. While the potential site called the South Bend Reservoir has beenidentified for over 60 years, no design work has been performed; no budgets have been allotted tostart the design, procure the necessary property or execute any type of construction activity; and noother development work has begun. In Texas, plans to develop water projects are updated every fiveyears and the current plan is through the year 2060. The current plans identify no intentions oractions to develop the potential site known as South Bend Reservoir.
As such, the potential site known as South Bend Reservoir is not a proposed reservoir and per NRCRG 1.206, only actual or proposed features need to be included in the dam break analysis. FSARSubsections 2.4.1 and 2.4.4 have been revised to clarify this point. The dam break analysis (TXUT-001 -FSAR-2.4.4-CALC-01 5) has been revised to address other issues identified by the NRC, butdoes not include the potential site known as South Bend Reservoir. The revised analysis wasattached to the response to Question 02.04.01-6 above.
2. The qualitative dam failure analysis is performed based on a comparison of the distance from theconfluence of the Brazos and the Paluxy Rivers, storage capacity, dam height, and drainage area forthe dam in the Brazos River watershed. Domino-type failures and simultaneous failures arepostulated when applicable. Dam failures are assumed coincident with the PMF. The qualitativeanalysis considers both existing and future conditions.
Because the qualitative analysis compares the metrics for the dams directly to each other todetermine a controlling scenario, there are no specific thresholds for the metrics. Under theassumption that dam failure effects are transposed downstream without attenuation, it wasdetermined that the controlling dam failure scenario for existing conditions is the domino-type damfailure of Hubbard Creek Dam, Morris Sheppard Dam, and De Cordova Bend Dam. The controllingdam failure scenario for future conditions was determined to be the domino-type failure of FortPhantom Hill Dam, the proposed Cedar Ridge Reservoir Dam, Morris Sheppard Dam, and DeCordova Bend Dam. In addition, Lake Stamford Dam was assumed to fail simultaneously with theproposed Cedar Ridge Reservoir Dam. No qualitative distinction could be made between the twopotential scenarios. Quantitative analysis was performed for both potential scenarios to determinethat the potential dam failure scenario for future conditions is the controlling scenario.
A detailed description of the qualitative analysis is provided in the response to RAI No. 4311 (CP RAI#140) Question 02.04.04-5. The quantitative dam failure analysis incorporating the outcome from thequalitative analysis has been revised to address inclusion of wind setup and is discussed in theresponse to CP RAI #140 Question 02.04.04-6. Additionally, the quantitative analysis has beenrevised to address the antecedent reservoir elevation and is discussed along with the combinedeffects from upstream dam failures in the response to CP RAI #140 Question 02.04.04-7.
U. S. Nuctear Regulatory CommissionCP-201000930TXNB-100527/16/2010Attachment 1Page 7 of 7
Reference
TXUT-001 -FSAR-2.4.4-CALC-01 5, Brazos River Dam Failures Analysis for Comanche Peak NuclearPower Plant Units 3 and 4, Revision 1.
Impact on R-COLA
See attached marked-up FSAR Revision 1 pages 2.4-8 and 2.4-9 (on CD).
Impact on S-COLA
None.
Impact on DCD
None.
U. S. Nuctear Regutatory CommissionCP-201000930TXNB-100527/16/2010
Attachment 2
Response to Request for Additional Information No. 4309 (CP RAI #139)
U. S. Nuclear Regulatory CommissionCP-201000930TXNB-100527/16/2010Attachment 2Page I of 2
RESPONSE TO REQUEST FOR ADDITIONAL INFORMATION
Comanche Peak, Units 3 and 4
Luminant Generation Company LLC
Docket Nos. 52-034 and 52-035
RAI NO.: 4309 (CP RAI #139)
SRP SECTION: 02.04.02 - Floods
QUESTIONS for Hydrologic Engineering Branch (RHEB)
DATE OF RAI ISSUE: 2/18/2010
QUESTION NO.: 02.04.02-2
NUREG-0800, Standard Review Plan, Section 2.4.2, 'Floods,' establishes criteria that Staff intends to useto evaluate whether an applicant meets the NRC's regulations.
By letter dated October 1, 2009, the NRC staff issued RAI ID 3664 (RAI 102) Question Number 14245(02.04.02-1), in which the NRC staff asked "In order to determine the safety of structures, systems, andcomponents (SSCs) with respect to floods, Luminant is requested to state explicitly in the COL FSAR thewater surface elevation and associated flow rate for the design basis flood (DBF) at the site, and describeall assumptions used in determining the DBF from the flooding scenarios detailed in FSAR Sections 2.4.3through 2.4.9. Provide a rationale and describe the process used to determine that the stated DBF isbounding conservative, with respect to all permutations of stream, local precipitation, dam failurescenarios, tsunami, surge, seiche, and wind/wave coincidence."
The applicant responded in document CP-200901564-Log No TXNB-09067-(ML093230704) executed onNovember 13, 2009. the NRC staff has reviewed this response and the revisions included in FSARUpdated Tracking Report No. 4 referenced in the response, and has determined that additionalinformation is needed in order to complete its review.
The NRC staff determined that the applicant has clarified the design basis flood elevations and causalmechanisms for the scenario that the applicant included in the safety analysis. However, the applicanthas not explained in its response why this scenario, with its multiple simplifying assumptions,computations, and omission of existing and proposed upstream reservoirs, is bounding conservative withrespect to all other scenarios. As an example, the Staff noted that the water elevation below SquawCreek Dam is computed using an equation for uniform flow at the Brazos-Paluxy confluence, but there isno explanation of why this assumption of uniform flow is bounding and conservative. Other assumptionsinclude the absence of wind setup on reservoirs included in the domino failure scenario, the selection aconstant loss rate for infiltration rate in watershed runoff modeling, and dismissal of the possibility ofsurge and seiche flooding in the analysis. While the likelihood of these factors contributing to a design-basis flood is addressed in other RAIs (and remains unresolved after the NRC staff's review of the RAIresponses), the argument for the conservative and bounding nature of the applicant's scenarioincorporating all of these assumptions and computations needs to be proffered in FSAR Section 2.4.2.
U. S. Nuclear Regulatory CommissionCP-201000930TXNB-100527/16/2010Attachment 2Page 2 of 2
In order to make its safety determinations, the NRC staff requests the applicant provide a cleardescription and justification of the conservatism and incorporation of the unaccounted for parameters andfactors in the analysis for the determination of design basis flood.
This is supplemental RAI 2.4.2-00-S.
ANSWER:
The argument for the conservative and bounding nature of the probable maximum flood (PMF) analysishas been added to FSAR Subsections 2.4.2.2 and 2.4.2.3. The conservative nature of the approach tothe analyses of the effects of local intense precipitation, Squaw Creek Reservoir (SCR) flooding, BrazosRiver flooding, and coincident wind wave activity are discussed.
The analysis of the effects of local intense precipitation has been revised to account for the increasedPMF elevation at SCR as described in the response to RAI No. 4310 (CP RAI #143) Question 02.04.03-5.In addition, the weir discharge coefficient used in the analysis has been reduced to reflect a moreconservative approach.
Attachment
TXUT-001 -FSAR-2.4.2-CALC-020, Rev 3, Analysis of the Effects of Local Intense Precipitation at theComanche Peak Nuclear Power Plant Units 3 and.4 (on CD)
Impact on R-COLA
See attached marked-up FSAR Revision 1 pages 2.0-10, 2.4-15, 2.4-16, 2.4-17, 2.4-19, 2.4-20, 2.4-21,and 2.4-111 (on CD).
Impact on S-COLA
None.
Impact on DCD
None.
U. S. Nuclear Regulatory CommissionCP-201000930TXNB-100527/16/2010
Attachment 3
Response to Request for Additional Information No. 4310 (CP RAI #143)
U. S. Nuclear Regulatory CommissionCP-201000930TXNB-100527/16/2010Attachment 3Page 1 of 27
RESPONSE TO REQUEST FOR ADDITIONAL INFORMATION
Comanche Peak, Units 3 and 4
Luminant Generation Company LLC
Docket Nos. 52-034 and 52-035
RAI NO.: 4310 (CP RAI #143)
SRP SECTION: 02.04.03 - Probable Maximum Flood (PMF) on Streams and Rivers
QUESTIONS for Hydrologic Engineering Branch (RHEB)
DATE OF RAI ISSUE: 2/24/2010
QUESTION NO.: 02.04.03-5
NUREG-0800, Standard Review Plan (SRP), Section 2.4.3, 'Probable Maximum Flood (PMF) on Streamsand Rivers,' establishes criteria that the NRC staff intends to use to evaluate whether an applicant meetsthe NRC's regulations.
On October 1,2009, the NRC staff issued RAI ID 3665 (RAI Number 105) Question Number 14246(02.04.03-1), in which the NRC staff asked "Provide a description of the process used to determine thatthe probable maximum flood (PMF) analysis for streams and rivers is the most conservative of allplausible conceptual models. This description needs to consider the parameter selections andassumptions made in watershed probable maximum precipitation (PMP) estimation, watershed runoffmodeling, channel routing and runoff accumulation modeling, and local site drainage and runoffmodeling."
The applicant responded in document CP-200901564-Log No TXNB-09067-(ML093230704) executed onNovember 13, 2009. The NRC staff has reviewed the response the combined license application (COL)FSAR changes documented in FSAR Updated Tracking Report (UTR) No. 4 and referenced in theapplicant's response, and has determined that additional information is needed to complete the NRCstaff's review.
The applicant asserts, without explanation, that the conceptual models used to determine the designbasis flood comply with Regulatory Guides 1.206 and 1.59. The response also asserts, withoutexplanation, that the river and stream flooding computational methodology is consistent with AmericanNational Standards Institute / American Nuclear Society ANSI/ANS-2.8-1992. The staff noted that claimsof compliance and consistency with these guidance documents alone do not ensure that the parameterselections or application of the method to specific sites produce a bounding conservative estimate of thedesign basis flood.
The NRC staff notes that the applicant's response that widespread use of Snyder's method or theavailability of Snyder's method in HEC-HMS modeling software ensures that the use of Snyder's methodproduces a bounding conservative estimate of runoff is not acceptable. The applicant's response alsoincluded assertions that the chosen parameterization yielded a conservative estimate; however, this is not
U. S. Nuclear Regulatory CommissionCP-201000930TXNB-100527/16/2010Attachment 3Page 2 of 27
sufficient to show that the chosen parameterization is bounding conservative with respect to all otherparameterizations.
In order to make its safety determination, the NRC staff requests the applicant revise the response andprovide the technical justifications. The response should focus on the basis used to accept as boundingconservative the chain of models that translates PMP estimates to runoff estimates to Squaw CreekReservoir spillage to design basis flood elevation. That basis should include detailed deductivestatements that establish the chosen parameterizations (e.g., Snyder's unit hydrograph; a constant ratherthan variable loss coefficient) and the choice of parameter values (e.g., values of peaking and lagcoefficients; a loss coefficient of 0.10 inch per hour rather than 0.05 inch//hour) as yielding a boundingconservative estimate for the design basis flood elevation.
This is supplemental RAI 2.4.3-00-S.
ANSWER:.
The elevations provided below are referenced to the National Geodetic Vertical Datum of 1929 (NGVD29), unless noted otherwise. The plant site grading plan is referenced to the North American VerticalDatum of 1988 (NAVD 88). According to the National Geodetic Survey, the datum shift of NAVD 88minus NGVD 29 is equal to between 0 and +20 cm for the site. Therefore, it is conservative to accountfor a maximum conversion of +20 cm (0.66 ft) when comparing water surface elevations determined usingNGVD 29 to elevations at the site in NAVD 88. Considering conversion, SCR water surface elevation of793.66 ft NAVD 88 is well below the CPNPP Units 3 and 4 safety-related structures elevation of 822 ftNAVD 88.
The PMP analysis has been revised to maximize the effects of flooding for the sub basin watershedabove Squaw Creek Dam. With reference to FSAR Figure 2.4.3-202, the PMP for Basin 1 has beenrevised using HMR 52 software to determine the maximum rainfall considering only the area of Basin 1.This is conservative because considering the smaller watershed of the basin results in higher PMP andrunoff estimates to the reservoir. The critical storm center is found to be near the centroid of the SquawCreek watershed. The critical 72-hour storm PMP rainfall total is 42.53 in. The critical storm area is100 sq mi and the orientation is 145 degrees. The critical temporal distribution is determined to be a two-thirds peaking arrangement.
For the portion of the Squaw Creek watershed below the Squaw Creek Dam, Basin 2, the PMP has notchanged. For the Paluxy River watershed, Basin 3 and Basin 4, the PMP has not changed. However,the critical temporal distribution of the 72-hour rainfall has been revised to be a center peakingarrangement. It is conservative to include additional flooding for the Squaw Creek watershed below theSquaw Creek Dam and for the Paluxy River, because maximized PMP for the Squaw Creek watershedabove Squaw Creek Dam would not occur coincidentally with maximized PMP for the overall SquawCreek and Paluxy River watershed. The inclusion of downstream flooding maximizes the potential foreffects of a high tailwater at the Squaw Creek Dam.
The PMP storm is preceded with an antecedent storm equal to 40 percent of the PMP and a three-daydry period. The PMF analysis using HEC-HMS software has been revised to assume no precipitationlosses occur. In addition to the assumption of no initial losses, the PMF analysis has been revised toassume no losses occur for the duration of the modeled events. This includes both the antecedent stormand the PMP storm. This is a conservative assumption in that all rainfall is transformed to runoff.
The Snyder's unit hydrograph method, based on the guidance provided in Hydrology and Flood PlainAnalysis, remains the chosen method for the PMF analysis to transform rainfall to runoff.
U. S. Nuclear Regulatory CommissionCP-201000930TXNB-100527/16/2010Attachment 3Page 3 of 27
Qp = 640Cp A/tp
where:
Qp = peak discharge of the unit hydrograph (cfs)
CP = Peaking coefficient ranging from 0.4 to 0.8.
A = Drainage area (sq mi)
tp = Basin Lag (hr)
The lag time for Snyder's method is defined as tp = Ct (LLca)°0 3
where:
Ct = coefficient usually ranging from 1.8 to 2.2 (Ct has found to vary from 0.4 in mountainous areasto 8.0 along the Gulf of Mexico)
L = Length of the main stream from the outlet to divide (mi)
Lca = Length along the main stream to a point nearest the watershed centroid (mi)
However, to provide a conservative estimate of the watershed unit hydrographs, the effects of nonlinearbasin response are considered by increasing the peak of the unit hydrograph by 20 percent, based onguidance in the Handbook of Hydrology.
The physically measureable parameters of the Snyder's unit hydrograph are based on the existing study.The basin areas are confirmed using USGS quadrangle topography. The length of the main stream andlength along the stream to a point nearest the watershed centroid are calculated and compared to theparameters from the existing study. The smaller value is used for the PMF analysis. Using a shorterlength is conservative, because it maximizes the unit hydrograph peak runoff.
The largest peaking coefficient, Cp = 0.8, and the smallest lag time coefficient, Ct = 0.4, are used togenerated the unit hydrograph. The largest peaking coefficient and the smallest lag time coefficient areconservative because they maximize the unit hydrograph peak runoff.
The shape of the unit hydrograph for each sub basin is determined using the methods in Hydrology andFlood Plain Analysis and the calculated or selected conservative parameters. The peak of each unithydrograph is increased by 20 percent. The ordinates of each unit hydrograph are then adjusted tomaintain the unit hydrograph characteristic of 1 in of runoff.
Base flow has been revised as discussed in the response to Question 02.04.03-10 below to account forthe highest average monthly flow of 46 cfs. Based on the guidance of ANSI/ANS-2.8-1992, it isappropriate to use the average monthly flow. The estimate is conservative because the largest averagemonthly flow is selected.
The revised stage-storage-discharge relationship for SCR is discussed and presented in the response toQuestion 02.04.03-6 below. The revised stage-storage-discharge relationship utilizes conservativecoefficients and assumes the water surface elevation on the downstream face of the Squaw Creek Damsubmerges the service spillway crest by 1 ft. This is a conservative assumption because the revisedbackwater analysis indicates the tailwater would be below the crest of the service spillway.
The backwater analysis is revised incorporating the water surface elevation at the confluence of theBrazos River and Paluxy River. As discussed in the response to RAI No. 4311 (CP RAI #140) Question02.04.04-7, the water surface elevation at the confluence is 760.05 ft, and is based on the inclusion of thetransposed dam failure analysis flow and the peak flows from the flow hydrographs for each basin in the
U. S. Nuclear Regulatory CommissionCP-201000930TXNB-100527/16/2010Attachment 3Page 4 of 27
HEC-HMS model. This is a conservative approach by assuming multiple PMF events occur coincidentallywith all peak flows combined.
The backwater analysis is performed using unsteady state conditions and the complete flow hydrographsfor each basin in the HEC-HMS model along with a constant elevation hydrograph for the confluence atthe Brazos River. The maximum tailwater on the downstream face of the dam is determined to be760.39 ft. The tailwater elevation is well below the service spillway crest elevation of 775 ft. and theemergency spillway crest elevation of 783 ft.
The PMF analysis using HEC-HMS software is revised to account for the revised precipitation, the revisedprecipitation loss characteristics, the revised unit hydrographs, the revised baseflow, and the revisedstage-storage-discharge relationship, as previously discussed. The resulting peak inflow to SCR is319,000 cfs. The routed peak discharge from SCR is 206,000 cfs. The resulting water surface elevationis 793.00 ft.
The maximum backwater flow from the HEC-RAS unsteady state model at the downstream face ofSquaw Creek Dam is 100,440 cfs. As previously discussed, the downstream conditions do not affectSCR water surface elevation.
Revisions to the coincident wind wave activity analysis are discussed in the response to Question02.04.03-11 below.
References
U.S. Army Corps of Engineers, Hydrologic Engineering Center, Generalized Computer Program, HMR52,Probable Maximum Storm, Revised April 1991.
U.S. Army Corps of Engineers, Hydrologic Engineering Center, Hydrologic Modeling System, HEC-HMScomputer software, Version 3.4.
Bedient P.B., Huber W.C., "Hydrology and Flood Plain Analysis, Third Edition", Prentice Hall UpperSaddle River, NJ07458, 2002.
Maidment, D.R., "Handbook of Hydrology," McGraw-Hill, 1993.
Texas Utilities Services Inc., Comanche Peak Stream Electric Station CPSES 1980-1982, Units 1 and 2,"Safe Shutdown Impoundment Dam, Design Calculations and Calculations Check", Volume 1, by Freeseand Nichols.
Texas Utilities Services Inc., Comanche Peak Stream Electric Station CPSES 1980-1982, Units 1 and 2,"Safe Shutdown Impoundment Dam, Design Calculations and Calculations Check", Volume 2, by Freeseand Nichols.
U.S. Geological Survey, Geospatial Data Gateway Website,http://datagateway.nrcs.usda.gov/gatewayhome.html, accessed December 27, 2007.
American Nuclear Society, "American National Standard for Determining Design Basis Flooding at PowerReactor Sites," ANSI/ANS-2.8-1992, July 28,1992.
U.S. Army Corps of Engineers, Hydrologic Engineering Center, River Analysis System, HEC-RAScomputer software, Version 3.1.3.
Chow, V.T., "Open Channel Hydraulics", McGraw-Hill Inc., New York, 1959.
U. S. Nuclear Regulatory CommissionCP-201000930TXNB-100527/16/2010Attachment 3Page 5 of 27
National Geodetic Survey, Website, http://www.ngs.noaa.gov/TOOLS/Vertcon/vertcon.html, accessedMay 2010.
Attachments
TXUT-001 -FSAR-2.4.3-CALC-01 1 Rev 2, Probable Maximum Precipitation Calculation for ComanchePeak Nuclear Power Plant Units 3 and 4 Using HMR 51 & MNR 52 (on CD).
TXUT-001-FSAR-2.4.3-CALC-012 Rev 2, Probable Maximum Flood Calculation for Comanche PeakNuclear Power Plant Units 3 and 4 (HEC-HMS & HEC-RAS) (on CD).
U. S. Nuclear Regulatory CommissionCP-201000930TXNB-100527/16/2010Attachment 3Page 6 of 27
RESPONSETO REQUEST FOR ADDITIONAL INFORMATION
Comanche Peak, Units 3 and 4
Luminant Generation Company LLC
Docket Nos. 52-034 and 52-035
RAI NO.: 4310 (CP RAI #143)
SRP SECTION: 02.04.03 - Probable Maximum Flood (PMF) on Streams and Rivers
QUESTIONS for Hydrologic Engineering Branch (RHEB)
DATE OF RAI ISSUE: 2/24/2010
QUESTION NO.: 02.04.03-6
NUREG-0800, Standard Review Plan (SRP), Section 2.4.3, 'Probable Maximum Flood (PMF) on Streamsand Rivers,' establishes criteria that the NRC staff intends to use to evaluate whether an Applicant meetsthe NRC's regulations.
By letter dated October 1, 2009, the NRC staff issued RAI ID 3665 (RAI Number 105) Question Number14248 (02.04,03-3), in which the NRC staff asked "Provide a rationale for assumptions made in themodeling of instream flooding and drainage for computation of the PMF on rivers and streams affectingthe site. Provide documentation and electronic versions of input files for all computer models used tocompute the river and stream flooding."
The applicant responded in document CP-200901564-Log No TXNB-09067- (ML093230704) executed onNovember 13, 2009. The applicant directed the NRC staff to the applicant's response to RAI ID 3665(RAI Number 105). The NRC staff has reviewed this RAI response and has determined that additionalinformation is needed for the staff to complete its review. The applicant's response to this RAI alsoreferred the staff to Calculation "MITS004 - Probable Maximum Flood Calculation for Comanche PeakNuclear Power Plant Units 3 and 4 (HEC-HMS & HEC-RAS)", Revision 1 and the input and output (I/O)files (FlowMaster) that were submitted previously, as part of July 2009 Hydrology Safety SiteAudit Information Need HYDSV-07, via Luminant letter TXNB-09037, dated September 2, 2009. Refer to
'NRC staff's 'Hydrology Site Safety Audit Report of the Comanche Peak Nuclear Power Plant, Units 3 and4 Combined License Application,' dated December 3, 2009. This supplemental RAI question results fromthe staff's examination of that calculation package and from examination of calculation package TXUT-001 -FSAR 2.4.3-CALC-012.
The staff noted that the Squaw Creek Dam discharge rating relationships referenced in the FSAR and inTXUT-001 -FSAR 2.4.3-CALC-01 2 are important determinants of the design basis flood elevation reportedby the applicant because they model the ability of Squaw Creek Dam to pass PMF flows from SquawCreek watershed.
Accordingly, the NRC staff requests that the applicant provide:
U. S. Nuclear Regulatory CommissionCP-201000930TXNB-100527/16/2010Attachment 3Page 7 of 27
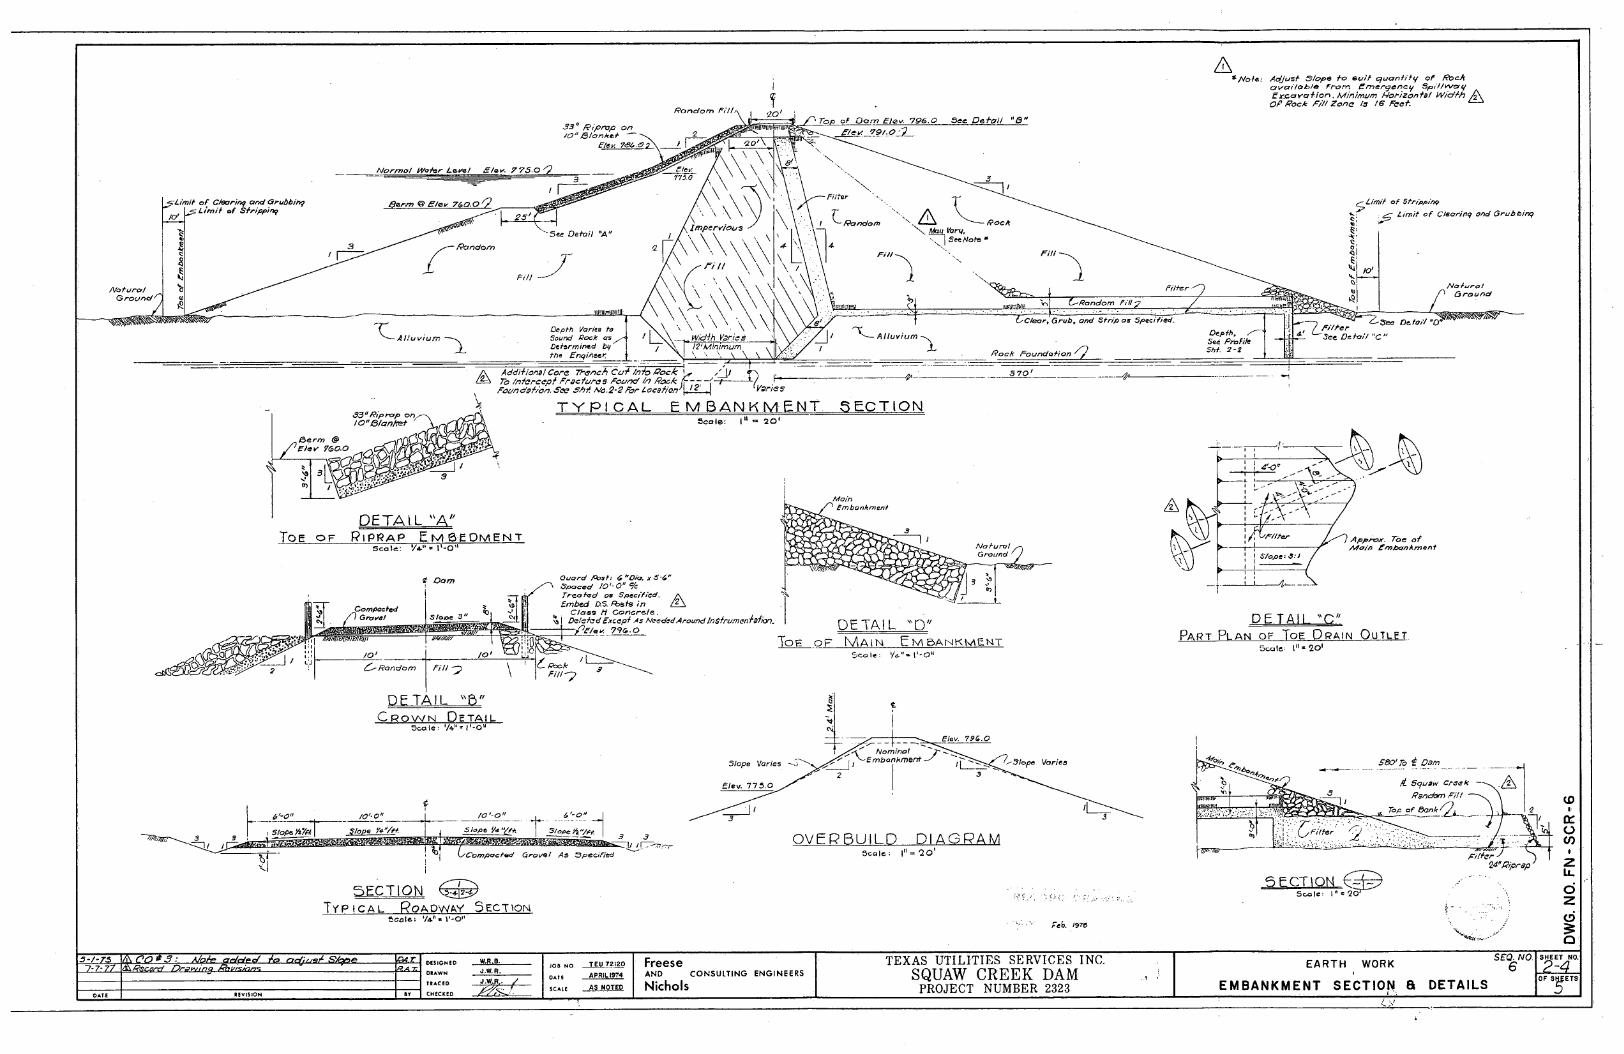
1. A description of how the Squaw Creek Dam discharge ratings (Tables 7-8 and 7-9 of TXUT-001 -FSAR 2.4.3-CALC-012) were developed.
2. References 13 and 14 of TXUT-001 -FSAR 2.4.3-CALC-01 2 for NRC staff review, as well asdetailed as-built specifications of dam and spillway geometry for confirmatory analysis by Staff.
This is supplemental RAI 2.4.3-03-S-a.
ANSWER:
The Squaw Creek Dam discharge ratings (Tables 7-8 and 7-9 of TXUT-001-FSAR-2.4.3-CALC-012) weredeveloped using the data supplied by the volumetric survey conducted in 1997 and the Operation andMaintenance Procedures to establish the stage storage relationship. The volumetric survey was utilizedfor data up to and including elevation 775 ft. The Operation and Maintenance Procedures were utilizedfor data above elevation 775 ft. The stage discharge relationships from the service spillway andemergency spillway were determined using the Operation and Maintenance Procedures up to andincluding elevation 790 ft. The corresponding storage at each stage elevation was then used to developa storage discharge relationship.
The volumetric survey indicates a hydrographic survey was performed using GPS for horizontal locationand a depth sounder for vertical information. Volumes were then computer solved at one-tenth footintervals using digital terrain modeling and a triangulated irregular network model. The Operation andMaintenance Procedures indicate the volume is based on sedimentation survey ranges establishedpursuant to the requirements of the Texas Water Rights Commission, May 1977.
Supplemental hydraulic design notes for the spillways indicate the service spillway rating curve wasdeveloped using the physical and hydraulic properties of the ogee crest in accordance with the guidanceof the U.S. Army Corps of Engineers publication EM 1110-2-1603. The emergency spillway rating curvewas developed using a backwater computer program and accounted for the downstream channelcharacteristics.
The calculation has been revised to reflect the most recent available volumetric survey conducted in2007. Therefore, the revised calculation utilizes the 2008 Volumetric Survey for the stage storagerelationship up to and including elevation 775 ft. The Operation and Maintenance Procedures are utilizedfor data above elevation 775 ft. The 2008 Volumetric Survey utilized the same methodology as theprevious volumetric survey to perform the updated hydrographic survey. The revised stage storagerelationship is tabulated below.
U. S. Nuctear Regulatory CommissionCP-201000930TXNB-100527/16/2010Attachment 3Page 8 of 27
Plnsicarjl •. I. Staae Storane Relationship
Elevation (ft)
775776
777
778
779
780
781
782
783
784
785
786
787
788
789
790
791
792
793
794
795
Storage (ac-ft)
151,273
154,243
157,562
160,903
164,270
167,665
171,093
174,560
178,072
181,628
185,229
188,877
192,574
196,321
200,119
203,967
207,867
211,818
215,821
219,875
223,980
In addition, the calculation has been revised to reflect new spillway discharge rating curves utilizing themethods of the U.S. Bureau of Reclamation Design of Small Dams for the service spillway with an ogeecrest and the methods of the Federal Highway Administration Hydraulic Design Series Number 5 for theemergency spillway. The reconstituted spillway discharge rating curves are more conservative than thosepreviously used and account for submergence due to assumed tailwater effects.
For the 100-ft wide service spillway with an ogee crest elevation of 775 ft, a design head of 25 ft, orelevation 800 ft, was selected. This is more conservative than the recorded design head of approximately15 ft. Based on the record drawing approach height for the spillway of 12 ft, the ogee crest dischargecoefficient is determined to be 3.78. Accounting for the depth of overtopping flow up to elevation 795 ft,the ogee crest discharge coefficient is reduced to range from 3.02 to 3.67 for an overtopping depth from1 ft to 20 ft. Because the ogee crest has a 45 degree sloping upstream face, the ogee crest dischargecoefficient is increased to range from 3.06 to 3.71.
It is assumed that the ogee crest is submerged 1 ft by the tailwater flooding up to elevation 776 ft.Therefore, the ogee crest discharge coefficient is reduced to account for submergence. The ogee crestdischarge coefficient is reduced to range from 0 to 3.71 for an overtopping depth from 1 ft to 20 ft.Submergence effects cease as the depth of overtopping flow approaches 4 ft. The resulting servicespillway ogee crest stage discharge relationship and discharge coefficient are tabulated below.
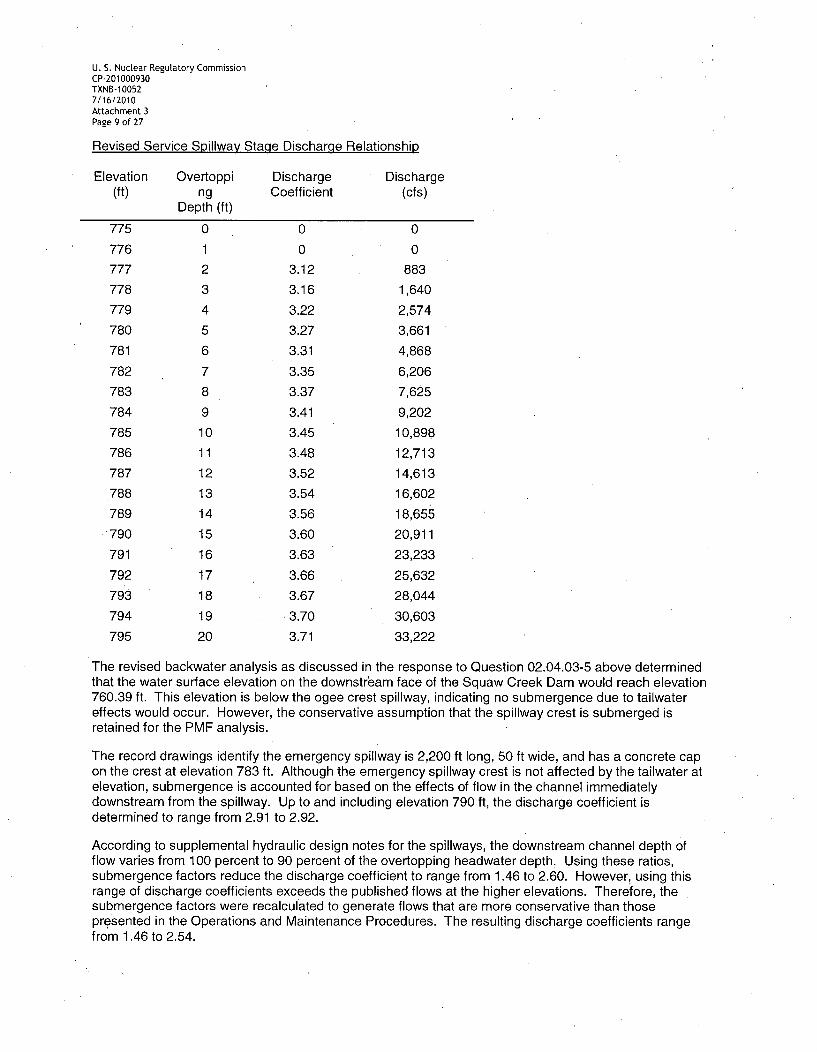
U. S. Nuclear Regulatory CommissionCP-201000930TXNB-100527/16/2010Attachment 3Page 9 of 27
Revised Service Spillway StaQe Discharge Relationship
Elevation Overtoppi(ft) ng
Depth (ft)
775 0
776 1
777 2
778 3
779 4
780 5
781 6
782 7
783 8
784 9
785 10
786 11
787 12
788 13
789 14
790 15
791 16
792 17
793 18
794 19
795 20
DischargeCoefficient
Discharge(cfs)
0
0
3.12
3.16
3.22
3.27
3.31
3.35
3.37
3.41
3.45
3.48
3.52
3.54
3.56
3.60
3.63
3.66
3.67
3.70
3.71
0
0
883
1,640
2,574
3,661
4,868
6,206
7,625
9,202
10,898
12,713
14,613
16,602
18,655
20,911
23,233
25,632
28,044
30,603
33,222
The revised backwater analysis as discussed in the response to Question 02.04.03-5 above determinedthat the water surface elevation on the downstream face of the Squaw Creek Dam would reach elevation760.39 ft. This elevation is below the ogee crest spillway, indicating no submergence due to tailwatereffects would occur. However, the conservative assumption that the spillway crest is submerged isretained for the PMF analysis.
The record drawings identify the emergency spillway is 2,200 ft long, 50 ft wide, and has a concrete capon the crest at elevation 783 ft. Although the emergency spillway crest is not affected by the tailwater atelevation, submergence is accounted for based on the effects of flow' in the channel immediatelydownstream from the spillway. Up to and including elevation 790 ft, the discharge coefficient isdetermined to range from 2.91 to 2.92.
According to supplemental hydraulic design notes for the spillways, the downstream channel depth offlow varies from 100 percent to 90 percent of the overtopping headwater depth. Using these ratios,submergence factors reduce the discharge coefficient to range from 1.46 to 2.60. However, using thisrange of discharge coefficients exceeds the published flows at the higher elevations. Therefore, thesubmergence factors were recalculated to generate flows that are more conservative than thosepresented in the Operations and Maintenance Procedures. The resulting discharge coefficients rangefrom 1.46 to 2.54.
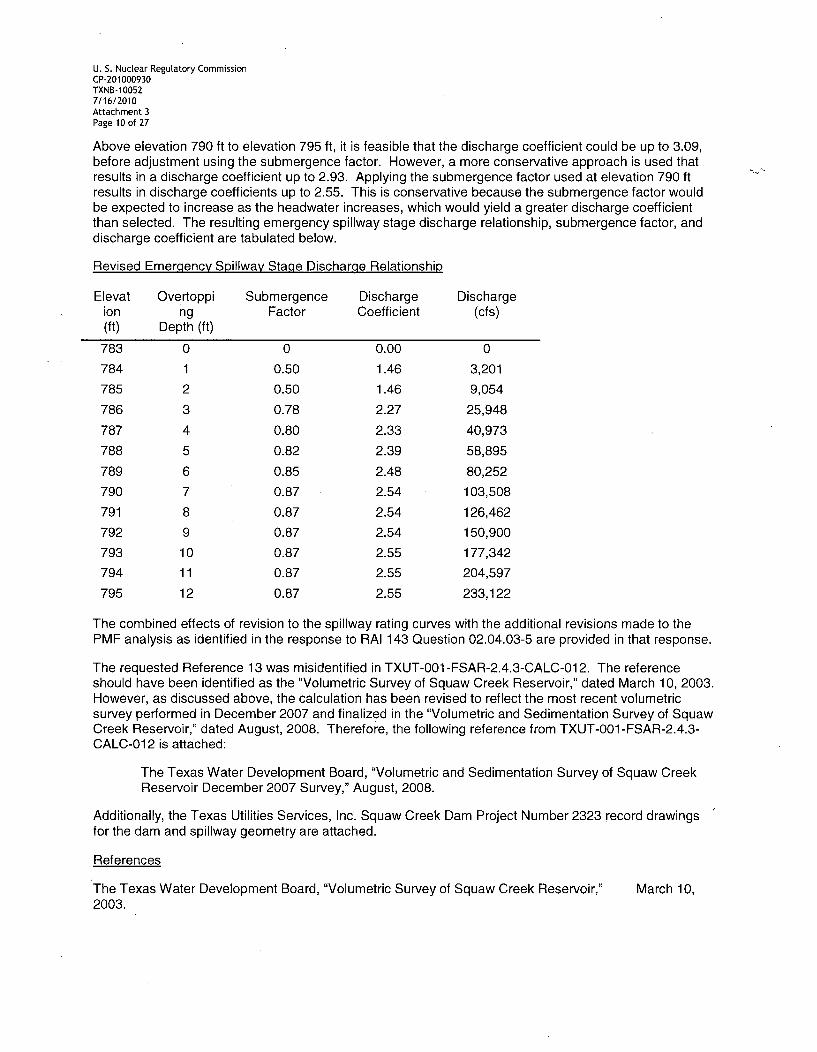
U. S. Nuclear Regulatory CommissionCP-201000930TXNB-100527/16/2010Attachment 3Page 10 of 27
Above elevation 790 ft to elevation 795 ft, it is feasible that the discharge coefficient could be up to 3.09,before adjustment using the submergence factor. However, a more conservative approach is used thatresults in a discharge coefficient up to 2.93. Applying the submergence factor used at elevation 790 ftresults in discharge coefficients up to 2.55. This is conservative because the submergence factor wouldbe expected to increase as the headwater increases, which would yield a greater discharge coefficientthan selected. The resulting emergency spillway stage discharge relationship, submergence factor, anddischarge coefficient are tabulated below.
The combined effects of revision to the spillway rating curves with the additional revisions made to thePMF analysis as identified in the response to RAI 143 Question 02.04.03-5 are provided in that response.
The requested Reference 13 was misidentified in TXUT-001-FSAR-2.4.3-CALC-012. The referenceshould have been identified as the "Volumetric Survey of Squaw Creek Reservoir," dated March 10, 2003.However, as discussed above, the calculation has been revised to reflect the most recent volumetricsurvey performed in December 2007 and finalized in the "Volumetric and Sedimentation Survey of SquawCreek Reservoir," dated August, 2008. Therefore, the following reference from TXUT-001-FSAR-2.4.3-CALC-012 is attached:
The Texas Water Development Board, "Volumetric and Sedimentation Survey of Squaw CreekReservoir December 2007 Survey," August, 2008.
Additionally, the Texas Utilities Services, Inc. Squaw Creek Dam Project Number 2323 record drawingsfor the dam and spillway geometry are attached.
References
The Texas Water Development Board, "Volumetric Survey of Squaw Creek Reservoir,"2003.
March 10,
U. S. Nuclear Regulatory CommissionCP-201000930TXNB-100527/16/2010Attachment 3Page 11 of 27
Freese and Nichols, Operation and Maintenance Procedures, Squaw Greek Dam, Fort Worth, Texas,1977 (ML1 00750051)
Bureau of Reclamation, "Design of Small Dams," 1987.
Federal Highway Administration, "Hydraulic Design Series Number 5, Hydraulic Design of HighwayCulverts," FHWA-NHI-01-020 HDS No. 5, Second Edition, May 2005
TXUT-001 -FSAR-2.4.3-CALC-01 2 Rev 2, Probable Maximum Flood Calculation for Comanche PeakNuclear Power Plant Units 3 and 4 (HEC-HMS & HEC-RAS)
Attachments
The Texas Water Development Board, "Volumetric and Sedimentation Survey of Squaw Creek ReservoirDecember 2007 Survey," August, 2008 (on CD)
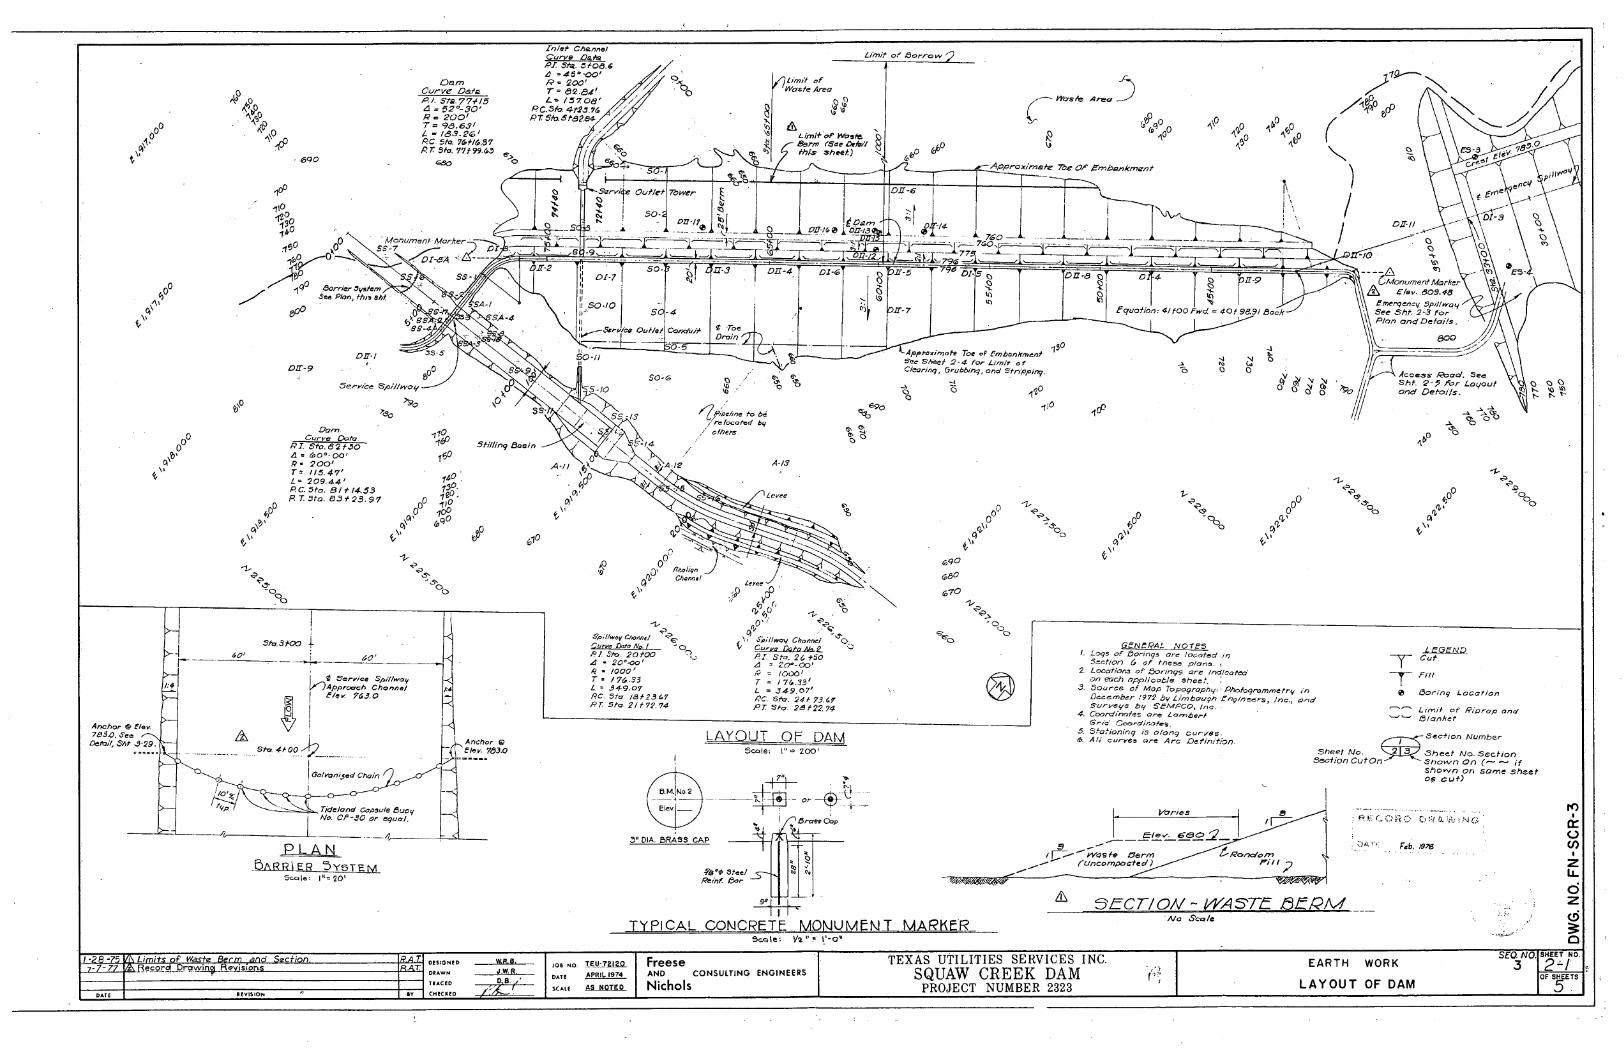
Layout of Dam, Drawing Number FN-SCR-3, Record Drawing Date February 1978.
Centerline Profile, Drawing Number FN-SCR-4, Record Drawing Date February 1978.
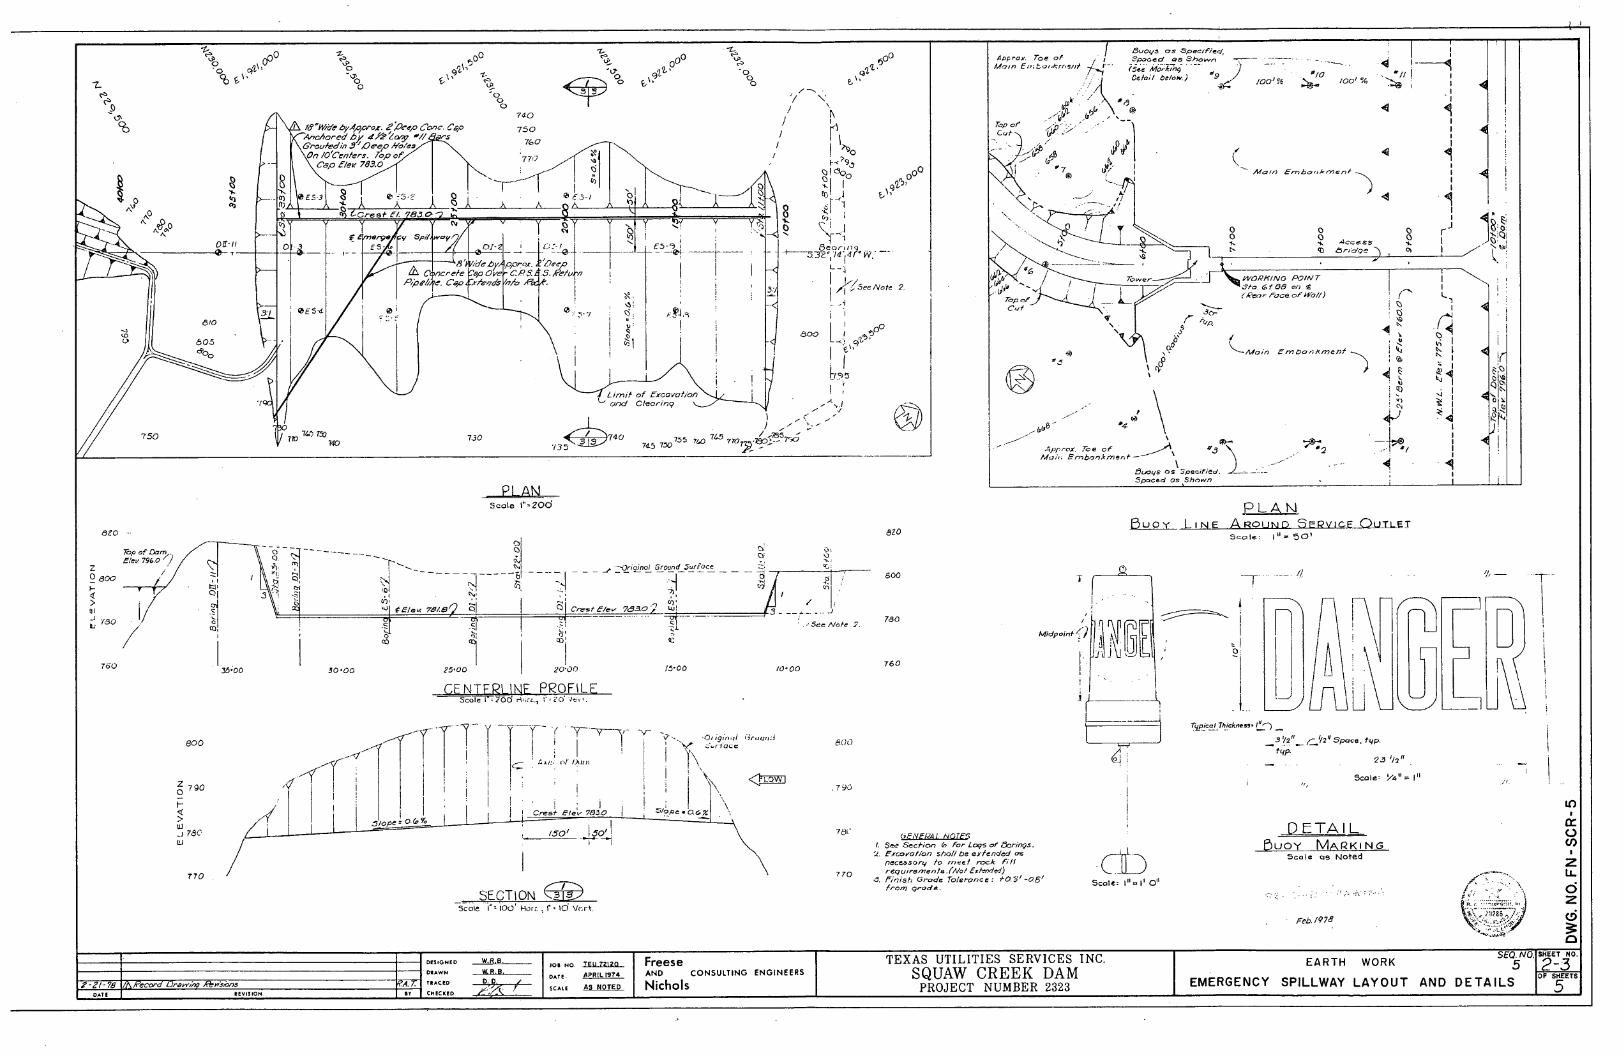
Emergency Spillway Layout and Details, Drawing Number FN-SCR-5, Record Drawing Date February1978.
Embankment Section & Details, Drawing Number FN-SCR-6, Record Drawing Date February 1978.
Spillway Plan & Profile, Drawing Number FN-SCR-14, Record Drawing Date February 1978.
Geometry, Plan & Sections Crest, Drawing Number FN-SCR-17, Record Drawing Date February 1978.
Impact on R-COLA
None.
Impact on S-COLA
None.
Impact on DCD
None.
U. S. Nuclear Regulatory CommissionCP-201000930TXNB-100527/16/2010Attachment 3Page '18 of 27
RESPONSE TO REQUEST FOR ADDITIONAL INFORMATION
Comanche Peak, Units 3 and 4
Luminant Generation Company LLC
Docket Nos. 52-034 and 52-035
RAI NO.: 4310 (CP RAI #143)
SRP SECTION: 02.04.03 - Probable Maximum Flood (PMF) on Streams and Rivers
QUESTIONS for Hydrologic Engineering Branch (RHEB)
DATE OF RAI ISSUE: 2/24/2010
QUESTION NO.: 02.04.03-7
NUREG-0800, Standard Review Plan (SRP), Section 2.4.3, 'Probable Maximum Flood (PMF) on Streamsand Rivers,' establishes criteria that the NRC staff intends to use to evaluate whether an Applicant meetsthe NRC's regulations.
By letter dated October 1, 2009, the NRC staff issued RAI ID 3665 (RAI 105) Question Number 14248,in which the NRC staff asked "Provide a rationale for assumptions made in the modeling of instreamflooding and drainage for computation of the PMF on rivers and streams affecting the site. Providedocumentation and electronic versions of input files for all computer models used to compute the riverand stream flooding."
The applicant responded in document CP-200901564-Log No TXNB-09067- (ML093230704) executed onNovember 13, 2009. The applicant directed the staff to the applicant's response to RAI 3665 (RAINumber 105). The applicant's response to this RAI also referred to Calculation "MITS004 - ProbableMaximum Flood Calculation for Comanche Peak Nuclear Power Plant Units 3 and 4 (HEC-HMS & HEC-RAS)", Revision 1 and the input and output (I/O) files (FlowMaster) that were submitted previously as partof July 2009 Hydrology Safety Site Audit Information Need HYDSV-07 via Luminant letter TXNB-09037,dated September 2, 2009. Refer to the NRC staff's 'Hydrology Site Safety Audit Report of the ComanchePeak Nuclear Power Plant, Units 3 and 4 Combined License Application,' dated December 3, 2009.
This supplemental RAI question results from staff's examination of that calculation package and fromexamination of calculation package TXUT-001 -FSAR 2.4.3-CALC-01 2.
The NRC staff noted that the Squaw Creek Dam discharge rating relationships referenced in the COLFSAR and in TXUT-001-FSAR 2.4.3-CALC-012 are important determinants of the design basis floodelevation reported by the applicant because they model the ability of Squaw Creek Dam to pass PMFflows from Squaw Creek watershed.
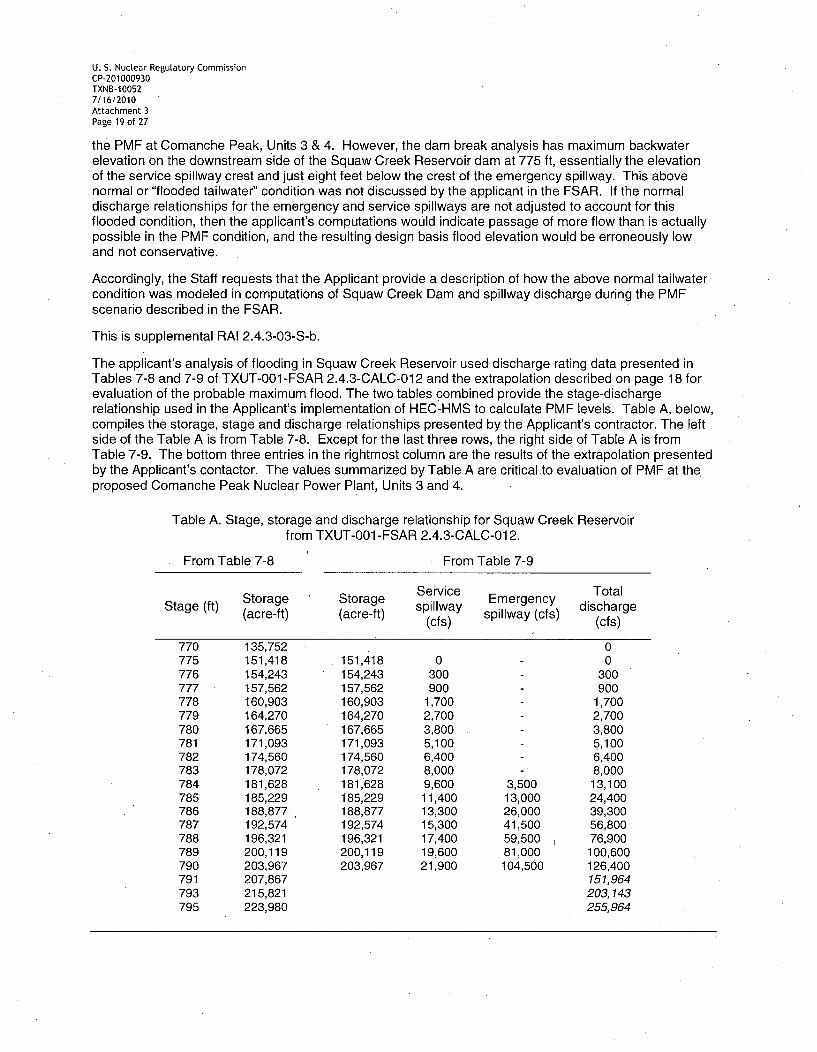
The staff's synthesis of data from multiple tables in the FSAR and TXUT-001-FSAR 2.4.3-CALC-012 areprovided in Table A to this supplemental RAI. Table A indicates that the crest of the service spillway is atabout 775 ft, and the crest of the emergency spillway is at about 783 ft. The storage, stage, dischargerelationship displayed in Table A is used in the applicant's implementation of HEC-HMS for calculating
U. S. Nuclear Regulatory CommissionCP-201000930TXNB-100527/16/2010Attachment 3Page 19 of 27
the PMF at Comanche Peak, Units 3 & 4. However, the dam break analysis has maximum backwaterelevation on the downstream side of the Squaw Creek Reservoir dam at 775 ft, essentially the elevationof the service spillway crest and just eight feet below the crest of the emergency spillway. This abovenormal or "flooded tailwater" condition was not discussed by the applicant in the FSAR. If the normaldischarge relationships for the emergency and service spillways are not adjusted to account for thisflooded condition, then the applicant's computations would indicate passage of more flow than is actuallypossible in the PMF condition, and the resulting design basis flood elevation would be erroneously lowand not conservative.
Accordingly, the Staff requests that the Applicant provide a description of how the above normal tailwatercondition was modeled in computations of Squaw Creek Dam and spillway discharge during the PMFscenario described in the FSAR.
This is supplemental RAI 2.4.3-03-S-b.
The applicant's analysis of flooding in Squaw Creek Reservoir used discharge rating data presented inTables 7-8 and 7-9 of TXUT-001-FSAR 2.4.3-CALC-012 and the extrapolation described on page 18 forevaluation of the probable maximum flood. The two tables combined provide the stage-dischargerelationship used in the Applicant's implementation of HEC-HMS to calculate PMF levels. Table A, below,compiles the storage, stage and discharge relationships presented by the Applicant's contractor. The leftside of the Table A is from Table 7-8. Except for the last three rows, the right side of Table A is fromTable 7-9. The bottom three entries in the rightmost column are the results of the extrapolation presentedby the Applicant's contactor. The values summarized by Table A are critical .to evaluation of PMF at theproposed Comanche Peak Nuclear Power Plant, Units 3 and 4.
Table A. Stage, storage and discharge relationship for Squaw Creek Reservoir
U. S. Nuclear Regulatory CommissionCP-201000930TXNB-100527/16/2010Attachment 3Page 20 of 27
ANSWER:
As discussed in the response to Question 02.04.03-5 above, the revised backwater analysis determinedthat the water surface elevation on the downstream face of the Squaw Creek Dam would reach elevation760.39 ft. This elevation is below the ogee, crest spillway, indicating no submergence due to tailwatereffects would occur. However, as discussed in the response to Question 02.04.03-6 above, theconservative assumption that the spillway crest is submerged by 1 ft is incorporated into the revisedservice spillway rating curve. Also, the emergency spillway rating curve accounts for tailwater flow in thechannel immediately downstream from the spillway. The combined effects of revision to the spillwayrating curves with the additional revisions made to the PMF analysis are provided in the response toQuestion 02.04.03-5.
Reference
TXUT-001 -FSAR-2.4.3-CALC-01 2 Rev 2, Probable Maximum Flood Calculation for Comanche PeakNuclear Power Plant Units 3 and 4 (HEC-HMS & HEC-RAS)
Impact on R-COLA
None.
Impact on S-COLA
None.
Impact on DCD
None.
U. S. Nuclear Regulatory CommissionCP-201000930TXNB-100527/16/2010Attachment 3Page 21 of 27
RESPONSE TO REQUEST FOR ADDITIONAL INFORMATION
Comanche Peak, Units 3 and 4
Luminant Generation Company LLC
Docket Nos. 52-034 and 52-035
RAI NO.: 4310 (CP RAI #143)
SRP SECTION: 02.04.03 - Probable Maximum Flood (PMF) on Streams and Rivers
QUESTIONS for Hydrologic Engineering Branch (RHEB)
DATE OF RAI ISSUE: 2/2412010
DATE OF RAI ISSUE: 2/24/2010
QUESTION NO.: 02.04.03-8
NUREG-0800, StandardReview Plan (SRP), Section 2.4.3, 'Probable Maximum Flood (PMF) on Streamsand Rivers,' establishes criteria that staff intends to use to evaluate whether an applicant meets theNRC's regulations.
The staff issued RAI ID 3665 (RAI number 105) Question Number 14248 (02.04.03-3), in which the NRCstaff asked "Provide a rationale for assumptions made in the modeling of instream flooding and drainagefor computation of the PMF on rivers and streams affecting the site. Provide documentation andelectronic versions of input files for all computer models used to compute the river and stream flooding."
The applicant responded in document CP-200901564-Log No TXNB-09067-(ML093230704) executed onNovember 13, 2009. The applicant directed the staff to the applicant's response to RAI ID 3665 (RAINumber 105). The staff has generated a supplemental RAI to address its need for additionalinformation. The applicant's response to this RAI also referred to Calculation "MITS004 - ProbableMaximum Flood Calculation for Comanche Peak Nuclear Power Plant, Units 3 and 4 (HEC-HMS & HEC-RAS)", Revision 1 and the input and output (I/O) files (FlowMaster) that were submitted previously, aspart of July 2009 Hydrology Safety Site Audit Information Need HYDSV-07 via Luminant letter TXNB-09037, dated September 2, 2009. This supplemental RAI question results from the staff's examination ofthat calculation package and from examination of calculation package TXUT-001-FSAR 2.4.3-CALC-012.Refer to the NRC staff's 'Hydrology Site Safety Audit Report of the Comanche Peak Nuclear Power Plant,Units 3 and 4 Combined License Application,' dated December 3, 2009.
The staff noted that the Squaw Creek Reservoir storage-elevation and discharge-elevation relationshipsreferenced in the FSAR and in TXUT-001-FSAR 2.4.3-CALC-012 are important determinants of thedesign basis flood elevation reported by the applicant because they determine how much flood rise isproduced when Squaw Creek Reservoir is surcharged by the PMF.
U. S. Nuclear Regulatory CommissionCP-201000930TXNB-100527/16/2010Attachment 3Page 22 of 27
Page 18 of 28 of TXUT-001 -FSAR 2.4.3-CALC-01 2 reports that the discharge-storage relationshipavailable to the applicant was linearly extrapolated to higher storage and discharge flow levels. The NRCstaff needs to reproduce this extrapolation in confirmatory analysis and make a safety determinationabout the design basis flood elevation that depends upon this extrapolation.
In order to ensure that the methods used to perform the analyses used to make its safetydeterminations technically valid and conservative, the staff requests that the applicant provide in the COLFSAR, deductive statements proving that the linear extrapolation is bounding conservative. The analysisshould demonstrate that the linear extrapolation to extreme storage values conservatively underestimatesSquaw Creek Dam discharge and overestimates Squaw Creek Reservoir elevation during PMFconditions, and that the resulting design basis flood elevation is bounding conservative.
This is supplemental RAI 2.4.3-03-S-c.
ANSWER:
As discussed in the response to Question 02.04.03-6 above, the stage storage relationship has beenrevised to reflect the most recent available volumetric survey. The revised analysis utilizes the 2008Volumetric Survey for the stage storage relationship up to and including elevation 775 ft. The Operationand Maintenance Procedures are utilized for data above elevation 775 ft. The stage storage relationshiphas not been extrapolated.
Also, the spillway stage discharge relationship has been revised using more conservative application ofthe defined methods and is no longer extrapolated. The service spillway discharge rating curve has beenreconstituted utilizing the methods of the U.S. Bureau of Reclamation Design of Small Dams for an ogeecrest. The emergency spillway discharge rating curve has been reconstituted utilizing the methods of theFederal Highway Administration Hydraulic Design Series Number 5. The same conservative approachesusing the defined methods are used to determine the discharge at elevations above those identified bythe Operations and Maintenance Procedures. The combined effects of revision to the spillway ratingcurves with the additional revisions made to the PMF analysis are provided in the response to Question02.04.03-5 above.
References
The Texas Water Development Board, "Volumetric and Sedimentation Survey of Squaw Creek ReservoirDecember 2007 Survey," August, 2008.
Freese and Nichols, Operation and Maintenance Procedures, Squaw Creek Dam, Fort Worth, Texas,1977 (ML100750051).
Bureau of Reclamation, "Design of Small Dams," 1987.
Federal Highway Administration, "Hydraulic Design Series Number 5, Hydraulic Design of HighwayCulverts," FHWA-NHI-01-020 HDS No. 5, Second Edition, May 2005.
TXUT-001-FSAR-2.4.3-CALC-012 Rev 2, Probable Maximum Flood Calculation for Comanche PeakNuclear Power Plant Units 3 and 4 (HEC-HMS & HEC-RAS).
Impact on R-COLA
None.
U. S. Nuclear Regulatory CommissionCP-201000930TXNB-100527/16/2010Attachment 3Page 23 of 27
Impact on S-COLA
None.
Impact on DCD
None.
U. S. Nuclear Regulatory CommissionCP-201000930TXNB-100527/16/2010Attachment 3Page 24 of 27
RESPONSE TO REQUEST FOR ADDITIONAL INFORMATION
Comanche Peak, Units 3 and 4
Luminant Generation Company LLC
Docket Nos. 52-034 and 52-035
RAI NO.: 4310 (CP RAI #143)
SRP SECTION: 02.04.03 - Probable Maximum Flood (PMF) on Streams and Rivers
QUESTIONS for Hydrologic Engineering Branch (RHEB)
DATE OF RAI ISSUE: 2/24/2010
QUESTION NO.: 02.04.03-10
NUREG-0800, Standard Review Plan (SRP), Section 2.4.3, 'Probable Maximum Flood (PMF) on Streams andRivers,' establishes criteria that the staff intends to use to evaluate whether an Applicant meets the NRC'sregulations.
The NRC staff issued RAI ID 3665 (RAI Number 105) Question Number 14248, in which the NRC staff asked"Provide a rationale for assumptions made in the modeling of instream flooding and drainage for computation ofthe PMF on rivers and streams affecting the site. Provide documentation and electronic versions of input filesfor all computer models used to compute the river and stream flooding."
The applicant responded in document CP-200901564-Log No TXNB-09067- (ML093230704) executed onNovember 13, 2009. The applicant directed the staff to the applicant's response to RAI ID 3665 (RAI Number105). The NRC staff has generated a supplemental RAI to address its need for additional information. Theapplicant's response to this RAI also referred to Calculation "MITS004 - Probable Maximum Flood Calculationfor Comanche Peak Nuclear Power Plant Units 3 and 4 (HEC-HMS & HEC-RAS)", Revision 1 and the inputand output (I/O) files (FlowMaster) that were submitted previously, as part of July 2009 Hydrology Safety SiteAudit Information Need HYDSV-07 via Luminant letter TXNB-09037, dated September 2, 2009. Thissupplemental RAI question results from the NRC staff's examination of that calculation package and fromexamination of calculation package TXUT-001-FSAR 2.4.3-CALC-012. Refer to the N RC staff's 'HydrologySite Safety Audit Report of the Comanche Peak Nuclear Power Plant, Units 3 and 4 Combined LicenseApplication,' dated December 3, 2009.
Pages 12 and 13 of TXUT-001 -FSAR 2.4.3-CALC-01 2 report selection of a base flow rate. The applicant useda 1977-present average of July baseflows-the lowest of all months for the 1977-present period of record.
In order to make its safety determinations based on appropriate consideration of conservative estimates, thestaff requests that the applicant justify why the average of July baseflows is bounding conservative ascompared to the use of a greater baseflow statistic.
This is supplemental RAI 2.4.3-03-S-e.
U. S. Nuclear Regulatory CommissionCP-201000930TXNB-100527/16/2010Attachment 3Page 25 of 27
ANSWER:
In accordance with ANSI/ANS-2.8-1992 guidance, the PMF analysis has been revised to incorporate theeffects of the highest average monthly flow of 46 cfs determined using U.S. Geological Survey gage08091750 data. The highest monthly flow is adjusted based on the ratio of the modeled basin drainagearea to the gage area. The baseflow is applied to the model as a constant rate. The combined effects ofrevision to the baseflow with the additional revisions made to the PMF analysis are provided in theresponse to Question 02.04.03-5 above.
References
American Nuclear Society, "American National Standard for Determining Design Basis Flooding at PowerReactor Sites," ANSI/ANS-2.8-1992, July 28, 1992
United States Geological Survey USGS, Website http://nwis.waterdata.usgs.gov/, (Monthly Statistics forUSGS Gages) Data extracted February 7, 2008
TXUT-001 -FSAR-2.4.3-CALC-01 2 Rev 2, Probable Maximum Flood Calculation for Comanche PeakNuclear Power Plant Units 3 and 4 (HEC-HMS & HEC-RAS)
Impact on R-COLA
None.
Impact on S-COLA
None.
Impact on DCD
None.
U. S. Nuctear Regulatory CommissionCP-201000930TXNB-100527/16/2010Attachment 3Page 26 of 27
RESPONSE TO REQUEST FOR ADDITIONAL INFORMATION
Comanche Peak, Units 3 and 4
Luminant Generation Company LLC
Docket Nos. 52-034 and 52-035
RAI NO.: 4310 (CP RAI #143)
SRP SECTION: 02.04.03 - Probable Maximum Flood (PMF) on Streams and Rivers
QUESTIONS for Hydrologic Engineering Branch (RHEB)
DATE OF RAI ISSUE: 2/24/2010
QUESTION NO.: 02.04.03-11
NUREG-0800, Standard Review Plan (SRP), Section 2.4.3, 'Probable Maximum Flood (PMF) on Streamsand Rivers,' establishes criteria that staff intends to use to evaluate whether an applicant meets theNRC's regulations.
The NRC staff issued RAI ID 3665 (RAI Number 105) Question Number 14248, in which the NRC staffasked "Provide a rationale for assumptions made in the modeling of instream flooding and drainage forcomputation of the PMF on rivers and streams affecting the site. Provide documentation and electronicversions of input files for all computer models used to compute the river and stream flooding."
The applicant responded in document CP-200901564-Log No TXNB-09067- (ML093230704) executed onNovember 13, 2009. The applicant directed the staff to the applicant's response to RAI ID 3665 (RAINumber 105). The NRC staff has generated a supplemental RAI to address its need for additionalinformation. The applicant's response to this RAI also referred to Calculation "MITS004 - ProbableMaximum Flood Calculation for Comanche Peak Nuclear Power Plant Units 3 and 4 (HEC-HMS & HEC-RAS)", Revision 1 and the input and output (I/O) files (FlowMaster) that were submitted previously, aspart of July 2009 Hydrology Safety Site Audit Information Need HYDSV-07 via Luminant letter TXNB-09037, dated September 2, 2009. This supplemental RAI question results from the staff's examination ofthat calculation package and from examination of calculation package TXUT-001-FSAR 2.4.3-CALC-012.Refer to the NRC staff's 'Hydrology Site Safety Audit Report of the Comanche Peak Nuclear Power Plant,Units 3 and 4 Combined License Application,' dated December 3, 2009.
The NRC staff noted that the applicant does not specify the reservoir elevation corresponding to theSquaw Creek Reservoir surface used to compute critical fetch length for wind and wave heightcomputation.
In order to make safety determinations based on adequate consideration of appropriate mechanisms thatresult in a conservative estimate, the staff requests that the applicant include a figure in the COL FSARdetailing the location of the critical fetch length. The NRC staff also requests that the applicant describeany dependence of the critical fetch length on reservoir elevation, which would require that the fetch
U. S. Nuclear Regulatory CommissionCP-201000930TXNB-100527/16/2010Attachment 3Page 27 of 27
length be computed for the reservoir at the PMF (rather than normal) elevation of Squaw Creek Reservoirto yield a conservative estimate of wind and wave height.
This is supplemental RAI 2.4.3-03-S-f.
ANSWER:
The coincident wind wave activity is determined for the longest fetch length, which is based on themaximum water surface elevation achieved during the PMF for the Squaw Creek Reservoir. Coincidentwind wave activity has been recalculated based on the increased PMF elevation at Squaw CreekReservoir as identified in the response to Question 02.04.03-5 above. Figure 2.4.3-209 has also beenrevised to reflect the increased PMF elevation and identify the critical fetch length determined.
Attachment
TXUT-001-FSAR-2.4.3-CALC-013 Rev 3, Coincident Wind Wave Analysis for Comanche Peak NuclearPower Plant Units 3 and 4 (on CD).
Impact on R-COLA
See attached marked-up FSAR Revision 1 pages 2.4-32, 2.4-33, 2.4-55, 2.4-58, and Figure 2.4.3-209 (onCD).
Impact on S-COLA
None.
Impact on DCD
None.
U. S. Nuclear Regulatory CommissionCP-201000930TXNB-100527/16/2010
Attachment 4
Response to Request for Additional Information No. 4311 (CP RAI #140)
U. S. Nuclear Regulatory CommissionCP-201000930TXNB-100527/16/2010Attachment 4Page 1 of 8
RESPONSE TO REQUEST FOR ADDITIONAL INFORMATION
Comanche Peak, Units 3 and 4
Luminant Generation Company LLC
Docket Nos. 52-034 and 52-035
RAI NO.: 4311 (CP RAI #140)
SRP SECTION: 02.04.04 - Potential Dam Failures
QUESTIONS for Hydrologic Engineering Branch (RHEB)
DATE OF RAI ISSUE: 2/21/2010
QUESTION NO.: 02.04.04-5
NUREG-0800, Standard Review Plan (SRP), Section 2.4.4, 'Potential Dam Failures,' establishes criteria thatStaff intends to use to evaluate whether an Applicant meets the NRC's regulations.
By letter dated October 2, 2009, the NRC staff issued RAI ID 3666 (RAI No. 111) Question Number 14250(02.04.04-1), in which the NRC staff asked "Provide a description of the process used to determine that themultiple dam failure analysis and resulting flood elevations are based on the most conservative of allplausible conceptual models, including consideration of multiple scenarios of domino failures of existing andproposed dam development within the Brazos River Basin and coincident wind and wave activity on eachfailed dam."
The applicant responded in document CP-200901564-,Log No TXNB-09067.(ML093230704) executed onNovember 13, 2009. The NRC staff has reviewed the response, including the cited changes reflected inUpdated Tracking Report No. 4, FSAR.
The NRC staff refers to the portion of the applicant's response that reads "Because the site is located off-channel on a tributary of the Brazos River, the most conservative approach for the critical dam failure eventwould be for this reach of the Brazos River to flood by way of domino-type dam failure of upstream dams, andfor flood waters to back-up from-the Brazos River and Paluxy River confluence onto the site by way of theSquaw Creek catchment." The applicant has provided much of the necessary information about how theapplicant identified a bounding conservative approach to the dam break problem.
In order to make its safety determination based on the use of appropriate quantitative and technical analyses,the NRC staff requests that the applicant provide clear justification for the assertion of bounding conservatismof the resulting flood elevation at the proposed Comanche Peak Nuclear Power Plant, Units 3 and 4 site byproviding a physical basis and hydraulic basis for including or excluding each existing or proposed dam andreservoir from the domino dam failure analysis presented in the FSAR.
This is supplemental RAI 2.4.4-00-S-a.
U. S. Nuclear Regulatory CommissionCP-201000930TXNB-100527/16/2010Attachment 4Page 2 of 8
ANSWER:
Detailed discussion of the qualitative assessment has been added to FSAR Subsection 2.4.4.1. Thequantitative assessment has been revised to include assessment of future conditions and to addressQuestions 02.04.04-6 and -7 below.
Impact on R-COLA
See attached marked-up FSAR Revision 1 pages 2.4-34, 2.4-35, 2.4-36, 2.4-37, 2.4-38, 2.4-39, 2.4-40,2.4-51, 2.4-52, 2.4-106, 2.4-107, 2.4-149, 2.4-150, 2.4-151,2.4-152, 2.4-153, 2.4-154, 2.4-155, 2.4-156,2.4-157, 2.4-158, 2.4-159, and new Figure 2.4.4-204 (on CD).
Impact on S-COLA
None.
Impact on DCD
None.
U. S. Nuclear Regulatory CommissionCP-201000930TXNB-100527/16/2010Attachment 4Page 3 of 8
RESPONSE TO REQUEST FOR ADDITIONAL INFORMATION
Comanche Peak, Units 3 and 4
Luminant Generation Company LLC
Docket Nos. 52-034 and 52-035
RAI NO.: 4311 (CP RAI #140)
SRP SECTION: 02.04.04 - Potential Dam Failures
QUESTIONS for Hydrologic Engineering Branch (RHEB)
DATE OF RAI ISSUE: 2/21/2010
QUESTION NO.: 02.04.04-6
NUREG-0800, Standard Review Plan (SRP), Section 2.4.4, 'Potential Dam Failures,' establishes criteriathat NRC staff intends to use to evaluate whether an applicant meets the NRC's regulations.
The NRC staff issued RAI ID 3666 (RAI No. 111) Question Number 14250 (02.04.04-1), in which theNRC staff asked "Provide a description of the process used to determine that the multiple dam failureanalysis and resulting flood elevations are based on the most conservative of all plausible conceptualmodels, including consideration of multiple scenarios of domino failures of existing and proposed damdevelopment within the Brazos River Basin and coincident wind and wave activity on each failed dam."
The applicant responded in document CP-200901564-Log No TXNB-09067-ML093230704 executed onNovember 13, 2009. The NRC staff has reviewed the response, including the cited changes reflected inFSAR Updated Tracking Report No. 4.
The NRC staff disagrees with the last portion of the applicant's response that states "The total damfailure flow is the sum of the spillway flow, the breach flow, the remainder of the overtopping flow notaffected by the breach width combined with the coincident PMF flow for the respective dams. The damfailure flows represent the dam storage for the respective dams. The coincident wind wave activity oneach failed upstream dam will be limited to an instantaneous wave height and will not increase the damfailure flows. Hence, coincident wind wave activity on each of the failed upstream dam was considerednot applicable for the dam failures."
The NRC staff notes that wind setup on a reservoir is not an instantaneous phenomenon. Rather it canbe a persistent mechanism for increasing the energy head on a dam about to fail. The equations usedby the applicant to compute dam break flows in FSAR Section 2.4.4.1 do exhibit dependence on energyhead at the time of failure. The NRC staff concludes that wind setup on a reservoir would increase dambreak flows in the applicant's dam break scenario.
In order to make its safety determination based on adequate consideration of appropriate mechanismsthat result in a conservative estimate, the NRC staff requests that the applicant add wind setupcomputations for all reservoirs included in the dam break analysis.
U. S. Nuctear Regutatory CommissionCP-201000930TXNB-100527/16/2010Attachment 4Page 4 of 8
This is supplemental RAI 2.4.4-00-S-b.
ANSWER:
The quantitative dam failure analysis for existing and future conditions has been revised to include windsetup in accordance with the guidance of U.S. Army Corps of Engineers publication EM 1110-2-1420.Discussion of wind setup has been added to FSAR Subsection 2.4.4.1.
Wind speed is based on the guidance provided in ANSI/ANS-2.8-1992. In lieu of site specific windspeed studies the maximum wind speed is determined using the guidance chart for the annual extreme-mile, 2-year mean recurrence interval. For the Brazos River watershed, the wind speed varies from 50mph to 60 mph. The maximum 60 mph wind speed is selected for the input parameter. This isconservative and bounding for the expected range of 2-year wind speeds for the region.
The fetch distance is determined based on the reservoir surface area at the overtopping or otherwisemaximum water surface elevation. U.S. Geological Survey 7.5 minute quadrangles for each reservoirare used to identify the longest fetch length. The longest straight line fetch distance is used to definethe wind setup and is more conservative than using an effective fetch. Because the topographic mapsdepict elevation contours at 10-foot intervals, the maximum water surface elevation is rounded up to thenearest estimated 5-ft or 10-ft contour. Therefore, the fetch distance is based on a more conservativeelevation than the maximum water surface elevation.
The average depth of water is determined from the hydraulic depth using U.S. Geological Surveycontours and supplemented with bathymetry maps from individual reservoir volumetric survey reportsdeveloped by the Texas Water Development Board as appropriate. However, the maximum watersurface elevation is used as the basis for the average depth and not the higher rounded up contourused to derive the fetch distance. This is conservative because it results in a smaller average depth. Asmaller average depth results in a higher wind setup.
The overtopping or otherwise maximum water surface elevation at each reservoir is based on theresulting PMF elevation combined with the effects from upstream dam failures and transposed to thedam without attenuation. The antecedent reservoir elevation prior to the arrival of the PMF andcombined effects from upstream dam failures are discussed in the response to Question 02.04.04-7below.
References
U.S. Army Corps of Engineers, "Engineering and Design Hydrologic Engineering Requirements forReservoirs," EM 1110-2-1420, October 31, 1997.
American Nuclear Society, "American National Standard for Determining Design Basis Flooding atPower Reactor Sites," ANSI/ANS-2.8-1992, July 28, 1992.
U.S. Geological Survey, Quadrangles, Website, http://www.usgs.gov, accessed April 2010.
Texas Water Development Board, Volumetric Survey of Fort Phantom Hill Reservoir, March 10, 2003.
Texas Water Development Board, Volumetric Survey of Lake Stamford, January 24, 2000.
Texas Water Development Board, Volumetric Survey Report of Possum Kingdom Lake December2004-January 2005 Survey, May 2006.
U. S. Nuclear Regulatory CommissionCP-201000930TXNB-100527/16/2010Attachment 4Page 5 of 8
Impact on R-COLA
See attached marked-up FSAR Revision 1 pages 2.4-40, and 2.4-43 (on CD).
Impact on S-COLA
None.
Impact on DCD
None.
U. S. Nuclear Regulatory CommissionCP-201000930TXNB-100527/16/2010Attachment 4Page 6 of 8
RESPONSE TO REQUEST FOR ADDITIONAL INFORMATION
Comanche Peak, Units 3 and 4
Luminant Generation Company LLC
Docket Nos. 52-034 and 52-035
RAI NO.: 4311 (CP RAI #140)
SRP SECTION: 02.04.04 - Potential Dam Failures
QUESTIONS for Hydrologic Engineering Branch (RHEB)
DATE OF RAI ISSUE: 2/2112010
QUESTION NO.: 02.04.04-7
NUREG-0800, Standard Review Plan (SRP), Section 2.4.4, 'Potential Dam Failures,' establishes criteriathat Staff intends to use to evaluate whether an applicant meets the NRC's regulations.
The NRC staff issued RAI ID 3666 (RAI No. 111) Question Number 14253 (02.04.04-4), in which theNRC staff asked "Provide a rationale for assuming normal water surface elevations for reservoirsincluded in the domino-type dam failure scenario. Explain why the analysis should not include maximumreservoir elevations as reported in operating histories or in reservoir operating guides maintained byoperating authorities."
The applicant responded in document CP-200901564-Log No TXNB-09067-(ML093230704) executedon November 13, 2009. Staff has reviewed the response, including the cited changes reflected inFSAR Updated Tracking Report No 4.
The applicant's response states that "reservoirs are assumed to be at normal water surface elevationfor antecedent conditions at the onset of the PMF" and that "the peak water surface elevation for thecorresponding dam failure is equal to the height of the dam plus the height of the overtopping flows,which will exceed the maximum reservoir elevation and hence, was considered to be conservative."This response does not address the dependence of breach and overtopping flows on initial height(reservoir elevation), nor does it address the increased volume impounded by the reservoir at maximumstorage, which would worsen downstream flooding.
In order to make its safety determination based on the use of appropriate quantitative and technicalanalyses, the NRC staff requests that the applicant provide justifications based on the hydraulicequations cited in Section 2.4.4.1 of the FSAR, that the assumption of normal water surface elevationfor failed reservoirs is as conservative as an assumption of reservoirs at maximum elevation.Otherwise, the applicant should revise the analysis to model reservoirs at maximum water surfaceelevation prior to failure.
This is supplemental RAI 2.4.4-03-S.
U. S. Nuclear Regulatory CommissionCP-201000930TXNB-100527/16/2010Attachment 4Page 7 of 8
ANSWER:
The quantitative dam failure analysis for existing and future conditions has been revised to includeconservative antecedent reservoir elevations greater than or equal to maximum recorded water surfaceelevations. The elevations provided below are referenced to the National Geodetic Vertical Datum of1929 (NGVD 29), unless noted otherwise. The plant site grading plan is referenced to the NorthAmerican Vertical Datum of 1988 (NAVD 88).
The maximum recorded water surface elevation at Hubbard Creek Reservoir is 1190.22 ft. The damfailure analysis assumes an antecedent Water surface elevation at the emergency spillway elevation of1194.0 ft.
The maximum recorded water surface elevation at Lake Stamford is 1426.18 ft. The dam failureanalysis assumes an antecedent water surface elevation at the dam crest elevation of 1,436.8 ft.
The maximum recorded water surface elevation at Fort Phantom Hill Reservoir is 1639.50 ft. The damfailure analysis assumes an antecedent water surface elevation at the levee elevation of 1643.0 ft.
The maximum recorded water surface elevation at Possum Kingdom Lake is 1003.60 ft. The damfailure analysis assumes an antecedent water surface elevation at the maximum historical water surfaceelevation.
The maximum recorded water surface elevation at Lake Granbury is 693.60 ft. For the upstreambreach flow evaluation, the dam failure analysis assumes an antecedent water surface 'elevation at thedam crest elevation of 706.5 ft. For the upstream breach wave height evaluation, the dam failureanalysis assumes an antecedent water surface elevation at the maximum historical water surfaceelevation.
Design details for the proposed Cedar Ridge Reservoir Dam are unavailable. However, according tothe 2011 Brazos G Regional Water Plan, the normal full pool elevation is 1489.0 ft. The dam failureanalysis assumes a dam crest elevation of 1510.0 ft. The dam failure analysis assumes an antecedentwater surface elevation at the dam crest elevation.
The revisions to the dam failure analysis discussed in the responses to Questions 02.04.04-5 and02.04.04-6 above, combined with the revisions to account for antecedent reservoir water surfaceelevations, result in a total flow of 6,730,000 cfs from De Cordova Bend Dam. The upstream damfailure flow is transposed to the confluence with the Paluxy River to determine the water surfaceelevation at the confluence.
The HEC-RAS stream course model discussed in FSAR Subsection 2.4.3 has been revised toincorporate the Brazos River. Brazos River cross sections upstream and downstream of the confluencewith the Paluxy River are estimated using USGS quadrangle topography. The Manning's roughnesscoefficient of 0.15 is used for the channel and overbanks. This is a conservative estimate based on thepublished tables by Chow. The dam failure'analysis flow is used as input for the Brazos River.Additionally, the peak flows from the flow hydrographs for each basin in the HEC-HMS model,discussed in the response to RAI No. 4310 (CP RAI #143) Question 02.04.03-5, are used as input tothe Brazos River tributaries. This is a conservative approach by assuming multiple PMF events occurcoincidentally with all peak flows combined. The analysis is performed using steady state conditions todetermine a water surface elevation of 760.05 ft at the confluence of the Brazos River and the PaluxyRiver.
The elevations above are provided with reference to the National Geodetic Vertical Datum of 1929(NGVD 29). The plant site grading plan is referenced to the North American Vertical Datum of 1988(NAVD 88). According to the National Geodetic Survey, the datum shift of NAVD 88 minus NGVD 29 is
U. S. Nuctear Regutatory CommissionCP-201000930TXNB-100527/16/2010Attachment 4Page 8 of 8
equal to between 0 and +20 cm for the site. Therefore, it is conservative to account for a maximumconversion of +20 cm (0.66 ft) when comparing water surface elevations determined using NGVD 29 toelevations at the site in NAVD 88. Considering conversion, the confluence water surface elevation of760.71 ft NAVD 88 is well below the CPNPP Units 3 and 4 safety-related structures elevation of 822 ftNAVD 88.
References
U.S. Geological Survey, Water-Data Report 2009, 08086400 Hubbard Creek Reservoir nrBreckenridge, TX, Website, http://wdr.water.usgs.gov/, accessed May 2010.
U.S. Geological Survey, Water-Data Report 2009, 08084500 Lake Stamford near Haskell, TX, Website,http://wdr.water.usgs.gov/, accessed May 2010.
U.S. Geological Survey, Water-Data Report 2009, 08083500 Fort Phantom Hill Reservoir near Nugent,TX, Website, http://wdr.water.usgs.gov/, accessed May 2010.
U.S. Geological Survey, Water-Data Report 2008, 08088500 Possum Kingdom Lake near Graford, TX,Website, http://wdr.water.usgs.gov/, accessed May 2010.
U.S. Geological Survey, Water-Data Report 2008, 08090900 Lake Granbury near Granbury, TX,Website, http://wdr.water.usgs.gov/, accessed May 2010.
Brazos G Regional Water Planning Group, Brazos G Regional Water Planning Area, Initially Prepared2011 Brazos G Regional Water Plan, March 2010.
National Geodetic Survey, Website, http://www.ngs.noaa.govTOOLS/Nertcon/vertcon.html, accessedMay 2010.
Impact on R-COLA
See attached marked-up FSAR Revision 1 pages 2.4-40, 2.4-41, 2.4-42, 2.4-43, 2.4-44, 2.4-45, 2.4-46,2.4-47, 2.4-48, 2.4-49, 2.4-50, 2.4-51, 2.4-53, 2.4-54, 2.4-106, 2.4-107, and Figures 2.4-202 and2.4-203 (on CD).
Impact on S-COLA
None.
Impact on DCD
None.
U. S. Nuclear Regulatory CommissionCP-201000930TXNB-100527/16/2010
Attachment 5
Electronic Files Included on the Enclosed CD
RAI 4308-138
FSAR pages for RAI 138.pdf
TXUT-001-FSAR-2.4.4-CALC-015 Rev 1 Part 1 of 2.pdf
TXUT-001-FSAR-2.4.4-CALC-015 Rev 1 Part 2 of 2.pdf
RAI 4309-139
FSAR pages for RAI 139.pdf
TXUT-001-FSAR-2.4.2-CALC-020 Rev 3.pdf
RAI 4310-143
FSAR pages for RAI 143.pdf
Squaw Creek 2007 Survey.pdf
TXUT-001-FSAR 2.4.3-CALC-011 Rev 2 Part 1 of 4.pdf
TXUT-001-FSAR 2.4.3-CALC-011 Rev 2 Part 2 of 4.pdf
TXUT-001-FSAR 2.4.3-CALC-011 Rev 2 Part 3 of 4.pdf
TXUT-001-FSAR 2.4.3-CALC-011 Rev 2 Part 4 of 4.pdf