Response transformation factors for deterministic-based and reliability-based seismic design
Edén Bojórquez1, Juan Bojórquez2a, Sonia E. Ruiz2b, Alfredo Reyes-Salazar1C and Juan Velázquez-Dimas1d
1Facultad de Ingeniería, Universidad Autónoma de Sinaloa, Calzada de las Américas y B. Universitarios s/n,
80040 Culiacán, Mexico 2Mecánica Aplicada, Instituto de Ingeniería, Universidad Nacional Autónoma de México, México
(Received April 27, 2011, Revised April 30, 2013, Accepted May 31, 2013)
Abstract. One of the main requirements of the seismic design codes must be its easy application by structural engineers. The use of practically-applicable models or simplified models as single-degree-of-freedom (SDOF) systems is a good alternative to achieve this condition. In this study, deterministic and probabilistic response transformation factors are obtained to evaluate the response in terms of maximum ductility and maximum interstory drifts of multi-degree-of-freedom (MDOF) systems based on the response of equivalent SDOF systems. For this aim, five steel frames designed with the Mexican City Building Code (MCBC) as well as their corresponding equivalent SDOF systems (which represent the characteristics of the frames) are analyzed. Both structural systems are subjected to ground motions records. For the MDOF and the simplified systems, incremental dynamic analyses IDAs are developed in first place, then, structural demand hazard curves are obtained. The ratio between the IDAs curves corresponding to the MDOF systems and the curves corresponding to the simplified models are used to obtain deterministic response transformation factors. On the other hand, demand hazard curves are used to calculate probabilistic response transformation factors. It was found that both approaches give place to similar results.
Keywords: response transformation factors; maximum ductility; maximum interstory drift; steel frames; reliability-based seismic design 1. Introduction
The formulation of codified seismic design rules capable of leading to consistent reliability
levels for the most frequently used types of complex structural systems relies on the development of practically-applicable models for the estimation of their expected seismic failure rates. For very important or special systems, this can be achieved by means of studies of the dynamic response of nonlinear multi-degree-of-freedom and the corresponding equivalent single-degree-of-freedom
Edén Bojórquez, Juan Bojórquez, Sonia E. Ruiz, Alfredo Reyes-Salazar and Juan Velázquez-Dimas
systems. For cases typical of engineering practice, deterministic or probabilistic response transformation factors need to be estimated with the aid of simpler models (Bojórquez et al. 2005). The alternative studied here makes use of a deterministic simplified reference system or equivalent single-degree-of-freedom, together with a set of probabilistic transformation factors intended to account for uncertainties about structural properties and random characteristics of ground motion for given earthquake intensities, where the definition of a correct ground motion intensity is crucial to reduce the uncertainty in the structural response (Shome 1999, Baker and Cornell 2005, Cordova et al. 2001, Baker and Cornell 2008a, 2008b, Bojórquez et al. 2008, Wang and Zhu 2008, Bojórquez and Iervolino 2011). This paper presents values of medians and dispersions of those factors for maximum ductility and maximum interstory drift demands, as functions of a seismic intensity indicator, for several cases representative of those typical of modern urban construction. They include steel building frames from four to fourteen stories designed in accordance with the Mexico City Building Code, which were used in a previous study (Bojórquez et al. 2010). The first sample of seismic excitations was obtained from ground motions recorded on soft soil sites in Mexico City due to faults in subduction zones, and then several set of records from different type of soil were selected from the NGA database. The results presented also include a set of functions applicable to estimate the expected failure rates of the detailed models of the systems studied, through the corresponding equivalent single-degree-of-freedom systems. The transformation factors here proposed can be used for actual performance-based or reliability-based seismic design procedures as those proposed by Rivera and Ruiz (2007), Terán-Gilmore et al. (2010) or for the improvement toward the next generation of seismic design methodologies based on structural reliability. 2. Methodology to obtain response transformation factors
The evaluation of seismic performance of complex structures usually requires full nonlinear dynamic analysis to be carried out. To simplify this, it is convenient to estimate the seismic response by reducing the MDOF structures to equivalent single-degree-of-freedom systems through response transformation factors. If such transformation factors are available, the structural performance in a MDOF structure subjected to ground motion records can be estimated from the results derived from the nonlinear dynamic analysis of the equivalent SDOF system, or from earthquake response spectra, which usually are provided by the seismic design codes.
In this work, two approaches for obtaining response transformation factors are analyzed. The first case corresponds to deterministic response transformation factors which are obtained via incremental dynamic analysis (Vamvatsikos and Cornell 2002). The second case is the probabilistic response transformation factors calculated via the annual rate of exceeding a specific level of structural performance or the demand hazard curves. While the first approach compares the median values of the seismic response of several steel frames with their corresponding equivalent SDOF (where the probability of exceedance is not considered). The second approach do the same but comparing the demand hazard curves of both structural systems.
2.1 Evaluation of deterministic response transformation factors via incremental dynamic analysis
The aim of this approach is to compare the seismic response of multi-degree-of-freedom steel
Response transformation factors for deterministic-based and reliability-based seismic design
0
0.02
0.04
0.06
0.08
0.1
0 500 1000 1500 2000
Maxim
um interstory drift
Sa(T1) [cm/s2] Fig. 1 Example of incremental dynamic analysis
structures with equivalent single-degree-of-freedom systems. For this aim, the median values of the maximum ductility and maximum interstory drift for both systems are compared via incremental dynamic analysis. Fig. 1 illustrates a typical plot of the median values obtained by incremental dynamic analysis. In this figure it is observed the increasing in the maximum drift demand as the ground motion intensity measure increases. It is important to say that in this study the spectral acceleration at first mode of vibration Sa(T1) (here also named Sa) was selected as intensity measure. The implication of this issue is addressed below.
The first step to evaluate the structural demand in a MDOF structure subjected to seismic loading is to establish its equivalent SDOF system. Particularly, in this study it is proposed that the equivalent SDOF system has the same structural period, the seismic coefficient and the critical damping as that exhibited by the MDOF steel structure. After that, a nonlinear dynamic analysis is performed to evaluate the maximum ductility or maximum interstory drift demand developed by the equivalent SDOF system and the steel frame. Then, the maximum ductility deterministic transformation factor is estimated by means of Eq. (1), and the maximum interstory drift deterministic transformation factor is estimated using Eq. (2).
(1)
(2)
In Eqs. (1) and (2), TDμ and TDγ are the maximum ductility and interstory drift deterministic
transformation factors; MDOF (Sa) is the median ductility of the MDOF as function of the spectral
acceleration at first mode of vibration; MDOF (Sa) is the median ductility of the SDOF as function of the spectral acceleration; and finally the definition of the other parameters in Eq. (2) are similar but for the median maximum interstory drift ( ). Both deterministic response transformation factors will be obtained for several steel frames and ground motions records mentioned below.
)(
)(
Sa
SaT
SDOF
MDOFD
)(
)(
Sa
SaT
SDOF
MDOFD
Edén Bojórquez, Juan Bojórquez, Sonia E. Ruiz, Alfredo Reyes-Salazar and Juan Velázquez-Dimas
2.2 Evaluation of probabilistic response transformation factors The aim of the probabilistic approach is to compare the maximum seismic response of steel
frames with that of their equivalents systems; however, in this case the demand hazard curves are used for this purpose. Thus, the uncertainty associated with the structural response as well as all the possible interval of ground motion intensity levels in the site is considered (seismic hazard curves). In this case, the frames where supposed to be located in soft soil site of Mexico City.
It is well-known that most of seismic design codes are commonly based on the use of response spectra derived from SDOF systems with elasto-plastic behavior. However, the ductility and other relevant parameters (e.g., maximum interstory drift) in actual structures differ from those estimated through SDOF systems. As a consequence, it is desirable to consider the differences between the seismic demands in the MDOF structure and its corresponding SDOF model. This can be achieved through the use of SDOF to MDOF transformation factors as it was suggested before in the deterministic approach. Moreover, earthquake-resistant design codes do not guaranty the same level of annual exceedance rate between the SDOF systems and complex structures (Inoue and Cornell 1990, Esteva et al. 2005, Bojórquez et al. 2005). On the other side, the structures seismic design spectra or provisions recommended by the codes are not associated with structural reliability levels or prescribed annual exceedance rates (Cornell 1992, Wen 1995, Ghosh and Collins 2002, 2006). Some trends in the seismic design of structures suggest that earthquake spectra that take into account the structural reliability must be used (Ghosh and Collins 2006, Rivera and Ruiz 2007, Bojórquez and Rivera 2008); nevertheless, for recommending the use of this type of spectra, it should be available tools that allows the use of SDOF system to represent the performance of complex structures but associated to similar reliability levels; that is, factors that relate both responses for the same probability of exceeding certain structural response parameter. Those factors are named in the present work probabilistic response transformation factors. These factors are estimated using structural demand hazard curves which are described below and they are illustrated in Fig. 2, where dSDOF and DMDOF represent the structural demand for the single and the multi-degree-of-freedom systems, and λ is the annual rate of exceeding the structural demand, finally ln indicates natural logarithm. The probabilistic response transformation factors for maximum ductility and maximum interstory drift are obtained via Eqs. (3) and (4). Note that both systems are associated to the same structural reliability. The evaluation of the structural reliability by means of the demand hazard curves is described in the next part. The parameters in Eqs. (3) and (4) have the same meaning of Eqs. (1) and (2), except that in this case the ductility and interstory drift demands are variables that depend of the mean annual rate of exceeding the structural demand, instead of the spectral acceleration at first mode of vibration (intensity measure).
(3)
(4)
)(
)(
SDOF
MDOFPT
)(
)(
SDOF
MDOFPT
Response transformation factors for deterministic-based and reliability-based seismic design
Fig. 2 Example of the structural demand hazard curves for a frame and its corresponding equivalent SDOF system
2.3 Evaluation of structural reliability
One of the main objectives of Earthquake Engineering is to quantify, through the consideration
of all possible earthquake ground motion intensities at a site, the seismic reliability implicit in structures. Probabilistic Seismic Demand Analysis (PSDA) is used as a tool for estimating the reliability of structures through the evaluation of the mean annual frequency of exceeding a specified value of an engineering demand parameter EDP (e.g., maximum ductility and maximum inter-story drift). Based on past studies and considering the total probability theorem, a probabilistic seismic demand analysis can be carried out through the consideration of the mean annual rate of exceeding a given value of EDP
)(,,|,,|)( imddmdrRMfRMIMfRMIMxEDPPxIMM R
iEDP (5)
where λEDP(x) is the mean annual rate of EDP exceeding the value x, νi is the rate of earthquakes for source i, f(IM | M, R) is the conditional distribution function of the intensity measure (IM) given values of magnitude (M) and distance (R), f(M, R) is the joint probability density function of M and R, and finally, P[EDP > x | IM, M, R] is the probability of EDP exceeding x given IM, M and R (if x corresponds to the capacity of the structure, this term represents the fragility curve of the system). If P[EDP > x | IM, M, R] = P[EDP > x | IM], then the IM is said to be sufficient (Shome 1999) since its ability to predict the structural response is independent of M and R, given IM. It has been shown that the spectral acceleration at first mode of vibration Sa(T1) is sufficient with respect to magnitude and distance (Shome 1999). However, it is important to point out that under some circumstances Sa(T1) is not a good predictor of nonlinear structural response, and more appropriate IM measures are necessary (especially those related with the elastic spectral shape of the acceleration spectrum). For example, the vector <Sa, ε>, which is related to the elastic spectral shape, has resulted sufficient and efficient in many cases (Baker and Cornell 2005). Other such measures include the advanced scalar IM proposed by (Tothong and Luco 2007); the vector IM <Sa, RT1,T2> (Baker and Cornell 2008a); and the vector <Sa, Np> (Bojórquez and Iervolino 2011).
The records used herein allow the use of a scaling criteria based on Sa(T1): A) First, due to sufficiency of Sa(T1) with respect to M and R; and B) Second, due to the similar spectral shape of the records, because the ground motion records selected have similar values of Np; and C) The
ln()
ln()
Edén Bojórquez, Juan Bojórquez, Sonia E. Ruiz, Alfredo Reyes-Salazar and Juan Velázquez-Dimas
property known as scaling robustness is satisfied, and this is valid although significant bias usually occurs when increasing nonlinear structural behavior, Bojórquez et al. (2011) demonstrated that for scale factors in a range of 1 to 100, no significant bias occurs for important levels of nonlinear behavior (ductility demands up to six) if the records are selected with similar values of Np. Within this context, Eq. (5) can be expressed as
)(
)(1
1
1)()(|)(
TS
aTSaaEDP
a
asdsTSxEDPPx (6)
where )()()( )()()( 111 aaTSaTSaTS dssssdaaa
is the hazard curve differential expressed in terms
of Sa(T1). Eq. (6) was used to evaluate the structural reliability demand hazard curves of the steel frames in terms of two EDPs: ductility and interstory drift. If a lognormal distribution is considered to evaluate P[EDP > x | Sa], the probability that EDP exceeds x given Sa(T1) is given by
asTaSEDP
asTaSEDP
aa
xsTSxEDPP
)1(|ln
)1(|ln
1 ˆ
ˆln1)(|
(7)
In Eq. (7), aa sTSEDP )(|ln 1
and aa sTSEDP )(|ln 1
are the sample mean and standard deviation for ln
EDP, respectively, and Φ(·) is the standard normal cumulative distribution function. It has been shown that maximum interstory drift has been found to be well represented by a lognormal distribution (Baker and Cornell 2005), and for this reason this probability density function was considered in the present study. 3. Response transformation factors: application
The two approaches described before to obtain response transformation factors are applied to five regular steel frames designed according to the Mexico City Building Code and subjected to 30 soft-soil ground motions recorded in the Lake Zone of Mexico City and exhibiting a dominant period (Ts) of two seconds. Particularly, all motions were recorded in Mexico City during seismic events with magnitudes near of 7 or larger. Table 1 summarizes the principal characteristics of the seismic records under consideration. In this table, while PGA and PGV stand for the peak ground acceleration and velocity, tD is the strong-motion duration estimated according to the Trifunac and Brady (1975) criterion, which is defined as the time interval delimited by the instants of time at which the 5% and 95% of the Arias Intensity occurs. Note that the average duration of the records equals 74.4 sec.
The frames, which were assumed to be used for office occupancy, have three bays of 8 m and a number of levels that range from four to eighteen. The story height is 3.5 m. The frames were designed for ductile detailing. A36 steel and W sections were used for the beams and columns of the frames. A two dimensional, lumped plasticity nonlinear model of each frame was prepared and analyzed. For this purpose, an elasto-plastic model with 3% strain-hardening was used to represent the cyclic behavior of the steel beams and columns. As discussed by Bojórquez and Rivera (2008), this model provides a good approximation to the actual hysteretic behavior of steel members. The columns in the first story were modeled as fixed at their bases and the beam-column connections were assumed to be rigid. Second order effects were explicitly considered. Time-history analyses
Response transformation factors for deterministic-based and reliability-based seismic design
were carried out for each frame. In the analyses, the first two modes of vibration were assigned 3% of critical damping. Relevant characteristics for each frame, such as the fundamental period of vibration (T1), and the seismic coefficient and displacement at first yield (Cy and Dy) are shown in Table 2 (the latter two values were established from static nonlinear analyses). Note that the frames exhibit a wide range of periods.
Edén Bojórquez, Juan Bojórquez, Sonia E. Ruiz, Alfredo Reyes-Salazar and Juan Velázquez-Dimas
0
3
6
9
12
15
0 500 1000 1500 2000
Maxim
um ductility
Sa(T1) [cm/s2]
Frame F4
Equivalent SDOF
Fig. 3 Incremental dynamic analysis for frame F4 and the equivalent system
0
0.1
0.2
0.3
0.4
0.5
0 500 1000 1500 2000
Standard deviation of
maxim
um ductility
Sa(T1) [cm/s2]
Frame F6
Equivalent SDOF
Fig. 4 Standard deviation of maximum ductility for frame F6 and the equivalent SDOF system
The results obtained for the deterministic case are compared herein. First, the incremental
dynamic analyses of frame F4 and its corresponding equivalent SDOF systems are illustrated in Fig. 3. The results suggest that both systems have very similar structural ductility demand for the wide range of ground motion intensities considered. Fig. 4 compares for Frame F6 and its respective equivalent SDOF system, the standard deviation of the ln of maximum ductility demand, where the uncertainty in the maximum ductility demand is approximately the same for both system, and this is valid for the other structures under consideration. Therefore, in Fig. 5 the deterministic ductility transformation factor are quite similar and around 0.8 for all the spectral acceleration values used. This lack of dependence with respect to the intensity levels also is valid for the other frames as it is observed in Fig. 6 for frame F8. Note that for this frame the ductility response transformation factor is almost constant and practically equals unity for all the spectral acceleration values. In all the cases the ductility demand was moderately larger for the equivalent SDOF. These results indicate that the maximum ductility demand in a steel frame can be obtained
Response transformation factors for deterministic-based and reliability-based seismic design
0
0.5
1
1.5
2
0 500 1000 1500 2000
TD
Sa(T1) [cm/s2]
Deterministic Ductility Factor
Fig. 5 Deterministic ductility transformation factor for Frame F4
0
0.5
1
1.5
2
0 500 1000 1500 2000
TD
Sa(T1) [cm/s2]
Deterministic Ductility Factor
Fig. 6 Deterministic ductility transformation factor for Frame F8
Table 3 Summary of the average deterministic maximum ductility transformation factors
Frame Number of Stories T1 (s) TDμ F4 4 0.90 0.80 F6 6 1.07 0.85 F8 8 1.20 0.90
F10 10 1.37 0.90 F14 14 1.91 0.92
with good accuracy using equivalent SDOF. Table 3 summarizes the average values obtained for the maximum ductility transformation factors and the frames analyzed. It is observed that the ductility transformation factors are close to one for all the frames and tend to increase as the structural period is larger.
The results corresponding to maximum interstory drift transformation factors are presented in what follows. Only the results of Frame F6 are shown in Fig. 7 for the sake of brevity. Nevertheless, the summary of the average results are shown in Table 4. In first place, in Fig. 7 there are observed values of TDγ in the range of 1.4 to 1.6, indicating that there is no significant influence of the intensity level of the ground motions as in the case of maximum ductility.
Edén Bojórquez, Juan Bojórquez, Sonia E. Ruiz, Alfredo Reyes-Salazar and Juan Velázquez-Dimas
0
0.5
1
1.5
2
0 500 1000 1500 2000
TD
Sa(T1) [cm/s2]
Deterministic Drift Factor
Fig. 7 Deterministic interstory drift transformation factor for Frame F6 Table 4 Summary of the average deterministic maximum interstory drift transformation factors
Frame Number of Stories T1 (s) TDγ F4 4 0.90 1.40 F6 6 1.07 1.53 F8 8 1.20 1.64 F10 10 1.37 1.61 F14 14 1.91 1.83
However, for the drift case, the structural demand is larger in the MDOF steel frame compared with the simplified model. Table 4 summarizes the average values of TDγ the frames under consideration. The results suggest that as the number of stories or structural vibration period of the frames increases, the drift transformation factor increases too. In this case the difference between the structural response of the frames and the simplified models is larger compared with the case of ductility demands (where the response is approximately equal). The most important conclusion is that the results suggest in general a value around 0.9 for deterministic maximum ductility transformation factor, and 1.6 for maximum interstory drift transformation factor.
The probabilistic response transformation factor for maximum ductility and maximum interstory drift are summarized for all the frames in Figs. 8 and 9. Several conclusions can be obtained from these figures. First, the results of the probabilistic approach are quite similar to those results obtained for the deterministic case. In particular, note that the probabilistic transformation factors for both structural demands are similar for the wide range of mean annual rate of exceeding a specific performance level, and the factors tend to increase with the stories or the vibration period. The probabilistic ductility transformation factor lies in the interval of 0.8 to 1.0 in such a way that a value of 0.9 is strongly recommended for this factor as will be observed in the average results. It suggests that the maximum ductility can be estimated via SDOF systems with good accuracy. Moreover, the use of response spectra for reliability-based earthquake resistant design is a good alternative to evaluate the structural performance of multi-degree of freedom steel frames for the case of ductility. On the other hand, the maximum interstory drift
Response transformation factors for deterministic-based and reliability-based seismic design
0
0.5
1
1.5
2
0.0001 0.001 0.01 0.1
TPµ
µ(µ)
T‐F4 T‐F6
T‐F8 T‐F10
T‐F14
Fig. 8 Probabilistic ductility transformation factors (TDμ) related to different exceedance rates and all the frames
0
0.5
1
1.5
2
0.0001 0.001 0.01 0.1
TPγ
γ(γ)
T‐F4 T‐F6
T‐F8 T‐F10
T‐F14
Fig. 9 Probabilistic interstory drift transformation factors (TDγ) related to different exceedance rates and all the frames
Table 5 Summary of the average probabilistic maximum ductility transformation factors
Frame Number of Stories T1 (s) TPμ F4 4 0.90 0.73 F6 6 1.07 0.88 F8 8 1.20 0.92 F10 10 1.37 0.90 F14 14 1.91 0.97
transformation factors lie in a range of 1.4 to 1.8 and a value of 1.6 (as in the case of deterministic factors) seems adequate. Tables 5 and Table 6 summarizes the average values obtained in all the frames for ductility and interstory drift. It is important to say that for the deterministic case and the probabilistic approach, the results obtained were practically the same, indicating that response spectra for deterministic-based or reliability-based design for ductility can be used successfully only by reducing the spectrum by a transformation factor. Figs. 10 and 11 compare the average results obtained by the two approaches here presented.
Edén Bojórquez, Juan Bojórquez, Sonia E. Ruiz, Alfredo Reyes-Salazar and Juan Velázquez-Dimas
0.5
0.6
0.7
0.8
0.9
1
0.5 0.6 0.7 0.8 0.9 1
TP
TDFig. 10 Comparison of the average maximum ductility transformation factors obtained in the analyses
1
1.2
1.4
1.6
1.8
2
1 1.2 1.4 1.6 1.8 2
TP
TDFig. 11 Comparison of the average maximum interstory drift transformation factors obtained in the analyses
Table 6 Summary of the average probabilistic maximum interstory drift transformation factors
Frame Number of Stories T1 (s) TPγ F4 4 0.90 1.41 F6 6 1.07 1.46 F8 8 1.20 1.57
F10 10 1.37 1.56 F14 14 1.91 1.77
4. Influence of fault distance, fault mechanism and soil type on the response transformation factors
To observe the influence of source parameters on the estimation of response transformation factors, a total of 100 ground motion records obtained from the NGA database, corresponding to
Response transformation factors for deterministic-based and reliability-based seismic design
Fig. 12 Moment magnitude and epicentral distance distribution for the selected 100 records taken from the NGA database
worldwide earthquakes, were used for the analyses of the steel frame buildings. The records used in this section were selected from earthquakes with moment magnitudes (Mw) ranging from 6.0 to 7.9, and they have been taken from sites at different epicentral distances. The selected magnitudes
Edén Bojórquez, Juan Bojórquez, Sonia E. Ruiz, Alfredo Reyes-Salazar and Juan Velázquez-Dimas
10 Loma Prieta 6.93 64.02 3 262.5 25.511 Morgan Hill 6.19 54.32 0 44.9 3.412 Morgan Hill 6.19 52.16 0 39.9 2.613 Loma Prieta 6.93 90.77 3 263.2 22.014 Loma Prieta 6.93 65.72 3 104.9 20.615 Kobe, Japan 6.9 43.58 0 174.2 36.416 Kobe, Japan 6.9 52.21 0 209.8 26.317 Kobe, Japan 6.9 19.25 0 308.8 74.918 Kobe, Japan 6.9 42.11 0 154.2 16.919 Kobe, Japan 6.9 13.12 0 599.8 127.220 Nenana Mountain 6.7 283.27 0 6.9 1.3
are representative of moderate and large earthquakes. The distribution of the records in terms of moment magnitude and distance is provided in Fig. 12. In this figure, it can be observed that the
Edén Bojórquez, Juan Bojórquez, Sonia E. Ruiz, Alfredo Reyes-Salazar and Juan Velázquez-Dimas
Fig. 13 Influence of soil type on the estimation of interstory drift transformation factors for Frame F4
records were obtained for different distances and from different events as moment magnitudes indicate; the wide range of the selected distances and magnitudes is very important to observe the influence of these parameters on the assessment of response transformation factors.
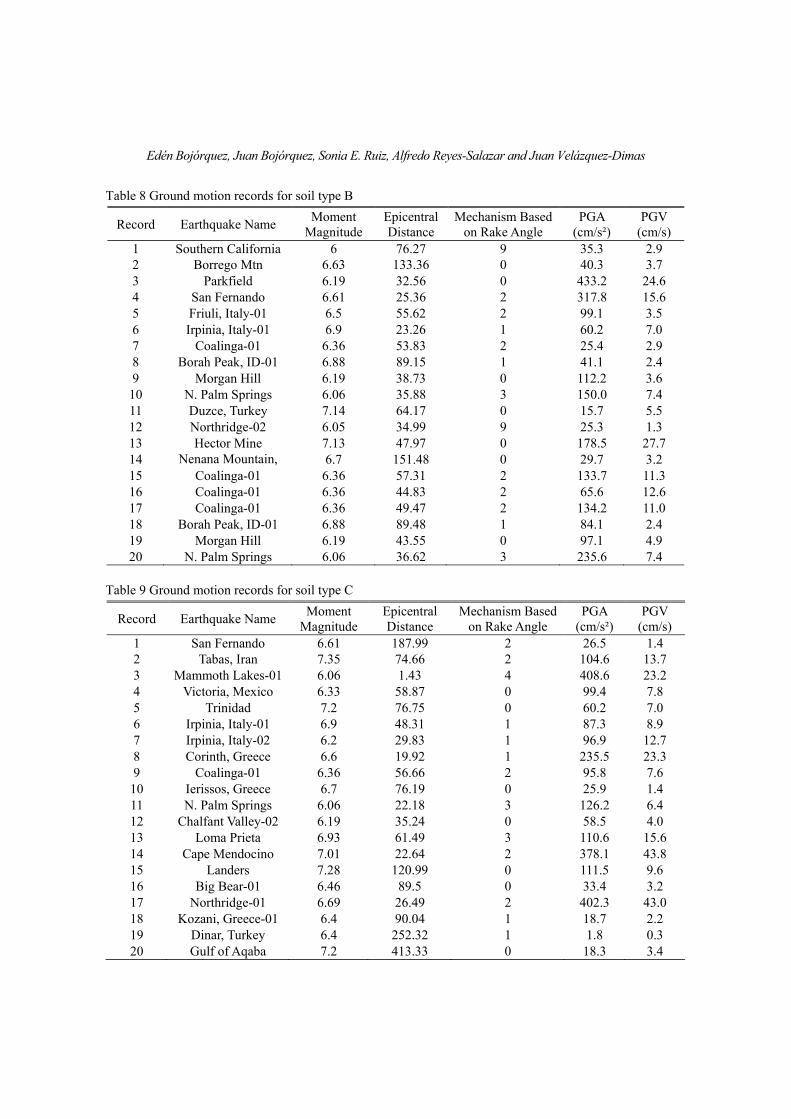
Tables 7 through 11 summarize the main characteristics of the seismic records used in this study (corresponding to all type of soil zones in accordance with the Geomatrix's Classification GMX's C3). Soil type A corresponds to rock and soil type E to soft soil. A total of 20 records were chosen for each type of soil as can be illustrated in the tables. The selected ground motion records were generated by different failure mechanisms: Strike-Slip (0), Normal (1), Reverse (2), Reverse-Oblique (3), Normal-Oblique (4), and Undefined (9). In the tables, the first column refers to the record number, the second and third columns correspond to the earthquake name and moment magnitude of the event, the fourth column refers to the epicentral distance, the fifth is the failure mechanism, and the last columns are the peak ground acceleration and velocity.
Firstly, the influence of soil type on interstory drift transformation factors is evaluated. For this aim, the set of records corresponding to different type of soil are scaled at different intensities in terms of spectral acceleration at first mode of vibration. The average interstory drift transformation factors for the frame F4 and its equivalent system subjected to the earthquake ground motions are illustrated in Fig. 13 for the selected soil types. The results suggest that the interstory drift transformation factors are very similar to those obtained for the same frame subjected to soft soil records of Mexico City. Values in the range of 1.3 to 1.9 are obtained, and the most important conclusion is that no influence of the type of soil is observed in the interstory drift transformation factors, which suggest that the results previously obtained are valid for all the type of soils. To observe the effects of fault mechanism and fault distance on the estimation of interstory drift transformation factors for Frame F4 and its equivalent system, different sets of ground motions were selected from the 100 records previously defined. The influence of fault mechanism was estimated using four set of records selected according with the type of fault including all the
Response transformation factors for deterministic-based and reliability-based seismic design
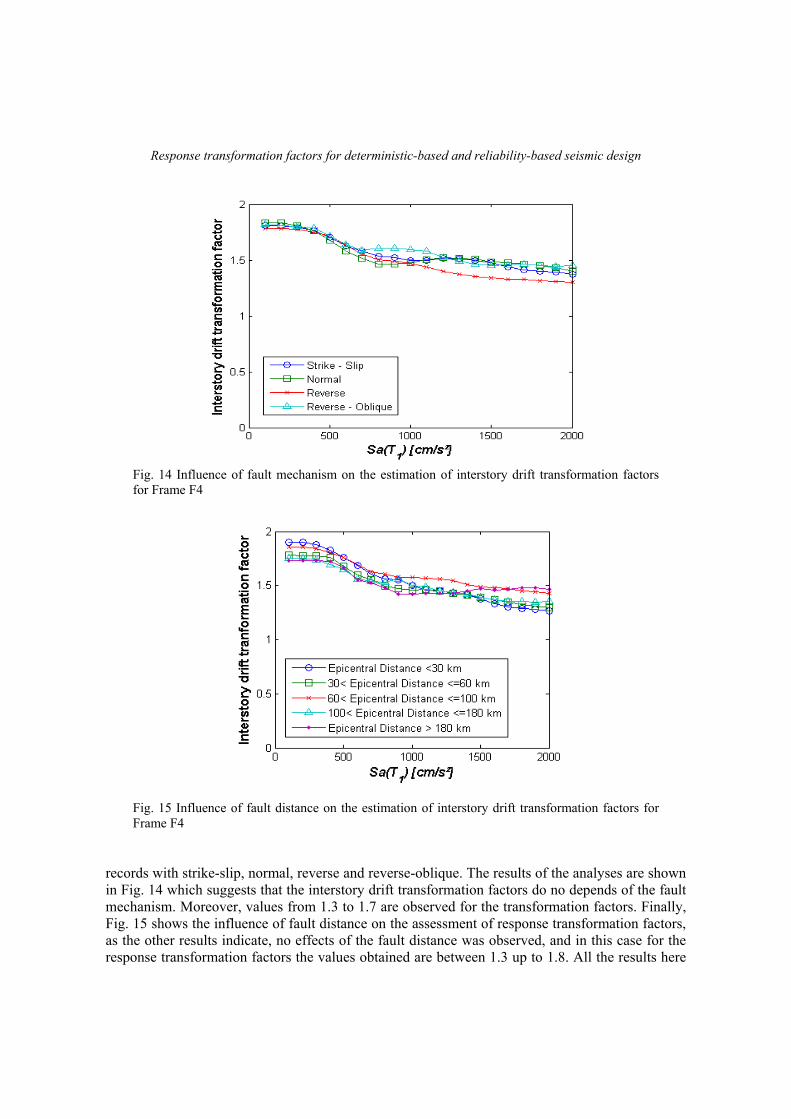
Fig. 14 Influence of fault mechanism on the estimation of interstory drift transformation factors for Frame F4
Fig. 15 Influence of fault distance on the estimation of interstory drift transformation factors for Frame F4
records with strike-slip, normal, reverse and reverse-oblique. The results of the analyses are shown in Fig. 14 which suggests that the interstory drift transformation factors do no depends of the fault mechanism. Moreover, values from 1.3 to 1.7 are observed for the transformation factors. Finally, Fig. 15 shows the influence of fault distance on the assessment of response transformation factors, as the other results indicate, no effects of the fault distance was observed, and in this case for the response transformation factors the values obtained are between 1.3 up to 1.8. All the results here
Edén Bojórquez, Juan Bojórquez, Sonia E. Ruiz, Alfredo Reyes-Salazar and Juan Velázquez-Dimas
discussed for frame F4 are valid for other structural frame models which were omitted for the sake of brevity. In conclusion, the response transformation factors are independent of the fault mechanism, fault distance and type of soil, at least for the cases under consideration in the present work. 5. Conclusions
Two approaches to represent the structural demand in terms of maximum ductility and maximum interstory drift of multi-degree of freedom steel frames by means of equivalent SDOF systems were introduced. While the first procedure is based on a deterministic consideration, the second is based on a probabilistic alternative. The results suggest that in both approaches, the structural demand of steel frames can be obtained with good accuracy by means of equivalent SDOF systems. No significant influence in the response transformation factors was observed with the level of intensity or the level of mean annual rate of exceedance in the probabilistic approach. The most important observation is that in the deterministic and in the probabilistic case in general the results in terms of ductility and interstory drift transformation factors are very similar. The last observation indicates that deterministic seismic response spectra as well as response spectra for reliability-based design can be used for earthquake resistant design purposes of steel frames, if the correct response transformation factors are used. Finally, the analyses of the structural frames and the equivalent SDOF systems under earthquake ground motions taken from different soil type, and source characteristics, let conclude that no influence of the type of soil, fault mechanism and fault distance is observed on the estimation of the interstory drift transformation factors. Acknowledgments
The support given by El Consejo Nacional de Ciencia y Tecnología to the first author under grant CB-2011-01-167419 and the scholarship to the second author is appreciated. Financial support also was received from the Universidad Autónoma de Sinaloa under grant PROFAPI 2012/026 and from the Universidad Nacional Autónoma de México under project PAPIIT-IN107011. Finally, the authors wish to express their gratitude to the anonymous reviewers that helped to improve the quality of the paper.
References Baker, J.W. and Cornel, C.A. (2005), “A vector-valued ground motion intensity measure consisting of
spectral acceleration and epsilon”, Earthquake Engineering and Structural Dynamics, 34, 1193-1217. Baker, J.W. and Cornel, C.A. (2008a), “Vector-valued intensity measures for pulse-like near-fault ground
motions”, Engineering Structures, 30(4), 1048-1057. Baker, J.W. and Cornel, C.A. (2008b), “Vector-valued intensity measures incorporating spectral shape for
prediction of structural response”, Journal of Earthquake Engineering, 12(4), 534-554. Bojórquez, E., Ruiz, S.E. and Esteva, L. (2005), “Maximum response transformation factors between
structural frames and equivalent SDOF for similar failure rates”, XV Congreso Nacional de Ingeniería Sísmica, Ciudad de México. (In Spanish)
Bojórquez, E., Iervolino, I. and Manfredi, G. (2008), “Evaluating a new proxy for spectral shape to be used
Response transformation factors for deterministic-based and reliability-based seismic design
as an intensity measure”, The 2008 Seismic Engineering Conference Commemorating the 1908 Messina and Reggio Calabria Earthquake (MERCEA ‘08).
Bojórquez, E. and Rivera, J.L. (2008), “Effects of degrading models for ductility and dissipated hysteretic energy in uniform annual failure rate spectra”, The 14th World Conference on Earthquake Engineering, Beijing, China.
Bojórquez, E., Reyes-Salazar, A., Terán-Gilmore, A. and Ruiz, S.E. (2010), “Energy-based damage index for steel structures”, Steel and Composite Structures, 10(4), 343-360.
Bojórquez, E. and Iervolino, I. (2011), “Spectral shape proxies and nonlinear structural response”, Soil Dynamics and Earthquake Engineering, 31(7), 996-1008.
Bojórquez, E., Terán-Gilmore, A., Ruiz, S.E. and Reyes, A. (2011), “Evaluation of structural reliability of steel frames: interstory drifts versus plastic hysteretic energy”, Earthquake Spectra, 27(3), 661-682.
Cordova, P.P., Dierlein, G.G., Mehanny, S.S.F. and Cornell, C.A. (2001), “Development of a two parameter seismic intensity measure and probabilistic assessment procedure”, The second U.S.-Japan Workshop on Performance-Based Earthquake Engineering Methodology for Reinforce Concrete Building Structures, Sapporo, Hokkaido, 187-206.
Cornell, C.A. (1992), “Reliability-based earthquakeresistant design: the future”, 11th World Conference on Earthquake Engineering, Balkema Rotterdam 1992, Paper No. 2166.
Esteva, L., Ruiz, S.E. and Rivera, J. (2005), “Reliability and performance-based seismic design of structures with energy-dissipating devices”, 9th World Seminar on Seismic Isolation, Energy Dissipation and Active Vibration Control of Structures, Kobe, Japan.
Ghosh, S. and Collins, K.R. (2002), “Application of uniform hazard energy spectra in reliabilitybased seismic design”, 7th U.S. National Conference on Earthquake Engineering.
Ghosh, S. and Collins, K.R. (2006), “Merging energy-based design criteria and reliability-based methods: exploring a new concept”, Earthquake Engineering and Structural Dynamics, 35(13), 1677-1698.
Inoue, T. and Cornell, C.A. (1990), “Seismic hazard analysis of multi-degree-of-freedom structures”, Reliability of marine structures, RMS-8, Stanford, California.
Rivera, J.L. and Ruiz, S.E, (2007), “Design approach based on UAFR spectra for structures with displacement-dependent dissipating elements”, Earthquake Spectra, 23, 417-439.
Shome, N. (1999), “Probabilistic seismic demand analysis of nonlinear structures”, Ph.D. Thesis, Stanford University.
Terán-Gilmore, A., Sánchez-Badillo, A. and Espinosa Johnson, M. (2010), “Performance-based seismic design of reinforced concrete ductile buildings subjected to large energy demands”, Earthquakes and Structures, 1(1), 69-91.
Tothong, P. and Luco, N. (2007), “Probabilistic seismic demand analysis using advanced ground motion intensity measures”, Earthquake Engineering and Structural Dynamics, 36, 1837-1860.
Trifunac, M.D. and Brady, A.G. (1975), “A study of the duration of strong earthquake ground motion”. Bulletin of the Seismological Society of America, 65(3), 581-626.
Vamvatsikos, D. and Cornell, C.A. (2002), “Incremental dynamic analysis”, Earthquake Engineering and Structural Dynamics, 31, 491-514.
Wang, J. and Zhu, X. (2008), “Correlation study between ground motion intensity measure parameters and deformation demands for bilinear SDOF systems”, Acta Seismologica Sinica, 19(1), 78-86.