+ All Categories
Home > Documents > RESPONSE VARIATION OF CHLADNI PATTERNS ON VIBRATING ...

RESPONSE VARIATION OF CHLADNI PATTERNS ON VIBRATING ...

Date post: 13-Feb-2022
Category:
Upload: others
View: 3 times
Download: 0 times
Share this document with a friend
9
* Corresponding author, tel: +234 – 902 – 477 – 3812 RESPONSE VARIATION OF CHLADNI PATTERNS ON VIBRATING ELASTIC PLATE UNDER ELECTRO-MECHANICAL OSCILLATION A. E. Ikpe 1,* , A. E. Ndon 2 and E. M. Etuk 3 1, DEPT OF MECHANICAL ENGINEERING, UNIVERSITY OF BENIN, P.M.B. 1154, BENIN, EDO STATE, NIGERIA 2, DEPT OF CIVIL ENGINEERING, AKWA IBOM STATE UNIVERSITY, MKPAT ENIN, AKWA IBOM STATE, NIGERIA 3, DEPT OF PRODUCTION ENGINEERING, UNIVERSITY OF BENIN, P.M.B. 1154, BENIN, EDO STATE, NIGERIA E-mail addresses: 1 [email protected], 2 [email protected], 3 [email protected] ABSTRACT Fine grain particles such as sugar, sand, salt etc. form Chladni patterns on the surface of a thin plate subjected to acoustic excitation. This principle has found its relevance in many scientific and engineering applications where the displacement or response of components under the influence of vibration is vital. This study presents an alternative method of determining the modal shapes on vibrating plate in addition to other existing methods like the experimental method by Ernst Chladni. Three (3) finite element solvers namely: CATIA 2017 version, ANSYS R15.0 2017 version and HYPERMESH 2016 version were employed in the modelling process of the 0.40 mm x 0.40 mm plate and simulation of corresponding mode shapes (Chladni patterns) as well as the modal frequencies using Finite Element Method (FEM). Result of modal frequency obtained from the experimental analysis agreed with the FEM simulated, with HYPERMESH generated results being the closest to the experimental values. It was observed that the modal frequencies obtained from the FEM and experimental approach increased as the excitation time increased. ANSYS R15.0 and HYPERMESH software clearly represented the modal lines and mode shapes for each frequency which CATIA software was somewhat limited. This study has shown that FEM is an effective tool that can save time and energy invested in acoustic experiments in determining modal frequencies and patterns. Keywords: Vibration, Chladni patterns, Modal frequency, Thin plate, Experimental analysis 1. INTRODUCTION Visualization of patterns formed on an acoustically excited thin plate under the influence of a vibrator can be achieved when fine sand, grains of sugar etc. are deposited on the plate surface during vibration. This great invention had its publicity in early 1787 when Ernst Chladni found that fine grain particles on the plate surface can rearrange themselves into aesthetically developed patterns [1, 2]. Despite their aesthetics and artistic beauty, Chladni patterns have applications in vibration of flat plates, construction of musical instruments such as violins, guitars, speakers etc. [3, 4]. Application of Chladni’s method further indicate that plates with different shapes under the influence of vibration can present diverse patterns on the surface of the plate. The natural frequencies at which thin plates vibrate is vital to the visualization of nodal lines formed by the Eigen modes. The ideal method of analysing these patterns is by solving the inhomogeneous Helmholtz equation using proper boundary conditions. However, it is difficult and time consuming to accurately employ this method, particularly in the case of vibrating plates with irregular open boundaries [5]. For example, Amore [6] computed a method for solving the Helmholtz equation using mathematical relation known as “little sinc functions” which was only applicable to irregular and/or inhomogeneous membrane with fixed boundary conditions. According to Owunna et al. [7] estimating the natural frequencies of vibrating plate is an aspect of dynamic analysis, referred to as eigenvalue analyses. While the frequencies are Nigerian Journal of Technology (NIJOTECH) Vol. 38, No. 3, July 2019, pp. 540 – 548 Copyright© Faculty of Engineering, University of Nigeria, Nsukka, Print ISSN: 0331-8443, Electronic ISSN: 2467-8821 www.nijotech.com http://dx.doi.org/10.4314/njt.v38i3.1
Transcript

* Corresponding author, tel: +234 – 902 – 477 – 3812

RESPONSE VARIATION OF CHLADNI PATTERNS ON VIBRATING

ELASTIC PLATE UNDER ELECTRO-MECHANICAL OSCILLATION

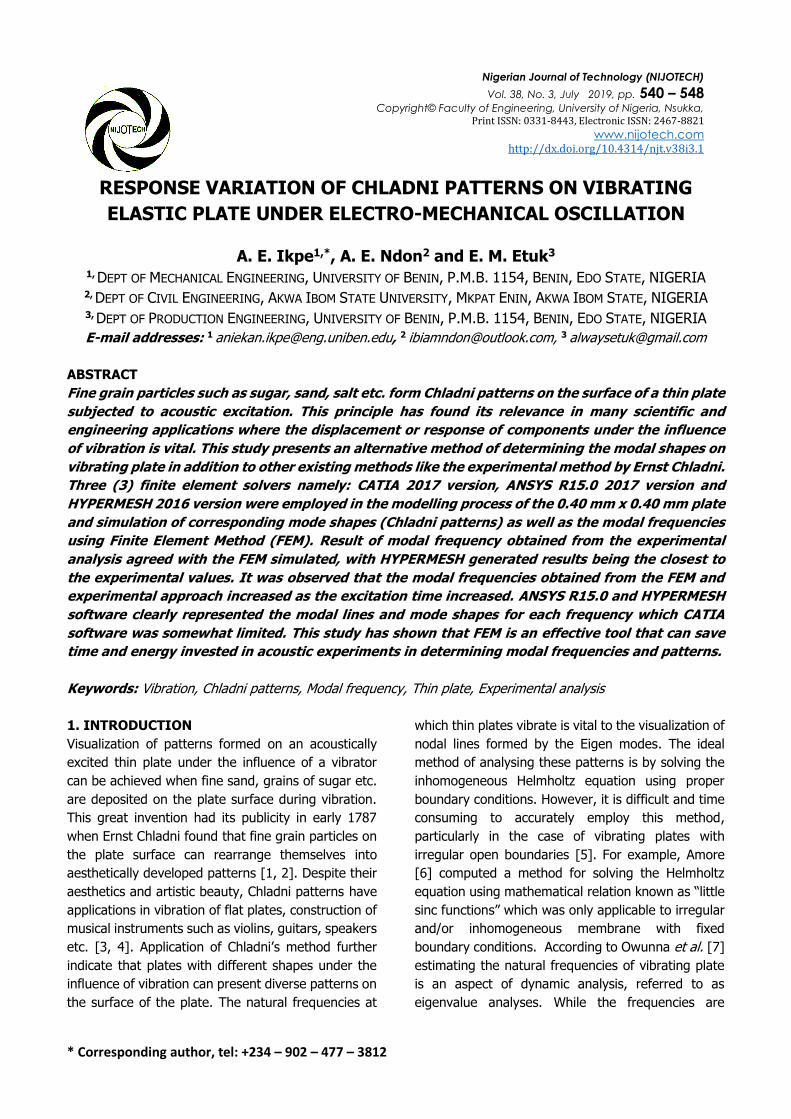
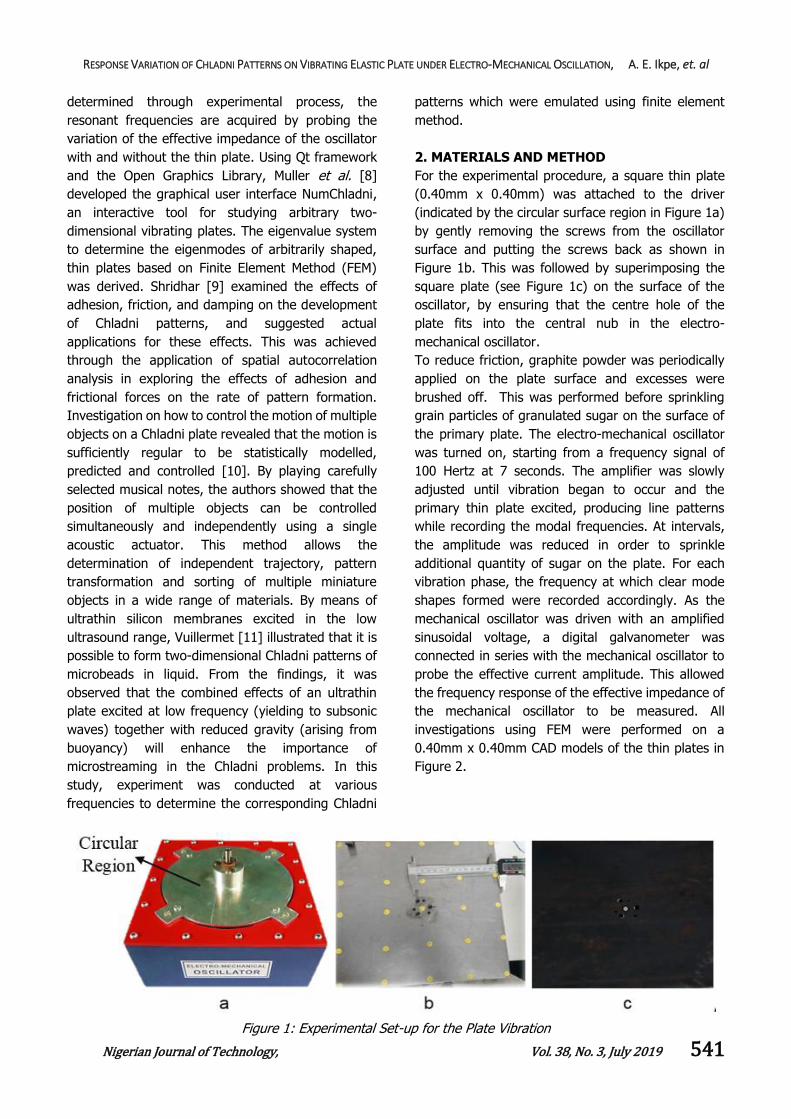
A. E. Ikpe1,*, A. E. Ndon2 and E. M. Etuk3 1, DEPT OF MECHANICAL ENGINEERING, UNIVERSITY OF BENIN, P.M.B. 1154, BENIN, EDO STATE, NIGERIA 2, DEPT OF CIVIL ENGINEERING, AKWA IBOM STATE UNIVERSITY, MKPAT ENIN, AKWA IBOM STATE, NIGERIA 3, DEPT OF PRODUCTION ENGINEERING, UNIVERSITY OF BENIN, P.M.B. 1154, BENIN, EDO STATE, NIGERIA

E-mail addresses: 1 [email protected], 2 [email protected], 3 [email protected]

ABSTRACT

Fine grain particles such as sugar, sand, salt etc. form Chladni patterns on the surface of a thin plate

subjected to acoustic excitation. This principle has found its relevance in many scientific and

engineering applications where the displacement or response of components under the influence

of vibration is vital. This study presents an alternative method of determining the modal shapes on

vibrating plate in addition to other existing methods like the experimental method by Ernst Chladni.

Three (3) finite element solvers namely: CATIA 2017 version, ANSYS R15.0 2017 version and

HYPERMESH 2016 version were employed in the modelling process of the 0.40 mm x 0.40 mm plate

and simulation of corresponding mode shapes (Chladni patterns) as well as the modal frequencies

using Finite Element Method (FEM). Result of modal frequency obtained from the experimental

analysis agreed with the FEM simulated, with HYPERMESH generated results being the closest to

the experimental values. It was observed that the modal frequencies obtained from the FEM and

experimental approach increased as the excitation time increased. ANSYS R15.0 and HYPERMESH

software clearly represented the modal lines and mode shapes for each frequency which CATIA

software was somewhat limited. This study has shown that FEM is an effective tool that can save

time and energy invested in acoustic experiments in determining modal frequencies and patterns.

Keywords: Vibration, Chladni patterns, Modal frequency, Thin plate, Experimental analysis

1. INTRODUCTION

Visualization of patterns formed on an acoustically

excited thin plate under the influence of a vibrator

can be achieved when fine sand, grains of sugar etc.

are deposited on the plate surface during vibration.

This great invention had its publicity in early 1787

when Ernst Chladni found that fine grain particles on

the plate surface can rearrange themselves into

aesthetically developed patterns [1, 2]. Despite their

aesthetics and artistic beauty, Chladni patterns have

applications in vibration of flat plates, construction of

musical instruments such as violins, guitars, speakers

etc. [3, 4]. Application of Chladni’s method further

indicate that plates with different shapes under the

influence of vibration can present diverse patterns on

the surface of the plate. The natural frequencies at

which thin plates vibrate is vital to the visualization of

nodal lines formed by the Eigen modes. The ideal

method of analysing these patterns is by solving the

inhomogeneous Helmholtz equation using proper

boundary conditions. However, it is difficult and time

consuming to accurately employ this method,

particularly in the case of vibrating plates with

irregular open boundaries [5]. For example, Amore

[6] computed a method for solving the Helmholtz

equation using mathematical relation known as “little

sinc functions” which was only applicable to irregular

and/or inhomogeneous membrane with fixed

boundary conditions. According to Owunna et al. [7]

estimating the natural frequencies of vibrating plate

is an aspect of dynamic analysis, referred to as

eigenvalue analyses. While the frequencies are

Nigerian Journal of Technology (NIJOTECH)

Vol. 38, No. 3, July 2019, pp. 540 – 548

Copyright© Faculty of Engineering, University of Nigeria, Nsukka, Print ISSN: 0331-8443, Electronic ISSN: 2467-8821

www.nijotech.com

http://dx.doi.org/10.4314/njt.v38i3.1

RESPONSE VARIATION OF CHLADNI PATTERNS ON VIBRATING ELASTIC PLATE UNDER ELECTRO-MECHANICAL OSCILLATION, A. E. Ikpe, et. al

Nigerian Journal of Technology, Vol. 38, No. 3, July 2019 541

determined through experimental process, the

resonant frequencies are acquired by probing the

variation of the effective impedance of the oscillator

with and without the thin plate. Using Qt framework

and the Open Graphics Library, Muller et al. [8]

developed the graphical user interface NumChladni,

an interactive tool for studying arbitrary two-

dimensional vibrating plates. The eigenvalue system

to determine the eigenmodes of arbitrarily shaped,

thin plates based on Finite Element Method (FEM)

was derived. Shridhar [9] examined the effects of

adhesion, friction, and damping on the development

of Chladni patterns, and suggested actual

applications for these effects. This was achieved

through the application of spatial autocorrelation

analysis in exploring the effects of adhesion and

frictional forces on the rate of pattern formation.

Investigation on how to control the motion of multiple

objects on a Chladni plate revealed that the motion is

sufficiently regular to be statistically modelled,

predicted and controlled [10]. By playing carefully

selected musical notes, the authors showed that the

position of multiple objects can be controlled

simultaneously and independently using a single

acoustic actuator. This method allows the

determination of independent trajectory, pattern

transformation and sorting of multiple miniature

objects in a wide range of materials. By means of

ultrathin silicon membranes excited in the low

ultrasound range, Vuillermet [11] illustrated that it is

possible to form two-dimensional Chladni patterns of

microbeads in liquid. From the findings, it was

observed that the combined effects of an ultrathin

plate excited at low frequency (yielding to subsonic

waves) together with reduced gravity (arising from

buoyancy) will enhance the importance of

microstreaming in the Chladni problems. In this

study, experiment was conducted at various

frequencies to determine the corresponding Chladni

patterns which were emulated using finite element

method.

2. MATERIALS AND METHOD

For the experimental procedure, a square thin plate

(0.40mm x 0.40mm) was attached to the driver

(indicated by the circular surface region in Figure 1a)

by gently removing the screws from the oscillator

surface and putting the screws back as shown in

Figure 1b. This was followed by superimposing the

square plate (see Figure 1c) on the surface of the

oscillator, by ensuring that the centre hole of the

plate fits into the central nub in the electro-

mechanical oscillator.

To reduce friction, graphite powder was periodically

applied on the plate surface and excesses were

brushed off. This was performed before sprinkling

grain particles of granulated sugar on the surface of

the primary plate. The electro-mechanical oscillator

was turned on, starting from a frequency signal of

100 Hertz at 7 seconds. The amplifier was slowly

adjusted until vibration began to occur and the

primary thin plate excited, producing line patterns

while recording the modal frequencies. At intervals,

the amplitude was reduced in order to sprinkle

additional quantity of sugar on the plate. For each

vibration phase, the frequency at which clear mode

shapes formed were recorded accordingly. As the

mechanical oscillator was driven with an amplified

sinusoidal voltage, a digital galvanometer was

connected in series with the mechanical oscillator to

probe the effective current amplitude. This allowed

the frequency response of the effective impedance of

the mechanical oscillator to be measured. All

investigations using FEM were performed on a

0.40mm x 0.40mm CAD models of the thin plates in

Figure 2.

Figure 1: Experimental Set-up for the Plate Vibration

RESPONSE VARIATION OF CHLADNI PATTERNS ON VIBRATING ELASTIC PLATE UNDER ELECTRO-MECHANICAL OSCILLATION, A. E. Ikpe, et. al

Nigerian Journal of Technology, Vol. 38, No. 3, July 2019 542

Figure 2: CAD Models of the thin Plates

CATIA is an engineering and design software that

enables the creation of 3D parts from 2D sketches,

with functional tolerances as well as kinematic

definition of points on simulated models. On the other

hand, Ansys workbench performs similar function like

CATIA, as the performance of designed products can

be modelled, simulated and predicted with different

specifications that correlate with experimental

validation as demonstrated in this study. In addition,

Ansys has an integrated solver that aids the

application of loads and boundary conditions while

Hypermesh is mainly designed for meshing of

Computer Aided Design (CAD) parts. It helps

breakdown the geometry or profile into smaller

elements for effective application of the boundary

conditions which in this study are the frequency

signals ranging from 100HZ at 7s, 14s, 28s, 35s, 42s,

49s, and 56s to 8888Hz respectively. The following

steps were adopted in the finite element method as

applied to the mechanics of thin plates;

i. The thin plate models were constrained at the

centre and in all degrees of freedom.

ii. Generation of 3D solid mesh. This divided the

continuum into finite number of elements

characterized by line segments and nodes.

iii. Selection of key points on the elements to

serve as nodes where conditions of

equilibrium and compatibility are applied.

iv. Assumption of displacement functions for

individual element such that the

displacements at each generic point is

depended upon the nodal values.

v. Stiffness and equivalent nodal loads were

established for a given element using

flexibility method or energy principles.

vi. Equilibrium equations were generated for

each set of nodes of the discritized continuum

in terms of the idealized element.

vii. The equilibrium condition was solved for the

nodal displacements.

Considering a thin flat plate driven by a time-

harmonic source F(r’), the response function Ψ(r,

r’,�̃�) of the vibrating plate can be solved with the

inhomogeneous Helmholtz equation [12] given by

Equation (1);

(∇2 + �̃�2)Ψ(r, r’, �̃�) = 𝐹(𝑟′) (1)

Where, �̃� = 𝑘 + 𝑖𝑦, k is the driving wave number and

y is the damping coefficient of the vibrating system.

Equivalent deflections found for each mode shapes

[13] is given in Equation (2);

𝑉𝑚𝑎𝑥 =𝐷

2∬ {(

𝜕2𝑊

𝜕𝑥2+

𝜕2𝑊

𝜕𝑦2)

2

𝐴

− 2(1

− 𝑣) [𝜕2𝑊

𝜕𝑥2

𝜕2𝑊

𝜕𝑦2− (

𝜕2𝑊

𝜕𝑥𝜕𝑦)

2

]} 𝑑𝑥𝑑𝑦

=1

2𝐾𝑒𝑓𝑓[𝑊0(𝑥0, 𝑦0)]2 (2)

Where, Wo(xo, yo) is the point on the square plate

which has the maximum deflection and (xo, yo) is the

location of that point. The maximum deflection point

differs for different mode shapes.

Under a time-harmonic condition, the effective

coupling efficiency of the normalized power

transferred from the point source to the vibrating

plate can be given by Equation (3);

𝜂(𝑟′�̅�) = |∑ 𝑘𝑛 2. 𝑎𝑛(𝑟′, �̅�). ϕ𝑛(𝑟′)

𝑛

|

2

(3)

Where k is the driving wavenumber, kn is the

eigenvalues close to the driving wave number, ϕ𝑛(𝑟′)

is the eigenmodes.

Applying the Greens function, the response function

excited by any general source F(r’) [14] is given by;

Ψ(r, r’, �̃�) = ∫𝐺𝑉

(r, r’, �̃�)𝐹(𝑟′)𝑑3𝑟′ (4)

For the system with y˂˂k, the Green’s function can

further be expressed with the Eigen modes [14] given

as;

RESPONSE VARIATION OF CHLADNI PATTERNS ON VIBRATING ELASTIC PLATE UNDER ELECTRO-MECHANICAL OSCILLATION, A. E. Ikpe, et. al

Nigerian Journal of Technology, Vol. 38, No. 3, July 2019 543

𝐺(r, r’, �̃�) = ∑ϕ𝑛

∗(𝑟′). ϕ𝑛(𝑟)

(𝑘2 − k𝑛 2) + 2𝑖𝑦𝑘′

𝑛

(5)

Where, ϕ𝑛(𝑟) and kn are the eigenmodes and

eigenvalues. Substituting Equation (5) into Equation

(4), the normalized response function Ψ(r, r’,�̃�) is

given by Equation (6);

Ψ(r, r’,k̃)= ∑ an

n

(r’,k̃) ϕn(r) (6)

Considering a piece of square plate, the eigenmodes

are given by Equation (7);

ϕ𝑛1,𝑛2(𝑥, 𝑦) =

2

𝑎𝑐𝑜𝑠 (

𝑛1𝜋

𝑎𝑥) 𝑐𝑜𝑠 (

𝑛2

𝑎) 𝑦 (7)

Where n1 = 0, 1, 2, 3…. and n2 = 0, 1, 2, 3……, the

eigenvalues corresponding to the eigenmodes

ϕ𝑛1,𝑛2(𝑥, 𝑦) are given Equation (8);

𝑘𝑛1,𝑛2=

𝜋

𝑎√𝑛1

2 + 𝑛22 (8)

With a point source at the centre, the driving function

can be expressed in Equation (9);

𝐹(𝑟′) = 𝐹𝑜𝛿(𝑥′ − 𝑎/2)𝛿(𝑦′ − 𝑎/2) (9)

Where, Fo is the amplitude of the driving source

Equation (10) is the forth-order wave equation

describing flexural or bending waves in the thin plate

vibrating under the influence of electro-mechanical

oscillator [15].

𝜌𝑡𝜕2𝑢

𝜕𝑡2 + 𝐵𝑥𝑥𝜕4𝑢

𝜕𝑥4 + 2𝐵𝑥𝑦𝜕2𝑢

𝜕𝑥2𝜕𝑦2 + 𝐵𝑦𝑦𝜕4𝑢

𝜕𝑦4 = 0 (10)

Where,

𝐵𝑥𝑥 =𝐸𝑥𝑥𝑡3

12𝜌(1−𝑣𝑥𝑥2 )

and 𝐵𝑦𝑦 =𝐸𝑦𝑦𝑡3

12𝜌(1−𝑣𝑦𝑦2 )

(11)

Where, t is the flat plate thickness, Exx, vyy, Bxx and

Byy are the elastic constant along the symmetrical

regions in the in the x and y axis of the

square/rectangular plates.

For thin rectangular/square plates under the

influence of vibration, Kaczmarek et al. [16] proposed

a relationship for the frequency of modes (Hz)

expressed in Equation (12);

𝑓 = √(𝑛

𝑙)

2

+ (𝑚

𝑤)

2

(12)

Where, l is length of the plate, w is width of the plate

3. RESULTS AND DISCUSSION

As shown earlier in Figure 1a, a circular region of the

oscillator can be seen on the surface of the vibrator

when the square-like flat plate is not yet installed.

When the electromagnetic oscillator was connected

to a power source and the square plate properly

positioned on top of the circular part, the vibrating

effects of the oscillator at different frequencies were

transmitted through the circular region of the

oscillator in Figure 1a, to the 0.4mm x 0.40mm thin

square plate which generated various patterns in the

process. Figure 3 represents the traveling wave on

the circular region of the oscillator, resulting from the

vibrating effects at different frequencies. Tables 1-4

represent the frequency values obtained from the

experimental analysis and FEM solvers, while Figures

4-11 show the plot for each time interval.

A thin plate (with fine grains on the surface)

subjected to vibration can produce several different

vibration mode shapes, each with a different pattern

of nodal lines as shown in Figures 12-15.

Figure 3: Vibration Effects on the Circular Surface Region of the Oscillator at different Frequencies

Table 1: Results of Modal Frequency Obtain from the Experimental Procedure Steps Time (s) Modal Frequencies (Hz)

1. 7 100 100 100 100 100 100 100 100 2. 14 113 115 116 115 118 115 118 112

3. 21 138 140 143 140 138 135 133 136 4. 28 164 167 162 164 161 167 165 163

RESPONSE VARIATION OF CHLADNI PATTERNS ON VIBRATING ELASTIC PLATE UNDER ELECTRO-MECHANICAL OSCILLATION, A. E. Ikpe, et. al

Nigerian Journal of Technology, Vol. 38, No. 3, July 2019 544

Steps Time (s) Modal Frequencies (Hz)

5. 35 185 176 183 189 192 188 184 187 6. 42 202 207 209 214 216 218 213 212

7. 49 218 224 226 230 228 234 225 223 8. 56 226 232 234 239 243 245 236 240

Table 2: Results of Modal Frequency Obtain from HYPERMESH Solver Steps Time (s) Modal Frequencies (Hz)

1. 7 100 100 100 100 100 100 100 100

2. 14 112 115 114 115 118 116 117 113 3. 21 136 141 143 142 137 134 130 134

4. 28 166 165 163 165 161 166 164 163

5. 35 186 177 180 188 194 188 185 187 6. 42 204 209 210 215 214 220 215 209

7. 49 215 223 227 232 229 234 227 223 8. 56 227 230 233 241 242 244 236 239

Table 3: Results of Modal Frequency Obtain from ANSYS R15.0 Solver Steps Time (s) Modal Frequencies (Hz)

1. 7 100 100 100 100 100 100 100 100

2. 14 107 110 109 108 112 115 118 114 3. 21 136 125 137 138 128 127 127 134

4. 28 161 158 164 153 157 158 156 168

5. 35 182 172 176 184 190 186 190 192 6. 42 207 206 205 215 217 229 221 211

7. 49 218 218 227 236 233 235 232 230 8. 56 233 232 239 242 240 241 242 238

Table 4: Results of Modal Frequency Obtain from CATIA Solver Steps Time (s) Modal Frequencies (Hz)

1. 7 100 100 100 100 100 100 100 100

2. 14 118 117 121 115 114 112 113 110 3. 21 135 146 137 138 135 132 138 134

4. 28 167 162 156 166 166 163 167 160

5. 35 186 179 187 177 197 184 182 183 6. 42 207 203 215 216 218 222 214 214

7. 49 217 228 229 232 230 231 227 223 8. 56 230 235 237 241 242 240 238 236

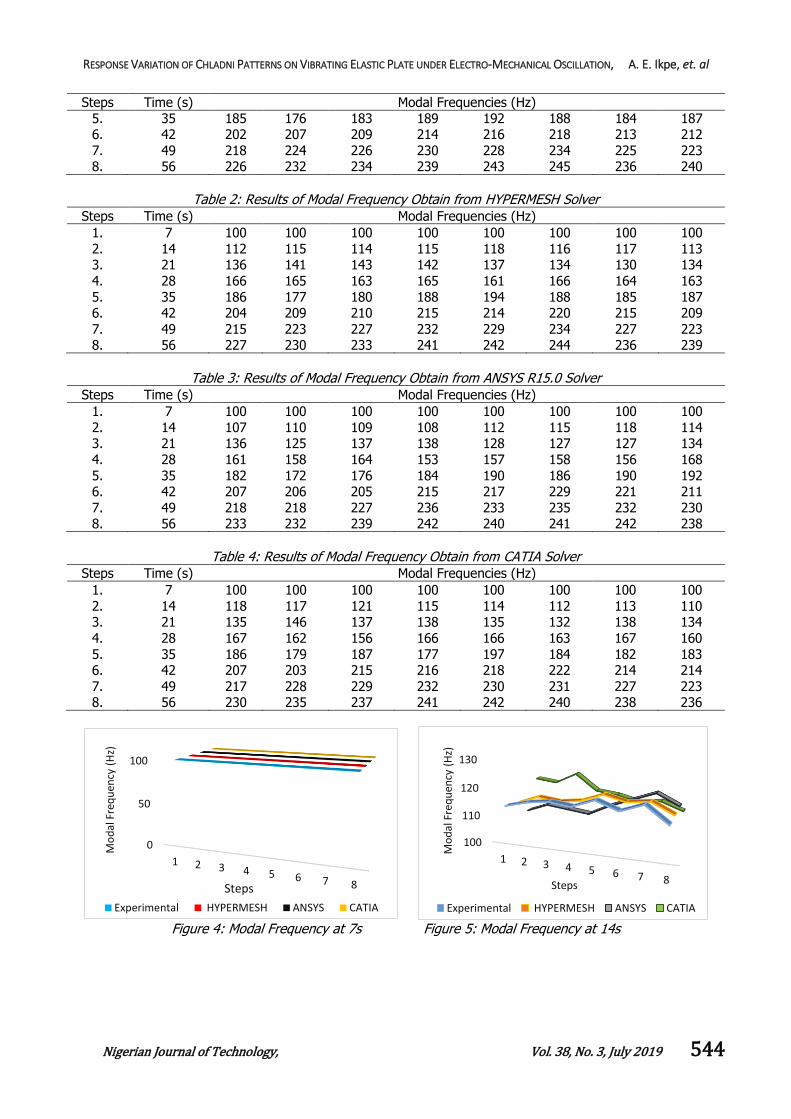
Figure 4: Modal Frequency at 7s Figure 5: Modal Frequency at 14s

0

50

100

1 2 3 4 5 6 7 8

Mo

dal

Fre

qu

ency

(H

z)

Steps

Experimental HYPERMESH ANSYS CATIA

100

110

120

130

1 2 3 4 5 6 7 8

Mo

dal

Fre

qu

ency

(H

z)

Steps

Experimental HYPERMESH ANSYS CATIA

RESPONSE VARIATION OF CHLADNI PATTERNS ON VIBRATING ELASTIC PLATE UNDER ELECTRO-MECHANICAL OSCILLATION, A. E. Ikpe, et. al

Nigerian Journal of Technology, Vol. 38, No. 3, July 2019 545

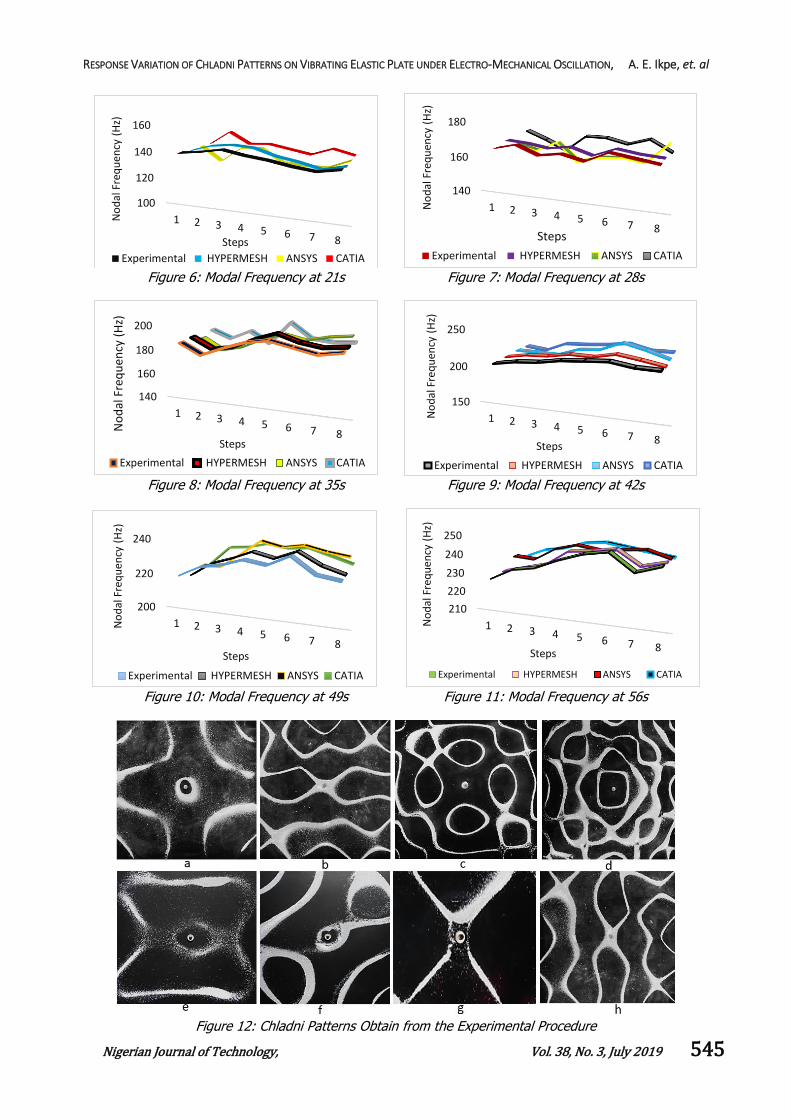
Figure 6: Modal Frequency at 21s Figure 7: Modal Frequency at 28s

Figure 8: Modal Frequency at 35s Figure 9: Modal Frequency at 42s

Figure 10: Modal Frequency at 49s Figure 11: Modal Frequency at 56s

Figure 12: Chladni Patterns Obtain from the Experimental Procedure

100

120

140

160

1 2 3 4 5 6 7 8

No

dal

Fre

qu

ency

(H

z)

Steps

Experimental HYPERMESH ANSYS CATIA

140

160

180

1 2 3 4 5 6 7 8

No

dal

Fre

qu

ency

(H

z)

Steps

Experimental HYPERMESH ANSYS CATIA

140

160

180

200

1 2 3 4 5 6 7 8

No

dal

Fre

qu

ency

(H

z)

Steps

Experimental HYPERMESH ANSYS CATIA

150

200

250

1 2 3 4 5 6 7 8N

od

al F

req

uen

cy (

Hz)

Steps

Experimental HYPERMESH ANSYS CATIA

200

220

240

1 2 3 4 5 6 7 8

No

dal

Fre

qu

ency

(H

z)

Steps

Experimental HYPERMESH ANSYS CATIA

210

220

230

240

250

1 2 3 4 5 6 7 8

No

dal

Fre

qu

ency

(H

z)

Steps

Experimental HYPERMESH ANSYS CATIA

RESPONSE VARIATION OF CHLADNI PATTERNS ON VIBRATING ELASTIC PLATE UNDER ELECTRO-MECHANICAL OSCILLATION, A. E. Ikpe, et. al

Nigerian Journal of Technology, Vol. 38, No. 3, July 2019 546

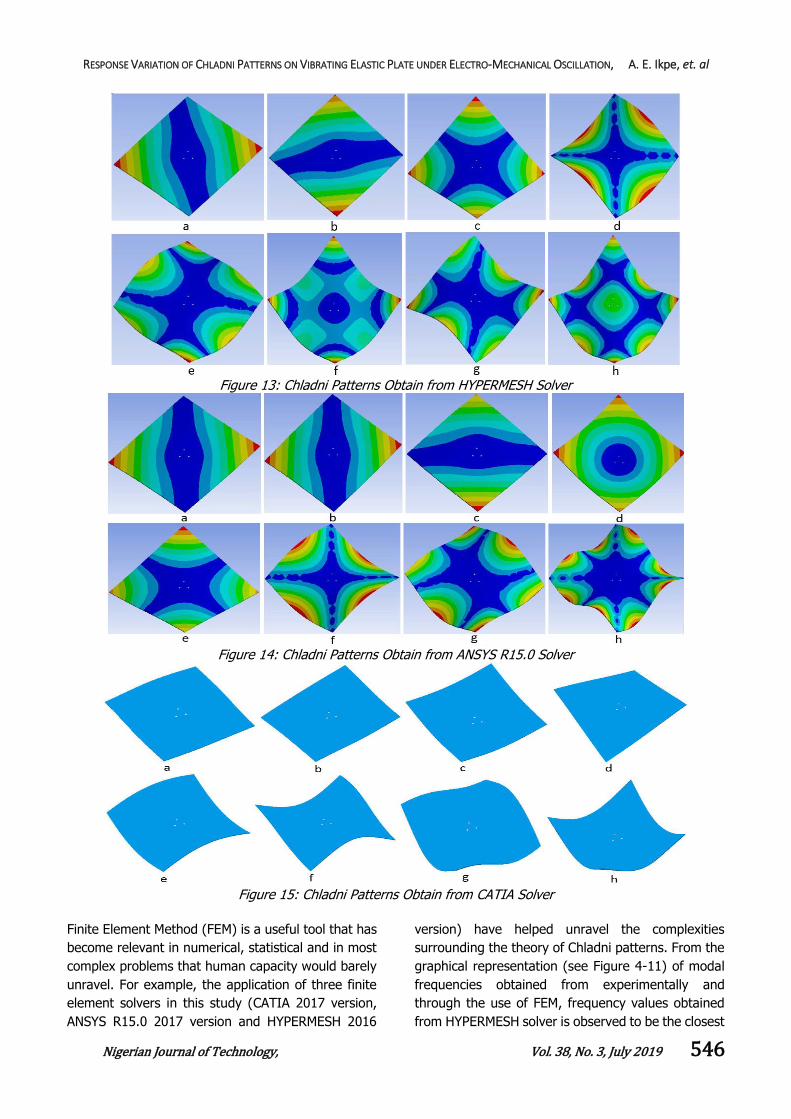
Figure 13: Chladni Patterns Obtain from HYPERMESH Solver

Figure 14: Chladni Patterns Obtain from ANSYS R15.0 Solver

Figure 15: Chladni Patterns Obtain from CATIA Solver

Finite Element Method (FEM) is a useful tool that has

become relevant in numerical, statistical and in most

complex problems that human capacity would barely

unravel. For example, the application of three finite

element solvers in this study (CATIA 2017 version,

ANSYS R15.0 2017 version and HYPERMESH 2016

version) have helped unravel the complexities

surrounding the theory of Chladni patterns. From the

graphical representation (see Figure 4-11) of modal

frequencies obtained from experimentally and

through the use of FEM, frequency values obtained

from HYPERMESH solver is observed to be the closest

RESPONSE VARIATION OF CHLADNI PATTERNS ON VIBRATING ELASTIC PLATE UNDER ELECTRO-MECHANICAL OSCILLATION, A. E. Ikpe, et. al

Nigerian Journal of Technology, Vol. 38, No. 3, July 2019 547

to the modal frequencies obtained experimentally.

This agrees with the investigation carried out by

Owunna et al. [7] on experimental modal analysis of

a flat plate subjected to vibration. The experimental

investigation in this study was designed to show the

influence of a plate geometry on the modal shapes

(the shapes characterized by line patterns appear as

the frequencies resonate with the thin plate) formed

when the plate is subjected to vibration (the overlap

of the waves results an interference pattern of

nodes). Therefore, a thin sheet of metal excited at

resonance is divided into various patterns vibrating in

opposite directions bounded by lines of vibration

referred to as nodal lines. The visibility of these nodal

lines was achieved by sprinkling sugar on the surface

of the excited thin plate under vibration. The various

positions on the surface of the plate where the sugar

particles bunched up and appeared to halt in motion

are known as the nodes. In other words, as the

frequency varies, the position of the nodes adjust

gradually until they stagnate at a point where fine

imaginary lines patterns are formed [17]. By so

doing, the sugar particles skitter from one end of the

plate to the other and bunches up at a point,

transforming itself into a more complex geometric

shapes. In the experimental process, it was observed

that as the frequency varied, the position of the

nodes adjusted across the top plane of the plate. It

was also observed that the longer the excitation time,

the higher the modal frequencies and the more

complex the shapes and patterns formed on the plate

surface as shown in Tables 1-4 and Figures 12-15. In

this case, higher frequencies imply more peaks in the

sound wave, and thus increasing nodes in the

resulting interference pattern. Therefore, as the

sound waves resonate through the thin metal sheet,

there is a backward reflection of the sound towards

the source, producing a sound that irritates the ear.

In recent times, loud speaker and electronic signal

generator such as the electromagnetic single axis

systems have been employed to control the

frequency of the sound as it increases. It should be

noted that the line patterns, mode shapes as well as

the frequencies obtained in this study is only for

square plate, as the use of circular, triangular and

rectangular plates will provide great variety of

patterns different from those presented in this study.

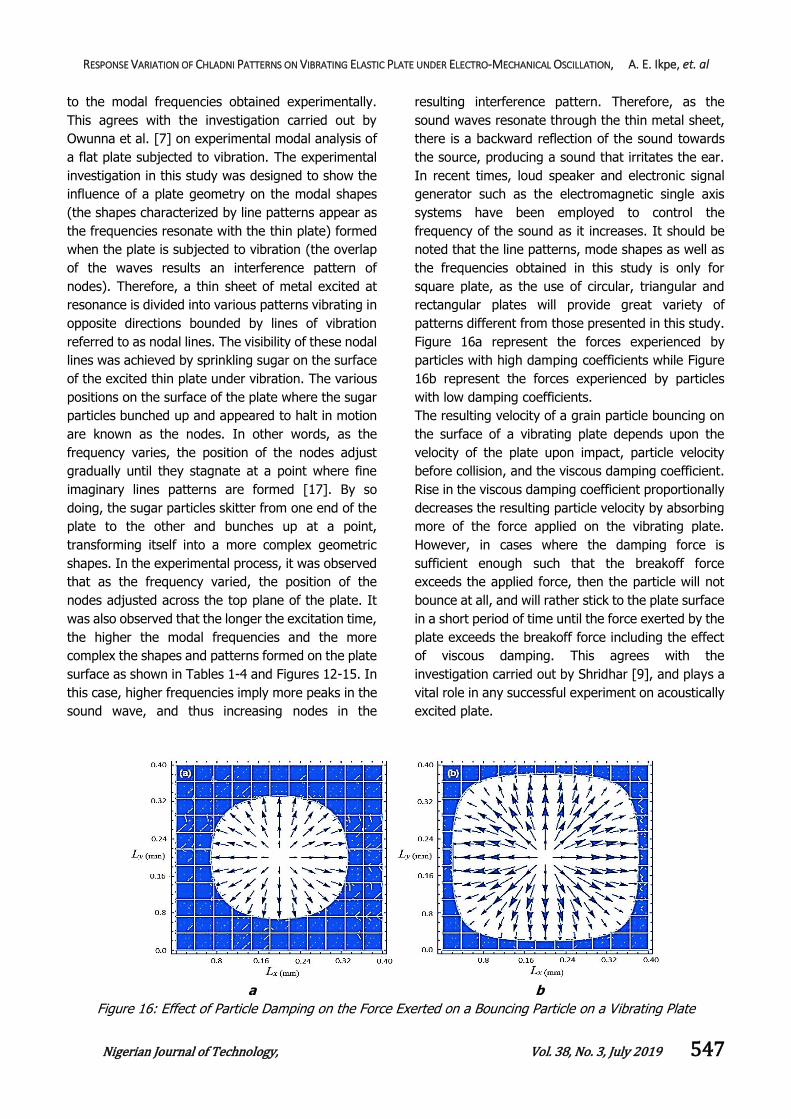
Figure 16a represent the forces experienced by

particles with high damping coefficients while Figure

16b represent the forces experienced by particles

with low damping coefficients.

The resulting velocity of a grain particle bouncing on

the surface of a vibrating plate depends upon the

velocity of the plate upon impact, particle velocity

before collision, and the viscous damping coefficient.

Rise in the viscous damping coefficient proportionally

decreases the resulting particle velocity by absorbing

more of the force applied on the vibrating plate.

However, in cases where the damping force is

sufficient enough such that the breakoff force

exceeds the applied force, then the particle will not

bounce at all, and will rather stick to the plate surface

in a short period of time until the force exerted by the

plate exceeds the breakoff force including the effect

of viscous damping. This agrees with the

investigation carried out by Shridhar [9], and plays a

vital role in any successful experiment on acoustically

excited plate.

a b

Figure 16: Effect of Particle Damping on the Force Exerted on a Bouncing Particle on a Vibrating Plate

RESPONSE VARIATION OF CHLADNI PATTERNS ON VIBRATING ELASTIC PLATE UNDER ELECTRO-MECHANICAL OSCILLATION, A. E. Ikpe, et. al

Nigerian Journal of Technology, Vol. 38, No. 3, July 2019 548

4. CONCLUSION

Finite Element Method has been successfully

employed in this study to emulate the modal

frequencies and patterns in thin plates under acoustic

excitation, and the results obtained correlates with

the experimental values. This can serve as alternative

to the numerical and experimental methods,

considering the proximity between the experimental

values and FEM values. For further investigation in

engineering field, FEM can be adopted to check the

effects of acoustic excitations on displacement,

deformation and stress profiles of thin plates. This

could unravel the challenges surrounding the stress

build-ups in mechanical and structural components in

relation to their failure mechanisms.

5. REFERENCES

[1] Ullmann, D. (2007) Life and work of e.f.f. chladni.

The European Physical Journal-Special Topics, 145:27.

[2] Gough, C. (2007) The violin: Chladni patterns, plates, shells and sounds. The European Physical Journal - Special Topics, 145:77,101, 2007.

[3] Lindemann, T. and Vella, A. (2015) Analysis of Vibrating Plates with Acoustic Holography and

Eddy Currents. University of Illinois, USA.

[4] Arango, J. and Reyes, C. (2015) Stochastic

Models for Chladni Figures. Proceedings of the Edinburgh Mathematical Society, 59(2), 287-300.

[5] Trejo-Mandujano, H. A., Mijares-Bernal, G. and

Ordoneez-Casanova, E. G. (2015) Alternate Model of Chladni Figures for the Circular

Homogeneous Thin Plate Case with Open Boundaries. Journal of Physics: Conference Series, 582,012022.

[6] Amore, P. (2008) Solving the Helmholtz Equation for Membranes of Arbitrary Shape: Numerical

Result. Journal of Physics A: Mathematical and Theoretical, 41(26), 1-32.

[7] Owunna, I., Ikpe, A., Satope, P. and Ikpe, E. (2016) Experimental Modal Analysis of a Flat

Plate Subjected To Vibration. American Journal of Engineering Research, 5(6), 30-37.

[8] Muller, T. (2013) Numerical Chladni figures. University of Stuttgart, Allmandring 19, 70569

Stuttgart, Germany.

[9] Shridhar, M. (2011) Manipulating Standard and

Inverse Chladni Patterns by Modulating Adhesive,

Frictional, and Damping Forces. International Journal of Scientific and Engineering Research, 3(5), 782789.

[10] Zhou, Q., Sariola, V., Latifi, K. and

Liimatainen, V. (2016) Controlling the motion of

multiple objects on a Chladni plate. Nature Communications, 7(12764), 1-10.

[11] Vuillermet, G. (2016) Chladni Patterns in a Liquid at Microscale. American Physical Society, Physical Review Letters, 116, 184501-5.

[12] Mama, B. O., Onah, H. N., Ike, C. C. and

Osadebe, N. N. (2017) Solution of Free Harmonic

Vibration Equation of Simply Supported Kirchhooff Plate by Galerkin-Vlasov Method.

Nigerian Journal of Technology, 36(2), 361-365.

[13] Blevins, R. D. (1979) Formulas for Natural Frequencies and Mode Shapes. Van

NostrandReinhold Co, USA, ISBN: 9780442207106.

[14] Tuan, H., Wen, C. P., Chiang, P. Y. and Yu, Y. T. (2015) Exploring the Resonant Vibration of

Thin Plate: Reconstruction of Chladni Patterns and Determination of Resonant Wave Numbers.

The Journal of the Acoustical Society of America

137 (4) 2113-2123.

[15] Cuenca, J. (2009) Wave Models for the

Flexural Vibrations of Thin Plates-Model of the Vibrations of Polygonal Plates by the Image

Source Method-Vibration Damping Using the

Acoustic Black Hole Effect. University of Maine, USA, tel-00442260.

[16] Kaczmarek, A., Javorek, L. And Orłowski, K. (2014) Mode Vibrations of Plates-Experimental

Analysis Annals of Warsaw University of Life Sciences, Forestry and Wood Technology 88 97-

101.

[17] Skrodzki, M. Reitebuch, U. and Polthier, K. (2016) Chladni Figures Revisited: A Peek into the Third Dimension, in Proceedings of Bridges Finland Conference: 2016, 481-484

.


Recommended