Page 1
1
Responses to the Referee’s Comments
ID: HESS-2016-87-RC2
We would like to thank the editor’s decision regarding the revision of our manuscript.
We are greatly thankful for the insightful and constructive comments from the
anonymous reviewer. We have carefully studied them and revised the manuscript
accordingly. This document contains our specific responses to the comments.
Responses to Anonymous Referee #2’s Comments:
1. First, the research aimed to examine factors controlling net primary productivity
(NPP) change and its feedbacks to the atmosphere, but the actual design was largely
made to address the first part of the objective. More efforts on the second part would
help bridge a knowledge gap and would definitely add values to the entire work.
Response: We rewrote the 3.1 & 3.3 parts according to the reviewer’s comment.
3.1 Spatiotemporal variations in global terrestrial NPP and their effects on ET
The spatial patterns of global NPP from 2000 to 2014 showed a steadily decreasing
trend from the equator to the Arctic and Antarctic (Fig. 1c). Overall, the inter-annual
series of NPP increased moderately at a rate of 0.06 PgC/yr2 over the past 15 years,
and also shows different changes in the Northern and Southern Hemispheres. While
NPP in most parts of the NH increased (Fig. 1a), it decreased in most parts of the SH
(Fig. 1b). Specifically, in the NH, 64% of vegetated land area experienced increased
NPP, including large areas of North America, Western Europe, India, and eastern
China. Regions with decreased NPP include Eastern Europe and higher latitudes of
central and west Asia. In the SH, decreased NPP accounted for about 60.3% of
vegetated land area, mainly concentrated in South America, South Africa, and western
Australia. Furthermore, in the equatorial regions, Amazon rainforests had significantly
decreased NPP, whereas African rainforests experienced an increasing trend (Fig. 1c).
Because tropical rainforest NPP accounts for a large proportion of global NPP,
decreases in SH NPP partially counteracted increases in NH NPP.
When we combined global LUCC characteristics, the results showed that shrubland
has the greatest potential increasing trend of NPP (16.5 gC/m2/yr) compared to other
biomes, followed by grassland (12.5 gC/m2/yr). This may be related to the expansion
of woody vegetation over the past 15 years. In the Arctic tundra (Hughes et al., 2006)
Page 2
2
and lower latitudes in arid environments (Chen et al., 2014), experimental studies
provided clear evidence that climate warming is sufficient to account for the
expansion of shrubs and graminoids.
Changes in vegetation albedo and emissivity exert feedback on climate, which is
especially obvious in ET (Field et al., 2007). The viability of vegetation cover can
substantially modulate available surface energy and partition that energy into sensible
and latent heat fluxes (Matsui et al., 2005). Vegetation changes can affect water and
energy cycles in the land-atmosphere circulation by changing the physical
characteristics of the land surface. For instance, the albedo of vegetation is less than
that of bare soil, enabling it to absorb more energy and thus increase ET. Moreover,
canopy height can change land surface roughness and affect the energy and
momentum between land and air transport, and leaves promote ET through direct
evaporation either from precipitation or transpiration interception from water uptake
by roots.
Increased vegetation productivity and climate change may promote multi-decadal
rises of global land ET (Zhang et al., 2015). Vegetation generally promotes
land-atmosphere water exchange via transpiration through a biological process, changing
soil moisture conditions and affecting the land-atmosphere feedback. The average mean
of estimated global annual ET is 518.6 mm/yr, with an inter-annual trend of 0.46
mm/yr2. Figures 1a and 1b show that the spatiotemporal changes of global ET are
consistent with NPP variations, especially in the NH. Furthermore, where their
association is less than that in the NH, NPP and ET in the SH have much higher
variability. The spatial inconsistency in the SH mainly occurred near the equator, e.g.,
southern African rainforests (Figs. 1b & 1d). These regions have high values of
average annual precipitation and stronger variability of precipitation than elsewhere,
causing greater changes to ET and its components (land-surface evaporation, canopy
evaporation, and transpiration). In places where the inter-annual variability of NPP
is small, the ET component of land-surface evaporation increases. In contrast, in areas
with large inter-annual variability of NPP, such as shrubland and grass-dominant
regions, the ET components of land-surface evaporation decline and transpiration
increases.
3.3 Continued effects of NPP on evapotranspiration likely to exacerbate regional
droughts
Page 3
3
With respect to the impact of drought on the world’s ecosystems, studies have been
limited regarding the contribution of vegetation and terrestrial water cycle components to
drought variations (Falloon et al., 2012; Teuling et al., 2013). However, the present lack
of high-quality and long-term records of actual ET limits the forecasting of drought
under climate change circumstances.
Drought indices are pointing to an increased risk of drought in the present century.
We used potential evapotranspiration (PET) as a surrogate measure of atmospheric
moisture demand. PET is defined as the maximum quantity of water capable of being
evaporated from soil and transpired from vegetation, whereas ET is the actual
evaporation from water and soil, as well as transpiration from vegetation. Penman
(1948) stated that ET had a proportional relationship with PET, and Bouchet (1963)
hypothesized that a complementary feedback mechanism exists between ET and PET
in water-limited regions. Overall, our investigation indicate that there is a proportional
relationship between ET and PET in humid regions and a complementary one in arid
regions (Fig. 1d and Fig. 4a). In PET, the combined impacts of temperature, solar
radiation, vapor pressure and wind speed (Zhang et al., 2015) interact with NPP (Fig.
4b). Over the past 15 years, global PET showed an increasing trend of 1.72 mm/yr2,
while global P increased at a rate of 0.84 mm/yr2. However, precipitation increases
cannot offset evaporative demand, indicating a potential moisture deficit for water
supplies constrained by ET. In other words, P is mostly being lost to ET rather than
being allocated to other components of the energy and water cycles (Zhang et al.,
2015).
Various factors, including vegetation, affect the intensity and spatial variation of
drought. Vegetation generally promotes land-atmosphere water exchange via
transpiration, changing soil moisture conditions and affecting the land-atmosphere
feedback. Water vapor via transpiration can lead to increased regional atmospheric
humidity over the short term, but preserve less water in the soil. This, in turn, accelerates
reductions in soil moisture caused by warming and provides a negative feedback.
Vegetation growth causes increased soil moisture evaporation, thus reducing the
amount of soil water storage. Once vegetation suffers persistent drought, the
vegetation biomass will rapidly decline and further intensify the drought. Thus,
decreasing soil moisture tends to decrease net terrestrial radiation at the surface
through increasing land-surface temperatures. If low levels of soil moisture persist for
long enough, reductions in vegetation cover and vigor can occur. As land-surface
Page 4
4
temperatures rise, increases in precipitation are insufficient to offset increases in
evaporative demand, indicating a potential moisture deficit for water supplies
constrained by ET. This leads to soil water loss and reduced vegetation growth, along
with higher risk of drought (Meng et al., 2014; Zhang et al., 2015). Soil moisture is an
important sensor for measuring superficial wetness and dryness levels, and generally
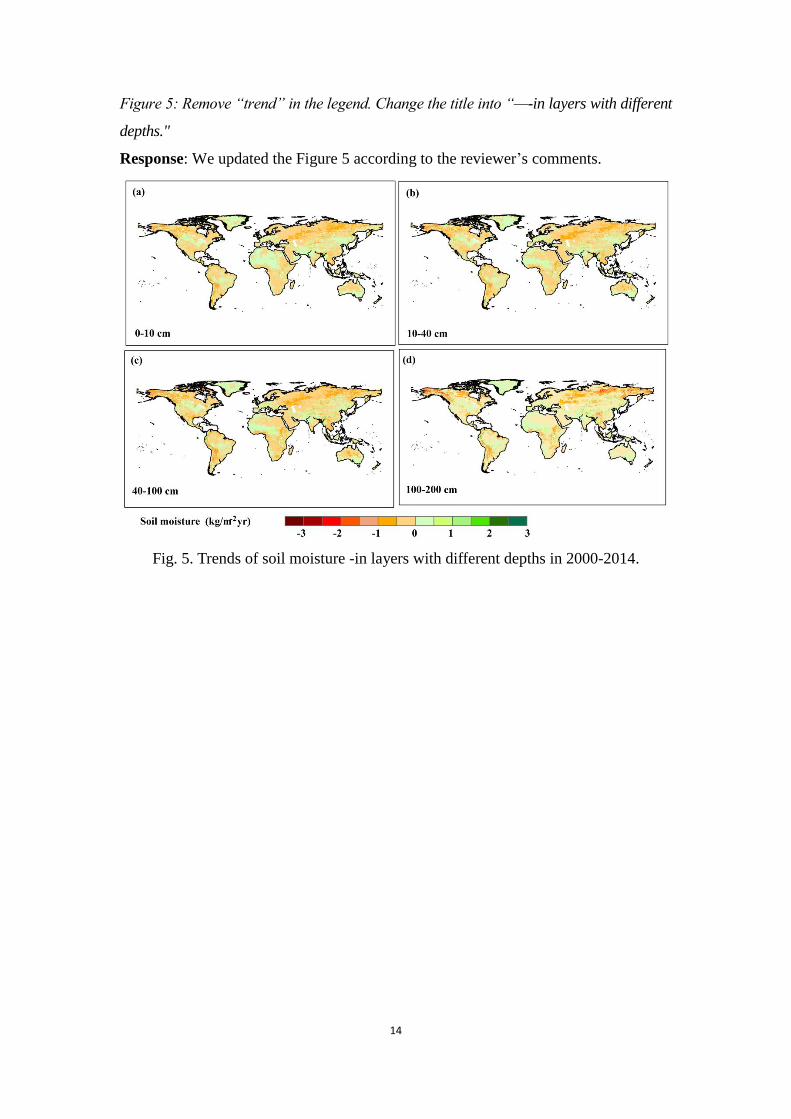
reflects the dryness and wetness of climate. Figure 5 illustrates the world-wide
decrease in soil moisture of four layers (0-10, 10-40, 40-100, and 100-200 cm). With
precipitation being the most direct factor affecting soil moisture, temperature and
solar radiation may cause soil moisture loss through ET. Available soil moisture is
defined as the amount of water a plant can access in its root zone. Thus, spatial and
temporal variations in soil moisture are closely related to vegetation growth (Davis
and Pelsor, 2001; Yang et al., 2010).
2. Second, the authors need to be aware that from statistical perspective, correlation and
causation are two related but distinct concepts. Correlation refers to how closely two sets
of information or data are related, while causation means the act or process of causing
that is often referred to as “cause and effect”. Correlation may imply causation but in
some cases, such a relation may not be true. Adding some more physical or the-oretical
explanation of the statistical relationship would help understand the causation.
Response: Table 1 and its description in the text are the correlations between NPP
and four climatic variables (temperature, precipitation, net radiation and PDSI) for
over both hemispheres. We have not made the quantitative association/correlation
between NPP and ET. We just wanted to show that: Land actual evapotranspiration
(ET) changes are positively with net primary production changes, especially in the
Northern Hemisphere. Under the context of past warmest 15 years, the slightly
increased inter-annual series of NPP and climate change promote decadal rises of
global land ET. According to the reviewer’s comment, we corrected several sentences
that seem strong statement that NPP is the cause for the change of ET. Meanwhile, we
added some more physical or theoretical explanation.
e.g. 3.1 & 3.3 (Please see the response of comment 1)
3.2 Controlling factors for NPP variations
Water, temperature, and radiation interact to impose complex and varying limitations
Page 5
5
on vegetation activities in different parts of the world. To understand why NPP
variations in the Northern and Southern Hemispheres respond differently to different
climates, we first estimated the spatial trends of climatic control factors and then
analyzed the complex multiple climatic constraints to plant growth. A comprehensive
interpretation of interactive climatic controls on plant productivity showed that water,
temperature, and radiation are the key factors affecting vegetation growth. Globally,
growth was most strongly limited by water availability on 40% of the Earth’s
vegetated surface, while temperature limitations exerted the main controlling
influence on 33% of the surface, and radiation on 27% (Nemani et al., 2003).
From 2000 to 2014, overall trends of average annual temperature (0.007 ℃/yr2)
and precipitation (0.84 mm/yr2) experienced world-wide increases while showing
different temporal change patterns (Figs. 2a & 2b). Eastern Europe, South America,
southern Africa and western Australia experienced warming combined with decreased
precipitation (warm-dry trend), whereas southeast North America, western Europe,
east Russia, and African rainforests experienced warming combined with increased
precipitation (warm-wet trend). Meanwhile, net radiation (Rn) increased in the
equatorial tropics and arid regions in Northwestern China, but decreased in the Arctic
and Antarctic (Fig. 2c). The Palmer Drought Severity Index (PDSI) is a widely-used
index that correlates with soil moisture during warm seasons (Dai et al., 2004; 2013).
Generally, a lower PDSI implies a drier climate. Global PDSI decreased at a rate of
0.04/yr2 from 2000 to 2014, suggesting an increased risk of drought in the 21st
century. The spatial trend of PDSI shows that the eastern and northern coasts of North
America, along with the African continent, Eurasia and southern South America,
exhibited obvious drought trends in 2000-2014. Northern China, parts of Mongolia,
and western Russia near Lake Baikal also experienced a drying trend (Fig. 2d).
Warming-induced drying resulted from increased ET and was most prevalent over
mid-high latitudes in the NH. Drought develops with periods of low-accumulated
precipitation and is exacerbated by high temperatures.
We analyzed partial correlations between NPP and temperature (T), precipitation
(P), Net radiation (Rn) and PDSI during growing seasons to determine their respective
contributions across different regions (Fig. 3, Table 1). The climate changes during
2000-2014 have made precipitation, temperature, and radiation somewhat beneficial
to plant growth. In the NH, climate changes have eased multiple climatic constraints
Page 6
6
to plant growth through earlier springs, but the continuous warming may offset these
benefits.
In high latitudes of the NH (>47.5°N), temperature has a positive correlation with
NPP (R=0.6). Significant warming generally lengthens growing seasons for
vegetation and promotes plant growth in tundra regions, so the recent warming in this
region has increased NPP (Fig. 3a). For northern mid and low latitudes (<47.5°N),
where large areas are classified as having an arid climate, vegetation is short-rooted.
NPP has a significant negative correlation with P (R=0.7, p<0.05) (Fig. 3b) and is also
correlated to Rn (Fig. 3c). In areas of high elevation such as the Tibetan plateau
(which is similar to high latitudes), temperature is the dominant control factor in
vegetation growth.
Equatorial Amazon rainforests experienced significantly decreased NPP, whereas
African rainforests exhibited an increasing trend. These changes in equatorial regions
are mainly related to the warming in the Amazon along with increasing precipitation
in African rainforests. High temperatures caused higher rates of ET, generally
reducing soil water availability for vegetation in the Amazon.
In the SH, we noted a significant correlation (r =0.7, p<0.05) between NPP and
PDSI (Fig. 3d). The warming trend induced a much higher evaporative demand and
led to a drying trend, except for the afore-mentioned increased precipitation in African
rainforests. The PDSI in African rainforests also showed a slight increasing trend. A
high T-value can increase both vapour pressure deficiency and moisture deficit and
lead to a dryer environment. The general drought event across the SH, which was
induced by extreme heat and a precipitation deficit, has resulted in a net water
availability reduction, ultimately reducing NPP. Hence, warming-associated drying
directly caused the significant decreasing trend of NPP in the SH.
3. Last, I understand English is not the mother language for these authors, and they must
have made substantial efforts in polishing the English for the current submission. But
there are still some small errors in English usage and grammar throughout the entire
manuscript. These small errors collectively undermine the scholarly quality of this article.
These authors are urged to find someone with competent English to edit the text.
Response: We carefully modified the grammar and sentence structure with the
assistance of native English-speaking editors.
Page 7
7
4. The abstract is too long and is not quite coherent. It needs to be better organized and
written. Although the findings are present, it is not clear why these authors conducted this
research, what would be the objectives, and what methods they have used.
Response: We have rewritten the abstract.
Abstract. The Earth has experienced a dramatic increase in global climate warming
since 2000, which has significantly influenced the global water cycle and vegetation
activities. Despite these radical changes, there is little observational evidence to
demonstrate the effects of vegetation variations on climate in different global
geographical units. A few studies focused on feedback relating to the inter-annual
variability of vegetation on the physical processes of atmosphere-land surfaces,
especially with regards to evapotranspiration. Overall, the global inter-annual series of
net primary production (NPP) slightly increased in 2000-2014 at a rate of 0.06
PgC/yr2. More than 64% of vegetated land in the Northern Hemisphere (NH) showed
increased NPP (at a rate of 0.13 PgC/yr2), while 60.3% of vegetated land in the
Southern Hemisphere (SH) showed a decreasing trend (at a rate of -0.18 PgC/yr2).
Temperature was the dominant control factor for vegetation growth in high latitudes
in the NH, net radiation and precipitation were the main factors affecting NPP in the
mid latitudes, and warming-associated large-scale drying trends led to decreases in
NPP in the SH.
Vegetation productivity influences albedo and emissivity, both of which regulate
evapotranspiration (ET). Changes in actual ET correlate positively with changes in
NPP, especially in the NH, where increased vegetation productivity and climate
change have promoted sharp rises in terrestrial ET (0.61 mm/yr2). At the same time,
anomalous dry conditions have caused a reduction in vegetation productivity and a
near cessation of terrestrial ET growth in the SH (0.41 mm/yr2). Although water vapor
via vegetation transpiration can lead to increased regional atmospheric humidity over
a short time span, it also preserves less water in the soil. This, in turn, accelerates
reductions in soil moisture caused by warming and triggers negative feedback.
Drought indices, along with precipitation-minus-evaporation calculations, point to an
increased risk of drought in the 21st century.
5. Key words should include a term for the geographical area
Response: Journal of Hydrol. Earth Syst. Sci. looks probably no keywords.
Page 8
8
6. Introduction: The literature review could be more coherent with specific methods and
critical issues (e.g. temporal and spatial scales) targeted. Also additional context would
help justify the three specific objectives targeted.
Response: We have rewritten the Introduction.
Introduction
Organizations such as the Intergovernmental Panel on Climate Change (IPCC) and the
World Meteorological Organization (WMO) have reported that the past decade was
the warmest on record. Global warming indicates a general acceleration or
intensification of the global hydrological cycle and thus an alteration in the process of
evapotranspiration (ET) (Wentz et al., 2007; Douville et al., 2013), with implications
for the response and mutual feedback of ecosystem services (Jung et al., 2010; Davie
et al., 2013). Most of the recent research in this area has analyzed the impacts of
climate change on vegetation activities, although some of the research on the
feedback of terrestrial ecosystems to climate change has centered on the ecosystems’
potential role as carbon sources (Field et al., 2007). Only a few studies focused on
feedback relating to the inter-annual variability of vegetation on the physical
processes of land surfaces and climate systems (Zhi et al., 2009), especially with
regards to ET.
Terrestrial net primary production (NPP) can be defined as the amount of
photosynthetically fixed carbon available to the first heterotrophic level in an
ecosystem, and links terrestrial biota with atmospheric systems (Beer et al., 2010).
Numerous ecosystem models have attempted to estimate terrestrial NPP, owing to its
importance for ecological and social systems, both regionally and globally (Chen et
al., 2012; Potter et al., 2012; Pan et al., 2014). From 1982 to 1999, climatic changes
enhanced plant growth globally, especially in the northern mid and high latitudes
(Nemani, 2003); this was followed, in 2000-2009, by a drought-induced reduction in
global NPP (Zhao and Running, 2010). Gang et al. (2015) projected the dynamics of
NPP in response to future anticipated climate changes in the 2030s, 2050s and 2070s,
and found that global NPP would show an increasing trend. In particular, NPP at high
latitudes in the Northern Hemisphere (NH) would likely be more sensitive to future
climate change. The interaction of water, temperature, and radiation has imposed
complex and varying limitations on vegetation activities in different regions of the
world. However, clear data on spatiotemporal variations and attributes in global
terrestrial NPP within the context of high variability warming are still lacking.
Page 9
9
Meanwhile, several studies have indicated that climate constraints (e.g., increasing
temperatures and solar radiation) are relaxing (Nemani et al., 2003).
A recent study suggested that vegetation productivity influences albedo and
emissivity, which then strongly regulate global climate (Chapin et al., 2011). This is
especially obvious in evapotranspiration (ET), which is a central process in the
climate system and a nexus of the water, energy and carbon cycles. Hence, it plays a
pivotal role in maintaining the water and heat balance. Shen and colleagues (2015)
reported that, in contrast to the Arctic region (i.e., positive feedback to warming),
increased vegetation activity may attenuate daytime warming by enhancing actual ET
as a cooling process on the Tibetan Plateau. Zhang et al. (2015) investigated how
climate change and recent vegetation greening promote multi-decadal rises of global
ET, while an anomalous drought between 2000 and 2009 led to reduced vegetation
productivity in the Southern Hemisphere (SH) (Zhao and Running, 2010). However,
little observational evidence exists to demonstrate vegetation feedback on climate
across different global geographical units.
Investigating factors that control changes in NPP and its feedback effects could
provide important clues to the underlying mechanisms and complex interactions
between ecosystems and climate systems (Tian et al., 2000; 2012). Having a clear
understanding of the land’s biophysical feedback to the atmosphere is crucial if we are
to simulate regional climate accurately. In our study, we investigated the following
three major points of interest: 1) whether the high volatility temperature of the past
decade continued to increase NPP, or if different climate constraints were at play; 2)
why NPP variations in the Northern and Southern Hemispheres respond differently to
climate changes; and 3) what the spatiotemporal variation of NPP is, and what its
effects are on ET.
7. Data and Methodology
Data: For each dataset, supply a brief description including the source. How did you
resample and reclassify them? Methods: The authors used the NPP datasets from
MODIS, and it does not set here is no need to have a lengthy discussion on the algorithms
(Equations 1-7) used by NASA in a methodology section. This section should focus on the
specific methods developed by these authors.
Response: We clarified the source for each dataset in the “2.1 Data”, meanwhile
deleted the unnecessary algorithm details from “2.2 Methods”.
Page 10
10
2.1 Data
The monthly grid data of the temperature and precipitation series from 2000-2014,
with a spatial resolution of 0.5 degrees, were collected from the Climatic Research
Unit (http://www.cru.uea.ac.uk/data/). The radiation and soil moisture data series was
issued by the Global Land Data Assimilation System (GLDAS-1), with a spatial
resolution of 0.25 degrees (http://gdata1.sci.gsfc.nasa.gov/daac-bin/
G3/gui.cgi?instance_id=GLDAS025_M). The depths of the four soil layers are: 0-10
cm, 10-40 cm, 40-100 cm, and 100-200 cm. The quality of the GLDAS data set was
assessed against available observations from multiple sources (Zhang et al., 2008;
Chen et al., 2013).
The monthly data of the Palmer Drought Severity Index (PDSI), with a spatial
resolution of 2.5 degrees, was available at http://www.cgd.ucar.edu/cas/catalog/
climind/pdsi.html. As an indicator of land-surface moisture conditions, PDSI has been
widely used for the routine monitoring and assessment of global and regional drought
conditions. The global dry areas were defined as PDSI < -3.0, while the wet areas
were defined as PDSI > + 3.0 (Dai et al., 2004).
We used the Global Land Cover Characterization data from the International
Geosphere-Biosphere Program (IGBP) in 2000 (http://edc2.usgs.gov/glcc/glcc.php),
along with MODIS in 2000 and 2013 (http://modis.gsfc.nasa.gov/data/dataprod
/mod12.php). From these data, a routinely integrated classification of land use/cover
change (LUCC) characteristics was obtained based on the feature fusion processes.
The global 1-km MODIS NPP datasets (2000-2014) are from MOD17. NPP
estimations are typically model-based and biogeochemical, and are generated from a
larger set of simulated C fluxes between the atmosphere and terrestrial ecosystems
(Ito et al., 2011). A better agreement of MODIS and terrestrial NPP estimates allows
the use of MODIS in large-scale estimates (Neumann et al., 2015).
The MODIS evapotranspiration datasets (2000-2014) from MOD16 are estimated
using Mu and colleagues’ (2011) improved ET algorithm over Mu et al.’s (2007)
previous paper. Based on the energy-balance theory and the Penman-Monteith
equation, the required MODIS data inputs for the ET algorithms include daily
meteorology (temperature, actual vapor pressure, and incoming solar radiation)
remotely-sensed land cover, FPAR/LAI, and albedo (Friedl et al., 2010; Myneni et al.,
2002). We unified the spatiotemporal resolution of these data from different sources,
based on re-sampling (nearest neighbor interpolation) and re-classification techniques.
Page 11
11
2.2 Methods
Trend analysis. To further discern the trends of yearly NPP and ET, we examined
linear trend estimations on a per-pixel basis to establish a linear regression
relationship between variables and time.
Partial correlation analysis. This method is used to describe the relationship
between two variables while taking away the effects of several other variables. The
partial correlation of x1 and x2 is adjusted for a third variable y (at a significance level
of 0.05 by t-Test):
1 2 1 2
1 22 2
=1 1
1 2
x x x y x yx x y
x y x y
r r rr
r r
(1)
8. Results and Analyses
Statistical correlation and causation are related but different concepts. See my general
comments. Need to check some sentences with strong statements (of causation).
Response: Thanks for the reviewer’s comment. Please see the response to the
comment 2.
9. Table 1: remove “over”. The heading for Column 4 is not correct. Please double check
this.
Response: We corrected the table 1 in the revision.
Table 1. Correlations between NPP and climatic variables for both hemispheres
Zones NPP trend
PgC yr-2
T trend
℃ yr-2
P trend
mm yr-2
Rn trend
W m-2
yr-2
PDSI trend
yr-2
NH high latitudes
(>47.5°N) y=0.02x+30.51
y=0.021x-5.75
R= 0.60*
y=0.104x+46.58
R=0.29
y=-5.21x+453.6
R=0.45
y=-0.005x+0.23
R=0.44
NH mid/low
latitudes (<47.5°N) y=0.07x+45.68
y=0.009x+18.3
R= -0.17
y=0.341x+76.8
R= 0.70**
y=3.239x+105.9
R=0.50
y=0.006x-0.46
R=0.56
South Hemisphere y=-0.18x+78.37 y=0.010x+21.6
R= -0.53
y=0.074x+116.8
R=0.37
y=2.455x+129.4
R=0.43
y=-0.042x+0.33
R= 0.70**
10. Figures (changes in both captions and map legends)
Figure 1: use “Temporospatial”. Which year of C and D for? Legends (C and D):
remove “trend”
Response: We updated Figure 1 according to the reviewer’s comments.
Page 12
12
Fig. 1. Temporospatial variations in global terrestrial NPP and ET from 2000-2014. (a)
Inter-annual variations of NPP and ET in the Northern Hemisphere (NH). (b)
Inter-annual variations of NPP and ET in the Southern Hemisphere (SH). (c) Spatial
pattern of NPP trend from 2000-2014. (d) Spatial pattern of ET trend from 2000-2014.
11. Figure 2: remove “trend” in the legend
Response: We updated Figure 2 according to the reviewer’s comments.
Fig. 2. Trends of air temperature (T), precipitation (P), net radiation (Rn) and Palmer
Drought Severity Index (PDSI) from 2000-2014.
Page 13
13
12. Figure 3: add “or” in front of (d)
Response: We corrected the caption according to the reviewer’s comments.
Fig. 3. Partial correlations between NPP and (a) Temperature, (b) Precipitation, (c)
Net radiation, or (d) PDSI in growing season
Figure 4: add a map to show NPP (should be (a)). Also remove “trend” in the legend.
Response: We have removed “trend” in the legend. Because of the NPP has already
showed in the figure 1(c), here probably does not need to appear again.
Fig. 4. (a) Spatial pattern of PET trend. (b) Partial correlations between NPP and PET.
Page 14
14
Figure 5: Remove “trend” in the legend. Change the title into “—-in layers with different
depths."
Response: We updated the Figure 5 according to the reviewer’s comments.
Fig. 5. Trends of soil moisture -in layers with different depths in 2000-2014.