Keywords: Reservoir geological profile; QuantyView; REST data services; Automatic drawing. Abstract. Reservoir geological profile is an important basic map for zone evaluation and target demonstration. Now oil field departments often use Resform and Coreldraw to draw geological profile, and it's a complicated process with multiple steps. In this paper, based on QuantyView, data integration is made rapidly through accessing REST data services, thus drawing process is simplified and drawing efficiency is improved.
Introduction The geological section map is an important result map reflecting the stratum structure and the rock mass attribute. It is the most direct and effective expression of the stratum in the vertical direction [1] and the reservoir geological map is an important basic map for the evaluation of the zone and the demonstration of the target. At present, various geological profile mapping software imported by oil field, such as GeoFrame, ResForm, DGR3000 and so on, which need tedious data preparation and complicated drawing process. In this paper, based on the QuantyView[2] (a geological information system software developed by China University of Geosciences (Wuhan) Geological Information Research Institute based on GDI+) 2D platform as the development platform, we obtain the original data through the data service, then data integration is made, and we choose XML (Extensible Markup Language) [3] file as a template for single well histogram, rendering the reservoir geological profile the automatic connection and interaction. XML providing a loose tree structure representing semi-structured data [4,5,6], has the characteristics of strict definition, clear structure, flexible and easy to read, we can flexibly customize template content by adding and deleting node information, through which we can meet drawing requirements of histogram with different parameters.
Integrated drawing method of reservoir geological profile There are two problems in drawing a reservoir profile using the current software such as GeoFrame. On the one hand, it takes a lot of time for researchers to download and sort data, and it's prone to make mistakes in the data formatting process. On the other hand, the process is tedious, and the data need to be transformed from Resform to CorelDraw. Drawing a map will take a long time for geological personnel, and will affect the efficiency of work.
Improved methods is put forward in this paper for solving the existing problems of rendering methods, as shown in Fig.1. In this method, you only need to select the list of wells to draw and load the XML template. The program takes the data from the database and returns it in JSON format, depending on the content of the request. After the data is obtained, the automatic drawing of the well section is carried out on the QuantyView2D platform.
6th International Conference on Measurement, Instrumentation and Automation (ICMIA 2017)
Advances in Intelligent Systems Research, volume 154
170
DataBase
REST Data Service
XML Template
QuantyView2D Platform
Continuous well profile
List of target wells
Fig. 1 Rapid rendering method flow chart
In this process, the process of data acquisition, data processing and drawing is automatically carried out in memory, which reduces manual intervention, simplifies the operation steps and improves the rendering efficiency.
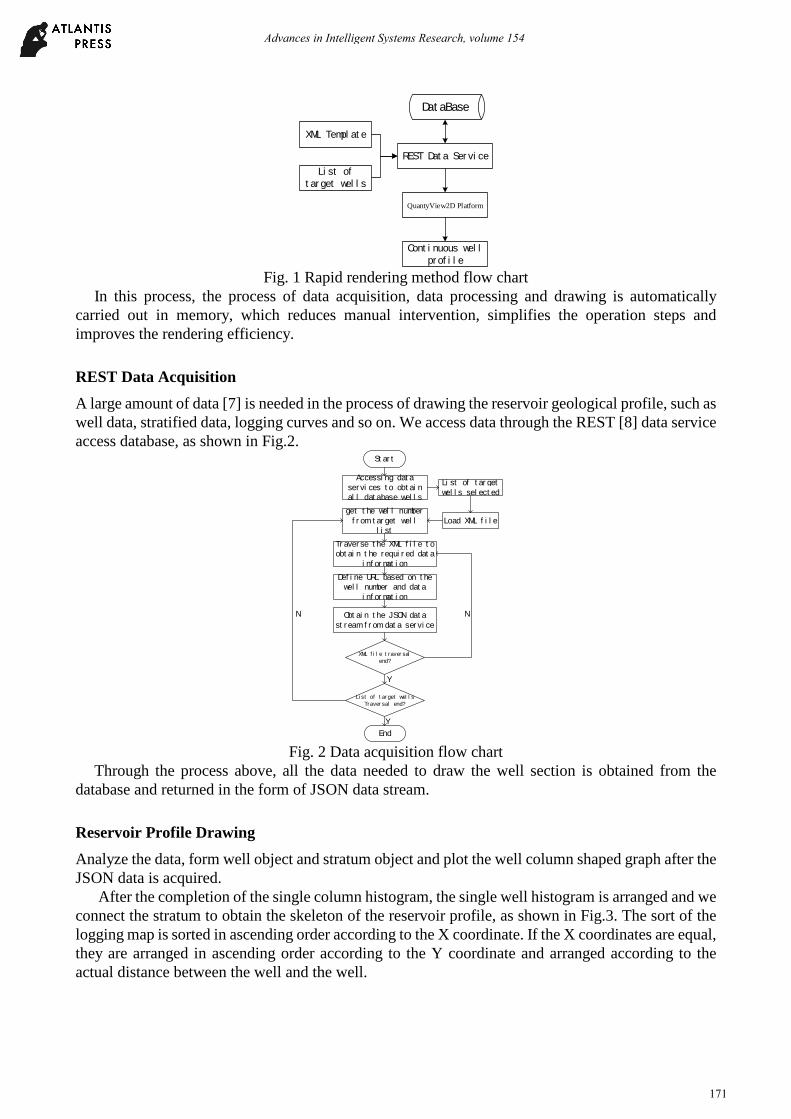
REST Data Acquisition A large amount of data [7] is needed in the process of drawing the reservoir geological profile, such as well data, stratified data, logging curves and so on. We access data through the REST [8] data service access database, as shown in Fig.2.
Start
Accessing data services to obtain all database wells
List of target wells selected
get the well number from target well
list
Traverse the XML file to obtain the required data
information
Define URL based on the well number and data
information
Obtain the JSON data stream from data service
End
List of target wellsTraversal end?
XML file traversal end?
Load XML file
N
Y
N
Y
Fig. 2 Data acquisition flow chart
Through the process above, all the data needed to draw the well section is obtained from the database and returned in the form of JSON data stream.
Reservoir Profile Drawing Analyze the data, form well object and stratum object and plot the well column shaped graph after the JSON data is acquired.
After the completion of the single column histogram, the single well histogram is arranged and we connect the stratum to obtain the skeleton of the reservoir profile, as shown in Fig.3. The sort of the logging map is sorted in ascending order according to the X coordinate. If the X coordinates are equal, they are arranged in ascending order according to the Y coordinate and arranged according to the actual distance between the well and the well.
Advances in Intelligent Systems Research, volume 154
171
Fig. 3 Automatic generation of reservoir geological profile framework
Conclusions In this paper, we analyzed the problems and deficiencies in the reservoir geological profile drawing general practice. We access the database through the data service, integrate the data, build well object, with the XML file as a single well column template, through which reservoir geological section is rendered rapidly. This method has been applied to the profile mapping of Shengli Oilfield, and good results have been achieved.
Acknowledgements This work was supported by the National Natural Science Foundation of China through Grant (41572336).
References [1] Ying Zhu, Xuejun Liu, SuoZhong Chen. Design and implementation of automatic drawing system for geological section[J].Yangtze River, 2008,08:72-74.(In Chinese)
[3] Extensible Markup Language (XML) 1.1 (SecondEdition)[EB/OL].[2016-12-26].http://www.w3.org/TR/2006/REC-xml11-20060816/.
[4] Beeri C, Milo T .Schemas for Integration and Translation of Structured and Semi-Structured ∥Data[M] Lecture Notes in Computer Science,1999.
[5] Jun Feng, Bo Ding, Dianxi Shi, etc. Research on the XML Parsing Technology [J]. COMPUTER ENGINEERING & SCIENCE, 2009,02:120-124.(In Chinese)
[6] Qing Pu, YaoQing Fu, Xiaohong Wu, etc. Remote Logging Curve Drawing Based on ActiveX and XML Technology. Computer and Digital Engineering, 2013,06:996-998. (In Chinese)
[7] Jinhai Qiao, Yuxin Ye, Yongqiang Y, etc. Maps database management system of mineral resources prediction of synthetic information based on geology-geophysics-geochemical and remote sensing. Progress in Geophysics, 2007, 22 (3) : 984-988.
Advances in Intelligent Systems Research, volume 154
172
[8] Web service based on REST:Basics [EB/OL].[2016-12-26].https://www.ibm.com/developerworks/cn/webservices/ws-restful/.
Advances in Intelligent Systems Research, volume 154