2015 Restaurant Industry Crime & Security Measure Usage TrendsResults include data from over 18,000 restaurant locations — representing over 30% of the RLPSA membership.
Survey designed, conducted, and analyzed by:
OUTSMART CRIME
Survey Overview
This study was conducted through the active Regular Members of the RLPSA. It is intended as a continued effort to monitor incident patterns and security measure use in the restaurant industry. The goal of the survey is to help member companies gain a greater awareness of the practices of other industry companies and how those measures are best put to use.
This study is for internal informational purposes only. The RLPSA may, at the discretion of its members, make the information available for general use at a later date. The RLPSA believes that this type of initiative will assist industry professionals in finding tools to reduce crime in the industry and make restaurants as safe as is reasonably possible for our employees and customers alike.
Survey Question Categories:
• Robbery experience, 2012-2014
• Aggravated assault experience, 2012-2014
• Burglary experience, 2012-2014
• Security measure use, 2015
Total: 15 Brands with 18,265 Restaurants
Note: On the pages that follow, survey results will be reported for individual subsegments only in cases where at least three respondents answered a question.
Restaurant Subsegments Store Count
QSR: 66.7%10 Brands
Full Service Dining: 20.0%3 Brands
Quick Casual: 6.7%1 Brand
QSR/Delivery/ Quick Casual: 6.7%1 Brand
0-99 Locations: 13.3%2 Brands
100-500 Locations: 46.7%7 Brands
500+ Locations: 40.0%6 Brands
Survey designed, conducted, and analyzed by Restaurant Loss Prevention & Security Association (RLPSA) and CAP Index, Inc. Please note that the survey findings are preliminary and based on a limited study sample. Findings are to be perceived as directional indicators rather than definitive assessments. The RLPSA and CAP Index do not take responsibility for the accuracy of the responses provided.
Survey designed, conducted, and analyzed by Restaurant Loss Prevention & Security Association (RLPSA) and CAP Index, Inc. Please note that the survey findings are preliminary and based on a limited study sample. Findings are to be perceived as directional indicators rather than definitive assessments. The RLPSA and CAP Index do not take responsibility for the accuracy of the responses provided.
• QSR locations showed a drop in robberies over the three years.
• Full Service Dining restaurants had far fewer robberies and no consistent pattern over time.
• The vast majority of robberies occurred inside of a restaurant.
• The survey did not differentiate between aggravated and non-aggravated robberies.
Survey designed, conducted, and analyzed by Restaurant Loss Prevention & Security Association (RLPSA) and CAP Index, Inc. Please note that the survey findings are preliminary and based on a limited study sample. Findings are to be perceived as directional indicators rather than definitive assessments. The RLPSA and CAP Index do not take responsibility for the accuracy of the responses provided.
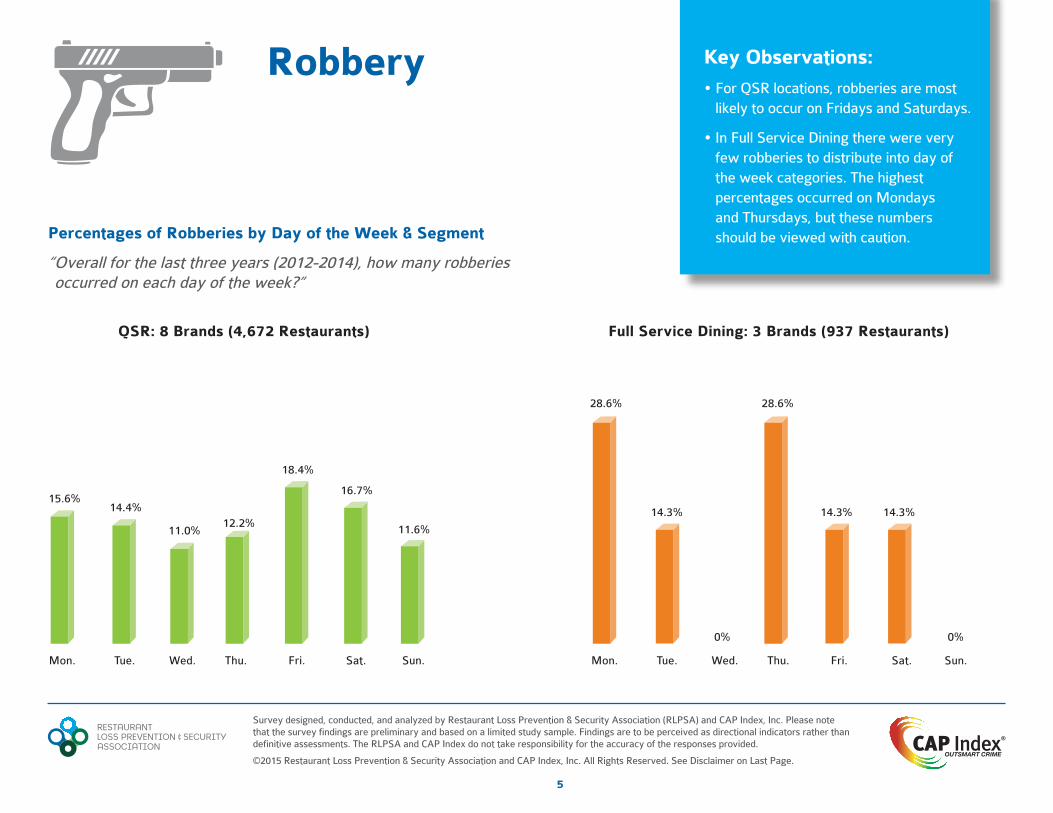
• For QSR locations, robberies are most likely to occur on Fridays and Saturdays.
• In Full Service Dining there were very few robberies to distribute into day of the week categories. The highest percentages occurred on Mondays and Thursdays, but these numbers should be viewed with caution.
Survey designed, conducted, and analyzed by Restaurant Loss Prevention & Security Association (RLPSA) and CAP Index, Inc. Please note that the survey findings are preliminary and based on a limited study sample. Findings are to be perceived as directional indicators rather than definitive assessments. The RLPSA and CAP Index do not take responsibility for the accuracy of the responses provided.
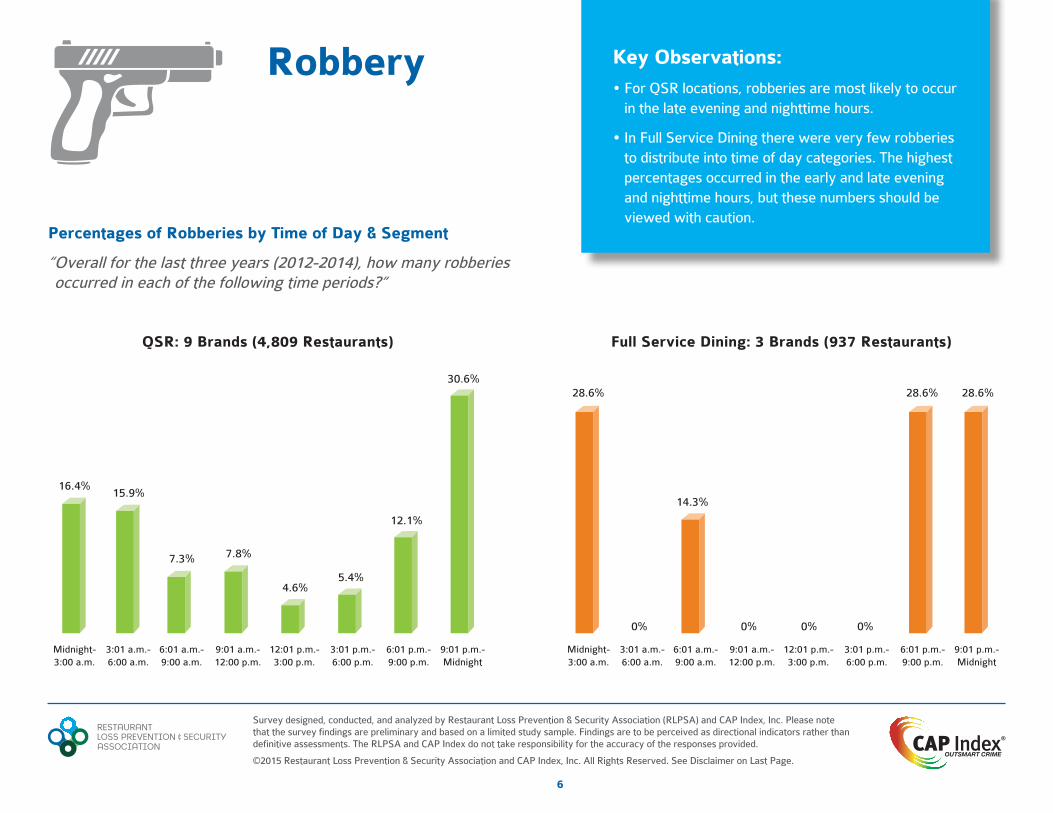
“ Overall for the last three years (2012-2014), how many robberies occurred in each of the following time periods?”
0%0% 0% 0%
28.6% 28.6% 28.6%
14.3%
Midnight- 3:00 a.m.
6:01 a.m.- 9:00 a.m.
3:01 p.m.- 6:00 p.m.
3:01 a.m.- 6:00 a.m.
12:01 p.m.- 3:00 p.m.
9:01 a.m.- 12:00 p.m.
6:01 p.m.- 9:00 p.m.
9:01 p.m.- Midnight
Midnight- 3:00 a.m.
6:01 a.m.- 9:00 a.m.
3:01 p.m.- 6:00 p.m.
3:01 a.m.- 6:00 a.m.
12:01 p.m.- 3:00 p.m.
9:01 a.m.- 12:00 p.m.
6:01 p.m.- 9:00 p.m.
9:01 p.m.- Midnight
16.4%
4.6%5.4%
7.3%
12.1%
30.6%
7.8%
15.9%
QSR: 9 Brands (4,809 Restaurants) Full Service Dining: 3 Brands (937 Restaurants)
Key Observations:
• For QSR locations, robberies are most likely to occur in the late evening and nighttime hours.
• In Full Service Dining there were very few robberies to distribute into time of day categories. The highest percentages occurred in the early and late evening and nighttime hours, but these numbers should be viewed with caution.
Survey designed, conducted, and analyzed by Restaurant Loss Prevention & Security Association (RLPSA) and CAP Index, Inc. Please note that the survey findings are preliminary and based on a limited study sample. Findings are to be perceived as directional indicators rather than definitive assessments. The RLPSA and CAP Index do not take responsibility for the accuracy of the responses provided.
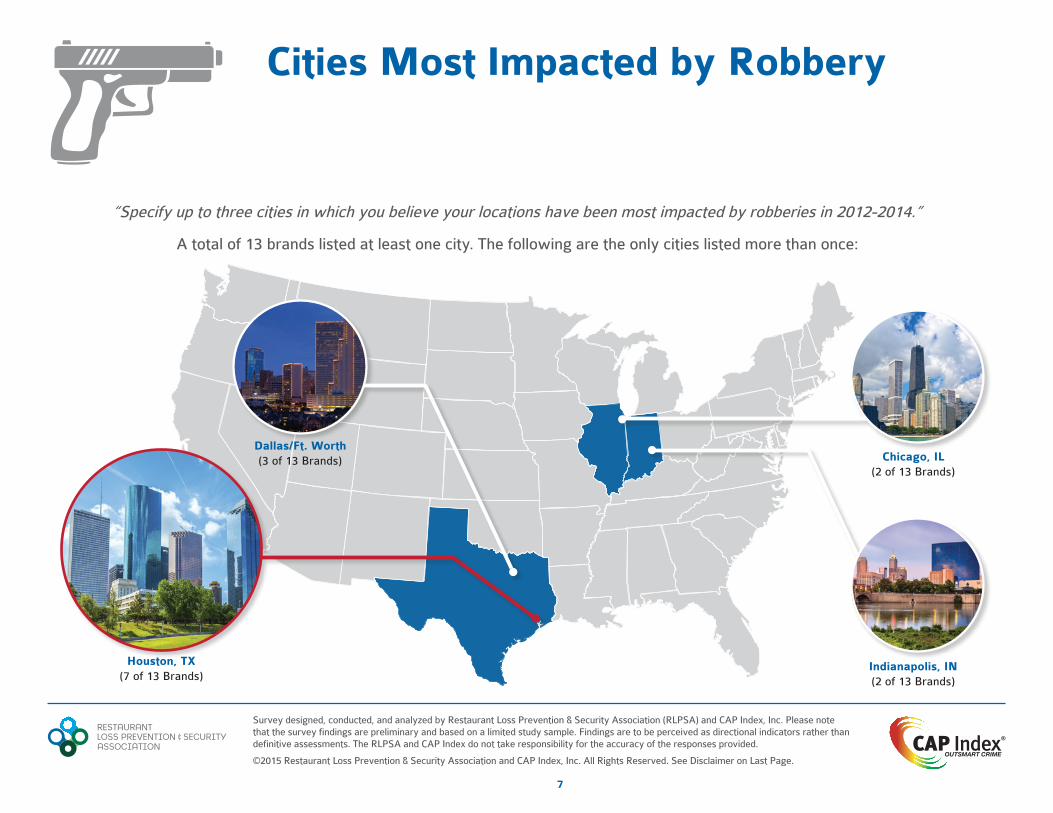
“Specify up to three cities in which you believe your locations have been most impacted by robberies in 2012-2014.”
A total of 13 brands listed at least one city. The following are the only cities listed more than once:
Chicago, IL (2 of 13 Brands)
Indianapolis, IN (2 of 13 Brands)
Houston, TX (7 of 13 Brands)
Dallas/Ft. Worth (3 of 13 Brands)
Survey designed, conducted, and analyzed by Restaurant Loss Prevention & Security Association (RLPSA) and CAP Index, Inc. Please note that the survey findings are preliminary and based on a limited study sample. Findings are to be perceived as directional indicators rather than definitive assessments. The RLPSA and CAP Index do not take responsibility for the accuracy of the responses provided.
Aggravated Assault Rates per 100 Restaurants by Year & Segment
“ How many aggravated assaults were reported for your entire portfolio of locations in 2012-2014?”
Percentages of Aggravated Assaults Inside/Outside by Segment
“ Overall for the last three years (2012-2014), how many aggravated assaults occurred inside vs. outside of a location (parking lot, etc.)?”
All Segments QSR
1.9 1.9
2012 20122013 20132014 2014
1.7 1.71.7 1.7
12 Brands 15,545 Restaurants
10 Brands 15,309 Restaurants
Inside Outside
QSR
60.8%
39.2%
10 Brands 15,309 Restaurants
Key Observations:
• QSR restaurants showed a modest drop in aggravated assaults over the 3 years.
• The majority of aggravated assaults oc-curred inside of a restaurant.
Survey designed, conducted, and analyzed by Restaurant Loss Prevention & Security Association (RLPSA) and CAP Index, Inc. Please note that the survey findings are preliminary and based on a limited study sample. Findings are to be perceived as directional indicators rather than definitive assessments. The RLPSA and CAP Index do not take responsibility for the accuracy of the responses provided.
• For QSR locations, aggravated assaults are most likely to occur on Sundays.
• For QSR locations, aggravated assaults are most likely to occur in the late evening and nighttime hours.
Aggravated Assault
Survey designed, conducted, and analyzed by Restaurant Loss Prevention & Security Association (RLPSA) and CAP Index, Inc. Please note that the survey findings are preliminary and based on a limited study sample. Findings are to be perceived as directional indicators rather than definitive assessments. The RLPSA and CAP Index do not take responsibility for the accuracy of the responses provided.
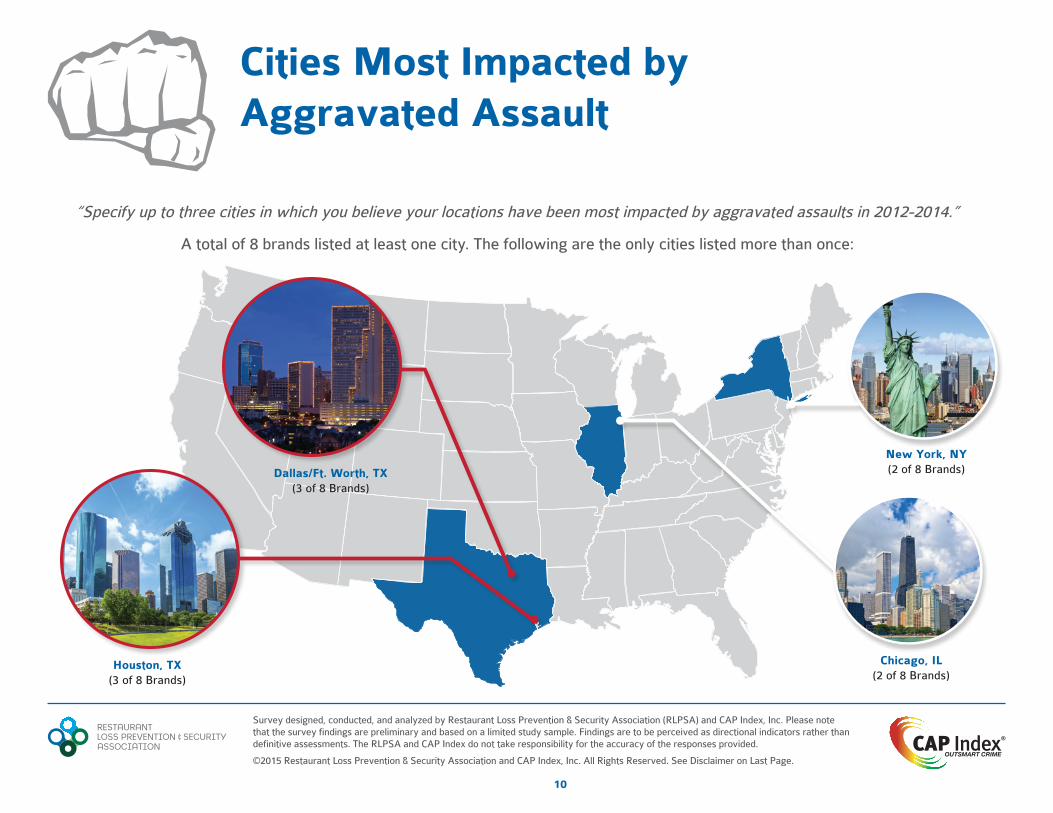
“Specify up to three cities in which you believe your locations have been most impacted by aggravated assaults in 2012-2014.”
A total of 8 brands listed at least one city. The following are the only cities listed more than once:
Dallas/Ft. Worth, TX (3 of 8 Brands)
New York, NY (2 of 8 Brands)
Houston, TX (3 of 8 Brands)
Chicago, IL (2 of 8 Brands)
Cities Most Impacted by Aggravated Assault
Survey designed, conducted, and analyzed by Restaurant Loss Prevention & Security Association (RLPSA) and CAP Index, Inc. Please note that the survey findings are preliminary and based on a limited study sample. Findings are to be perceived as directional indicators rather than definitive assessments. The RLPSA and CAP Index do not take responsibility for the accuracy of the responses provided.
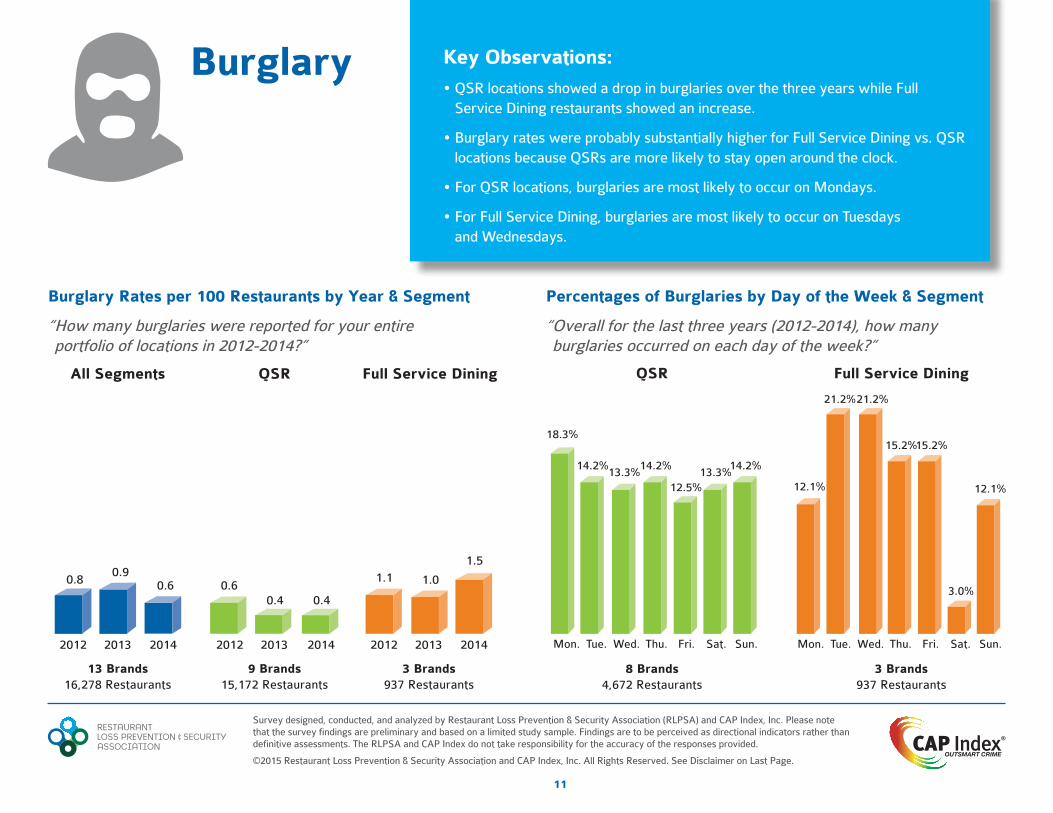
• QSR locations showed a drop in burglaries over the three years while Full Service Dining restaurants showed an increase.
• Burglary rates were probably substantially higher for Full Service Dining vs. QSR locations because QSRs are more likely to stay open around the clock.
• For QSR locations, burglaries are most likely to occur on Mondays.
• For Full Service Dining, burglaries are most likely to occur on Tuesdays and Wednesdays.
Burglary Rates per 100 Restaurants by Year & Segment
“ How many burglaries were reported for your entire portfolio of locations in 2012-2014?”
Percentages of Burglaries by Day of the Week & Segment
“ Overall for the last three years (2012-2014), how many burglaries occurred on each day of the week?”
Survey designed, conducted, and analyzed by Restaurant Loss Prevention & Security Association (RLPSA) and CAP Index, Inc. Please note that the survey findings are preliminary and based on a limited study sample. Findings are to be perceived as directional indicators rather than definitive assessments. The RLPSA and CAP Index do not take responsibility for the accuracy of the responses provided.
Percentages of Burglaries by Time of Day & Segment
“ Overall for the last three years (2012-2014), how many burglaries occurred in each of the following time periods?”
Key Observations:
• For QSR and Full Service Dining locations, burglaries are most likely to occur in the nighttime hours.
0%0% 0%0% 0% 0%0% 0% 0% 0%
54.5%
Midnight- 3:00 a.m.
6:01 a.m.- 9:00 a.m.
3:01 p.m.- 6:00 p.m.
3:01 a.m.- 6:00 a.m.
12:01 p.m.- 3:00 p.m.
9:01 a.m.- 12:00 p.m.
6:01 p.m.- 9:00 p.m.
9:01 p.m.- Midnight
Midnight- 3:00 a.m.
6:01 a.m.- 9:00 a.m.
3:01 p.m.- 6:00 p.m.
3:01 a.m.- 6:00 a.m.
12:01 p.m.- 3:00 p.m.
9:01 a.m.- 12:00 p.m.
6:01 p.m.- 9:00 p.m.
9:01 p.m.- Midnight
10.0%
0.8%
45.0% 45.5%44.2%
QSR: 8 Brands (4,672 Restaurants) Full Service Dining: 3 Brands (937 Restaurants)
Burglary
Survey designed, conducted, and analyzed by Restaurant Loss Prevention & Security Association (RLPSA) and CAP Index, Inc. Please note that the survey findings are preliminary and based on a limited study sample. Findings are to be perceived as directional indicators rather than definitive assessments. The RLPSA and CAP Index do not take responsibility for the accuracy of the responses provided.
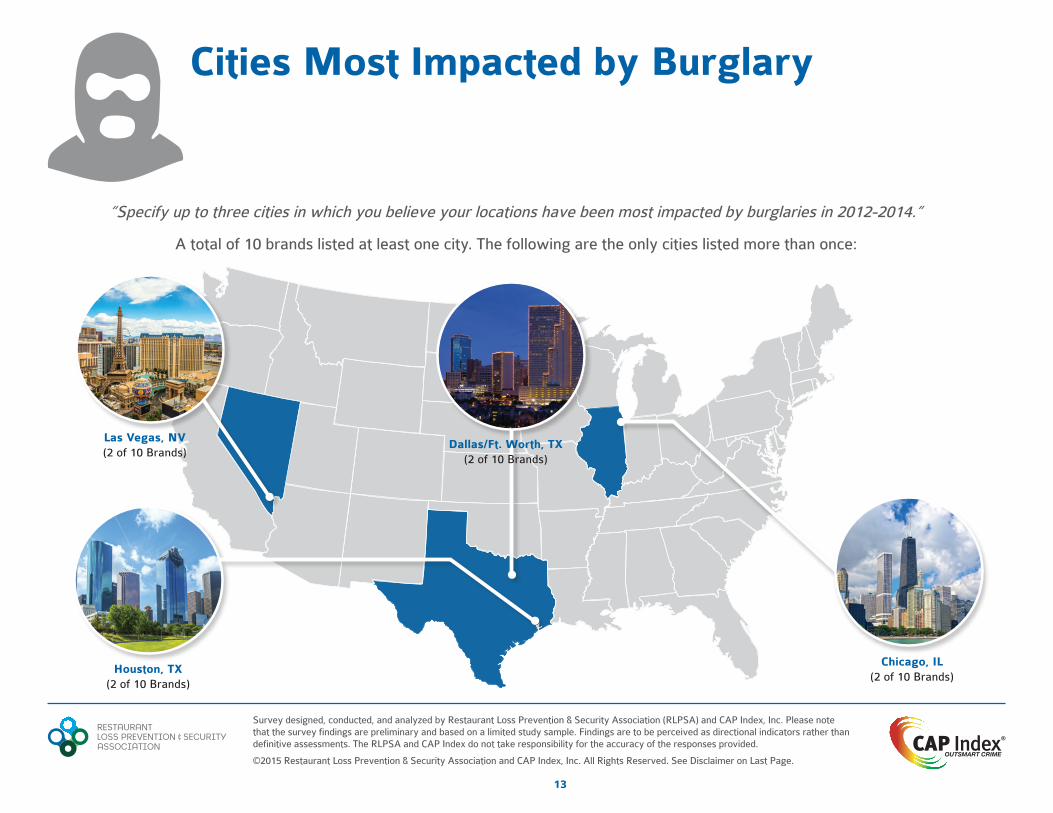
“Specify up to three cities in which you believe your locations have been most impacted by burglaries in 2012-2014.”
A total of 10 brands listed at least one city. The following are the only cities listed more than once:
Dallas/Ft. Worth, TX (2 of 10 Brands)
Houston, TX (2 of 10 Brands)
Chicago, IL (2 of 10 Brands)
Las Vegas, NV (2 of 10 Brands)
Cities Most Impacted by Burglary
Survey designed, conducted, and analyzed by Restaurant Loss Prevention & Security Association (RLPSA) and CAP Index, Inc. Please note that the survey findings are preliminary and based on a limited study sample. Findings are to be perceived as directional indicators rather than definitive assessments. The RLPSA and CAP Index do not take responsibility for the accuracy of the responses provided.
Survey designed, conducted, and analyzed by Restaurant Loss Prevention & Security Association (RLPSA) and CAP Index, Inc. Please note that the survey findings are preliminary and based on a limited study sample. Findings are to be perceived as directional indicators rather than definitive assessments. The RLPSA and CAP Index do not take responsibility for the accuracy of the responses provided.
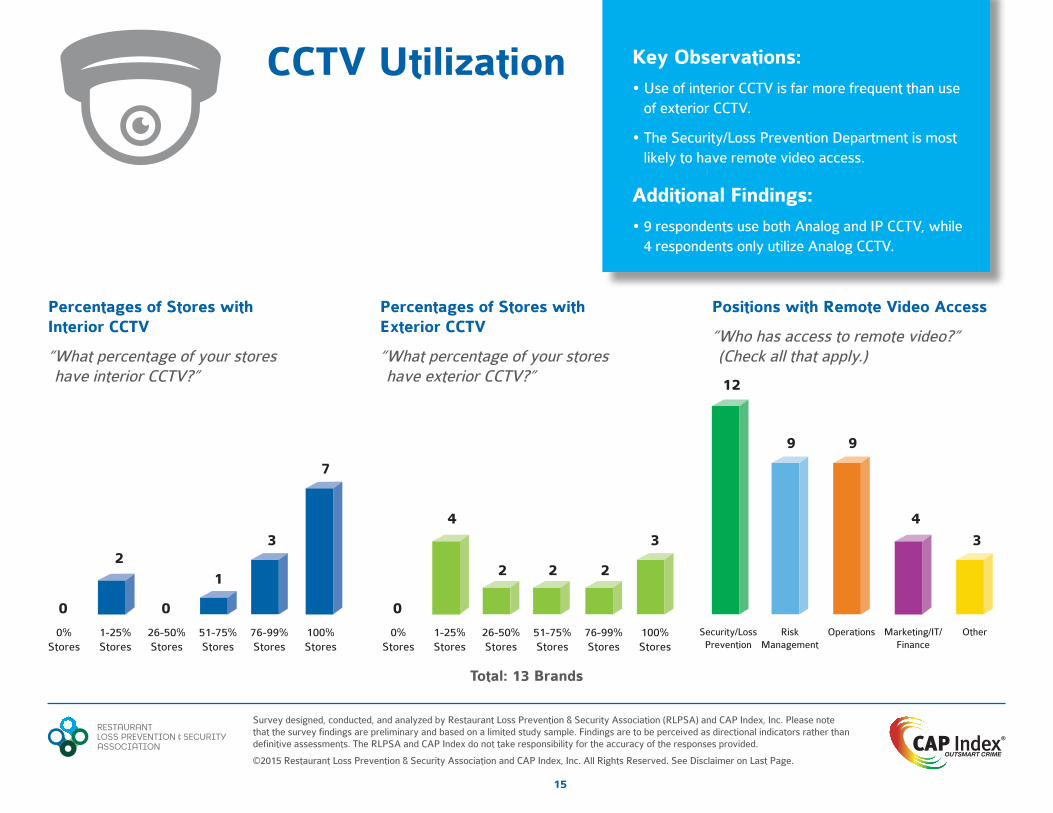
“ What percentage of your stores have interior CCTV?”
Percentages of Stores with Exterior CCTV
“ What percentage of your stores have exterior CCTV?”
Positions with Remote Video Access
“ Who has access to remote video?” (Check all that apply.)
Total: 13 Brands
Key Observations:
• Use of interior CCTV is far more frequent than use of exterior CCTV.
• The Security/Loss Prevention Department is most likely to have remote video access.
Additional Findings:
• 9 respondents use both Analog and IP CCTV, while 4 respondents only utilize Analog CCTV.
4 4
2 22
9 9
3 3
12
0% Stores
1-25%Stores
26-50%Stores
51-75%Stores
76-99%Stores
100% Stores
Security/Loss Prevention
Risk Management
Operations Marketing/IT/Finance
Other
0
7
21
3
0% Stores
1-25%Stores
26-50%Stores
51-75%Stores
76-99%Stores
100% Stores
0 0
Survey designed, conducted, and analyzed by Restaurant Loss Prevention & Security Association (RLPSA) and CAP Index, Inc. Please note that the survey findings are preliminary and based on a limited study sample. Findings are to be perceived as directional indicators rather than definitive assessments. The RLPSA and CAP Index do not take responsibility for the accuracy of the responses provided.
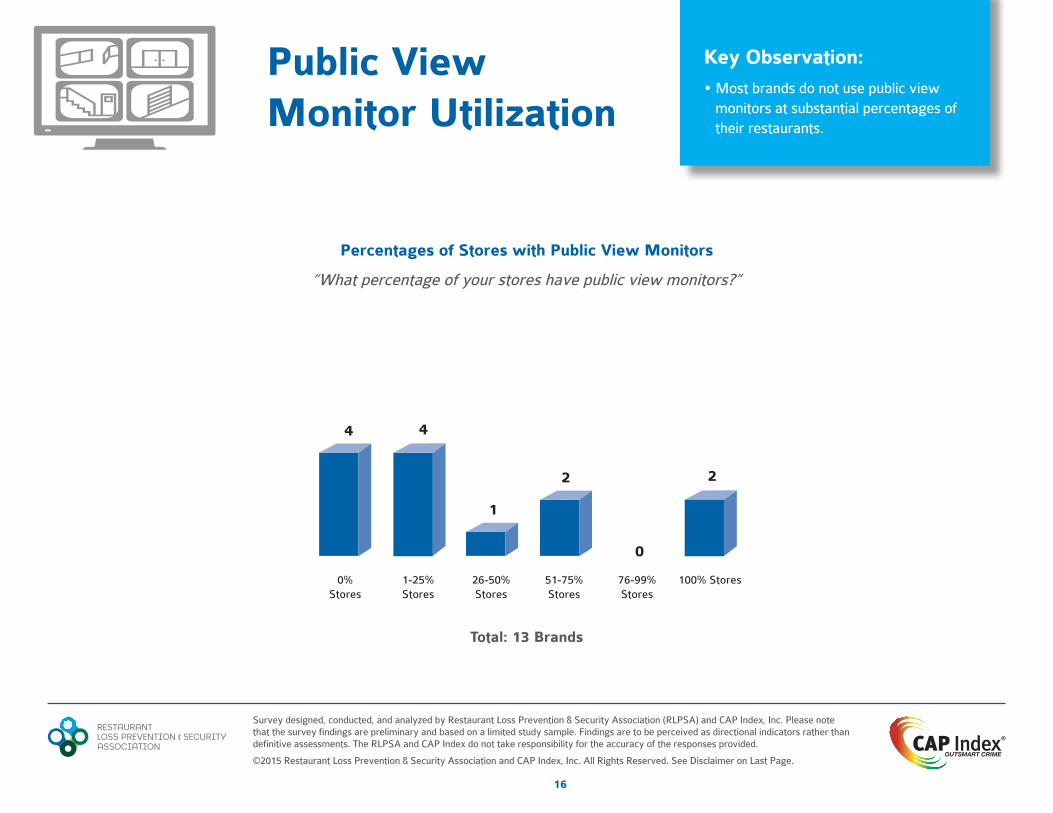
• Most brands do not use public view monitors at substantial percentages of their restaurants.
Percentages of Stores with Public View Monitors
“What percentage of your stores have public view monitors?”
Total: 13 Brands
2
4
2
1
0
4
0% Stores
1-25%Stores
26-50%Stores
51-75%Stores
76-99%Stores
100% Stores
Survey designed, conducted, and analyzed by Restaurant Loss Prevention & Security Association (RLPSA) and CAP Index, Inc. Please note that the survey findings are preliminary and based on a limited study sample. Findings are to be perceived as directional indicators rather than definitive assessments. The RLPSA and CAP Index do not take responsibility for the accuracy of the responses provided.
Survey designed, conducted, and analyzed by Restaurant Loss Prevention & Security Association (RLPSA) and CAP Index, Inc. Please note that the survey findings are preliminary and based on a limited study sample. Findings are to be perceived as directional indicators rather than definitive assessments. The RLPSA and CAP Index do not take responsibility for the accuracy of the responses provided.
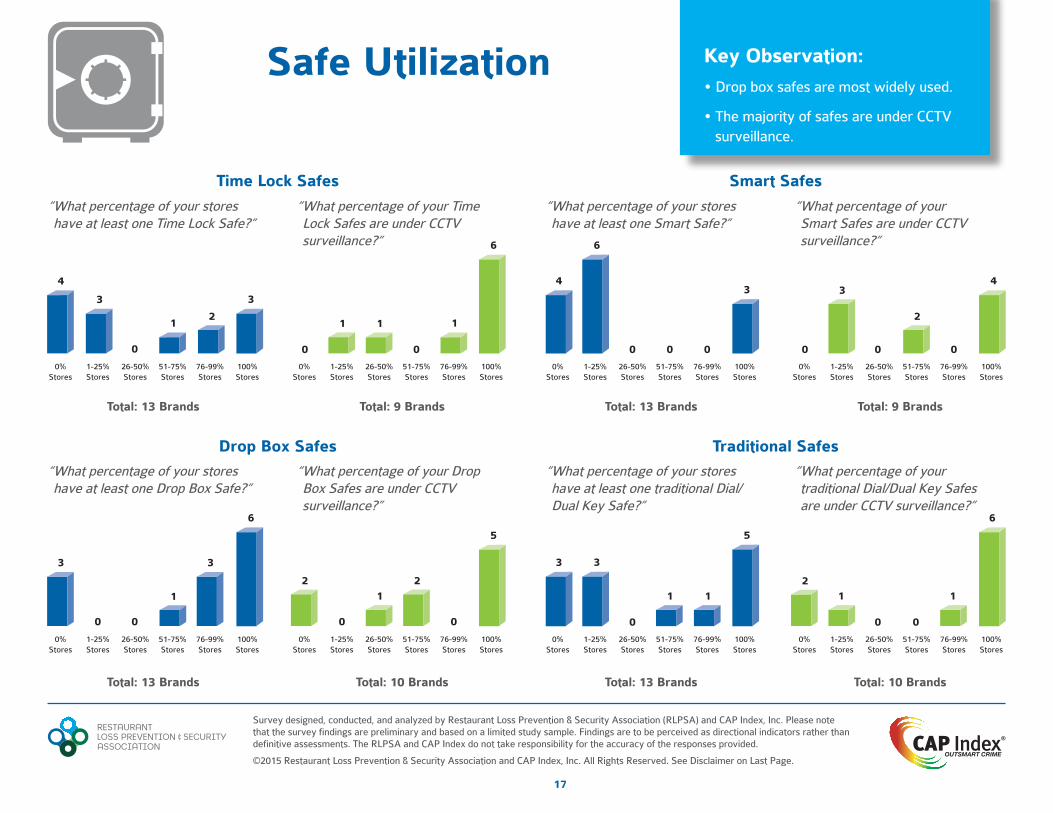
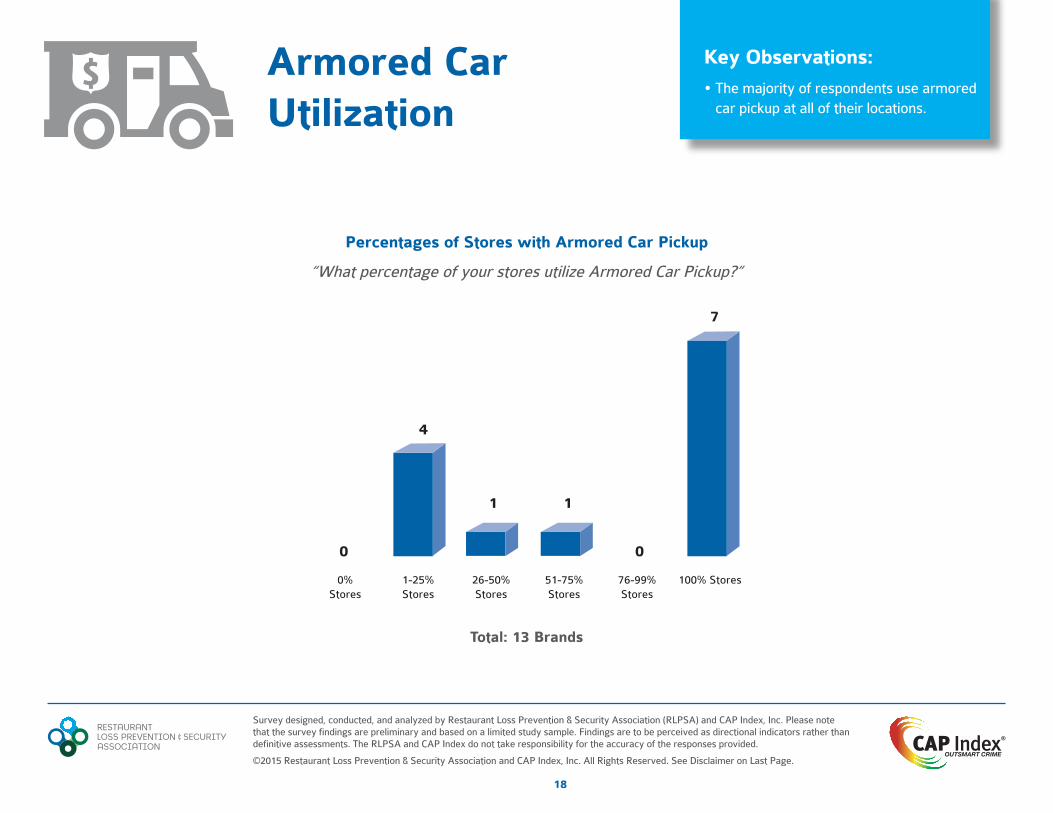
• The majority of respondents use armored car pickup at all of their locations.
Percentages of Stores with Armored Car Pickup
“What percentage of your stores utilize Armored Car Pickup?”
Total: 13 Brands
7
4
1 1
00
0% Stores
1-25%Stores
26-50%Stores
51-75%Stores
76-99%Stores
100% Stores
Survey designed, conducted, and analyzed by Restaurant Loss Prevention & Security Association (RLPSA) and CAP Index, Inc. Please note that the survey findings are preliminary and based on a limited study sample. Findings are to be perceived as directional indicators rather than definitive assessments. The RLPSA and CAP Index do not take responsibility for the accuracy of the responses provided.
About CAP Index, Inc.For over 25 years, CAP Index has been the leader in crime risk forecasting, serving over 80% of the Fortune 100, 8 of the top 10 restaurant brands, 20 of the top 25 retailers, 23 of the top 25 financial institutions, and over 12 government agencies. Today more than 5,000 customers use our CRIMECAST® Maps and Reports, analytics, and software solutions to help optimize resources, limit exposure, and minimize losses.
We deliver solutions for a multitude of challenges, including how to effectively leverage internal loss, shrink, fraud, liability, accident, and crime data. Our analytical and consulting expertise, web-based technology platforms, and innovative mapping tools put actionable solutions in the hands of decision makers. We help security, loss prevention, and risk management professionals objectively measure, thoroughly analyze, and proactively manage locations, assets, and crime risks.
Contact CAP Index today to learn how to unlock the power of data-driven crime risk intelligence that enables you to OUTSMART CRIME®.
For more information on CAP Index, contact:
Stephen B. LongoVice President, Strategic Initiatives
About RLPSAThe Restaurant Loss Prevention and Security Association (formerly NFSSC) is an exclusive community of restaurant loss prevention professionals focused on helping its members minimize losses and reduce liabilities, to positively impact company profitability.
We are industry leaders sharing our collective expertise, knowledge and solutions to the challenges we face every day. Our goal is to make our members more efficient and successful in their jobs by serving as the “go-to” resource for restaurant-industry loss prevention and security expertise.
As a member-run organization, we share information about industry trends and connect a network of peers who understand the unique challenges of the job, and who collaborate to find the next best solution. We create a forum for discussion and problem-solving, so that our members benefit from shared expertise. We provide professional development opportunities that are designed to meet the specific interests and concerns of restaurant-industry professionals, and we advocate for regulations that will make our workplaces more safe and secure.
Interested in becoming a member? Visit: www.rlpsa.com/join-us
Survey designed, conducted, and analyzed by Restaurant Loss Prevention & Security Association (RLPSA) and CAP Index, Inc. Please note that the survey findings are preliminary and based on a limited study sample. Findings are to be perceived as directional indicators rather than definitive assessments. The RLPSA and CAP Index do not take responsibility for the accuracy of the responses provided.
This Report is copyrighted and is the property of the Restaurant Loss Prevention & Security Association (RLPSA).
RLPSA and CAP Index, Inc. (CAP) have used reasonable efforts to include accurate and complete information in this Report. RLPSA and CAP make no representations or warranties that the information provided through this Report is accurate, complete or current. RLPSA and CAP may make changes to the information in this Report, at any time, without notice and make no commitment to update this information. The contents of this Report are the property of RLPSA. Distribution of the Report is to RLPSA Regular Members only. You may print and download portions of material from the different areas of the Report solely for your own non-commercial use. Any other copying, redistribution, retransmission or publication of any Report material, is strictly prohibited without the express written consent of RLPSA. By accepting this Report, you agree not to change or delete any information included in the Report. In no event shall RLPSA or CAP be liable for any special, indirect, or consequential damages or any damages whatsoever resulting from loss of use, data, or profits, whether in an action of contract, negligence, or other action, arising out of or in connection with the use or performance of documents, services, or information available from this Report.
The findings presented in this Report are intended to provide a basis of understanding for the reader on the issues presented. The information is not to be construed or used as a substitute for specific legal advice and may not reflect an analysis of all relevant variables or the operational feasibility of the considerations presented. Individuals seeking legal advice for a particular problem or issue should obtain advice from an attorney of their choosing.