52
Restoring EU competitiveness 2016 updated version

Restoring EU competitiveness 2016 updated version

I
Restoring EU competitiveness 2016 Updated version
II
Restoring EU competitiveness
January 2016
Prepared by the Projects Directorate and the Economics Department of the EIB.
Contributors: M. Berndt, G. Muent, D. Revoltella, T. Bending, E. Calthrop, G. Dunnett, S. Fitzpatrick,
M. Lundqvist, L. Piovesan, M. Scatasta, S. Stölting, T. Välila
© European Investment Bank
Disclaimer
This paper is based on preliminary research to stimulate discussion with stakeholders. The views expressed are those
of the authors and do not necessarily reflect the position of the EIB or its shareholders.
European Investment Bank III
Contents Foreword IV
Summary VII
Introduction: About this report 10
1. What is competitiveness? 11
The ability to create wealth 11
The ability to drive and adapt to change through innovation 11
The need for an enabling environment 11
2. The challenge for Europe 14
2.1 Wealth creation: Is Europe achieving its potential? 14
The GDP per capita gap and convergence 14
The productivity gap 16
Europe’s international trade performance 17
Employment 18
2.2 Europe’s capacity for change – innovation and adaptation 20
Europe’s R&D gap 20
R&D needs in key strategic sectors 22
Catching-up: the absorption of innovation 23
A dynamic business environment 26
2.3 An enabling environment for competitiveness 28
2.3.1 Human capital: education 28
2.3.2 Strategic infrastructure 29
Transport and logistics 29
Energy 31
Telecommunications 32
Water and waste 33
2.3.3 Financial sector capacity 35
Finance needs and financial systems 35
Financing start-ups and growth-stage firms 36
Financing SMEs 37
The impact of the crisis on financial capacity 38
2.3.4 Institutions and markets 40
2.4 EU Single Market 41
3. Responding to the challenge 44
The need for a comprehensive policy response 44
Supporting competitiveness – the EIB’s track record 45
The EIB and the Investment Plan for Europe – making a difference 46

IV European Investment Bank
Figures
Figure 1: Conceptualising competitiveness 13
Figure 2: GDP per capita, comparison between the EU28 and the US, PPP (constant 2014 USD) 14
Figure 3: GDP per capita in different parts of the EU, PPP (constant 2014 USD) 15
Figure 4: GDP per inhabitant, in PPS, 2013 (% of the EU28 average, EU28 = 100) 15
Figure 5: Change of GDP per inhabitant, in PPS, 2008–13 (in relation to EU28 average) 15
Figure 6: Labour productivity, compound annual growth rate (%), 2000-2007 and 2008-2014 16
Figure 7: Total factor productivity, average annual growth rate (%), 2000-2007 and 2008-2014 17
Figure 8: Shares in global value added exports of manufactured goods per capita (%) 17
Figure 9: Domestic value added content of gross manufacturing exports 18
Figure 10: Unemployment rate (% of the labour force, 15-74 years) 18
Figure 11: Employment rate, EU and leading economies (% of population 20-64 years) 18
Figure 12: Employment rate, EU28 by sex (% of population 20-64 years) 19
Figure 13: Projected age dependency ratios, EU28 (%) 19
Figure 14: Innovation environment, EU and leading economies 20
Figure 15: EU Innovation Union Scoreboard 20
Figure 16: Gross domestic expenditure on R&D (% of GDP) 21
Figure 17: Patent applications (per 1 million inhabitants) 21
Figure 18: Technological readiness, EU and leading economies 24
Figure 19: Productive investment (GFCF, excluding dwellings) as % of GDP 24
Figure 20: Productive investment (GFCF, excluding dwellings) against GDP per capita 24
Figure 21: Share of firms by growth bracket, comparison between the EU and the US 27
Figure 22: Regulation of product market and professional services 27
Figure 23: Performance on the ten components of Ease of Doing Business 27
Figure 24: External financing needs along the life cycle of firms 35
Figure 25: Bank loans and debt securities 36
Figure 26: Venture capital investments (% of GDP) 36
Figure 27: Venture capital availability 36
Figure 28: Venture capital, share of firms receiving VC Funding in Europe and the US (%) 37
Figure 29: Stock market capitalization 37
Figure 30: Access to finance difficulties in the euro area 38
Figure 31: Access to loans, comparison between 2015 and 2007 38
Figure 32: Medium-term fiscal constraints: required fiscal adjustments (% of GDP) 39
Figure 33: Bank leverage ratios 39
Figure 34: Institutional environment, EU and leading economies 40
Figure 35: Intra and extra-EU exports of goods (EUR bn) 41
Figure 36: Share of workers from other EU15 Member States (%) 42
Figure 37: Employment of foreign citizens, intra and extra EU-citizens (% of total population) 42
Tables Table 1: Investment needs in R&D 22 Table 2: Investment needs in industry 25 Table 3: Investment needs in education and basic research 29 Table 4: Investment needs in transport and logistics infrastructure 30 Table 5: Investment needs in the energy sector 32 Table 6: Investment needs in the telecommunications sector 33 Table 7: Investment needs in water and waste sectors 34

Restoring EU competitiveness | Foreword
European Investment Bank V
Foreword
The many years of crises that lie behind us – the
financial crisis, the euro area sovereign debt crisis
and now the migration crisis – have put Europe to
the test. National interests of Member States
have regained prominence and policy debates are
often dominated by questions of distribution
rather than efficiency. However, today maybe
even more than ever, Europeans share a common
destiny. The paramount scale of our challenges
exceeds the capacity of any single EU Member
State.
The integrated market is the backbone of
Europe’s prosperity. In order to preserve its
strength, the EU economy needs to be at the
global innovation frontier. Investments into
today’s innovation only make sense if they can
rely on access to a vast integrated market.
Integration inevitably leads to higher interde-
pendence between Member States’ economic
developments. The links are no longer just trade
links but also include European value chains,
financial markets, fiscal contagion, etc. As
unwinding integration would come with
unbearable economic and societal costs, we will
need a European approach to economic policy.
Decisive measures are needed to raise Europe’s
competitiveness in order to support higher levels
of productivity, employment and prosperity. The
effects of the crisis have exacerbated structural
weaknesses and contributed to a legacy of
economic and policy challenges that need to be
tackled. These challenges have been made more
pressing by the unprecedented rise in migration
witnessed over the past year, and which – in all
likelihood – will continue in the near future. The
way to tackle these challenges is through deeper
European market integration, further cohesion
and convergence, strengthening and developing
markets and stepping up efforts to make Europe
stronger and more competitive. Openness,
innovation, skills development and the free
movement of goods and services, labour, and
capital are the drivers of Europe’s competitive-
ness, growth and prosperity.
But Europe’s competitiveness and long-term,
sustainable growth potential suffer from a history
of underinvestment in important areas, ineffi-
cient and fragmented financial markets, and
institutional barriers. Seven years of crisis
undermined confidence, lowered aggregate
investment, and further aggravated structural
investment gaps. At the same time, constrained
fiscal space and the necessary regulatory
response to the banking crisis are significantly
limiting the ability of Member States and the
European banking sector to take risks and
catalyse valuable investment.
As the EU bank, the European Investment Bank
(EIB) remains fully committed to strengthening
Europe’s competitiveness. During the crisis – at a
time when investment was falling across the EU –
the EIB stepped in to help shoulder some of the
burden. In 2007, EIB disbursements as a
percentage of Gross Fixed Capital Formation
(GFCF) stood at 1.3% in the EU; by 2014 this
number had reached 2.2% (a 70% increase). The
EIB provided EUR 70 billion in finance to
European projects and companies in 2015 in four
priority areas: SMEs and Midcaps, Innovation,
Infrastructure and Environment, This supported
investment of over EUR 208 billion (1.4% of EU
GDP). In addition, the European Investment Fund
(EIF) – a member of the EIB Group – committed a
further EUR 7 billion to SMEs and midcaps,
bringing EIB Group financing in the EU up to EUR
77 billion.

Restoring EU competitiveness | Foreword
VI European Investment Bank
The EUR 315 billion Investment Plan for Europe (IPE) launched in 2015 has been designed to further tackle Europe’s challenges. The new European Fund for Strategic Investments (EFSI) – one of the IPE’s three components – will enable the EIB Group to step up its provision of much needed risk-bearing financial products and further improve its capacity to perform its catalytic function. Through EFSI, the EIB will encourage the launch of economically valuable projects, making them attractive for wary investors, and giving recovery a boost at a critical junction. Even more importantly, this plan will help speed up and intensify our efforts to address the structural challenges that Europe faces. Without this joint effort by EU Institutions and Member States, any short-term push will be just that: short-term. The EIB has been involved in the preparation of the investment plan from the start. As part of its preparation, we examined the interlinked causes of the long-term decline in Europe’s competitive-ness and productivity. The first version of this report was based on the findings of an internal EIB study prepared in July 2014. It focused on key enablers that require long-term investment and are critical to our future well-being. It provided an overview of some of the main investment gaps – relative to global benchmarks and EU targets – that clearly demand our attention. It deliberately did not set out a plan for addressing resulting needs. Its purpose was to inform the identification of strategic priorities and show why action needs to be stepped up at the European level to revitalise long-term, competitiveness-enhancing invest-ment in the EU. For this updated January 2016 version, we have revised the report and slightly expanded its scope. However, the main findings remain valid.
It is of fundamental importance that EIB Group’s efforts to mobilise additional finance for strategic investments is flanked by decisive action on the regulatory front, at national and EU-wide levels, to create an environment more conducive to private investment. Likewise, an enhanced focus on technical assistance is essential to make sure that funds are used effectively and where they are most needed. In the implementation of the investment plan we will ensure that investments are only channelled to sound, economically viable projects in sectors that are critical to Europe’s competitiveness, such as energy; transport and telecommunications infrastructure; research and development; education; the financing of young, innovative companies; and the adoption of advanced technologies and practices by business, including SMEs, which constitute Europe’s economic backbone. Europe has ample strengths: the diversity of its people, an abundance of intellectual, scientific and technological capacities, a rich history of intellectual and business endeavour, and even its climate. Unfortunately, our ability to compete globally has declined. Since the onset of the financial and then economic crisis, we have focused primarily on the short-term. Now we also need to take a longer-term view. It is the only way for us to successfully address the economic and societal challenges that Europe faces.
Werner Hoyer President of the EIB
Restoring EU competitiveness | Summary
European Investment Bank VII
Summary
Europe has experienced a two-decade long decline in competitiveness
With the advent of the digital revolution in the
1990s, productivity growth in the EU began to slip
behind that in the US and other leading trading
partners. This trend has undermined the
comparative ability of European firms to compete
and to provide rewarding jobs and a high
standard of living.
Low comparative productivity and misallocation
of investment, alongside many structural
weaknesses, help explain why the global crisis hit
Europe so hard, and why EU-wide recovery still
presents such a challenge.
Since 1990, the inflation-adjusted absolute
GDP per capita gap between the EU and US
has increased by around 50%.
In absolute terms, the GDP per capita of EU
regions has diverged since 1990, not con-
verged.
Productivity growth in the EU has trailed the
US since the mid-1990s and was hit harder
during the crisis than in other regions.
EU firms trail behind in their capacity to innovate and absorb new technologies and
know-how
In terms of research intensity and patenting
activity the EU persistently falls behind compara-
ble economies. Investment in advanced EU
countries trailed that in the US and Japan already
before the crisis. It declined sharply in the crisis
and remains depressed.
The EU economy is still very strong in sectors like
transport, energy and environmental technolo-
gies and it is still able to capture a significant
share of global value chains in advanced
manufacturing. Nonetheless, additional invest-
ment is needed to defend this position and to
avoid falling further behind in weaker but crucial
sectors like life sciences, semiconductors and
software.
An additional EUR 130bn a year needs to be
invested in R&D to meet the EU target of 3%
of GDP.
More than 30% fewer patents are filed per EU
citizen than per US citizen.
EU firms are slow at absorbing new technolo-
gy. Keeping up with latest technologies in the
advanced manufacturing sector will require an
estimated additional EUR 90bn a year.
The share of fast-growing firms is more than
25% lower in the EU than in the US.
Restoring EU competitiveness | Summary
VIII European Investment Bank
Young, innovative and modernising firms face financial constraints in the EU
Europe’s largely bank-based and fragmented
financial sectors face challenges in financing
young innovative firms. Banks’ deleveraging
needs following the economic crisis have
exacerbated this problem.
In particular, the availability of finance for start-
ups and growth-stage firms is more limited in
Europe than in the US. European SMEs also often
lack access to finance for innovation and for
absorbing new technologies and know-how.
Matching US levels of venture capital financing
as a share of GDP would require around EUR
35bn a year in additional venture capital
activity in the EU.
Stock market capitalisation in the EU is not
only about half the US size, markets are also
highly fragmented.
In the euro area, around 28% of SMEs are
faced with difficulties of getting access to
finance.
Europe’s infrastructure is increasingly unfit to provide the foundations for EU
competitiveness
In the EU, years of underinvestment, exacerbated
by the crisis, mean that many infrastructure
assets are reaching the end of their economic life,
creating an investment backlog.
At the same time, infrastructure needs to be
upgraded to meet the demands of the future,
such as the need to ensure the security and
sustainability of energy supply, to ensure efficient
and sustainable mobility and logistics, to meet
demand for digital services and to remain
resilient to the effects of climate change and
resource scarcity.
Annual investment shortfalls include:
EUR 100bn to upgrade energy networks to
integrate renewables, improve efficiency and
ensure security of supply;
EUR 80bn to upgrade transport networks to
reduce congestion costs and trade bottle-
necks;
EUR 65bn to reach the EU’s Digital Agenda
standards in broadband, data centre capacity,
and cyber security;
EUR 10bn for state-of-the-art education
facilities in addition to EUR 90bn increased
operational spending, to reach US-standards,
mostly in higher education;
EUR 90bn to rehabilitate environmental
services and ensure water security in the face
of climate change.

Restoring EU competitiveness | Summary
European Investment Bank IX
Public policy can foster competitiveness by addressing market inefficiencies
Investments in risky R&D, human capital, basic
infrastructure, research and the growth of young
and innovative firms all have positive spill-overs
for the wider economy, which cannot always be
fully captured by private investors.
Almost all of the gaps that are identified by this
paper do not constitute projects that are ready
for implementation and just need financing. In
fact, most of the highlighted investment needs
still have to be translated into concrete invest-
ment projects.
Structural reforms to ensure efficiency,
flexibility, competition and further integration
of Europe's internal market are key to gener-
ating an environment conducive to invest-
ment.
Most of the projects will have to come from
the private sector. In order to catalyse private
investment and to maximise the impact of
scarce public funds, public investment policy
needs to be well-targeted at market ineffi-
ciencies.
Turning needs into well-defined and efficiently
structured projects often requires advice on
project preparation and technical expertise.
In light of the inherent riskiness of single
investments in competitiveness and current
bottlenecks in European financial markets,
public support for investments will in many
cases be more valuable if it emphasises the
facilitation of higher risk taking rather than
liquidity provision.
Restoring EU competitiveness – the contribution of the EIB and the Investment Plan for
Europe
A vital player in EU infrastructure sectors, the EIB
Group is also the leading EU investor in venture
and growth capital funds and plays a key role in
financing SMEs and R&D in Europe. Under the
proposed Investment Plan for Europe, additional
resources from the EU budget, alongside the EIB’s
own funds, will strengthen the EIB Group’s ability
to step up the provision of much needed risk-
bearing financial products to unlock investments
in areas vital to restoring the competitiveness of
the EU. These tailor-made products are flanked
by intensified advisory services to prepare
projects and catalyse the investment Europe
needs.

Restoring EU competitiveness | Introduction
10 European Investment Bank
Introduction: About this report
This report examines the challenge of restoring
the long-term competitiveness of economic
activity within the EU. It also briefly discusses the
part that public involvement is playing and could
play to meet this challenge. It draws on a range of
important recent contributions to this subject,
including European Commission reports and
academic studies, as well as research by the EIB’s
Economics Department and Projects Directorate.
It aims to synthesise some of the most important
findings to give an overview of the challenges the
EU faces at the present time. It seeks to be
complementary, balancing the focus of work by
other institutions by paying special attention to
structural issues rather than cyclical aspects of
competitiveness.
The competitiveness of EU economies depends
on the capacity of firms and industries to drive
and adapt to change through innovation, raising
productivity and achieving a presence in key
strategic sectors. To sustain high income levels,
Europe needs to excel in high value-added
activities within globalised systems of production.
This capacity depends in turn upon certain
enabling factors: long-term investments in
human capital and strategic infrastructure, the
capacity of the financial sector to support
innovation, and an appropriate framework of
competitive markets and institutions.
While Europe has many strengths and EU
industry remains strong in many sectors, it is
weak in others and risks being further squeezed
out of key future markets. EU productivity growth
has fallen behind that in the US since the mid-
1990s. The economic and financial crisis exposed
this weakness and has aggravated it, contributing
to the loss of income and jobs in many sectors
and regions. Restoring competitiveness is at the
heart of ensuring long-term, sustainable
economic recovery throughout the EU. This
means recreating an enabling environment for
efficient resource allocation, innovation,
modernisation and productivity growth by EU
firms.
Given the long-term focus of this paper, the
analysis examines productivity-driven, long-term
competitiveness.1 Its overall objective is to inform
and stimulate a debate about the structural
competitiveness challenges faced by Europe. To
this end, for various aspects of competitiveness,
the paper assesses the EU against a number of
different benchmarks. In most cases, the US is
taken as the comparator, not least since amongst
the large advanced economies it remains the
country with the highest per capita GDP and
holds leadership positions in research and
technology.
1 Accordingly, we do not discuss aspects of price competitiveness in this paper. This well-covered concept is relevant for the crisis-related, cyclical discussion of real exchange rate misalignments. Beyond the short-term rebalancing of unsustainable external positions through price adjustments, long-term competitiveness is determined by productivity growth and allocative efficiency.
Key questions:
How much is Europe falling behind its potential for wealth creation?
What gaps exist in European investment in innovation and in key strategic sec-tors?
What constraints does the capacity of the financial sector place on innovation, the growth of innovative firms and the efficient reallocation of resources?
Are we investing what we need to in human capital and strategic infrastruc-ture to sustain European competitive-ness over the long-term?

Restoring EU competitiveness | What is competitiveness?
European Investment Bank 11
1. What is competitiveness?
The ability to create wealth
Competitiveness is the ability of firms to mobilise
and efficiently employ the productive resources
required to successfully offer their goods and
services in a global economic environment.
Competitiveness is important for achieving a high
standard of living and long-term sustainable gross
domestic product (GDP) growth built on real
gains in productivity. This depends on the
efficient allocation of resources and the ability of
millions of firms to excel in activities where their
comparative advantage is greatest. It depends on
their ability to make the most of global trade
opportunities, maximising value added within
integrated global production chains. Public policy
and institutions are important for creating an
environment that supports this dynamism.
The ability to drive and adapt to change through
innovation
Achieving and maintaining competitiveness
requires continuous improvements in productivi-
ty levels and constant adaptation to a changing
economic environment. This innovation has
different facets:
Product and process innovation – advancing
the technological production frontier by
developing new and better goods and services
that capture market share, and by improving
ways of working, including management, to
increase value added for given inputs of
labour and capital.
Catching-up – the adoption of improved
technologies and practices by firms and the
incorporation of product innovations, moving
production to the technological frontier.
Growth of innovators – the growth of innova-
tive, high-value-added firms and sectors,
allowing for a substitution of firms that are no
longer competitive.
Almost all innovation involves investment and
requires appropriate and sufficient financing: for
research and development of new products and
processes; for adopting new technologies like
Information and Communication Technologies
(ICTs) and for workforce retraining; for innovative
start-ups, small and medium-sized enterprises
(SMEs) and larger companies that want and need
to expand.
The ability to drive and adapt to change also
means achieving strategic positioning with regard
to key enabling technologies and future opportu-
nities. A vibrant advanced manufacturing sector
remains important to competitiveness, along
with presence in key sectors such as life sciences,
digital technologies, and green technologies.
The need for an enabling environment
The ability of firms to drive and adapt to change,
and to create high-value jobs depends on a large
range of contextual factors. This report identifies
four key groups of enablers:
Human capital – High standards of education
and health ensure that employees have the
necessary skills, knowledge and capacity
throughout their working lives especially in
knowledge-intensive sectors. The attainment
of these standards depends on adequate
investment.
Strategic infrastructure – structures, often
public, that enhance the productivity of peo-
ple and firms throughout the economy, by
lowering the costs of combining different

Restoring EU competitiveness | What is competitiveness?
12 European Investment Bank
productive inputs and accessing markets and
by increasing mobility and competition.
Achieving and maintaining efficient transport,
ICT, energy and environmental infrastructure
depends on sustained long-term investment.
Climate change and environment – the ability
to facilitate the transition to a low-carbon,
environmentally-friendly and climate-resilient
economy.
Financial sector capacity – the ability of the
financial sector to foster an efficient allocation
of resources by providing adequate finance
adapted to the investment needs of innova-
tive and growing firms, including through
instruments such as bank loans, venture
capital, credit guarantees and securitisation.
Institutions and markets – a wide range of
factors including competitive and flexible
input and product markets, well-designed
regulatory and taxation regimes and property
rights that give firms the incentives to inno-
vate at the same time as allowing for an
efficient dissemination of innovation, includ-
ing in the service sector.
The potential benefits of EU Single Market
The Single Market is a key driver of EU competi-
tiveness. By removing internal barriers, economic
integration furthers internal trade and facilitates
market entry, increasing competition and
enabling economies of scale, which in turn
improve efficiency and a better allocation of
resources. Market integration leads to higher
growth, job creation and welfare gains. Optimiz-
ing the EU Single Market and maximizing
‘European Added Value’ is key to creating a
healthier, more prosperous and competitive
European economy.
Conceptualising competitiveness
The EU’s competitiveness needs to be under-
stood at three levels: the enabling environment,
the ability of firms to drive and adapt to change,
and the ultimate results in terms of productivity
growth, trade performance and economic well-
being. This can be underpinned by structural
reforms, the removal of barriers to investment
and EU Single Market integration (Figure 1). The
following section will draw together the infor-
mation we have on where the gaps lie.

Restoring EU competitiveness | What is competitiveness?
European Investment Bank 13
Figure 1: Conceptualising competitiveness
Enabling environment:
Institutions & markets - Competition - Labour flexibility - Regulations - Governance
Human capital - Schools - Universities - Vocational training - Healthcare
Strategic infrastructure - Transport - Energy - ICT - Climate change and Environment
Financial sector - Finance for RDI - SME finance - Venture capital - Capital markets
Capacity for change
… within firms
Product/Process innovation - Investment in RDI - Ability to commercialise innovations
Absorption of innovation - Uptake of innovative products - Uptake of process innovations (ICT, effective management...)
… across the economy
Innovation activity in strategic sectors and technologies
Business dynamism - Ability of innovative firms to grow (incl. start-ups, SMEs…)
- Substitution of less competitive firms
Wealth creation
Productivity
Economic well-being
Employment Trade Convergence
Structural reforms Remove barriers to investment EU Single Market integration

Restoring EU competitiveness | Is Europe achieving its potential?
14 European Investment Bank
2. The challenge for Europe
2.1 Wealth creation: Is Europe achieving its potential?
The ultimate test of whether a country or region
is competitive is the economic well-being it can
achieve and the prospects that it has to keep
growing this potential. Competitiveness is not a
zero-sum game: just looking at measures such as
developments in the share of world exports or
world GDP can be misleading as lower-income
countries catch up. Instead, country comparisons
of GDP per capita, productivity and growth can
show us the unachieved potential that exists for
Europe as a whole and shine a light on the state
of convergence within Europe. While not an
indicator of competitiveness per se, measures of
trade performance help us to further define the
competitive positioning of different countries and
regions in the world.
The GDP per capita gap and convergence
Comparing European GDP per capita with that of
the United States provides the simplest indication
of Europe’s unachieved potential. In the post-war
period, the EU’s GDP per capita – while converg-
ing in the early decades – has always been lower
than that of the US. What is even more concern-
ing is the fact that since the mid-1980s, the catch-
up process has come to a halt and the GDP per
capita gap has roughly doubled in absolute terms
(Figure 2).
Figure 2: GDP per capita, comparison between the EU28 and the US, PPP (constant 2014 USD)
Source: The Conference Board Total Economy Database, May 2015
Income disparities within Europe are also a
concern, with different regions showing divergent
trends (Figure 3):
The “North-South” gap – GDP per capita
growth is much lower in the group of EU
South countries than in their EU North
counterparts, and has stalled since the
crisis, allowing a large gap to open up.
The “North-East” gap – Growth rates are
encouraging in the EU East countries.
Nonetheless, the absolute gap relative to
the Northern Member States has wid-
ened, not shrunk.
0
10,000
20,000
30,000
40,000
50,000
60,000
1950 1960 1970 1980 1990 2000 2010
EU US
Restoring EU competitiveness | Is Europe achieving its potential?
European Investment Bank 15
Figure 3: GDP per capita in different parts of the EU, PPP (constant 2014 USD)
Source: The Conference Board Total Economy Database, May 2015 Note: Averages are GDP weighted. EU North: AT, BE, DE, DK, FI, FR, IE, LU, NL, SE, UK; EU South: CY, ES, GR, IT, MT, PT; EU East: BG, CZ, EE, HR, HU, LT, LV, PL, RO, SI, SK.
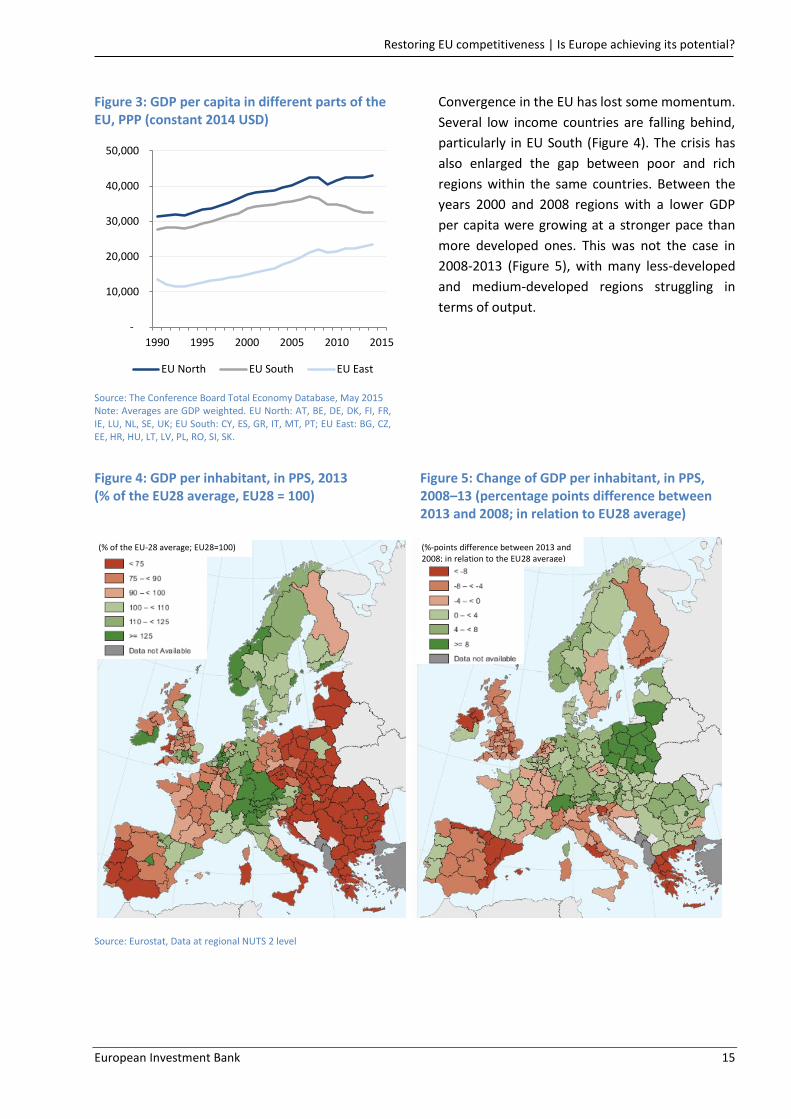
Convergence in the EU has lost some momentum.
Several low income countries are falling behind,
particularly in EU South (Figure 4). The crisis has
also enlarged the gap between poor and rich
regions within the same countries. Between the
years 2000 and 2008 regions with a lower GDP
per capita were growing at a stronger pace than
more developed ones. This was not the case in
2008-2013 (Figure 5), with many less-developed
and medium-developed regions struggling in
terms of output.
Figure 4: GDP per inhabitant, in PPS, 2013 (% of the EU28 average, EU28 = 100)
Figure 5: Change of GDP per inhabitant, in PPS, 2008–13 (percentage points difference between 2013 and 2008; in relation to EU28 average)
Source: Eurostat, Data at regional NUTS 2 level
-
10,000
20,000
30,000
40,000
50,000
1990 1995 2000 2005 2010 2015
EU North EU South EU East
(%-points difference between 2013 and 2008; in relation to the EU28 average)
(% of the EU-28 average; EU28=100)
Restoring EU competitiveness | Is Europe achieving its potential?
16 European Investment Bank
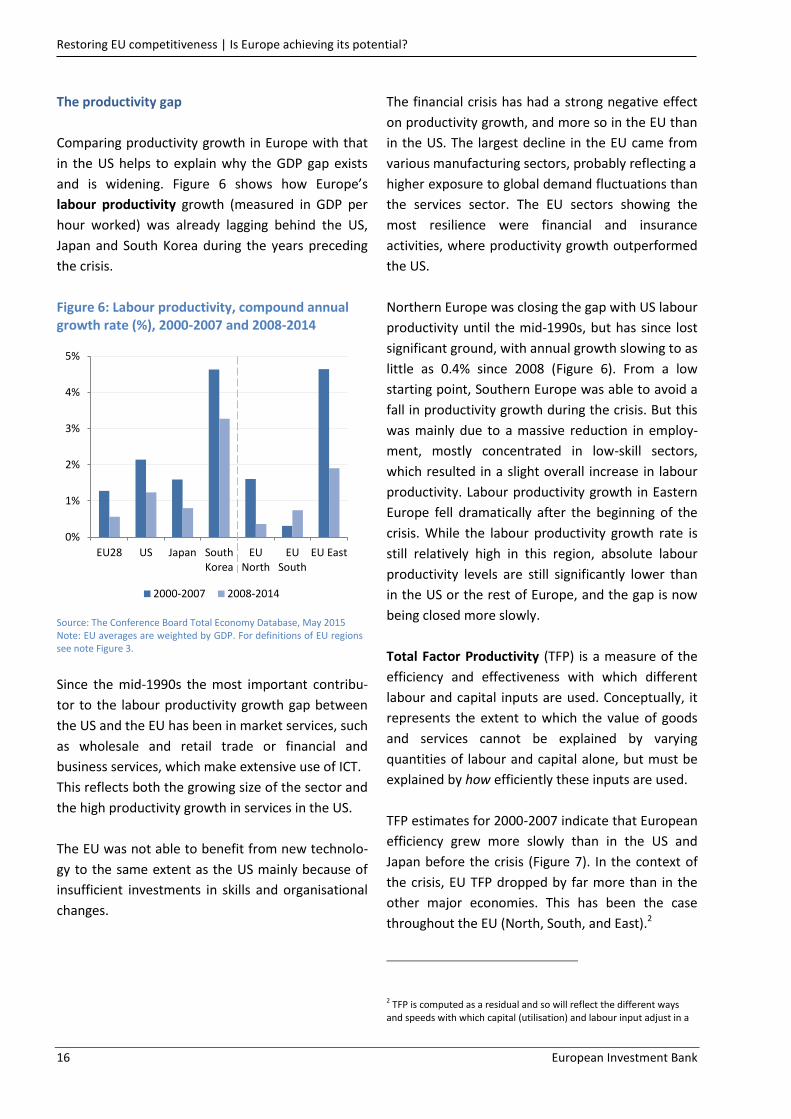
The productivity gap
Comparing productivity growth in Europe with that
in the US helps to explain why the GDP gap exists
and is widening. Figure 6 shows how Europe’s
labour productivity growth (measured in GDP per
hour worked) was already lagging behind the US,
Japan and South Korea during the years preceding
the crisis.
Figure 6: Labour productivity, compound annual growth rate (%), 2000-2007 and 2008-2014
Source: The Conference Board Total Economy Database, May 2015 Note: EU averages are weighted by GDP. For definitions of EU regions see note Figure 3.
Since the mid-1990s the most important contribu-
tor to the labour productivity growth gap between
the US and the EU has been in market services, such
as wholesale and retail trade or financial and
business services, which make extensive use of ICT.
This reflects both the growing size of the sector and
the high productivity growth in services in the US.
The EU was not able to benefit from new technolo-
gy to the same extent as the US mainly because of
insufficient investments in skills and organisational
changes.
The financial crisis has had a strong negative effect
on productivity growth, and more so in the EU than
in the US. The largest decline in the EU came from
various manufacturing sectors, probably reflecting a
higher exposure to global demand fluctuations than
the services sector. The EU sectors showing the
most resilience were financial and insurance
activities, where productivity growth outperformed
the US.
Northern Europe was closing the gap with US labour
productivity until the mid-1990s, but has since lost
significant ground, with annual growth slowing to as
little as 0.4% since 2008 (Figure 6). From a low
starting point, Southern Europe was able to avoid a
fall in productivity growth during the crisis. But this
was mainly due to a massive reduction in employ-
ment, mostly concentrated in low-skill sectors,
which resulted in a slight overall increase in labour
productivity. Labour productivity growth in Eastern
Europe fell dramatically after the beginning of the
crisis. While the labour productivity growth rate is
still relatively high in this region, absolute labour
productivity levels are still significantly lower than
in the US or the rest of Europe, and the gap is now
being closed more slowly.
Total Factor Productivity (TFP) is a measure of the
efficiency and effectiveness with which different
labour and capital inputs are used. Conceptually, it
represents the extent to which the value of goods
and services cannot be explained by varying
quantities of labour and capital alone, but must be
explained by how efficiently these inputs are used.
TFP estimates for 2000-2007 indicate that European
efficiency grew more slowly than in the US and
Japan before the crisis (Figure 7). In the context of
the crisis, EU TFP dropped by far more than in the
other major economies. This has been the case
throughout the EU (North, South, and East).2
2 TFP is computed as a residual and so will reflect the different ways and speeds with which capital (utilisation) and labour input adjust in a
0%
1%
2%
3%
4%
5%
EU28 US Japan SouthKorea
EUNorth
EUSouth
EU East
2000-2007 2008-2014

Restoring EU competitiveness | Is Europe achieving its potential?
European Investment Bank 17
Figure 7: Total factor productivity, average annual growth rate (%), 2000-2007 and 2008-2014
Source: The Conference Board Total Economy Database, May 2015 Note: EU averages are weighted by GDP. For definitions of EU regions see note Figure 3.
Europe’s international trade performance
International trade has become increasingly
complex over the last decades, especially as
specialisation patterns are increasingly granular (i.e.
the range of products in which a country shows
particular strengths has become narrower). With
trade costs declining and production being more
and more spread out across different locations, the
analysis of trade flows is becoming more complex.
Looking only at traditional trade flow measures
such as gross exports and imports is easily mislead-
ing. The importance of trade in intermediate goods
inflates trade figures and the contribution of each
country in the production process is not properly
reflected. One way to overcome these shortcom-
ings is to look at the value added of exports, a
measure which captures the value added generated
domestically in the production of goods destined
for export and excludes the foreign value added
associated with imported intermediary goods.
downturn. As such it is too early to say to what extent this decline reflects a trend decline in overall efficiency of the production process.
While services contribute to around 75% of EU GDP,
their share in trade is still some 25%. In light of the
growing importance of services within the tradable
sector, more analyses will be required to better
understand productivity and trade developments in
the service sector.3
Figure 8 shows the shares of global value added
manufacturing exports per capita for the EU and its
peers, the US and Japan. By this measure, Europe
has a competitive position comparable to that of
the US. The most important sectors in which the EU
has a large market share in global value added
exports are machinery and transport equipment.4
Figure 8: Shares in global value added exports of manufactured goods per capita (%)
Source: WIIW Note: Excluding Intra-EU Trade. Per 1 million inhabitants. EU represents EU27.
This is in line with the evidence that points to a
comparable content of domestic value added of
gross manufacturing exports between the EU and
the US (Figure 9). Traditionally, the EU had a
relatively higher content of domestic value added
compared to the US. One reason for this is that
3 Uppenberg. (2011). Economic growth in the US and the EU: a sectoral decomposition. EIB Papers, Vol 16 (1). Uppenberg finds a significant gap in the contribution of market serviced to productivity growth between the EU and the US 1995-2008. 4 Stöllinger, Foster-McGregor, Holzner, Landesmann, Pöschl, Stehrer. (2013). A ‘Manufacturing Imperative’ in the EU – Europe’s Position in Global Manufacturing and the Role of Industrial Policy, WIIW Research Report 391.
-1
0
1
2
3
EU28 US Japan SouthKorea
EUNorth
EUSouth
EU East
2000-2007 2008-2014
0.00
0.02
0.04
0.06
0.08
0.10
0.12
EU US Japan
1995 2011
Restoring EU competitiveness | Is Europe achieving its potential?
18 European Investment Bank
most of the value chains in which EU firms
participate are regional, meaning that many
European firms produce in different locations in
Europe to optimise their production process.
However, during the 2000s the domestic value
added content of manufacturing exports of the EU
has come closer to that of the US. Going forward,
further EU integration offers European firms the
unique possibility to take advantage of the diversity
of the EU economy and organise a significant part of
their value chains within the region, thus avoiding
higher coordination and transportation costs
compared to global value chains.
Figure 9: Domestic value added content of gross manufacturing exports
Source: EC European Competitiveness Report 2013
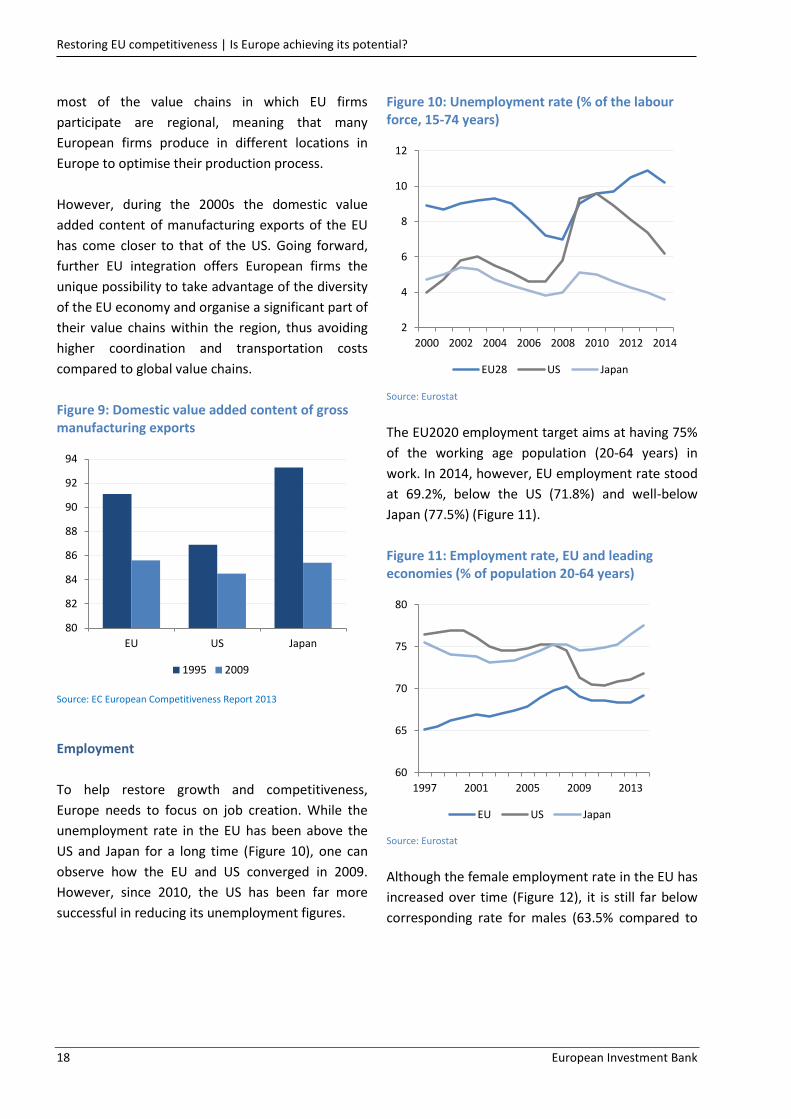
Employment
To help restore growth and competitiveness,
Europe needs to focus on job creation. While the
unemployment rate in the EU has been above the
US and Japan for a long time (Figure 10), one can
observe how the EU and US converged in 2009.
However, since 2010, the US has been far more
successful in reducing its unemployment figures.
Figure 10: Unemployment rate (% of the labour force, 15-74 years)
Source: Eurostat
The EU2020 employment target aims at having 75%
of the working age population (20-64 years) in
work. In 2014, however, EU employment rate stood
at 69.2%, below the US (71.8%) and well-below
Japan (77.5%) (Figure 11).
Figure 11: Employment rate, EU and leading economies (% of population 20-64 years)
Source: Eurostat
Although the female employment rate in the EU has
increased over time (Figure 12), it is still far below
corresponding rate for males (63.5% compared to
80
82
84
86
88
90
92
94
EU US Japan
1995 2009
2
4
6
8
10
12
2000 2002 2004 2006 2008 2010 2012 2014
EU28 US Japan
60
65
70
75
80
1997 2001 2005 2009 2013
EU US Japan

Restoring EU competitiveness | Is Europe achieving its potential?
European Investment Bank 19
75.0%). Much potential could be unlocked by
bringing more women into the labour force.5
Figure 12: Employment rate, EU28 by sex (% of population 20-64 years)
Source: Eurostat
Moreover, the impact of demographic ageing within
the EU – like in many other leading economies
worldwide – will be a major economic and fiscal
issue in the coming decades. Consistently low birth
rates and higher life expectancy will transform the
shape of the EU28’s age pyramid, leading to a
transition towards a much older population
structure. In 2015, the old-age dependency ratio
(population above the age of 65 relative to the
population aged 15-64) stood at 29%. By 2050, this
figure is projected to reach almost 50%.
5 Notable differences in female employment rate exist across EU Member States; ranging from very high levels in countries such as Sweden (77.6), Germany (73.1), Denmark (72.2) and Finland (72.1); to substantially lower levels in Greece (44.3), Italy (50.3), Malta (51.9), Croatia (54.2) and Spain (54.8).
As the proportion of the working age population
continues to shrink and the relative number of
those retired increases, a higher burden will be
placed on those working. Therefore, Europe needs
to increase its productivity and move closer to the
innovation frontier (Figure 13).
Figure 13: Projected age dependency ratios, EU28 (%)
Source: Eurostat Note: 2015-2080: projections, European Population Projections, base year 2013 (EUROPOP2013).
50
55
60
65
70
75
80
1997 2001 2005 2009 2013
Female Male Total
20
25
30
35
40
45
50
55
2015 2020 2030 2040 2050 2060 2070 2080
Young-age dependency ratio (0–14/15–64 years)
Old-age dependency ratio (≥ 65/15–64 years)
Restoring EU competitiveness | Europe’s capacity for change
20 European Investment Bank
2.2 Europe’s capacity for change – innovation and adaptation
Productivity is enhanced in two main ways:
innovation that advances the frontier in terms of
product sophistication and production efficiency;
and the absorption of innovations, a process of
adaptation and catching-up with the technologi-
cal frontier as it advances.
Europe’s R&D gap
Improving the environment for innovation is a
key challenge for Europe. Indicators assessed by
the World Economic Forum (WEF) suggest that
the EU performs worse than the US, Japan or
South Korea across a range of innovation
environment dimensions (Figure 14). The largest
gaps with respect to the US are in company
spending on research and development (R&D)
and university-industry collaboration.
Figure 14: Innovation environment, EU and leading economies
Source: World Economic Forum, Global Competitiveness Report 2015-2016 Note: Innovation Pillar (12th Pillar). Scores from 1(worst) to 7(best).
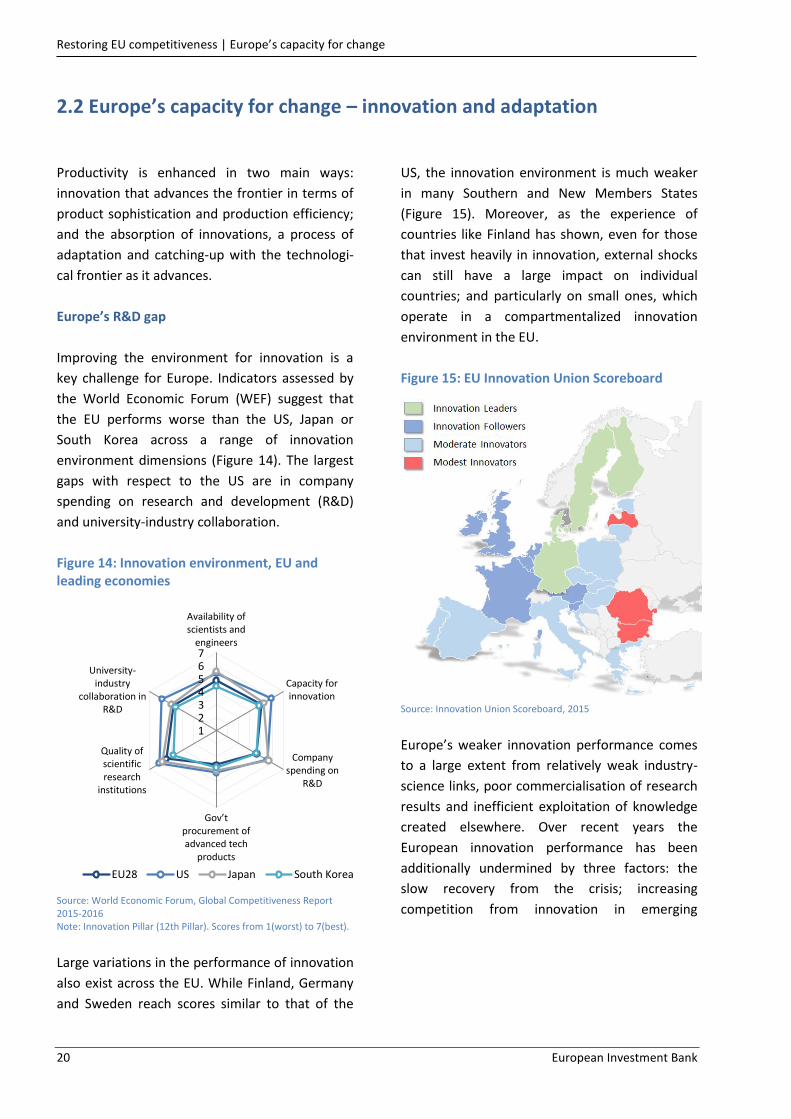
Large variations in the performance of innovation
also exist across the EU. While Finland, Germany
and Sweden reach scores similar to that of the
US, the innovation environment is much weaker
in many Southern and New Members States
(Figure 15). Moreover, as the experience of
countries like Finland has shown, even for those
that invest heavily in innovation, external shocks
can still have a large impact on individual
countries; and particularly on small ones, which
operate in a compartmentalized innovation
environment in the EU.
Figure 15: EU Innovation Union Scoreboard
Source: Innovation Union Scoreboard, 2015
Europe’s weaker innovation performance comes
to a large extent from relatively weak industry-
science links, poor commercialisation of research
results and inefficient exploitation of knowledge
created elsewhere. Over recent years the
European innovation performance has been
additionally undermined by three factors: the
slow recovery from the crisis; increasing
competition from innovation in emerging
1234567
Availability ofscientists and
engineers
Capacity forinnovation
Companyspending on
R&D
Gov’t procurement of advanced tech
products
Quality ofscientificresearch
institutions
University-industry
collaboration inR&D
EU28 US Japan South Korea
Restoring EU competitiveness | Europe’s capacity for change
European Investment Bank 21
economies; and the strength of US policies aimed
at regaining a leading position.6
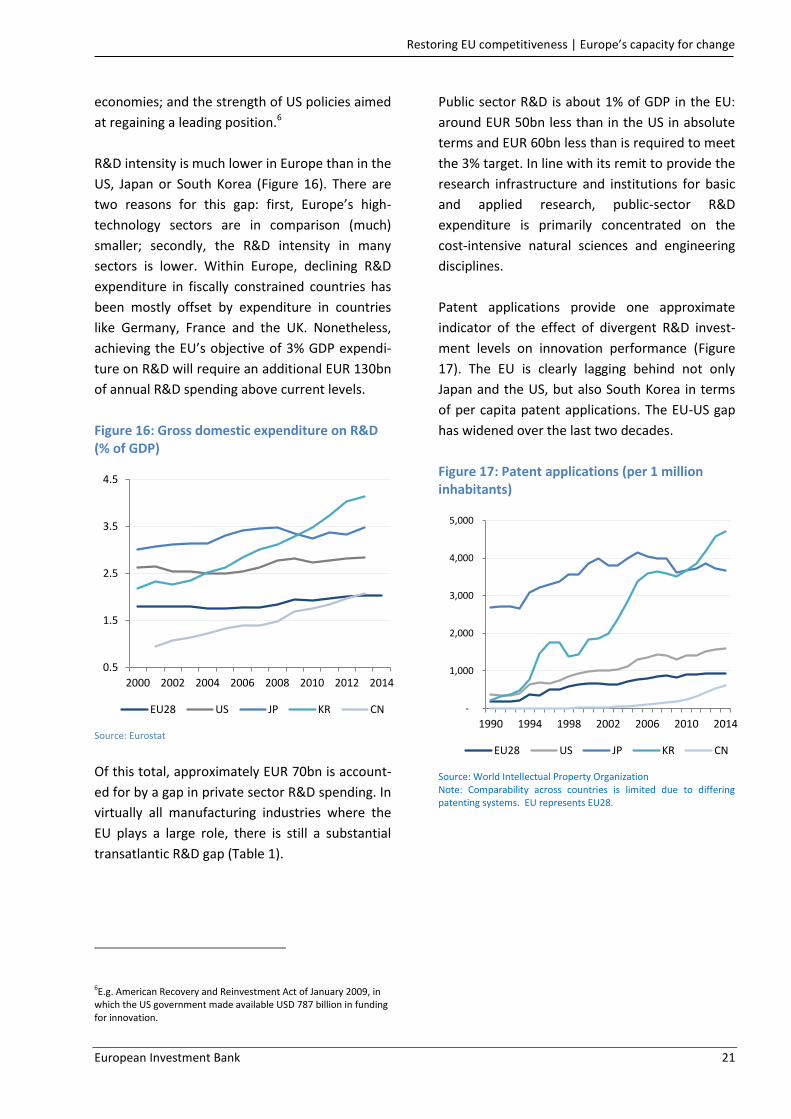
R&D intensity is much lower in Europe than in the
US, Japan or South Korea (Figure 16). There are
two reasons for this gap: first, Europe’s high-
technology sectors are in comparison (much)
smaller; secondly, the R&D intensity in many
sectors is lower. Within Europe, declining R&D
expenditure in fiscally constrained countries has
been mostly offset by expenditure in countries
like Germany, France and the UK. Nonetheless,
achieving the EU’s objective of 3% GDP expendi-
ture on R&D will require an additional EUR 130bn
of annual R&D spending above current levels.
Figure 16: Gross domestic expenditure on R&D (% of GDP)
Source: Eurostat
Of this total, approximately EUR 70bn is account-
ed for by a gap in private sector R&D spending. In
virtually all manufacturing industries where the
EU plays a large role, there is still a substantial
transatlantic R&D gap (Table 1).
6E.g. American Recovery and Reinvestment Act of January 2009, in which the US government made available USD 787 billion in funding for innovation.
Public sector R&D is about 1% of GDP in the EU:
around EUR 50bn less than in the US in absolute
terms and EUR 60bn less than is required to meet
the 3% target. In line with its remit to provide the
research infrastructure and institutions for basic
and applied research, public-sector R&D
expenditure is primarily concentrated on the
cost-intensive natural sciences and engineering
disciplines.
Patent applications provide one approximate
indicator of the effect of divergent R&D invest-
ment levels on innovation performance (Figure
17). The EU is clearly lagging behind not only
Japan and the US, but also South Korea in terms
of per capita patent applications. The EU-US gap
has widened over the last two decades.
Figure 17: Patent applications (per 1 million inhabitants)
Source: World Intellectual Property Organization Note: Comparability across countries is limited due to differing patenting systems. EU represents EU28.
0.5
1.5
2.5
3.5
4.5
2000 2002 2004 2006 2008 2010 2012 2014
EU28 US JP KR CN -
1,000
2,000
3,000
4,000
5,000
1990 1994 1998 2002 2006 2010 2014
EU28 US JP KR CN

Restoring EU competitiveness | Europe’s capacity for change
22 European Investment Bank
Table 1: Investment needs in R&D
Investment needs/objective Annual investment (EUR billions)
Required2 Current
3 Gap
Achieving 3% GDP target for annual R&D investment: 1
Private sector:
Public sector:
370 200 170
240 130 110
130 70 60
Private/public R&D investment by key strategic sectors:
Transport equipment
Machinery and equipment, including ICT and electronics
Life sciences/pharmaceuticals
Renewable energy and eco-innovation
Other sectors
55 75 40
30 40 15
25 35 25 20 25
Total: EUR 130bn 1 Split based on comparing actual public and private R&D intensities with OECD average composition. 2 EIB calculations based on Eurostat data. 3 Estimates for EU28, 2013.
R&D needs in key strategic sectors
In order to regain competitiveness, the EU will
need to catch up with developments in the US
and, to a lesser extent, Japan in a number of key
technology areas that will form the basis of
future products and services7. These are:
Life sciences: an additional EUR 15bn of
annual public sector investment in basic
research is needed, alongside an extra EUR
10bn of private sector R&D investment
mostly in pharmaceuticals and diagnos-
tics/personalised medicine.
Semiconductors: closing the gap will require
EUR 5bn of additional annual public sector
support, mostly for co-financing industrial
scale pilot plants, and EUR 15bn of private
sector R&D, mostly for bespoke chips for
industrial applications.
7 EIB estimates based on industry data and publications; comparison in all three sectors with the US as benchmark, given their leading position in a broad range of sectors. Alternatively, South Korea could have been used as benchmark in semiconductors – with similar results.
Software: an additional EUR 20bn is required
annually mostly for developing business
process and cloud computing software, prin-
cipally from the private sector as these areas
are closer to commercialisation.
The EU displays competitive strengths in the
areas of advanced manufacturing, transport
equipment and green energy and water and
waste technologies.8 However, its position is
increasingly being challenged. Additional
investments are required in order for Europe to
remain at the frontier of these key technologies.
Examples include:
Transport equipment: to maintain its
leading position, Europe needs to respond to
challenges including the development of
clean alternative fuels (electricity, hydrogen
and bio-based synthetic fuels, vehicle adap-
tation and refuelling/recharging), digitalisa-
tion (integration of transport infrastructure
and equipment into communication sys-
tems) and improving transport system in-
teroperability. The vast majority of these
8 As evidenced by world market shares and specialisation profiles.

Restoring EU competitiveness | Europe’s capacity for change
European Investment Bank 23
investments will have to be financed by the
private sector. However, in total public sec-
tor support of around EUR 8bn until 2020
will be required particularly for the co-
development and financing of pilot infra-
structure and lead markets for innovations.
Energy technology: sustained R&D invest-
ment in renewable energy technologies,
including storage, is required to meet long-
term European climate targets, as well as to
maintain Europe’s lead in this field. Public
support is particularly required for emerging
low carbon technologies that are still at an
early stage of development. According to the
European Strategic Energy Technology Plan
(SET-Plan), annual expenditures of up to EUR
70bn until 2020 are required in the fields of
bioenergy, carbon capture and storage,
smart grids, fuel cells and hydrogen, nuclear,
energy efficiency, solar and wind. Finally,
European manufacturers are significant
global players in energy network equipment.
In some specific sectors, such as for instance
high voltage direct current (HVDC) electricity
transmission, they have developed innova-
tive technologies that have further strength-
ened the competitive advantage over non-
EU manufacturers.
Water technology: adequate investment in
RDI that enhances the competitiveness of
water services through smarter and lower-
cost technologies is key to maintaining EU
leadership in the global water sector and
particularly its technology segment, where
Europe is at the forefront (over 40% of pa-
tents worldwide). Current annual private
sector R&D in this sector is around EUR 4bn.
Optimal levels to maintain leadership are
estimated at over EUR 7bn per annum by
2020, i.e. a gap of EUR 3bn per year.
Solid waste technologies: Europe’s competi-
tiveness is hampered by dependence on
imported materials, calling for increased RDI
in materials recovery/recycling. European
waste management companies are very
competitive on the global level (over 50% of
patents worldwide). Hence the EU is well
positioned to capture a large share of grow-
ing worldwide demand for environmental
technology. Current annual R&D investment
of around EUR 15bn for R&D and the acqui-
sition of new technologies needs to be main-
tained.
Catching-up: the absorption of innovation
An essential part of the whole innovation process
is the absorption of innovation. While research
and development pushes forward the frontier in
terms of product and process sophistication, all
firms need to keep re-investing to absorb this
new technology and know-how, to maintain
competitiveness.
In regions that have traditionally depended on
less advanced manufacturing and services, such
as Central and South Eastern Europe, as well as
emerging economies, the emphasis is not so
much on advancing the technological frontier as
on moving towards the frontier and shifting from
lower to higher value-added activities to raise
standards of living.
Foreign Direct Investment (FDI) often plays an
important role in bringing technology and know-
how into a country with positive “spill-over”
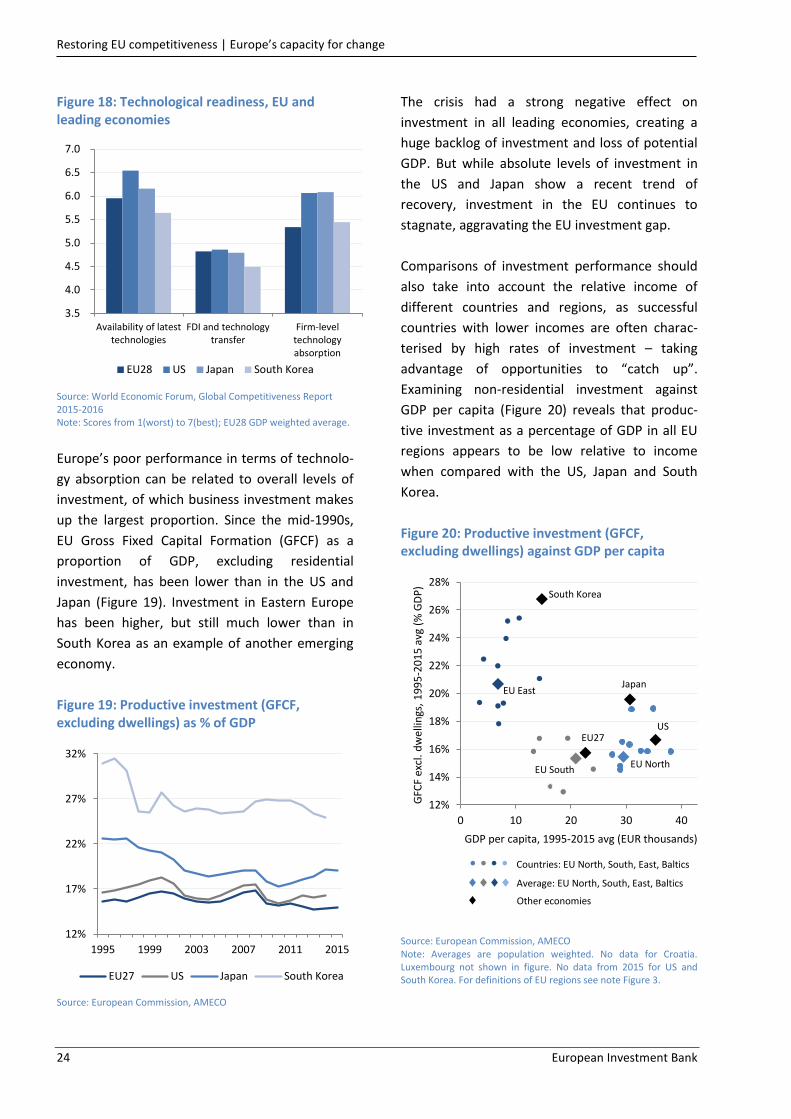
effects in the host country. The World Economic
Forum provides indicators on the availability of
latest technologies, firm-level technology
absorption and the role of FDI in technology
transfer (Figure 18). Europe performs worse than
the US on all three measures and particularly
with regard to firm-level technology absorption,
where it lags significantly lags behind the US and
Japan. This aspect is a particular concern in Italy,
Poland, Romania and Bulgaria.
Restoring EU competitiveness | Europe’s capacity for change
24 European Investment Bank
Figure 18: Technological readiness, EU and leading economies
Source: World Economic Forum, Global Competitiveness Report 2015-2016 Note: Scores from 1(worst) to 7(best); EU28 GDP weighted average.
Europe’s poor performance in terms of technolo-
gy absorption can be related to overall levels of
investment, of which business investment makes
up the largest proportion. Since the mid-1990s,
EU Gross Fixed Capital Formation (GFCF) as a
proportion of GDP, excluding residential
investment, has been lower than in the US and
Japan (Figure 19). Investment in Eastern Europe
has been higher, but still much lower than in
South Korea as an example of another emerging
economy.
Figure 19: Productive investment (GFCF, excluding dwellings) as % of GDP
Source: European Commission, AMECO
The crisis had a strong negative effect on
investment in all leading economies, creating a
huge backlog of investment and loss of potential
GDP. But while absolute levels of investment in
the US and Japan show a recent trend of
recovery, investment in the EU continues to
stagnate, aggravating the EU investment gap.
Comparisons of investment performance should
also take into account the relative income of
different countries and regions, as successful
countries with lower incomes are often charac-
terised by high rates of investment – taking
advantage of opportunities to “catch up”.
Examining non-residential investment against
GDP per capita (Figure 20) reveals that produc-
tive investment as a percentage of GDP in all EU
regions appears to be low relative to income
when compared with the US, Japan and South
Korea.
3.5
4.0
4.5
5.0
5.5
6.0
6.5
7.0
Availability of latesttechnologies
FDI and technologytransfer
Firm-leveltechnologyabsorption
EU28 US Japan South Korea
12%
17%
22%
27%
32%
1995 1999 2003 2007 2011 2015
EU27 US Japan South Korea
Figure 20: Productive investment (GFCF, excluding dwellings) against GDP per capita
Source: European Commission, AMECO Note: Averages are population weighted. No data for Croatia. Luxembourg not shown in figure. No data from 2015 for US and South Korea. For definitions of EU regions see note Figure 3.
US
Japan
EU27
EU North EU South
EU East
South Korea
12%
14%
16%
18%
20%
22%
24%
26%
28%
0 10 20 30 40
GFC
F ex
cl. d
wel
lings
, 1
99
5-2
01
5 a
vg (
% G
DP
)
GDP per capita, 1995-2015 avg (EUR thousands)
• • • • Countries: EU North, South, East, Baltics
Average: EU North, South, East, Baltics Other economies

Restoring EU competitiveness | Europe’s capacity for change
European Investment Bank 25
Innovation absorption is particularly critical in the
manufacturing sector. Europe needs to excel in
high-value-added advanced manufacturing if it is
to preserve a viable manufacturing sector
capable of supporting high living-standards. The
presence of a critical mass in manufacturing is
also important as manufacturing performs a
“carrier function” for many associated services
and is where productivity growth is concentrated.
Upgrading Europe’s manufacturing industry and
reversing the trend of declining global manufac-
turing shares will require substantial new
investment in both tangible and intangible
capital. Estimates put Europe’s investment needs
at about EUR 90bn per year, mostly funded by
the business sector (Table 2).9
9 Roland Berger. (2014). Industry 4.0: The new industrial revolution – How Europe will succeed. Studies of other consultancy firms have arrived at comparable values.
Table 2: Investment needs in industry
Investment needs/objective Annual investment (EUR billions)
Required1 Current
2 Gap
Adoption of latest generation technology in advanced manufacturing sector 320 230 EUR 90bn 1 Estimation based on Roland Berger (2014) “Industry 4.0: The new industrial revolution – How Europe will succeed”, for the period until 2020. 2 Estimate for EU 28, 2013.
Restoring EU competitiveness | Europe’s capacity for change
26 European Investment Bank
A dynamic business environment
In a dynamic, innovative economy it is important
that firms have a constant ability to reinvent
themselves or replace each other. Recent ECB-led
research has shown that the ability to reallocate
resources between firms significantly contributes
to overall productivity.10 New firms bring new
ideas, products, services and processes into the
economy. For an economy to be dynamic, old
inefficient firms need to make place for younger
more innovative ones and free up valuable labour
and capital resources.
The business environment in the EU is character-
ised by a detrimental lack of dynamism, a factor
which can be expected to facilitate the commer-
cialisation and spread of innovation throughout
the economy. This partly originates from a large
share of stable firms (firms which grow less than
5% or shrink less than 5% a year in terms of
employment) and low share of fast-growing
firms, in particular compared to the US.11 This
points to a less experimental environment in the
EU and a slower pace of resource reallocation,
two fundamental drivers of productivity growth.
In addition, competition policy in Europe has
historically been more focused on incumbent
firms while neglecting the role of entry, exit and
turnover.12 Indeed, higher entry cost and lower
firm turnover in Europe relative the US have been
an important explanation of the rising EU-US gap
since the 1990s.
10 CompNet Task Force. (2014). Micro-based Evidence of EU Competitiveness – The CompNet Database. ECB Working Paper No. 1634, February 2014. 11 Bravo Biosca, A. (2010). Firm growth dynamics across countries: Evidence from a new database. Mimeo, Nov. 2010. London: NESTA. 12 For example: Aghion, Bloom, Blundell, Griffith and Howitt. (2005). Competition and Innovation: an Inverted U Relationship. The Quarterly Journal of Economics, 120(2), p. 701 728.
SMEs (<250 employees) are considered the
backbone of the European economy, represent-
ing 99.8% of all enterprises and accounting for
almost 60% of value added.13 However, while
some may claim that start-ups and SMEs tend to
be more growth generating than large enterpris-
es, it is not the size per se that is associated with
greater dynamism, but the youth of the firm14.
This in turn is directly linked to the ‘creative
destruction’ for firms – something particularly
lacking in Europe’s business environment (Figure
21). A higher turnover of firms (i.e. a larger
degree of creative destruction) is typically
associated with faster productivity growth, since
high productive firms stay in the market while
less productive ones are forced to exit.15 Thus,
improving the business dynamism can help in
getting the EU ready to generate innovative,
transformative and world-shaping companies.
However, the base for a sound and efficient EU
business environment is largely in place (Figure
22 and Figure 23). European institutions are in
general of comparable quality to those of the US.
In the World Bank’s Ease of Doing Business
ranking, eight EU Member States place among
the top 20, while the majority place between 20
and 40 and some even below 60. The overall
procedure of starting a business is more difficult
in the average EU country than in the US.
Another concern in the EU is related to getting
credit. The performance of EU15 is overall better
than EU13.
13 Based on data from OECD, Entrepreneurship at a Glance 2015. 14 CAF. (2013). Economy and Development Report, RED 2013, Discussion about productivity in Latin America vs. US and EU. 15 Aghion and Howitt. (2009). The Economics of Growth.

Restoring EU competitiveness | Europe’s capacity for change
European Investment Bank 27
Figure 21: Share of firms by growth bracket, comparison between the EU and the US
Figure 22: Regulation of product market and professional services
Source: Bravo-Biosca, Criscuolo, Menon. (2014). What drives the dynamics of business growth, Nesta Working Paper 14/03. Note: Europe corresponds to the average of AT, DK, IT, NL, ES, NO, UK.
Source: OECD, Product Market Regulation (PMR) indicators Note: Index scale 0(least) to 6(most) restrictive; * US values 2008; EU values 2013; GDP weighted averages for EU, EU15, and EU13.
Figure 23: Performance on the ten components of Ease of Doing Business
Source: World Bank, Ease of Doing Business Note: Rank 1-189 (best to worst); GDP weighted averages for EU15 and EU13; *Does not differentiate between intra-EU and extra-EU trade
0 1 2 3
Product Market Regulation
State control
Barriers to entrepreneurship
Barriers to trade andinvestment
Regulation of preofessionalservices
EU15 EU13 US
0
20
40
60
80
100
120
140
Starting aBusiness
Dealing withConstruction
PermitsGetting
ElectricityRegistering
PropertyGettingCredit
ProtectingMinorityInvestors Paying Taxes
TradingAcross
Borders*EnforcingContracts
ResolvingInsolvency
EU15 EU13 US Japan
Restoring EU competitiveness | An enabling environment
28 European Investment Bank
2.3 An enabling environment for competitiveness
The efficient movement of people, goods,
services and information is a prerequisite for
competitiveness, and so is access to an adequate
quantity and quality of markets and resources,
including finance. The common thread amongst
those topics lies in their positive external effects
on the whole economy that makes them a key
area for public policy.
It is possible to identify many gaps between the
investment that takes places in Europe in these
areas, and the investment that would be
necessary to reach certain benchmarks. In this
report, these investment gaps are estimated by
calculating against different benchmarks.10 In
most cases, like infrastructure, we look at gaps in
investment in the narrow sense of the word. In
other areas like education and R&D we find a
broader concept of investment more appropriate
and also include certain current spending items.
2.3.1 Human capital: education
Should current trends persist, Europe’s economy
will face a significant shortage of highly skilled
workers, conservatively estimated at 5 to 8
million people in 2020.17 The largest gaps are
anticipated in college/university education and
advanced vocational training, and more specifi-
cally in the engineering, natural sciences, IT and
healthcare sectors.
Given that Europe’s competitiveness will remain
based on knowledge-intensive manufacturing
and related services, the demand for young
people with excellent post-secondary training
and a skill-set that fits the needs of future jobs
will increase. This indicates a need for more and
better vocational training. Skills in high demand
will likely be found in a number of areas that
support the application of new technologies such
as IT, mechatronics, robotics, or medical
technology.
16 Hence the estimated gaps are differences from an ‘investment frontier’ in each sector. We deliberately refrain from estimating socially optimal levels of investment, as those estimates would depend on investments in other sectors and on assumptions as to the exogeneity of other structural features of the economy. 17 McKinsey Global Institute. (2012). The world at work: Jobs, pay, and skills for 3.5 billion people, June 2012.
Capital and operational expenditure
The EU spends about 6% of its GDP (2011) on
education, almost all financed by the public
sector. Current expenditure accounts for 90% of
this, mostly for teaching and the operation of
facilities. Another 9% is invested in facilities
(mostly school buildings and equipment). By
comparison, US education spending is 7.3% of
GDP with a 30% private sector contribution, in
particular for higher education. The latter
provides incentives for greater business orienta-
tion of higher education and research. Expendi-
ture per pupil in the US is 30% and 40% higher for
pre-primary and school education and double for
tertiary education.
Closing the gap with US funding levels would
require a conservatively estimated additional EUR
100bn per year – mostly for university-level
education. Given the large maintenance backlog
in education facilities, around EUR 10bn of this
total would be required for education infrastruc-
ture, including the upgrading of equipment to
modern IT standards for teaching. A comparison
with South Korea or Singapore, where the
educational attainment of pupils is better than in
the US and Europe, leads to similar conclusions.

Restoring EU competitiveness | An enabling environment
European Investment Bank 29
Table 3: Investment needs in education and basic research
Investment need/objective Annual investment (EUR billions)
Required1 Current
2 Gap
Matching US investments in education:
Operating expenditure (mostly teaching staff)
Capital expenditure on education infrastructure, including IT equipment
880
80
790
70
90 10
Total: 960 860 EUR 100bn 1 EIB estimate, based on OECD data. 2 Estimate for EU28, 2013, based on Centre for European Policy Studies (CEPS), How to keep s competitive edge in the talent game, Brussels, 2014.
The university gap
While the educational attainment of pupils at
European schools remains relatively good, the US
has a clear lead in top-ranked research universi-
ties and other research facilities. There are only
five European universities amongst the global top
20;18 most lack the resources to match their
ambitions.
Since 2009, many EU Member States have
reduced budgets for tertiary education. At the
same time, this education segment is continuous-
ly becoming more expensive. As the public sector
18 Times Higher Education World University Rankings 2015-2016; Within Europe: four universities in the UK and one in Switzerland.
is the most important source of funding in the
EU, the funding gap is expected to widen – with
negative long-term implications for the competi-
tiveness of the university sector and downstream
R&D intensive sectors.
This means that Europe is becoming less
attractive for elite academics, researchers and
students. Efforts at the EU level to create a more
attractive environment for researchers, such as
through better funding for the European Institute
of Technology (EIT) or the Joint Research Centre
(JRC), help to mitigate the widening gap in
excellent public research, but fail to address the
lack of top-notch training facilities for students.
2.3.2 Strategic infrastructure
Transport and logistics
The development of efficient, integrated and
reliable logistics networks increases the competi-
tiveness of businesses by reducing trading costs
and widening markets for products and inputs
including labour. Transport and storage services
account for about 10-15% of the cost of finished
products in the EU, while traffic congestion costs
the EU approximately 1% of GDP every year.19
The cities with the most modern and efficient
19 See for example, www.ec.europa.eu/transport/themes/urban/urban_mobility
public transport systems are also the most
successful at attracting high-skilled workers and
the most innovative businesses, linking people to
jobs and key services.
Urban transport
The ability to deliver goods and services efficient-
ly and on time is disproportionately dependent
on the so-called “last mile” of supply chains. This
urban portion of supply chains accounts for
around one third of overall transport costs and
most of the cost of congestion. With more than
70% of the EU population living in urban areas,
any deterioration in urban productivity has a
significant impact on Europe´s competitiveness
Restoring EU competitiveness | An enabling environment
30 European Investment Bank
through the time lost to travel, shortages of
qualified workers, and health-related impacts
resulting from poor quality of life.
More than half of all transport investment will be
required to address urgent urban challenges
including traffic congestion and deteriorating
road safety. Most urgent is the upgrading and
extension of public transport networks, the roll-
out of alternative fuel distribution systems and
the application of technology in the efficient
management of travel and logistics. Cities in new
Member States and second tier cities in the rest
of Europe require major start-up investments to
initiate efficient mass transit networks, and
should be a key focus.
Completing the internal market
The smooth functioning of the internal market –
and thereby the full realisation of the efficiency
and competitiveness gains from integration –
requires strengthening of seamless transport
chains for passengers and freight across the
continent, removing gaps, bottlenecks and
technical barriers. The most urgent needs include
critical inter-urban road and rail links, seaports,
airports, and inland waterway connections.
International gateways
European seaports receive 90% of all EU external
trade, and investment in larger and more
automated facilities, capable of handling the new
generation of Post-Panamax ships, is essential for
European industry to remain competitive on a
global basis. Investment is mixed, with the
private sector providing the operation and
equipment and the public sector supplying
common user infrastructure. Airport capacity is
critical for the transport of high value goods and
the ability of EU companies to travel for business.
There is a need to keep up with rising demand
and maintain Europe’s privileged position as an
international hub for air travel.
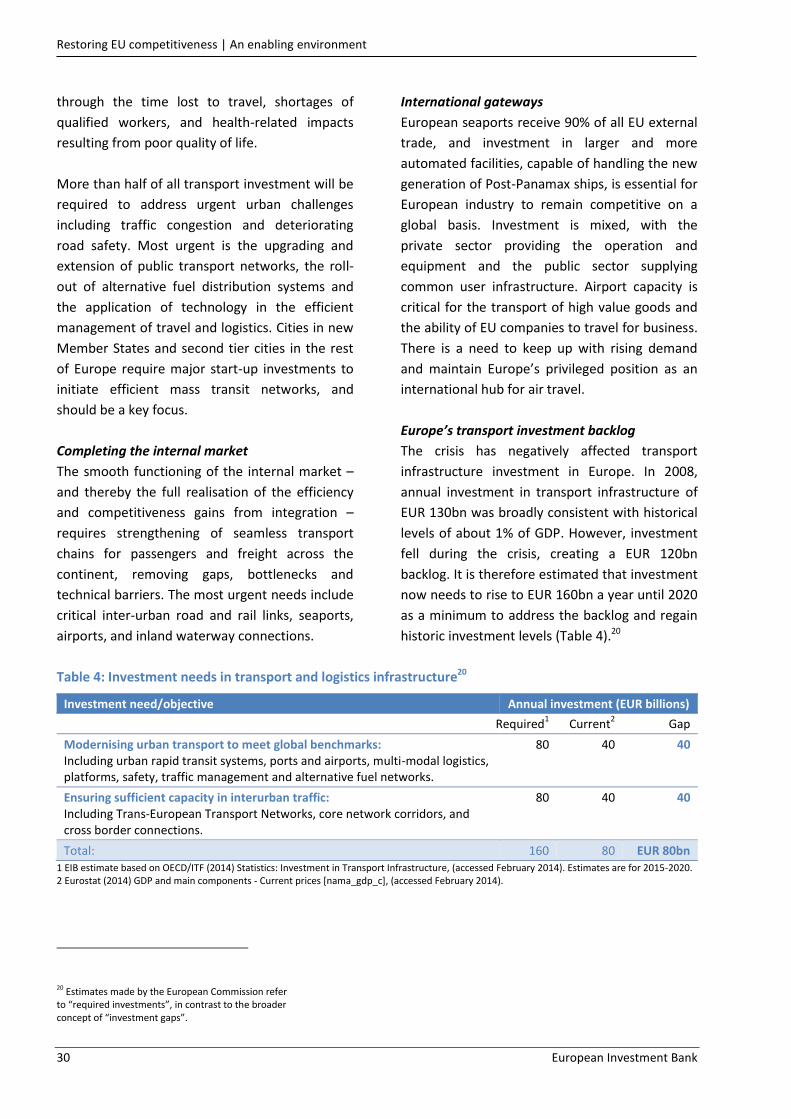
Europe’s transport investment backlog
The crisis has negatively affected transport
infrastructure investment in Europe. In 2008,
annual investment in transport infrastructure of
EUR 130bn was broadly consistent with historical
levels of about 1% of GDP. However, investment
fell during the crisis, creating a EUR 120bn
backlog. It is therefore estimated that investment
now needs to rise to EUR 160bn a year until 2020
as a minimum to address the backlog and regain
historic investment levels (Table 4).20
Table 4: Investment needs in transport and logistics infrastructure20
Investment need/objective Annual investment (EUR billions)
Required1 Current
2 Gap
Modernising urban transport to meet global benchmarks: Including urban rapid transit systems, ports and airports, multi-modal logistics, platforms, safety, traffic management and alternative fuel networks.
80 40 40
Ensuring sufficient capacity in interurban traffic: Including Trans-European Transport Networks, core network corridors, and cross border connections.
80
40 40
Total: 160 80 EUR 80bn 1 EIB estimate based on OECD/ITF (2014) Statistics: Investment in Transport Infrastructure, (accessed February 2014). Estimates are for 2015-2020. 2 Eurostat (2014) GDP and main components - Current prices [nama_gdp_c], (accessed February 2014).
20 Estimates made by the European Commission refer to “required investments”, in contrast to the broader concept of “investment gaps”.
Restoring EU competitiveness | An enabling environment
European Investment Bank 31
Energy
The secure supply of energy at reasonable prices
to industry and households is crucial to Europe’s
competitiveness. Rising retail prices and risks of
supply interruptions are increasingly perceived as
threatening Europe’s long-term competitiveness.
Sustained and well-targeted investment is
required to put downward pressure on prices,
and (excluding RDI) can be broken down into
three main areas: energy security, networks and
efficiency.21
Securing EU energy supply
The European Commission has identified 33
priority projects as crucial for EU’s energy
security in the short to medium term. These
focus on increasing gas storage capacity,
increasing capacity to transport gas from
Western to Eastern Europe and completing
electricity interconnections to the Baltic States.
In the longer term, in addition to investing in
renewable energy sources and energy efficiency,
supply security can be further enhanced through
investments in domestic hydrocarbon produc-
tion, including potentially from unconventional
sources where this can be done in accordance
with appropriately high environmental and social
standards. Further investments are required to
diversify gas suppliers (notably through the
Southern Gas Corridor) and increase liquefied
natural gas (LNG) imports and production. These
investments may lower prices in part by
improving the EU negotiating position with
existing suppliers, boosting relatively low cost
indigenous production and, in the case of gas
storage, helping to smooth seasonal price
fluctuations.
21 The investment gap in energy is assessed against the needs identified by the European Commission; however, while the Commission’s plans foresee implementation until 2020, the EIB’s analysis assumes that the required investments are only completed by 2030.
Modernising energy networks
Where currently constrained, investments in
energy networks can offer high productivity
gains. As described in the Annex, increasing
interconnection between markets helps create
gains from trade, and reduce average generation
costs. These potential gains are likely to increase
as the share of local renewable generation
increases in the generation mix.
In the electricity sub-sector, the European
Commission has identified investment needs for
onshore and offshore transmission lines, smart
grids and storage. In addition to these projects of
European significance, additional investment is
needed for upgrading distribution networks and
domestic transmission lines. In the gas sub-
sector, additional investment is needed for EU
priority projects as well as the general moderni-
zation of gas distribution networks.
Achieving greater energy efficiency
There is a large potential for investments in the
building and industry sector to improve energy
efficiency – helping to reduce energy bills and
mitigating risks of supply interruptions. With
energy prices expected to rise over time,
delivering these investments is likely to become
even more central to ensuring long-term
sustainable growth. Indeed, Europe’s high energy
efficiency standards (e.g. for engine emissions)
may become a source of first-mover competitive
advantage.
The large potential in Europe is largely unreal-
ised. Barriers to cost-effective investment include
poor information, split incentives for rental
buildings and lack of access to finance. Subsidies
also weaken incentives in some parts of the EU.
As shown in Table 5, a large portion of the
identified investment gap in energy relates to
energy efficiency in buildings and industry.
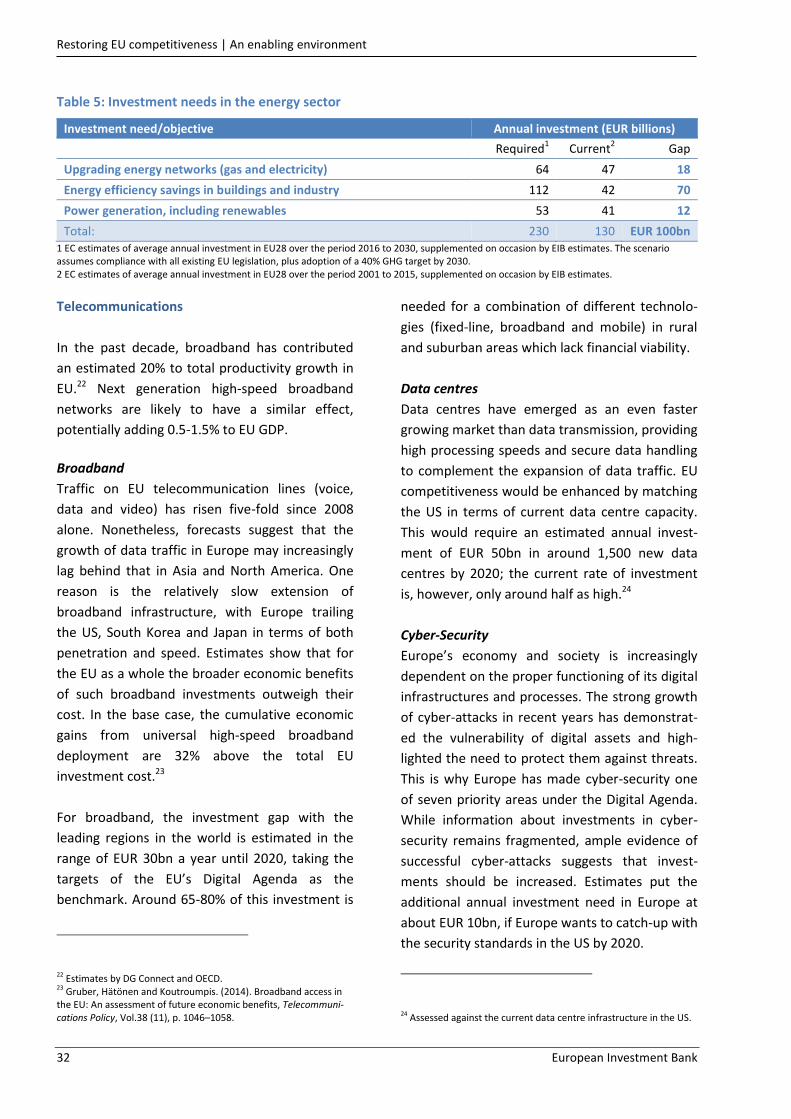
Restoring EU competitiveness | An enabling environment
32 European Investment Bank
Table 5: Investment needs in the energy sector
Investment need/objective Annual investment (EUR billions)
Required1 Current
2 Gap
Upgrading energy networks (gas and electricity) 64 47 18
Energy efficiency savings in buildings and industry 112 42 70
Power generation, including renewables 53 41 12
Total: 230 130 EUR 100bn 1 EC estimates of average annual investment in EU28 over the period 2016 to 2030, supplemented on occasion by EIB estimates. The scenario assumes compliance with all existing EU legislation, plus adoption of a 40% GHG target by 2030. 2 EC estimates of average annual investment in EU28 over the period 2001 to 2015, supplemented on occasion by EIB estimates.
Telecommunications
In the past decade, broadband has contributed
an estimated 20% to total productivity growth in
EU.22 Next generation high-speed broadband
networks are likely to have a similar effect,
potentially adding 0.5-1.5% to EU GDP.
Broadband
Traffic on EU telecommunication lines (voice,
data and video) has risen five-fold since 2008
alone. Nonetheless, forecasts suggest that the
growth of data traffic in Europe may increasingly
lag behind that in Asia and North America. One
reason is the relatively slow extension of
broadband infrastructure, with Europe trailing
the US, South Korea and Japan in terms of both
penetration and speed. Estimates show that for
the EU as a whole the broader economic benefits
of such broadband investments outweigh their
cost. In the base case, the cumulative economic
gains from universal high-speed broadband
deployment are 32% above the total EU
investment cost.23
For broadband, the investment gap with the
leading regions in the world is estimated in the
range of EUR 30bn a year until 2020, taking the
targets of the EU’s Digital Agenda as the
benchmark. Around 65-80% of this investment is
22 Estimates by DG Connect and OECD. 23 Gruber, Hätönen and Koutroumpis. (2014). Broadband access in the EU: An assessment of future economic benefits, Telecommuni-cations Policy, Vol.38 (11), p. 1046–1058.
needed for a combination of different technolo-
gies (fixed-line, broadband and mobile) in rural
and suburban areas which lack financial viability.
Data centres
Data centres have emerged as an even faster
growing market than data transmission, providing
high processing speeds and secure data handling
to complement the expansion of data traffic. EU
competitiveness would be enhanced by matching
the US in terms of current data centre capacity.
This would require an estimated annual invest-
ment of EUR 50bn in around 1,500 new data
centres by 2020; the current rate of investment
is, however, only around half as high.24
Cyber-Security
Europe’s economy and society is increasingly
dependent on the proper functioning of its digital
infrastructures and processes. The strong growth
of cyber-attacks in recent years has demonstrat-
ed the vulnerability of digital assets and high-
lighted the need to protect them against threats.
This is why Europe has made cyber-security one
of seven priority areas under the Digital Agenda.
While information about investments in cyber-
security remains fragmented, ample evidence of
successful cyber-attacks suggests that invest-
ments should be increased. Estimates put the
additional annual investment need in Europe at
about EUR 10bn, if Europe wants to catch-up with
the security standards in the US by 2020.
24 Assessed against the current data centre infrastructure in the US.
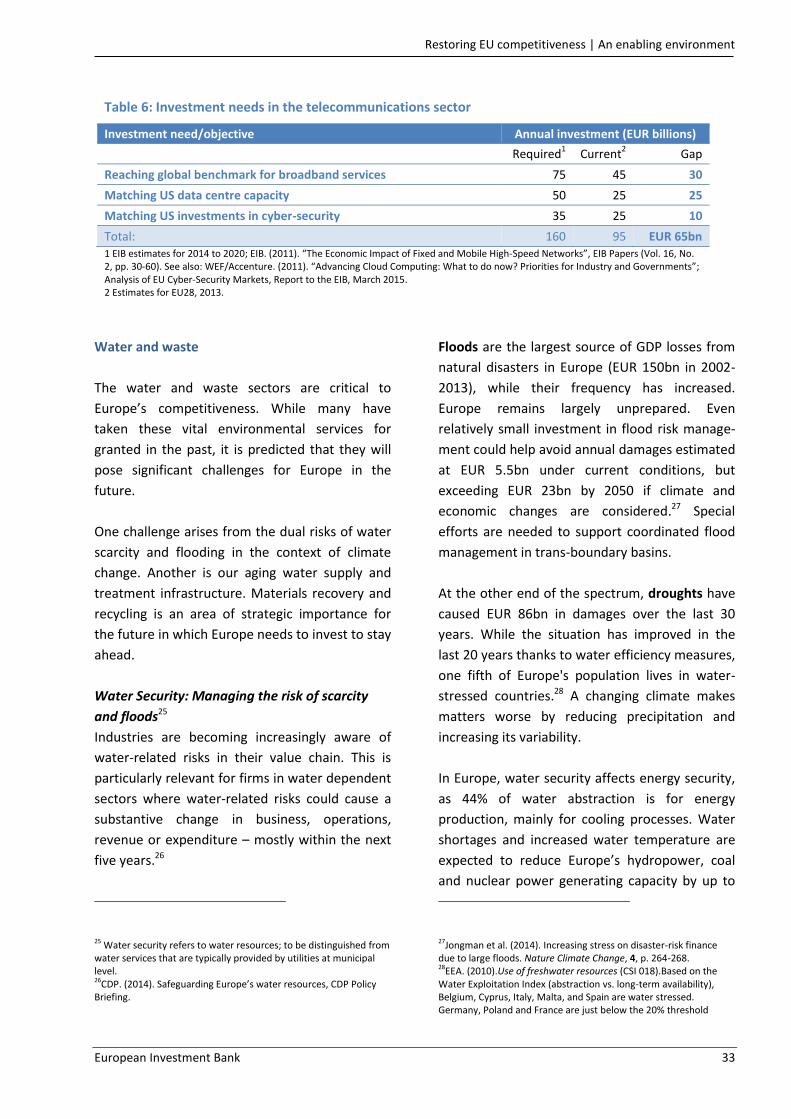
Restoring EU competitiveness | An enabling environment
European Investment Bank 33
Water and waste
The water and waste sectors are critical to
Europe’s competitiveness. While many have
taken these vital environmental services for
granted in the past, it is predicted that they will
pose significant challenges for Europe in the
future.
One challenge arises from the dual risks of water
scarcity and flooding in the context of climate
change. Another is our aging water supply and
treatment infrastructure. Materials recovery and
recycling is an area of strategic importance for
the future in which Europe needs to invest to stay
ahead.
Water Security: Managing the risk of scarcity
and floods25
Industries are becoming increasingly aware of
water-related risks in their value chain. This is
particularly relevant for firms in water dependent
sectors where water-related risks could cause a
substantive change in business, operations,
revenue or expenditure – mostly within the next
five years.26
25 Water security refers to water resources; to be distinguished from water services that are typically provided by utilities at municipal level. 26CDP. (2014). Safeguarding Europe’s water resources, CDP Policy Briefing.
Floods are the largest source of GDP losses from
natural disasters in Europe (EUR 150bn in 2002-
2013), while their frequency has increased.
Europe remains largely unprepared. Even
relatively small investment in flood risk manage-
ment could help avoid annual damages estimated
at EUR 5.5bn under current conditions, but
exceeding EUR 23bn by 2050 if climate and
economic changes are considered.27 Special
efforts are needed to support coordinated flood
management in trans-boundary basins.
At the other end of the spectrum, droughts have
caused EUR 86bn in damages over the last 30
years. While the situation has improved in the
last 20 years thanks to water efficiency measures,
one fifth of Europe's population lives in water-
stressed countries.28 A changing climate makes
matters worse by reducing precipitation and
increasing its variability.
In Europe, water security affects energy security,
as 44% of water abstraction is for energy
production, mainly for cooling processes. Water
shortages and increased water temperature are
expected to reduce Europe’s hydropower, coal
and nuclear power generating capacity by up to
27Jongman et al. (2014). Increasing stress on disaster-risk finance due to large floods. Nature Climate Change, 4, p. 264-268. 28EEA. (2010).Use of freshwater resources (CSI 018).Based on the Water Exploitation Index (abstraction vs. long-term availability), Belgium, Cyprus, Italy, Malta, and Spain are water stressed. Germany, Poland and France are just below the 20% threshold
Table 6: Investment needs in the telecommunications sector
Investment need/objective Annual investment (EUR billions)
Required1 Current
2 Gap
Reaching global benchmark for broadband services 75 45 30
Matching US data centre capacity 50 25 25
Matching US investments in cyber-security 35 25 10
Total: 160 95 EUR 65bn 1 EIB estimates for 2014 to 2020; EIB. (2011). “The Economic Impact of Fixed and Mobile High-Speed Networks”, EIB Papers (Vol. 16, No. 2, pp. 30-60). See also: WEF/Accenture. (2011). “Advancing Cloud Computing: What to do now? Priorities for Industry and Governments”; Analysis of EU Cyber-Security Markets, Report to the EIB, March 2015. 2 Estimates for EU28, 2013.
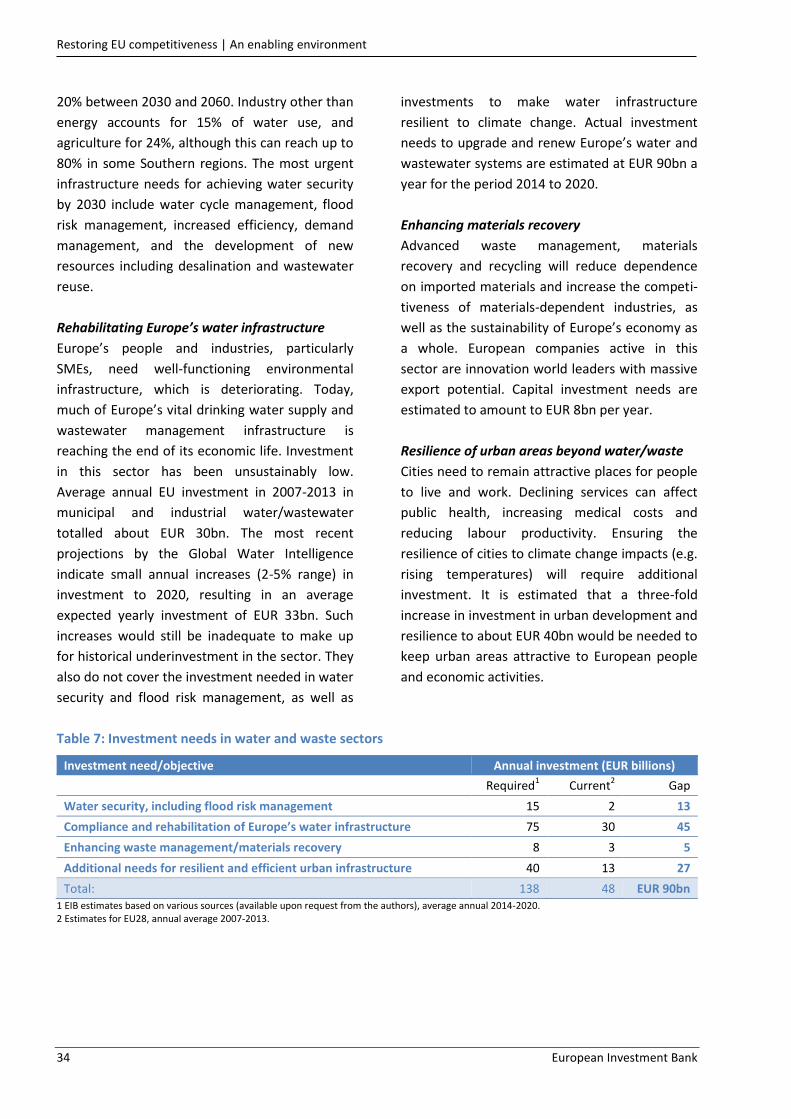
Restoring EU competitiveness | An enabling environment
34 European Investment Bank
20% between 2030 and 2060. Industry other than
energy accounts for 15% of water use, and
agriculture for 24%, although this can reach up to
80% in some Southern regions. The most urgent
infrastructure needs for achieving water security
by 2030 include water cycle management, flood
risk management, increased efficiency, demand
management, and the development of new
resources including desalination and wastewater
reuse.
Rehabilitating Europe’s water infrastructure
Europe’s people and industries, particularly
SMEs, need well-functioning environmental
infrastructure, which is deteriorating. Today,
much of Europe’s vital drinking water supply and
wastewater management infrastructure is
reaching the end of its economic life. Investment
in this sector has been unsustainably low.
Average annual EU investment in 2007-2013 in
municipal and industrial water/wastewater
totalled about EUR 30bn. The most recent
projections by the Global Water Intelligence
indicate small annual increases (2-5% range) in
investment to 2020, resulting in an average
expected yearly investment of EUR 33bn. Such
increases would still be inadequate to make up
for historical underinvestment in the sector. They
also do not cover the investment needed in water
security and flood risk management, as well as
investments to make water infrastructure
resilient to climate change. Actual investment
needs to upgrade and renew Europe’s water and
wastewater systems are estimated at EUR 90bn a
year for the period 2014 to 2020.
Enhancing materials recovery
Advanced waste management, materials
recovery and recycling will reduce dependence
on imported materials and increase the competi-
tiveness of materials-dependent industries, as
well as the sustainability of Europe’s economy as
a whole. European companies active in this
sector are innovation world leaders with massive
export potential. Capital investment needs are
estimated to amount to EUR 8bn per year.
Resilience of urban areas beyond water/waste
Cities need to remain attractive places for people
to live and work. Declining services can affect
public health, increasing medical costs and
reducing labour productivity. Ensuring the
resilience of cities to climate change impacts (e.g.
rising temperatures) will require additional
investment. It is estimated that a three-fold
increase in investment in urban development and
resilience to about EUR 40bn would be needed to
keep urban areas attractive to European people
and economic activities.
Table 7: Investment needs in water and waste sectors
Investment need/objective Annual investment (EUR billions)
Required1 Current
2 Gap
Water security, including flood risk management 15 2 13
Compliance and rehabilitation of Europe’s water infrastructure 75 30 45
Enhancing waste management/materials recovery 8 3 5
Additional needs for resilient and efficient urban infrastructure 40 13 27
Total: 138 48 EUR 90bn 1 EIB estimates based on various sources (available upon request from the authors), average annual 2014-2020. 2 Estimates for EU28, annual average 2007-2013.

Restoring EU competitiveness | An enabling environment
European Investment Bank 35
2.3.3 Financial sector capacity
Competitiveness depends on the capacity and
efficiency of the financial sector in allocating and
reallocating the resources available in the
economy to the most productive uses. Financial
sector capacity is therefore a key enabler for the
establishment and growth of innovative firms,
allowing them to replace firms that have become
uncompetitive. It is a key enabler for firms of all
sizes to invest in the latest technologies and
absorb the latest process innovations in order to
raise productivity and maintain their ability to
compete.
Finance needs and financial systems
The financing needs of firms change through their
life cycle (Figure 24):
Start-ups are typically characterised by large
financing needs, high risk, no track record
and little collateral. They often have difficul-
ty accessing finance and rely mostly on seed
money from investors such as family, busi-
ness angels and early-stage venture capital.
Bank loans play a lesser role, particularly for
riskier projects.
Growth phase firms – Late-stage venture
capital is important for young firms with high
growth potential and innovative products.
Such firms may also get financing through
bank loans and raise capital through private
equity markets and may later decide to offer
their stock to the public through an initial
public offering (IPO).
Mature phase firms generally have smaller
external financing needs which are typically
covered by bank loans and bond financing,
as well as equity. Increased retained earn-
ings usually allow for a larger share of inter-
nal funding.
Figure 24: External financing needs along the life cycle of firms
Source: EIB
Within Europe, and between Europe and other
major economies, there are significant differ-
ences in terms of how these different financing
needs are served. Europe and Japan are said to
have bank-based financial systems while the US –
and some EU countries, such as the UK,29 are
more market-based. In the latter, markets for
tradable securities (such as stocks or bonds) play
a much bigger role (Figure 25).
While neither of these systems is inherently
better than the other (they offer different ways
of addressing the same needs), a number of gaps
have emerged in their ability to meet different
financing needs, particularly in the aftermath of
the crisis.
29Bijlsma, Gijsbert, Zwart. (2013).The changing landscape of financial markets in Europe, the US and Japan. Bruegel Working Paper.
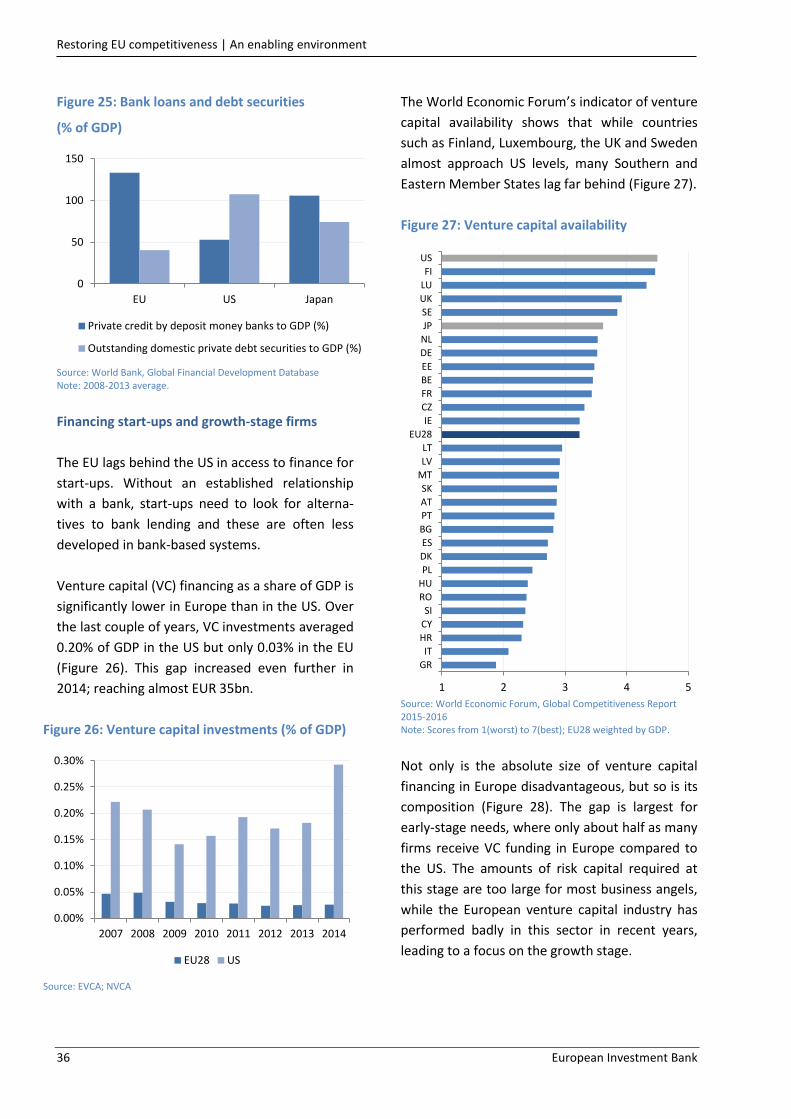
Restoring EU competitiveness | An enabling environment
36 European Investment Bank
Figure 25: Bank loans and debt securities
(% of GDP)
Source: World Bank, Global Financial Development Database Note: 2008-2013 average.
Financing start-ups and growth-stage firms
The EU lags behind the US in access to finance for
start-ups. Without an established relationship
with a bank, start-ups need to look for alterna-
tives to bank lending and these are often less
developed in bank-based systems.
Venture capital (VC) financing as a share of GDP is
significantly lower in Europe than in the US. Over
the last couple of years, VC investments averaged
0.20% of GDP in the US but only 0.03% in the EU
(Figure 26). This gap increased even further in
2014; reaching almost EUR 35bn.
Figure 26: Venture capital investments (% of GDP)
Source: EVCA; NVCA
The World Economic Forum’s indicator of venture
capital availability shows that while countries
such as Finland, Luxembourg, the UK and Sweden
almost approach US levels, many Southern and
Eastern Member States lag far behind (Figure 27).
Figure 27: Venture capital availability
Source: World Economic Forum, Global Competitiveness Report 2015-2016 Note: Scores from 1(worst) to 7(best); EU28 weighted by GDP.
Not only is the absolute size of venture capital
financing in Europe disadvantageous, but so is its
composition (Figure 28). The gap is largest for
early-stage needs, where only about half as many
firms receive VC funding in Europe compared to
the US. The amounts of risk capital required at
this stage are too large for most business angels,
while the European venture capital industry has
performed badly in this sector in recent years,
leading to a focus on the growth stage.
0
50
100
150
EU US Japan
Private credit by deposit money banks to GDP (%)
Outstanding domestic private debt securities to GDP (%)
0.00%
0.05%
0.10%
0.15%
0.20%
0.25%
0.30%
2007 2008 2009 2010 2011 2012 2013 2014
EU28 US
1 2 3 4 5
US
FI
LU
UK
SE
JP
NL
DE
EE
BE
FR
CZ
IE
EU28
LT
LV
MT
SK
AT
PT
BG
ES
DK
PL
HU
RO
SI
CY
HR
IT
GR

Restoring EU competitiveness | An enabling environment
European Investment Bank 37
Figure 28: Venture capital, share of firms receiving VC Funding in Europe and the US (%)
Source: Kraeussl and Krause. (2011). Has Europe been catching up? An industry level analysis of venture capital success over 1985-2009. Document de Travail 327, Banque de France. Note: 1985-2009 data. EU* includes Austria, Belgium, Denmark, Finland, France, Germany, Ireland, Italy, Netherlands, Portugal, Spain, Sweden, UK.
One important factor hampering the develop-
ment of early and growth-stage financing in
Europe is the greater difficulty venture capital
investors may have in selling successful invest-
ments to outsiders through equity markets. Stock
market capitalisation is much higher in the US
than in most European countries, as is IPO
activity.30 European exit markets are not only
smaller but also fragmented along national lines,
reducing liquidity and venture capitalists’ exit
possibilities (Figure 29).
30 Bijlsma, Gijsbert, Zwart. (2013).The changing landscape of financial markets in Europe, the US and Japan. Bruegel Working Paper.
Figure 29: Stock market capitalization (% of GDP)
Source: World Bank, Global Financial Development Database Note: 2008-2014 average. Different colours in the EU column indicate the shares of the 28 different EU countries, respectively.
Financing SMEs
Whether young or mature, SMEs experience
more difficulty accessing finance than larger
corporates. Within the SME sector, younger SMEs
face the most difficulty.31 The latest ECB Survey
on Access to Finance (SAFE) reveals that access to
finance remains an important concern of SMEs in
some EU Member States. Even with low demand
for bank loans in the current post-crisis environ-
ment, the percentage of SMEs in the euro area
reporting access to finance as their main problem
stands at 11%. In addition, approximately 28% of
firms in the euro area still face access to finance
difficulties (Figure 30).
31E.g. Öztürk and Mrkaic. (2014). SMEs’ Access to Finance in the Euro Area: What Helps or Hampers?. IMF Working Paper WP/14/78.
0%
20%
40%
60%
80%
100%
EU* US
Seed-stage Early-stage Later-stage
0
20
40
60
80
100
120
EU Japan US

Restoring EU competitiveness | An enabling environment
38 European Investment Bank
Figure 30: Access to finance difficulties in the euro area
Source: ECB, Survey on Access to Finance (SAFE), Apr-Sep 2015 Note: % of SMEs that applied for a bank loan, Apr-Sep 2015; Difficulties defined as the sum of ‘Applied but was rejected’, ‘Applied but only got a limited part’, ‘Applied but only got a part of it’, ‘Applied but refused because cost was too high’.
The access to finance problem is more pro-
nounced in the EU than in other leading econo-
mies, according to WEF’s indicator on access to
loans (Figure 31). In addition, there is a remarka-
ble difference in the magnitude of the drop in
score from 2007 to 2015, in particular for the EU
South (from 3.4 to 1.7).
Figure 31: Access to loans, comparison between 2015 and 2007
Source: World Economic Forum, Global Competitiveness Report 2007-2008 and 2015-2016 Note: Scores from 1(worst) to 7(best); EU averages are weighted by GDP. For definitions of EU regions see note Figure 3.
The strong dependency of European SMEs on
bank financing has made them more prone to the
post crisis weaknesses and deleveraging needs of
the EU banking sector leading to low risk-taking
capacity. One factor limiting the European banks’
ability to take risks is their difficulty in securitising
SME loans due to a very shallow market. The ECB,
EC, IMF and European Council have all called for
action to facilitate expanded SME securitisation
in Europe to promote innovation, productivity
growth and job creation in this vitally important
segment.32
Another factor is the inability of SMEs to access
bond markets. Several initiatives such as German
Mittelstand bonds and the Italian Minibond
market, are being developed to help address this
gap, but their effectiveness is yet to be proven.
The impact of the crisis on financial capacity
During the global financial crisis the financing
situation worsened significantly for European
firms, particularly SMEs (larger mature firms have
actually become net savers). In a difficult
economic and regulatory environment that is still
finding the right balance between constraining
excessive risk-taking and allowing efficient risk
allocation, capital-constrained banks have begun
a process of deleveraging that is ongoing, and
that has meant a reduction in bank lending. The
situation has been exacerbated in many of the
countries hardest hit by the crisis as European
financial markets have become increasingly
fragmented along national lines, hampering the
reallocation of resources from one country to
investment opportunities in another.
Going forward, two key bottlenecks in the
provision of risk bearing capacity required to
catalyse investment have emerged as a conse-
quence of the crisis. Firstly, many Member States
and sub-sovereigns, which are classical providers
of risk-bearing capacity for socially desirable
projects through equity or guarantees, find
themselves with less fiscal space for direct
32Kraemer-Eis, Passaris, Tappi. (2013). SME Loan Securitisation 2.0: Market Assessment and Policy Options. EIF Working Paper 2013/19.
0
10
20
30
40
50
GR
NL
ES CY LT AT IE IT
Euro
are
a
FR BE
PT LV SK DE FI SI LU MT EE
1
2
3
4
5
EU28 US Japan EUNorth
EUSouth
EU East
2007 2015

Restoring EU competitiveness | An enabling environment
European Investment Bank 39
funding through budgets or government risk-
taking in Public-Private Partnership schemes
(Figure 32).
Figure 32: Medium-term fiscal constraints: required fiscal adjustments (% of GDP)
Source: Commission services Note: Fiscal adjustment required to reach 60% public debt-to-GDP. Only showing Member States in which required fiscal adjustments are positive.
Secondly, following the regulatory response to
the financial crisis, European banks face signifi-
cant capital constraints. The ECB Asset Quality
Review and stress tests showed that European
banks are generally well capitalised in terms of
CET1 capital ratios. However, this review
assumed a static balance sheet, without
increased lending to support economic recovery.
Many banks also only barely meet the Basel III
minimum leverage ratio of 3%, and would
currently fail higher standards like the 5%
threshold that was recently introduced by the
Federal Reserve for systemically important
banking groups (Figure 33). The space for
European banks to expand their balance sheets
or to shift from low risk sovereign holdings to
higher risk corporate lending when demand picks
up is limited.
Figure 33: Bank leverage ratios
Source: ECB 2014 AQR Note: Country averages for SSM-covered banks
0 2 4 6 8
CZ
MT
LT
CY
RO
ES
AT
EA
EU
IT
SI
FR
FI
PT
BE
UK
IE
HR
GR

Restoring EU competitiveness | An enabling environment
40 European Investment Bank
2.3.4 Institutions and markets
Effective institutions and efficient markets
underpin an economy’s foundation for firms to
be competitive. Structural and institutional
reforms are essential elements of EU’s response
to the challenge of competitiveness. However,
because this area lies largely outside the EIB’s
mandate, it will be examined only briefly here.
Institutions
In the context of competitiveness, important
institutions include factors such as property
rights, transparency, accountability, the effec-
tiveness of corporate governance, the efficiency
of government spending and the effectiveness of
regulations including the regulation of markets.
The Global Competitiveness indicators on
institutions suggest that there is little or no
overall gap between the general quality of EU
institutions and those of the US. However, in
comparison with Japan the EU lags behind in all
indicators (Figure 34). In addition, these
indicators also suggest that institutions are
overall significantly weaker in Southern Europe
than in some Northern European countries.
Figure 34: Institutional environment, EU and leading economies
Source: World Economic Forum, Global Competitiveness Report 2015-2016. Note: Institutions Pillar (1st Pillar). Scores from 1(worst) to 7(best). EU28 weighted by GDP.
Markets
The efficient functioning of markets is driven by
their regulation, size and openness. It allows
economies to produce products and services
most appropriate to their particular supply-and-
demand conditions. Sound domestic and foreign
market competition is important in driving
market efficiency. Market efficiency in turn drives
productivity in the economy by allowing the most
efficient firms to be those that thrive. An efficient
and flexible labour market is also important to
ensure that labour is allocated to its most
efficient use. Rigid labour markets can make it
harder for firms to react to changing market
conditions.
According to the World Economic Forum
indicators, the EU lags behind both the US and
Japan in terms of labour market efficiency. This is
particularly true for the Southern Member States.
They all show difficulty in retaining and attracting
talent, two essential ingredients for building a
strong pool of skilled workers that can generate
ideas and in turn power innovation. The
indicators suggest that the efficiency of EU and
US goods markets are similar, albeit with room
for improvement in both.
1234567
Accountability
Corporate ethics
Ethics andcorruption
Property rightsPublic-sectorperformance
Security
Undue influence
EU28 US Japan South Korea

Restoring EU competitiveness | EU Single Market
European Investment Bank 41
2.4 EU Single Market
One area in which the EU has a great opportunity
to further increase its competitiveness is through
the strengthening of the EU Single Market. This
can give EU firms the access to a large internal
market like US firms and thereby incentivise
innovation.
The European Parliament study, “Mapping the
cost of non-Europe, 2014-2019”, brings together
a series of estimates of the efficiency gains that
could be achieved. These include:
Delivering and completing the existing single
market for goods and services could achieve
efficiency gains worth EUR 615bn (1.8% of
EU28 GDP) a year between 2014 and 2019;
Implementing a digital single market could
be worth a further EUR 415bn;
Implementing a Banking Union to avert a
new financial crisis could be worth EUR 21bn
per year;
Creating fully integrated and effectively
regulated EU-wide financial markets could
achieve EUR 82bn per year in interest sav-
ings alone, principally reducing financing
costs for SMEs; and
A more economically and physically inte-
grated single market in energy could result in
annual efficiency gains of around EUR
250bn.
Total potential gains amount to approxi-
mately 12% of EU GDP, equivalent to EUR
1.6 trillion.33
The Single Market is at the very essence of the
European Union. By removing internal barriers,
33 European Parliament, EPRS, European Added Value Unit. (2015). Mapping the Cost of Non-Europe 2014 -19. Third edition: April 2015.
economic integration boosts internal trade and
facilitates market entry. It increases competition
and enables economies of scale, which in turn
improve innovation incentives, efficiency and
attract more external investors. Market integra-
tion leads to higher growth, job creation and
welfare gains. Optimizing the EU Single Market
and maximizing ‘European Added Value’ is vital to
creating a healthier, more prosperous and
competitive Europe.
We have already gained a lot from integration …
The European Commission estimates that the
Single Market has increased trade within the EU
by about 15% per year over the past 10 years. It
has generated additional growth of 1.8% and
created around 2.5 million more jobs, while
reducing differences in income levels between
Member States.34
Figure 35: Intra and extra-EU exports of goods (EUR bn)
Source: European Commission, AMECO
34 European Commission. (2015). Factsheet on the European Union, The Internal Market – General principles.
-
1,000
2,000
3,000
4,000
5,000
20
02
20
03
20
04
20
05
20
06
20
07
20
08
20
09
20
10
20
11
20
12
20
13
20
14
Extra-EU Intra-EU
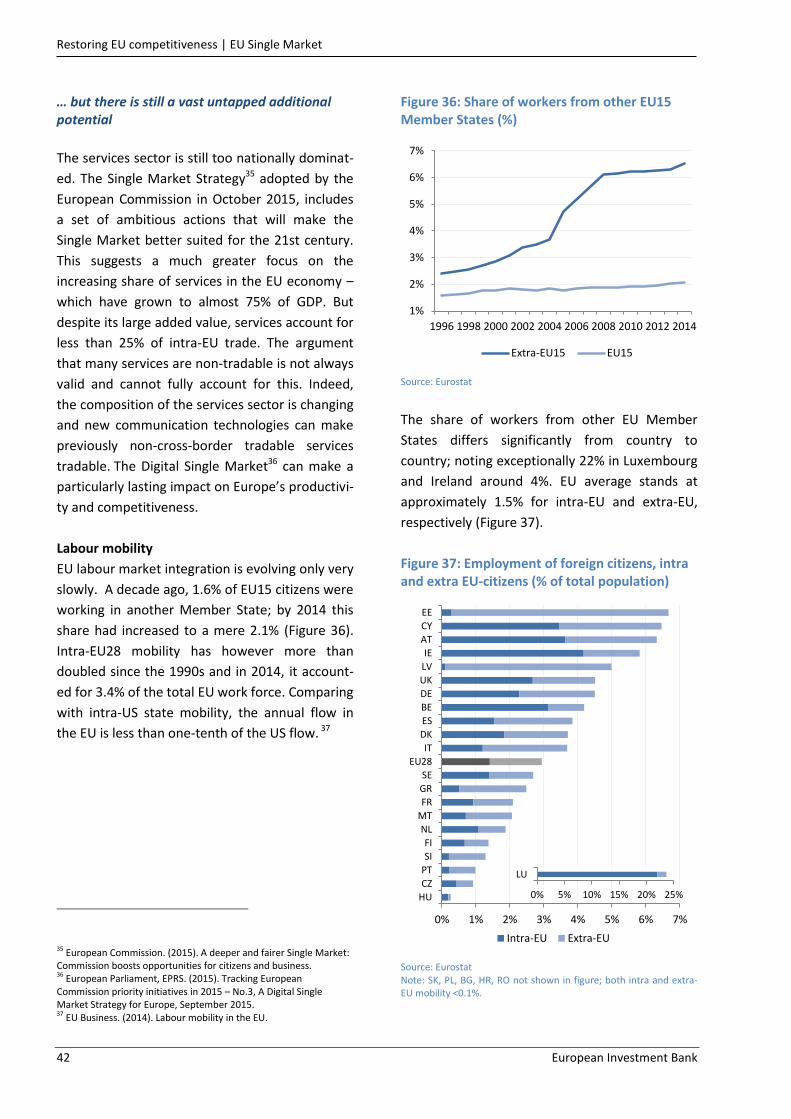
Restoring EU competitiveness | EU Single Market
42 European Investment Bank
… but there is still a vast untapped additional potential
The services sector is still too nationally dominat-
ed. The Single Market Strategy35 adopted by the
European Commission in October 2015, includes
a set of ambitious actions that will make the
Single Market better suited for the 21st century.
This suggests a much greater focus on the
increasing share of services in the EU economy –
which have grown to almost 75% of GDP. But
despite its large added value, services account for
less than 25% of intra-EU trade. The argument
that many services are non-tradable is not always
valid and cannot fully account for this. Indeed,
the composition of the services sector is changing
and new communication technologies can make
previously non-cross-border tradable services
tradable. The Digital Single Market36 can make a
particularly lasting impact on Europe’s productivi-
ty and competitiveness.
Labour mobility
EU labour market integration is evolving only very
slowly. A decade ago, 1.6% of EU15 citizens were
working in another Member State; by 2014 this
share had increased to a mere 2.1% (Figure 36).
Intra-EU28 mobility has however more than
doubled since the 1990s and in 2014, it account-
ed for 3.4% of the total EU work force. Comparing
with intra-US state mobility, the annual flow in
the EU is less than one-tenth of the US flow. 37
35 European Commission. (2015). A deeper and fairer Single Market: Commission boosts opportunities for citizens and business. 36 European Parliament, EPRS. (2015). Tracking European Commission priority initiatives in 2015 – No.3, A Digital Single Market Strategy for Europe, September 2015. 37 EU Business. (2014). Labour mobility in the EU.
Figure 36: Share of workers from other EU15 Member States (%)
Source: Eurostat
The share of workers from other EU Member
States differs significantly from country to
country; noting exceptionally 22% in Luxembourg
and Ireland around 4%. EU average stands at
approximately 1.5% for intra-EU and extra-EU,
respectively (Figure 37).
Figure 37: Employment of foreign citizens, intra and extra EU-citizens (% of total population)
Source: Eurostat Note: SK, PL, BG, HR, RO not shown in figure; both intra and extra-EU mobility <0.1%.
1%
2%
3%
4%
5%
6%
7%
1996 1998 2000 2002 2004 2006 2008 2010 2012 2014
Extra-EU15 EU15
0% 1% 2% 3% 4% 5% 6% 7%
EE
CY
AT
IE
LV
UK
DE
BE
ES
DK
IT
EU28
SE
GR
FR
MT
NL
FI
SI
PT
CZ
HU
Intra-EU Extra-EU
0% 5% 10% 15% 20% 25%
LU

Restoring EU competitiveness | EU Single Market
European Investment Bank 43
Cross-border capital flows
The capital flows across EU are sub-optimal and
too reliant on banks. Free flows of capital allocate
financial resources to the most productive
investments. Financial integration should
increase intra-EU FDI (and extra-EU FDI as EU
firms become more competitive), reduce
volatility in market returns and provide greater
portfolio diversification. Efficiency gains are
realised through risk diversification.38 However,
many barriers between cross-border investors
and companies still remain. The Capital Markets
Union represents an important step towards
building an EU single market for capital from the
bottom up, identifying barriers and knocking
them down one by one, creating a sense of
momentum and helping to spark growing
confidence in investing in Europe's future.
38 Berger, Hasan, Korhonen and Zhouf. (2010). Does Diversification Increase or Decrease Bank Risk and Performance? Evidence on Diversification and the Risk-Return Tradeoff.

Restoring EU competitiveness | Responding to the challenge
44 European Investment Bank
3. Responding to the challenge
Following the Second World War and the
divisions of the cold war, Europe has re-emerged
as one of the most competitive regions of the
world, steadily closing the gap with the US and
building on its ample strengths: its people, an
abundance of intellectual, scientific and techno-
logical capacities, its climate, as well as a rich
history of intellectual and business endeavour.
But since the 1990s, Europe has not kept pace
with other leading economies, and its ability to
compete has declined. The economic and
financial crisis has significantly aggravated this
trend. Areas of weakness include high structural
unemployment, fragmented internal markets,
and wide variations in economic performance
with a widening North-South and West-East
divide.
Investment in areas that are crucial for competi-
tiveness – whether in research and development
in key sectors and technologies, in education or
in the renewal and expansion of Europe’s
infrastructure – has fallen far behind what we
need to preserve and strengthen the EU’s
competitive position. This holds true not only for
areas where the EU lags behind but also for
current areas of excellence, which need to grow
in order to remain competitive.
Europe’s mainly bank-based financial system and
the institutional foundations of EU integration
have suffered systemic blows. Repairing and
regrouping these systems will require many
years, during which these important enablers of
competitiveness will remain impaired.
The challenge that Europe faces is not only one of
keeping up with and driving change in the global
market place, but in many areas also one of
catching up – clearing a backlog of investment to
rebuild our former strength and to spur process-
es of innovation. This needs to happen alongside
processes of structural reform to ensure
competitive, flexible and efficient markets for
products, labour and finance. Further deepening
of the EU Single Market will be crucial.
The need for a comprehensive policy response
Rebuilding the competitiveness of Europe’s
economy requires a concerted approach that
looks at enabling factors as well as direct
innovation performance and sufficient access to
finance for economically desirable modernisation
investments. Structural reforms and appropriate
regulation to ensure competitive, flexible and
efficient markets for goods and services, labour
and finance – including action to deepen Europe’s
internal market – is one essential part of this
approach. Public intervention that addresses
market failures and catalyses private sector
investment is another.
Public promotion of investment can enhance
welfare wherever the private sector is not facing
the right incentives to provide sufficient finance
needed to enhance and sustain competitiveness.
Such market inefficiencies occur, for example,
where the positive economic impacts of
investment go beyond the revenue that can be
captured by private enterprises. We can see such
positive externalities and high returns to society
in areas such as:
Basic research and Research, Development
and Innovation (RDI) that is still far from
commercialisation, particularly in strategic
technologies and sectors;
Innovative start-ups and SMEs that face
financing constraints;
Restoring EU competitiveness | Responding to the challenge
European Investment Bank 45
Investment in human capital, including
education, health and research infrastruc-
tures or facilities; and
Investment in strategic infrastructure as a
public good that enhances long-term
productivity and competition across the
economy, as well as driving innovation in
strategic sectors.
One part of the challenge that we face is that
meeting the very large structural investment gaps
identified in this report is not just a matter of
providing appropriate financial resources.
Important bottlenecks also exist in terms of
prioritisation and planning, in capacity for
implementation and in the technical preparation
and structuring of a pipeline of sound projects.
Such bottlenecks are also partly holding up the
leveraging of private finance.
Supporting competitiveness – the EIB’s track
record
Responding to the challenge of restoring EU
competitiveness is already an integral aspect of
what the EIB does. The Bank’s approach of
combining financing – the blending of loans with
grant finance – and the provision of technical
assistance is critical in maximising the impact of
public intervention and in ensuring a timely
pipeline of sound investment opportunities. By
offering tailor-made products covering the whole
range of risk profiles, the EIB Group can target its
intervention to specific needs and thereby
maximise its impact.
The EIB Group has a track record of supporting
sound investments and having a major impact in
many of the areas that are critical to restoring
Europe’s competitiveness. These include:
Innovation: In 2015, the EIB financed EUR
18.68 billion in innovation. This included
4.9 billion in finance of private sector RDI,
backing 50 innovative companies, mobi-
lising EUR 11 billion in investment.
SME access to finance: In 2015, the EIB
Group financed EUR 29.24 billion for
SMEs and mid-caps to support access to
finance, of which over 90 percent was in
the EU. This represents support to
240,000 SME’s and mid-caps through in-
termediated loans, guarantees, equity
and securitisation products;
Equity financing: The EIF has established
itself as a leading European investor in
seed, venture and growth capital funds,
with a strong focus on ICT, life sciences
and clean technology. In 2015, it under-
took new equity commitments of EUR
2.18 billion. In addition, the EIB is devel-
oping instruments for direct equity fi-
nancing for mid-caps, e.g. InnovFin;
Education, skills and healthcare: EIB
operations in 2015 will result in an esti-
mated 1.45 million students with im-
proved educational facilities and 9.8 mil-
lion people with better healthcare;
Strategic infrastructure: In 2015, the EIB
financed EUR 18.92 billion in strategic in-
frastructure, of which about 90 percent
for projects in the EU. This included di-
rect lending, complemented by innova-
tive products like the Europe 2020 Pro-
ject Bond initiative to catalyse capital
market financing. Some expected results
of projects financed by the EIB in 2015
include: time savings for 380 million pas-
senger trips per year; 15.3 million new
and upgraded digital connections; 30,904
km of power lines constructed/upgraded;
electricity generation capacity of about
2,828 MW – of which 94% from renewa-
bles; provision of power to 2.34 million
households; and 13 million smart metres
installed;

Restoring EU competitiveness | Responding to the challenge
46 European Investment Bank
Climate action: The Bank strongly sup-
ports the EU transition towards a circular
economy and is one of the leading inves-
tors globally in climate action. In 2015,
the EIB provided financed of EUR 22.65
billion for climate action related projects.
The Bank’s entire product range is complemented
by technical advisory services to develop, unlock
and improve economically and financially viable
investment projects.
The EIB and the Investment Plan for Europe –
making a difference
The scale of the structural challenge that Europe
faces should not be underestimated. Although it
is impossible to specify exactly what interven-
tions and how much investment is needed in
each sector, this report takes the step of
presenting best estimates based on reasonable
global benchmarks and common EU objectives.
These estimates should not be seen as setting out
an investment plan per se, but as an indication of
the need for action. Indeed, the scale of the
challenge revealed by this report makes clear
that concerted efforts will be needed across the
EU Member States, and for an extended period,
going beyond any one initiative.
The Investment Plan for Europe, that was
launched last year, represents a well-targeted
response to this challenge that can make a
substantial contribution to Europe’s competitive-
ness and long-term economic potential.
Working alongside the other policy priorities of
structural reforms and fiscal responsibility, the
Investment Plan has three strands of action to
address the needs identified by this report:
Improving the institutional and market
environment for investment, including
the deepening of the EU Single Market;
A new European Investment Advisory
Hub to help public authorities and project
promoters in Member States to identify,
prioritise, prepare and implement strate-
gic projects and to make more efficient
use of EU funds, bringing together spe-
cialist advisory services currently success-
fully delivered by the EIB and the Europe-
an Commission; and
The new European Fund for Strategic
Investments (EFSI),39 to mobilise EUR 315
billion of investment in strategic infra-
structure and companies, helping to ad-
dress key market gaps and structural
weaknesses to build a more competitive,
sustainable and prosperous EU economy.
EFSI is a dedicated account, managed and hosted
by the EIB and jointly funded by the European
Commission and the EIB. It focuses on financing
sectors of key structural importance to the EU
where the EIB Group has proven expertise and
capacity. These include strategic digital, transport
and energy sector investments; investments in
education, research and innovation; investments
to help small, medium-sized and mid-cap
companies to modernise, grow and boost
employment; and environmentally sustainable
projects. The Fund complements the EIB Group’s
existing activities by focusing on higher risk-
bearing financial products to address the
bottlenecks identified by this report and have a
greater catalytic effect on private finance in the
current low-confidence macro-environment.
Despite the governance structure only just being
finalised, through transitory arrangements, EFSI
and the European Investment Advisory Hub are
already up and running. The EIB Group has to
date already approved more than 100 projects
under EFSI, which will mobilize EUR 50 billion of
investments in Europe.
39 http://www.eib.org/invest-eu

Restoring EU competitiveness | Responding to the challenge
European Investment Bank 47
Member States have pledged contributions
totaling more than EUR 42 billion to projects
supported by EFSI through National Promotional
Banks and Institutions.
EFSI comes on top of ‘normal’ EIB activity. All EIB
projects need to fulfill the same strict criteria on
economic and technical viability. Our annual
financial commitments in the EU in 2015,
excluding EFSI, amounted to almost EUR 70
billion, mobilizing investment in the EU corre-
sponding to 1.4 percent of EU GDP.
Together with other European institutions we are
committed to restore confidence, stimulate
investment and promote recovery. Our engage-
ment is not only about addressing short-term
needs, but is focused on targeted interventions
to address the structural challenges that Europe
faces.
Restoring EU competitiveness is central to re-
embarking on the EU success story of cohesion
and prosperity.


Economics DepartmentU [email protected]/economics
Information Desk3 +352 4379-220005 +352 4379-62000U [email protected]
European Investment Bank98-100, boulevard Konrad AdenauerL-2950 Luxembourg3 +352 4379-15 +352 437704www.eib.org
© EIB 01/2016 EN © EIB GraphicTeam


