Journal of Cell Science Restricted diffusion of OXPHOS complexes in dynamic mitochondria delays their exchange between cristae and engenders a transitory mosaic distribution Verena Wilkens, Wladislaw Kohl and Karin Busch* Department of Biology/Chemistry, Division of Mitochondrial Dynamics, University of Osnabrueck, 49069 Osnabrueck, Germany *Author for correspondence ([email protected]) Accepted 5 September 2012 Journal of Cell Science 126, 103–116 ß 2013. Published by The Company of Biologists Ltd doi: 10.1242/jcs.108852 Summary Mitochondria are involved in cellular energy supply, signaling and apoptosis. Their ability to fuse and divide provides functional and morphological flexibility and is a key feature in mitochondrial quality maintenance. To study the impact of mitochondrial fusion/fission on the reorganization of inner membrane proteins, oxidative phosphorylation (OXPHOS) complexes in mitochondria of different HeLa cells were tagged with fluorescent proteins (GFP and DsRed-HA), and cells were fused by polyethylene glycol treatment. Redistribution of the tagged OXPHOS complexes was then followed by means of immunoelectron microscopy, two color super-resolution fluorescence microscopy and single molecule tracking. In contrast to outer membrane and matrix proteins, which mix quickly and homogeneously upon mitochondrial fusion, the mixing of inner membrane proteins was decelerated. Our data suggest that the composition of cristae is preserved during fusion of mitochondria and that cristae with mixed OXPHOS complexes are only slowly and successively formed by restricted diffusion of inner membrane proteins into existing cristae. The resulting transitory mosaic composition of the inner mitochondrial membrane illuminates mitochondrial heterogeneity and potentially is linked to local differences in function and membrane potential. Key words: Mitochondrial fusion and fission dynamics, Super-resolution tracking and localization microscopy, Oxidative phosphorylation, Membrane protein diffusion, Mitochondrial microcompartments, Immunoelectron microscopy (IEM) Introduction Mitochondria provide the vast majority of the cellular energy by oxidative phosphorylation (OXPHOS). Their role in calcium homeostasis, in the process of aging, their significance for cell life and death and their participation in the progress of diverse diseases emerged only recently, though (Beal, 2005; Lu, 2009). Mitochondrial fusion and fission dynamics (Bereiter-Hahn and Jendrach, 2010) play a crucial role in these processes. In general, the balance between fusion and fission determines the mitochondrial morphology and facilitates the exchange of metabolites, mtDNA and proteins (Nakada et al., 2001; Ono et al., 2001; Malka et al., 2005; Twig et al., 2006). Also the maintenance of a healthy mitochondrial population is directly linked to ongoing fusion/fission (Twig et al., 2008; Campello and Scorrano, 2010). The immediate outcome of mitochondrial fusion and fission such as the redistribution of membrane compounds as well as the problem of concerted membrane fusion and division have to still be worked out in the field, though. Mitochondria possess two membranes: the outer (OMM) and the inner (IMM) mitochondrial membrane. The inner membrane harbors one fifth of total mitochondrial proteins, of which the protein complexes of the respiratory chain and the mitochondrial F 1 F O ATP synthase provide 55%. NADH dehydrogenase (NADH:ubiquinone oxidoreductase; CI) (Harmon et al., 1974), succinate dehydrogenase (CII), cytochrome bc 1 complex (cytochrome c reductase; CIII), cytochrome c oxidase (cytochrome c:oxygen oxidoreductase, CIV) and the F 1 F O ATP synthase (complex V) constitute the oxidative phosphorylation (OXPHOS) system. Multiple intrusions of the inner mitochondrial membrane leaflet enlarge the surface of the IMM many fold (Mannella et al., 1994; Perkins et al., 2010). As a consequence, the inner mitochondrial membrane is basically composed of two parts: the inner boundary membrane (IBM) facing the OMM and the intruding cristae membrane (CM), separated by the so called cristae junctions (CJ). Probably, the CM is the principal site of oxidative phosphorylation (Gilkerson et al., 2003). Beside ATP synthesis, maintenance of a membrane potential by the OXPHOS is essential for mitochondrial and cell survival. To guarantee this, different levels of mitochondrial quality control are established: (1) mitochondrial proteases degrade dysfunctional proteins (Arnold and Langer, 2002); (2) damaged organelles lose their ability to fuse and are decomposed via a process called mitophagy (Scherz-Shouval and Elazar, 2007; Kurz et al., 2008; Twig et al., 2008; Mouli et al., 2009); and (3) fusion and fission dynamics provide a mechanism to avoid the accumulation of damaged proteins by facilitating the regular remixing of mitochondrial compounds (Ishihara et al., 2003; Arimura et al., 2004). Despite this, the distribution and function of mitochondria within a cell is not necessarily homogeneous (Bereiter-Hahn and Voeth, 1998; Collins et al., 2002; Busch et al., 2006; Muster et al., 2010) and protein and membranous structures might be unevenly distributed (Wikstrom et al., 2009; Wurm et al., 2011). To further dissect this, we here analyzed the distribution of OXPHOS Research Article 103
Transcript
Journ
alof
Cell
Scie
nce
Restricted diffusion of OXPHOS complexes in dynamicmitochondria delays their exchange between cristaeand engenders a transitory mosaic distribution
Verena Wilkens, Wladislaw Kohl and Karin Busch*Department of Biology/Chemistry, Division of Mitochondrial Dynamics, University of Osnabrueck, 49069 Osnabrueck, Germany
Accepted 5 September 2012Journal of Cell Science 126, 103–116� 2013. Published by The Company of Biologists Ltddoi: 10.1242/jcs.108852
SummaryMitochondria are involved in cellular energy supply, signaling and apoptosis. Their ability to fuse and divide provides functional andmorphological flexibility and is a key feature in mitochondrial quality maintenance. To study the impact of mitochondrial fusion/fission
on the reorganization of inner membrane proteins, oxidative phosphorylation (OXPHOS) complexes in mitochondria of different HeLacells were tagged with fluorescent proteins (GFP and DsRed-HA), and cells were fused by polyethylene glycol treatment. Redistributionof the tagged OXPHOS complexes was then followed by means of immunoelectron microscopy, two color super-resolution fluorescencemicroscopy and single molecule tracking. In contrast to outer membrane and matrix proteins, which mix quickly and homogeneously
upon mitochondrial fusion, the mixing of inner membrane proteins was decelerated. Our data suggest that the composition of cristae ispreserved during fusion of mitochondria and that cristae with mixed OXPHOS complexes are only slowly and successively formed byrestricted diffusion of inner membrane proteins into existing cristae. The resulting transitory mosaic composition of the inner
mitochondrial membrane illuminates mitochondrial heterogeneity and potentially is linked to local differences in function andmembrane potential.
Key words: Mitochondrial fusion and fission dynamics, Super-resolution tracking and localization microscopy, Oxidative phosphorylation, Membrane
protein diffusion, Mitochondrial microcompartments, Immunoelectron microscopy (IEM)
IntroductionMitochondria provide the vast majority of the cellular energy by
oxidative phosphorylation (OXPHOS). Their role in calcium
homeostasis, in the process of aging, their significance for cell
life and death and their participation in the progress of diverse
diseases emerged only recently, though (Beal, 2005; Lu, 2009).
Mitochondrial fusion and fission dynamics (Bereiter-Hahn and
Jendrach, 2010) play a crucial role in these processes. In general,
the balance between fusion and fission determines the
mitochondrial morphology and facilitates the exchange of
metabolites, mtDNA and proteins (Nakada et al., 2001; Ono
et al., 2001; Malka et al., 2005; Twig et al., 2006). Also the
maintenance of a healthy mitochondrial population is directly
linked to ongoing fusion/fission (Twig et al., 2008; Campello and
Scorrano, 2010). The immediate outcome of mitochondrial fusion
and fission such as the redistribution of membrane compounds as
well as the problem of concerted membrane fusion and division
have to still be worked out in the field, though.
Mitochondria possess two membranes: the outer (OMM) and the
inner (IMM) mitochondrial membrane. The inner membrane harbors
one fifth of total mitochondrial proteins, of which the protein
complexes of the respiratory chain and the mitochondrial F1FO ATP
synthase provide 55%. NADH dehydrogenase (NADH:ubiquinone
oxidoreductase; CI) (Harmon et al., 1974), succinate dehydrogenase
(CII), cytochrome bc1 complex (cytochrome c reductase; CIII),
cytochrome c oxidase (cytochrome c:oxygen oxidoreductase, CIV)
and the F1FO ATP synthase (complex V) constitute the oxidative
phosphorylation (OXPHOS) system. Multiple intrusions of the inner
mitochondrial membrane leaflet enlarge the surface of the IMM
many fold (Mannella et al., 1994; Perkins et al., 2010). As a
consequence, the inner mitochondrial membrane is basically
composed of two parts: the inner boundary membrane (IBM)
facing the OMM and the intruding cristae membrane (CM),
separated by the so called cristae junctions (CJ). Probably, the
CM is the principal site of oxidative phosphorylation (Gilkerson
et al., 2003). Beside ATP synthesis, maintenance of a membrane
potential by the OXPHOS is essential for mitochondrial and cell
survival. To guarantee this, different levels of mitochondrial quality
control are established: (1) mitochondrial proteases degrade
dysfunctional proteins (Arnold and Langer, 2002); (2) damaged
organelles lose their ability to fuse and are decomposed via a process
called mitophagy (Scherz-Shouval and Elazar, 2007; Kurz et al.,
2008; Twig et al., 2008; Mouli et al., 2009); and (3) fusion and
fission dynamics provide a mechanism to avoid the accumulation of
damaged proteins by facilitating the regular remixing of
mitochondrial compounds (Ishihara et al., 2003; Arimura et al.,
2004). Despite this, the distribution and function of mitochondria
within a cell is not necessarily homogeneous (Bereiter-Hahn and
Voeth, 1998; Collins et al., 2002; Busch et al., 2006; Muster et al.,
2010) and protein and membranous structures might be unevenly
distributed (Wikstrom et al., 2009; Wurm et al., 2011). To further
dissect this, we here analyzed the distribution of OXPHOS
complexes with different tags were fused and mixing was
analyzed on the mitochondrial level according to an established
method (Ishihara et al., 2003).
To visualize individual OXPHOS complexes, complex I was
tagged with monomeric eGFP (eGFPm) C-terminally at the 30 kDa
subunit, CII was tagged with eGFPm at the subunit B (SDHB) and
CIII at the subunit 10 (6.4 kDa subunit). CIV was tagged with
DsRed–HA at the Cox8a subunit that faces the IMS, and complex
V was labeled at the c-subunit. The successful assembly of the
tagged subunits into complexes was shown before (Muster et al.,
2010; Sukhorukov et al., 2010). For immunodetection, antibodies
against the eGFPm- or HA-tagged OXPHOS complexes were used,
and the secondary antibody was probed with a gold nanoparticle
(Fig. 1; supplementary material Fig. S1). Combinations of 6 nm/
12 nm and 12 nm/20 nm gold were used. Control cells without
labeled OXPHOS complexes were negative in IEM.
OXPHOS complexes are primarily localized in thecristae membrane
First, a distribution profile of OXPHOS complexes in the different
IMM microcompartments CM, CJ and IBM was compiled.
OXPHOS complexes were visualized by immunogold labeling on
cryosections. Generally, the arrangement of cristae in HeLa
mitochondria was rather regular, with .90% of cristae
perpendicular to the longitudinal axis of the respective
mitochondrion (Fig. 2A). The mean width of single cristae was
rather constant with 1762 nm (6s.d.), and the distance between
two adjacent cristae was about 51615 nm in average (Fig. 2A9).
For allocation of the probed OXPHOS complexes in the IMM
microcompartments, a typical crista with a length according to the
average length (413 nm) was delineated. The preferential
distribution of all complexes in the CM microcompartment is
obvious (Fig. 2B–F). CI showed a rather homogeneous distribution
in the middle part of the CM (Fig. 2B). Similar longitudinal
distributions were obtained for all complexes, whereas the absolute
distance of the gold labels to the crista membrane varied as predicted
from the likely position of the tagged subunit.
OXPHOS complexes display different localization profilesin the CM
To dissect the distribution of the OXPHOS complexes in the
different microcompartments IBM, CJ and CM quantitatively, a
Fig. 1. Experimental outline to determine the
consequence of mitochondrial fusion on the
reorganization of the inner mitochondrial
membrane. In cryosections of fused cells with
differently tagged OXPHOS complexes, the
distribution of labeled proteins was studied by
immunoelectron microscopy to determine the
mode of inner membrane fusion. Two states are
feasible: (i) entire cristae are preserved during
fusion with no exchange of compounds between
adjacent cristae, and (ii) cristae of mixed
composition emerge, which result either from
reformation of cristae or diffusion of compounds
into existing cristae. Scale bar: 3 mm.
Journal of Cell Science 126 (1)104
Journ
alof
Cell
Scie
nce
window was moved alongside the IMM. Within this sliding
window, particles were counted and respective protein
localization profiles were generated as recently described (Rabl
et al., 2009) (supplementary material Fig. S2). All five
investigated OXPHOS complexes were predominantly located
in the CM-microcompartment (Fig. 2G). The comparison of the
Fig. 2. See next page for legend.
Retarded mixing of OXPHOS complexes 105
Journ
alof
Cell
Scie
nce
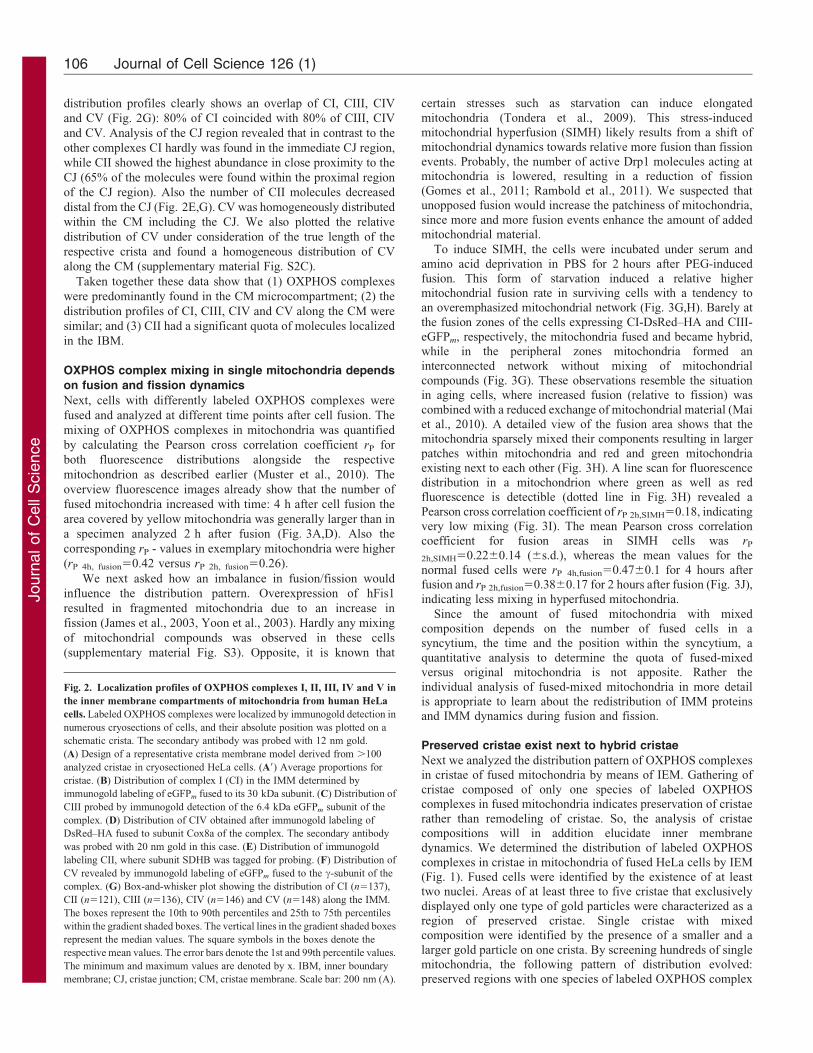
distribution profiles clearly shows an overlap of CI, CIII, CIV
and CV (Fig. 2G): 80% of CI coincided with 80% of CIII, CIV
and CV. Analysis of the CJ region revealed that in contrast to the
other complexes CI hardly was found in the immediate CJ region,
while CII showed the highest abundance in close proximity to the
CJ (65% of the molecules were found within the proximal region
of the CJ region). Also the number of CII molecules decreased
distal from the CJ (Fig. 2E,G). CV was homogeneously distributed
within the CM including the CJ. We also plotted the relative
distribution of CV under consideration of the true length of the
respective crista and found a homogeneous distribution of CV
along the CM (supplementary material Fig. S2C).
Taken together these data show that (1) OXPHOS complexes
were predominantly found in the CM microcompartment; (2) the
distribution profiles of CI, CIII, CIV and CV along the CM were
similar; and (3) CII had a significant quota of molecules localized
in the IBM.
OXPHOS complex mixing in single mitochondria depends
on fusion and fission dynamics
Next, cells with differently labeled OXPHOS complexes were
fused and analyzed at different time points after cell fusion. The
mixing of OXPHOS complexes in mitochondria was quantified
by calculating the Pearson cross correlation coefficient rP for
both fluorescence distributions alongside the respective
mitochondrion as described earlier (Muster et al., 2010). The
overview fluorescence images already show that the number of
fused mitochondria increased with time: 4 h after cell fusion the
area covered by yellow mitochondria was generally larger than in
a specimen analyzed 2 h after fusion (Fig. 3A,D). Also the
corresponding rP - values in exemplary mitochondria were higher
(rP 4h, fusion50.42 versus rP 2h, fusion50.26).
We next asked how an imbalance in fusion/fission would
influence the distribution pattern. Overexpression of hFis1
resulted in fragmented mitochondria due to an increase in
fission (James et al., 2003, Yoon et al., 2003). Hardly any mixing
of mitochondrial compounds was observed in these cells
(supplementary material Fig. S3). Opposite, it is known that
certain stresses such as starvation can induce elongated
mitochondria (Tondera et al., 2009). This stress-inducedmitochondrial hyperfusion (SIMH) likely results from a shift ofmitochondrial dynamics towards relative more fusion than fission
events. Probably, the number of active Drp1 molecules acting atmitochondria is lowered, resulting in a reduction of fission(Gomes et al., 2011; Rambold et al., 2011). We suspected thatunopposed fusion would increase the patchiness of mitochondria,
since more and more fusion events enhance the amount of addedmitochondrial material.
To induce SIMH, the cells were incubated under serum and
amino acid deprivation in PBS for 2 hours after PEG-inducedfusion. This form of starvation induced a relative highermitochondrial fusion rate in surviving cells with a tendency toan overemphasized mitochondrial network (Fig. 3G,H). Barely at
the fusion zones of the cells expressing CI-DsRed–HA and CIII-eGFPm, respectively, the mitochondria fused and became hybrid,while in the peripheral zones mitochondria formed an
interconnected network without mixing of mitochondrialcompounds (Fig. 3G). These observations resemble the situationin aging cells, where increased fusion (relative to fission) was
combined with a reduced exchange of mitochondrial material (Maiet al., 2010). A detailed view of the fusion area shows that themitochondria sparsely mixed their components resulting in larger
patches within mitochondria and red and green mitochondriaexisting next to each other (Fig. 3H). A line scan for fluorescencedistribution in a mitochondrion where green as well as redfluorescence is detectible (dotted line in Fig. 3H) revealed a
Pearson cross correlation coefficient of rP 2h,SIMH50.18, indicatingvery low mixing (Fig. 3I). The mean Pearson cross correlationcoefficient for fusion areas in SIMH cells was rP
2h,SIMH50.2260.14 (6s.d.), whereas the mean values for thenormal fused cells were rP 4h,fusion50.4760.1 for 4 hours afterfusion and rP 2h,fusion50.3860.17 for 2 hours after fusion (Fig. 3J),
indicating less mixing in hyperfused mitochondria.
Since the amount of fused mitochondria with mixedcomposition depends on the number of fused cells in asyncytium, the time and the position within the syncytium, a
quantitative analysis to determine the quota of fused-mixedversus original mitochondria is not apposite. Rather theindividual analysis of fused-mixed mitochondria in more detail
is appropriate to learn about the redistribution of IMM proteinsand IMM dynamics during fusion and fission.
Preserved cristae exist next to hybrid cristae
Next we analyzed the distribution pattern of OXPHOS complexesin cristae of fused mitochondria by means of IEM. Gathering ofcristae composed of only one species of labeled OXPHOScomplexes in fused mitochondria indicates preservation of cristae
rather than remodeling of cristae. So, the analysis of cristaecompositions will in addition elucidate inner membranedynamics. We determined the distribution of labeled OXPHOS
complexes in cristae in mitochondria of fused HeLa cells by IEM(Fig. 1). Fused cells were identified by the existence of at leasttwo nuclei. Areas of at least three to five cristae that exclusively
displayed only one type of gold particles were characterized as aregion of preserved cristae. Single cristae with mixedcomposition were identified by the presence of a smaller and a
larger gold particle on one crista. By screening hundreds of singlemitochondria, the following pattern of distribution evolved:preserved regions with one species of labeled OXPHOS complex
Fig. 2. Localization profiles of OXPHOS complexes I, II, III, IV and V in
the inner membrane compartments of mitochondria from human HeLa
cells. Labeled OXPHOS complexes were localized by immunogold detection in
numerous cryosections of cells, and their absolute position was plotted on a
schematic crista. The secondary antibody was probed with 12 nm gold.
(A) Design of a representative crista membrane model derived from .100
analyzed cristae in cryosectioned HeLa cells. (A9) Average proportions for
cristae. (B) Distribution of complex I (CI) in the IMM determined by
immunogold labeling of eGFPm fused to its 30 kDa subunit. (C) Distribution of
CIII probed by immunogold detection of the 6.4 kDa eGFPm subunit of the
complex. (D) Distribution of CIV obtained after immunogold labeling of
DsRed–HA fused to subunit Cox8a of the complex. The secondary antibody
was probed with 20 nm gold in this case. (E) Distribution of immunogold
labeling CII, where subunit SDHB was tagged for probing. (F) Distribution of
CV revealed by immunogold labeling of eGFPm fused to the c-subunit of the
complex. (G) Box-and-whisker plot showing the distribution of CI (n5137),
CII (n5121), CIII (n5136), CIV (n5146) and CV (n5148) along the IMM.
The boxes represent the 10th to 90th percentiles and 25th to 75th percentiles
within the gradient shaded boxes. The vertical lines in the gradient shaded boxes
represent the median values. The square symbols in the boxes denote the
respective mean values. The error bars denote the 1st and 99th percentile values.
The minimum and maximum values are denoted by x. IBM, inner boundary
membrane; CJ, cristae junction; CM, cristae membrane. Scale bar: 200 nm (A).
Journal of Cell Science 126 (1)106
Journ
alof
Cell
Scie
nce
were repeatedly found. These parts were habitually alternating
with preserved regions with the complementary OXPHOS
complex of different origin indicating generally non-mixed
parts. These non-mixed parts retained their original state within
fused mitochondria (Fig. 4A–D, green and red arrowheads). In
some fused mitochondria we found larger regions composed of
Fig. 3. Different states of mitochondrial hybridization examined by OXPHOS fluorescence distribution in fused cells. (A) Cells expressing CI-eGFPm and CIII-
DsRed were fused by PEG treatment and incubated for another 4–5 h before analysis. The fluorescence image shows a fused cell with at least three nuclei. Yellow areas
indicate the presence of hybrid mitochondria with a mixed composition of OXPHOS complexes. (B) A more detailed view reveals that in the hybrid mitochondria the
OXPHOS complexes CI-eGFPm and CV-DsRed are not homogeneously distributed. (C) Line plot of fluorescence distribution of CI-eGFPm and CV-DsRed along a single
mitochondrion shown in B (dotted line). (D) Overview of fused cells with CI-DsRed and CIII-eGFPm 2 h after cell fusion. (E) Fused CI-DsRed and CIII-eGFPm cells
display a patchy appearance of the mitochondria indicating inhomogeneous distribution of the protein complexes within the mitochondria. (F) Line plot of fluorescence
distribution of CI-DsRed and CIII-eGFPm along a single mitochondrion shown in E (dotted line). (G) Overview of cells expressing CI-DsRed–HA and CIII-eGFPm 2 h
after cell fusion under stress conditions to induce mitochondrial hyperfusion (SIMH). (H) SIMH cells show a patchy outline at the zone where the mitochondria of the
differently labeled cells fused. (I) Line plot of fluorescence distribution of CI-DsRed–HA and CIII-eGFPm along a single mitochondrion shown in H (dotted line).
(J) Determination of the complexes mixing degree in single mitochondria 4 h and 2 h after cell fusion and in stress-induced hyperfused mitochondria. Mean Pearson
cross correlation coefficients were calculated from 37 mitochondria (*P50.023; ***P53.5361025). Scale bars: 10 mm (A,D,G); 2 mm (B,E,H).
Retarded mixing of OXPHOS complexes 107
Journ
alof
Cell
Scie
nce
several cristae with mixed composition (colored yellow), flanked
by regions with cristae that harbor only one type of OXPHOS
complex (Fig. 4A, arrowheads; supplementary material Fig.
S4Aa). These conserved regions constituted up to 25% of the
mitochondrial area. So, mixed cristae were embedded in regions
where only one species of tagged OXPHOS complex was present.
Within one cell, also original non-fused mitochondria were found
next to fused mitochondria (Fig. 4C, green asterisk). Rarely, also
mitochondria with good mixing and numerous hybrid cristae side
by side were identified (Fig. 4E). Projection of the distribution of
different OXPHOS complexes related to single cristae on the
longitudinal axis of the respective mitochondria generated an
outline that conclusively corresponded to the patterned dispersion
found in fluorescence images before (supplementary material Fig.
S4). In SIMH cells fused mitochondria with mixed OXPHOS
complex composition were definitively less frequent as already
expected from the fluorescence analysis. Also the number of
hybrid cristae with mixed composition in single mitochondria was
reduced (Fig. 4F,G). The overall labeling degree was comparable
with normally fused cells, though.
For comparison, the distribution of OXPHOS complexes in
cells coexpressing two differently tagged fusion proteins was
determined by IEM. From previous fluorescence microscopic
analyses we expected a more homogeneous distribution of
OXPHOS complexes in coexpressing cells (Muster et al., 2010).
Indeed, we found significantly more hybrid cristae with mixed
composition in mitochondria of coexpressing cells compared to
fused mitochondria (Fig. 4H,I; supplementary material Fig.
S4B). This observation was independent of the particular
SIMH cells possessed even less hybrid cristae (5611%,
P51.361028; Fig. 5A). The quota of preserved cristae in single
mitochondria of fused cells was higher (49%) than in coexpressing
cells (46%). Eighteen percent of the cristae in mitochondria of
fused cells were not labeled compared to only 8% within those of
coexpressing cells. Since labeled OXPHOS complexes are diluted
out by non-tagged OXPHOS complexes from the fusing partner
cells, this is reasonable. To quantify the internal mixing degree, the
distances between nearest neighbor gold particles of different sizes
were determined in fused and hyperfused mitochondria (Fig. 5B).
Indeed, the OXPHOS mixing was less in SIMH mitochondria
reflected by significantly larger distances between gold particles of
different size (6 nm/12 nm; 12 nm/20 nm; P-value of 9.661024).
The mean value for gold particle distances in SIMH cells was
2006140 nm (6s.d.) compared to 1306100 nm (6s.d.) in
normally fused cells. 80% of the measured distances for the
SIMH cells ranged from 70 nm to 390 nm compared to a range
from 40 nm to 280 nm in normal fused cells. Obviously, the
mingling of OXPHOS complexes from different origin is
handicapped in SIMH cells.
The mixing degree of OXPHOS complexes in single hybrid
cristae in fused mitochondria is low
We next analyzed the mixing of OXPHOS complexes in single
hybrid cristae that derived from mitochondrial fusion/fission
dynamics. The distance between different gold particles
(respective different OXPHOS complexes) is an indicator for
the mixing degree: If hybrid cristae in fused cells develop by the
spreading and mixing of previous separated OXPHOS complexes
from different cristae, this will be reflected in the distance
between OXPHOS complexes from different origins. If the model
is right, then the distance between small and large gold particles
in cristae in fused cells should be larger than in cristae from
coexpressing cells. In coexpressing cells, a uniform dispersion of
Fig. 5. Analysis of OXPHOS allocation in coexpressing, fused and
hyperfused mitochondria. (A) Fraction of identified hybrid cristae in cells
coexpressing CI-DsRed–HA/CII-eGFPm and CI-DsRed–HA/CIII-eGFPm for
48 h and in syncytia of fused cells expressing CI-DsRed–HA and CIII-
eGFPm. The number of analyzed mitochondria was 34, which included 280
cristae in fused and 190 cristae in co-transfected cells and 36 mitochondria
including 267 cristae in SIMH cells. The plotted values are the percentage
(6s.d.) of hybrid cristae per single fused mitochondrion with mixed
composition. More than 700 gold particles were analyzed. (B) Quantification
of the distances between two different sized gold nanoparticles within single
mitochondria of fused cells expressing CI-DsRed–HA and CIII-eGFPm (6 nm
to 12 nm, 12 nm to 20 nm, nearest neighbor). The distances between gold
particles in fused mitochondria is significantly larger in SIMH cells than in
fused cells without starvation. Box-and-whisker plot showing mean distances
(n576) between the different sized gold nanoparticles. (C) Box-and-whisker
plot showing the mixing of OXPHOS complexes in hybrid cristae
characterized by the mean distance (n566) between 6 nm and 12 nm sized
gold nanoparticles within single hybrid cristae of fused cells expressing CI-
DsRed–HA and CIII-eGFPm and cells coexpressing CI-DsRed–HA and CIII-
eGFPm or CI-DsRed–HA and CII-eGFPm (see Fig. 2G). Asterisks indicate
statistical significance determined by a one-way-ANOVA (*P,0.05;
**P,0.01; ***P,0.001).
Retarded mixing of OXPHOS complexes 109
Journ
alof
Cell
Scie
nce
OXPHOS complexes and thus a short distance between large andsmall gold particles is expected.
Data presentation as a box-and-whisker plot shows that 80% ofthe measured distances for fused cells (CI+CIII) cover thedistance range from 35 nm to 290 nm, while in coexpressing
cells 80% of the measured distances range from 39 nm to 160 nm(CI+CIII) and from 20 nm to 90 nm (CI+CII), respectively(Fig. 5C). In mitochondria of fused cells with immunogold
labeled CI and CIII the mean distances between 6 nm and 12 nmsized gold particles was 123699 nm (6s.d.; n565). In contrast,the mean distance between 6 nm and 12 nm gold particles on
single cristae of coexpressing cells was significantly smaller:81649 nm (n565) for cells coexpressing CI and CIII(P52.861023). Interestingly, in cells coexpressing CI and CIIthe mean distance was even smaller with 50628 nm (n565;
Fig. 5C). The observed difference in the distances between CI+CIIcompared to CI+CIII in cotransfected cells was also significant(P51.861025), indicating a more homogeneous distribution of
CII. In sum, (1) the percentage of identified cristae with mixedcomposition in cotransfected cells was higher than in fused cells;(2) SIMH mitochondria possessed less hybrid cristae than
normally fused mitochondria; and (3) in single hybrid cristae infused mitochondria the mixing of different complexes was sparse.
The diffusion of OXPHOS complexes in the IMMcompartments is restricted
The data so far strongly support the model of a preponderant
preservation of cristae and their composition duringmitochondrial fusion and fission cycles. The patterneddistribution of OXPHOS complexes and the low amount of
hybrid cristae with mixed composition also indicate that proteindiffusion apparently is no doorway to overcome thisheterogeneity. To prove this experimentally we applied single
molecule tracking and localization microscopy (TALM) anddetermined the spatiotemporal behavior of OXPHOS complexesin mitochondria in live cells (Appelhans et al., 2012).
We analyzed the diffusion behavior of CII and CV. CII waschosen because our results indicated a specific distribution profileof CII combined with better mixing behavior compared to the other
OXPHOS complexes. CV is specific in its role to shape cristaecurvature (Strauss et al., 2008; Davies et al., 2012), probably bydimerization and oligomerization. Thus a mobility analysis withinthe cristae membrane microcompartment is tantalizing.
For tracking, respective subunits were tagged C-terminallywith the HaloTag7 and covalently labeled with HaloTag-
ligand conjugated with tetramethylrhodamine (HTL-TMR).Substoichiometrical labeling enabled the visualization of singlemolecules. Trajectory maps of CII in mitochondria weregenerated from time series (1000 frames) by reconnecting
single molecules from frame to frame by use of the multiple-target tracing algorithm (Serge et al., 2008). Single trajectorieswere plotted on an averaged image of the raw data image series
(Fig. 6A). To determine diffusion coefficients, step lengths wereplotted, and diffusion constants were determined from gradingthe obtained jump size histograms by a mixture model of
increasing complexity. The final complexity was validated byapplying a x2-test (Fig. 6B). By analyzing the jump sizedistributions, three populations characterized by different
diffusibilities could be gauged: (1) mobile CII freely diffusingalong mitochondria (dark blue curve); (2) a less mobile fraction(light blue curve); and (3) rather immobile CII (red curve). To
prove whether the position of the tag had an effect on the stabilityand mobility of the complex, subunit SDHD was labeled in a
control, but no difference of the diffusion coefficients was found(supplementary material Fig. S5).
For tracking, CV-Halo was specifically labeled with HTL-TMR at subunit-c. Here, 3000 subsequent image frames with
single molecules were recorded for further analysis. Thegenerated trajectory map was overlaid with an averaged imageof the raw data series (Fig. 6C). Immediately, the difference in
the course of trajectories with respect to the longitudinal axis ofthe mitochondria is visible (Fig. 6A,C). In this example, the jumpsize distribution diagram revealed three sub-populations of
complex V with different mobility, respectively: (1) a mobilefraction with a diffusion coefficient of Dapp50.070 mm2/s(indicated by the dark blue fitting curve); (2) a less mobilefraction with an apparent diffusion constant Dapp50.019 mm2/s
(light blue curve); and (3) an immobile fraction with an apparentdiffusion constant Dapp50.005 mm2/s. For more detailedanalysis, selected trajectories of CV were plotted and their
course was evaluated with respect to the position within amitochondrion (Fig. 6E). About 60% of the CV trajectoriesshowed a restricted course perpendicular to the longitudinal axis
of the respective mitochondrion (depicted in red). Bluetrajectories represent free diffusion or a course along thelongitudinal axis of the mitochondrion.
As we recently demonstrated, the orthogonal trajectories most
likely reflect the movement of OXPHOS complexes in CM. Incontrast, we assigned the molecules with the free respectivelongitudinal movements to diffusion in the IBM. The trajectories
of most of the CV fell in either of these categories. In rare cases(estimated ,1%), a change in course from orthogonal to random(light blue trajectories) or vice versa was found. When the
perpendicular part of the course overlaid with the perpendicularcourse of a different molecule, we assigned this part to berestricted diffusion within one crista and the overall course to
reproduce a transition between CM and IBM microcompartment.Analysis algorithms to identify these specific events forautomatic quantification are not yet developed. We next askedwhether differences in diffusion constants could be assigned to
different localizations of molecules (IBM versus CM). So,histograms of single trajectories of CV molecules wereconstructed using their diffusion constants calculated from their
mean square displacements (MSD, supplementary material Fig.S6). The frequency plot shows clearly two subpopulations:Subpopulation A with a mean Dapp50.056 mm2/s and
subpopulation B with a mean Dapp50.008 mm2/s. Thesesubpopulations were independently plotted in two trajectorymaps. In the trajectory map of the molecules with highermobility, trajectory courses were rather fortuitous, but some
perpendicular courses were also present not unlike a possibleconfinement in cristae (supplementary material Fig. S6A). Incontrast, for the majority of reduced mobile molecules the
displacement was quasi-punctual or was restricted inperpendicular courses (supplementary material Fig. S6B).Although the tendency that the diffusion coefficient is related
to the localization within a definite microcompartment isobvious, an univocal assignment of molecules by MSD analysisto different localizations (IBM, CM) is limited due to some
inaccuracy deriving from the 2D projection of 3D trajectories aswell as the imperfect structure of mitochondria (e.g. also bendedcristae or regions with no cristae exist).
Journal of Cell Science 126 (1)110
Journ
alof
Cell
Scie
nce
Finally, we compared the diffusion coefficients of CII and CV
(Fig. 6F). For CII and CV, a three fraction fit best matched the
distribution of jump sizes respectively in the different
experiments (n$300 mitochondria from 42 cells in n$3
independent preparations and at least 30,000 trajectories). It
clearly evolved that complex II overall is more mobile than
complex V: the mobile fraction of CII had an apparent diffusion
constant of Dapp50.14060.035 mm2/s (6s.d.; s.e.m.50.005 mm/
s), while the mobile fraction of complex V was characterized by
Dapp50.08260.014 mm2/s (s.d.; s.e.m.50.002 mm2/s). The
Fig. 6. Mobility of OXPHOS complexes II and V in microcompartments of the inner mitochondrial membrane. Complex II subunit SDHB and complex V
subunit-c were fused to HaloTag7H protein and covalently labeled with HTL-TMR for tracking (Appelhans et al., 2012). (A) Trajectory map of single SDH
complexes in three adjacent mitochondria. The trajectory map was superimposed on an averaged wide-field fluorescent image of the same molecules from 1000
subsequent frames recorded at 60 Hz. (B) Distribution of step lengths for individual CII molecules (1000 frames, recorded at 60 Hz, exposure time 15 ms).
Diffusion constants were determined by grading the obtained jump size histograms by a mixture model of increasing complexity. The final complexity was
validated by applying a x2-test resulting in optimal P-values and minimal residuals. (C) Trajectory map of CV-Halo/TMR in mitochondria with a significant
proportion of track courses orthogonal to the longitudinal axis of mitochondria (superimposed on an averaged image from raw data of 3000 consecutive frames
recorded at 60 Hz). (D) Step length analysis reveals three subpopulations of CV-TMR molecules: mobile (dark blue curve), less mobile (light blue curve) and
immobile molecules (red curve). (E) Selected trajectories of CV-Halo/TMR to show preferential confinement in single cristae (red, yellow). The typical shape of a
crista is depicted as a gray dotted line. The dark blue trajectory indicates free diffusion in the IBM, whereas the light blue trajectories indicate molecules that
apparently transit between CM and IBM. The mean precision for the localization of single molecules in each frame was 12 nm. (F) Apparent diffusion constants
for mobile fractions of complex II and complex V determined by analysis of jump size distributions. Mean values 6 s.e.m. n$300 mitochondria from 42 cells in
three independent preparations, and at least 30,000 trajectories. Statistical significance was proved by a two-samples t-test for null-hypothesis – means are equal
and alternative hypothesis – difference of means unequal zero.
Retarded mixing of OXPHOS complexes 111
Journ
alof
Cell
Scie
nce
diffusion coefficient of the less mobile fraction of CII was
Dapp50.03960.013 mm2/s (s.e.m.50.002 mm2/s), while it
was Dapp50.01960.007 mm2/s (s.e.m.50.001 mm2/s) for CV.
A small immobile fraction (#15%) with Dapp50.00660.001
mm2/s (CII) and 0.00460 (CV), respectively was also found.
Dual-color single molecule fluorescence microscopy
reveals piecewise composition of fused mitochondria
Single molecule fluorescence microscopy allows the localization
of single molecules with a precision of 15 nm in living cells
(Appelhans et al., 2012). We combined FPALM (Hess et al.,
2006) in combination with TALM (Appelhans et al., 2012) to
perform dual-color super-resolution imaging of OXPHOS
complexes in fused mitochondria (Fig. 7A). One OXPHOS
complex was tagged with paGFP, the second with the Halo-tag,
which was posttranslational labeled with HTL-TMR. Rendered
images (from 3000 single processed frames) show the
distribution of fluorescence-tagged OXPHOS complexes with
high resolution. Complex II-halo/TMR distribution shows a
broader signal in the cross section, which is visible as a red
border in mixed parts. These are probably the CII molecules
located in the IBM microcompartment. The green Complex I
signal is smaller in the cross section, because CI almost
exclusively is found in the cristae membranes (Fig. 2B).
Different states of fused mitochondria were found with respect
to their OXPHOS complex distribution pattern. State I
comprises mitochondria that clearly show areas in the size of
several hundreds of nanometers harboring one type of labeled
OXPHOS only, alternated by areas with OXPHOS complexes of
different origin (Fig. 7A). Right at the border between these
alternating red- and green areas, small yellow areas are visible,
indicating overlap of red- and green fluorescence signals (Fig. 7A,
yellow arrowheads). This strongly indicates colocalization of
OXPHOS complexes, probably in the same CM. In state II,
mitochondria possessed larger areas with colocalizing complexes,
sometimes in the middle of a long mitochondrion, sometimes at one
Fig. 7. States of fused mitochondria showing consecutive mixing of OXPHOS complexes and progressive homogenization is dependent on fusion and fission
cycles. Illustrated is the plausible sequence of fusion/fission events that first generate patchy mitochondria with heterogeneous distribution of OXPHOS complexes
but with time result in more and more amalgamation. (A) Fusion-and-fission-dependent redistribution of OXPHOS complexes in mitochondria in a syncytium of
fused CI-paGFP- and CII-TMR-expressing cells revealed by means of dual color super-resolution FPALM/TALM. Different states of mixing are depicted (I–III).
(B) Proposed model describing the dependence of homogenization of inner membrane OXPHOS complexes on ongoing fusion and fission events. In the early state,
mitochondria from different origins fuse successfully and completely. Because cristae are maintained and diffusion of OXPHOS complexes is restricted, exchange
OXPHOS complexes (yellow area) between cristae occurs only at the fusion sites. In an intermediate state – after few fusion and fission events – the
mitochondria appear patchy, with alternating conserved areas and areas with mixed OXPHOS composition (green, yellow and red parts). The mixing improves with
each fusion and fission cycle. On the ultrastructural level, the mixing of OXPHOS complexes progresses to the cristae level (TEM micrograph), resulting in
mitochondria consisting of cristae that retained their original state and hybrid cristae with a mixed composition. In the late state, the outcome of multiple fusion and
fission cycles is a homogeneous distribution of the OXPHOS complexes throughout the mitochondrion. Scale bar: 300 nm (A), 100 nm (B).
Journal of Cell Science 126 (1)112
Journ
alof
Cell
Scie
nce
of the ends (Fig. 7A, state II). Mitochondria with extensive areas of
homogeneous distribution of both OXPHOS complexes were alsofound, in some cases with a red or green part at one end (Fig. 7A,state III). We attribute this to a recent fusion of an original
mitochondrion to an already well mixed mitochondrion. Altogetherdual color super-resolution image analysis completed the modelobtained by distribution analysis of OXPHOS in IEM micrographsof fused cells. This method provides a higher set of single molecule
data than IEM but does not allow the direct visualization ofunderlying structures of microcompartments. Thus, single moleculefluorescence analysis has to be seen as a complementary method to
IEM.
DiscussionMitochondria fuse and divide continuously, but little is known
about the reformation of the inner mitochondrial membrane inthese processes. Heterogeneous distribution of IMM complexesin recently fused mitochondria indicates that spatiotemporal
constraints exist retarding homogeneous remixing. Here, wedissected this observation on the molecular and ultrastructurallevel by IEM and super-resolution tracking and localizationmicroscopy. First, a distribution profile for all five OXPHOS-
complexes in the different IMM compartments IBM, CJ and CMof mammalian HeLa cells was compiled. Complex I (NADH-ubiquinone-oxidoreductase), complex III (cytochrome c
reductase) and complex IV (cytochrome c oxidase) showed asimilar distribution profile along the cristae membrane. This is inline with previous observations derived from activity staining and
immunolabeling of EM sections of mitochondria (Perotti et al.,1983; Gilkerson et al., 2003; Vogel et al., 2006), whichdesignated the cristae membrane as the site of oxidative
phosphorylation.
F1FO ATP synthase was homogeneously distributed along thecristae membranes. The enrichment of F1FO ATP synthase inpositively curved membrane parts of cristae was observed before
(Parsons, 1963; Strauss et al., 2008; Bieling et al., 2010; Truta-Feles et al., 2010), and ATP synthase dimerization probably amain determinant of cristae shaping (Paumard et al., 2002; Gavin
et al., 2004; Minauro-Sanmiguel et al., 2005; Strauss et al., 2008;Davies et al., 2012). Unfortunately, the limited degree ofimmunogold labeling does not render the explicit confirmationof F1FO ATP synthase dimers possible. Beside its known
localization in positively curved membranes, the presence ofF1FO ATP synthase in negatively curved membranes such as theCJ are was rather new. Presumably, F1FO ATP synthase
complexes in the negatively curved CJ are not dimerized butexist as single, less rigid F1FO ATP synthase complexes (Rablet al., 2009). Of all five OXPHOS complexes, only F1FO ATP
synthase and complex II (succinate dehydrogenase) would fit intoa negatively curved membrane, since the intramembrane parts ofCI, CIII and CIV, are too large to be integrated in a strongly
negatively curved membrane of roughly 40 nm, especially whenassembled in supercomplexes (Althoff et al., 2011). Indeed,hardly any complex I was found in the CJ region.
After ensuring the localization of OXPHOS complexes in the
cristae microcompartment we used them as markers to resolvethe cristae reorganization during mitochondrial fusion and fissiondynamics. Distribution and localization analysis of OXPHOS by
IEM showed that fused mitochondria possess roughly one thirdtrue hybrid cristae with remixed OXPHOS composition. Themajority of cristae displayed a preserved OPXHOS composition,
though. In elongated SIMH mitochondria, the number ofidentified hybrid cristae was lower. Dual color super-resolution
images of fused mitochondria confirmed these results andunderscore a piecewise or mosaic configuration of fusedmitochondria with respect to the inner membrane composition.Together, our data suggest that cristae are maintained during
fusion and fission and hybrid cristae with mixed OXPHOScomplex distribution are only successively formed. We proposethe following working model (Fig. 7B): first, mitochondria of
different origin fuse. Whether cristae reform at the fusion sites isstill unreadable, but they are maintained in the original arms.Restricted diffusion of OXPHOS complexes supports this
preservation. Hardly, OXPHOS complexes move betweenexisting cristae. As a consequence, hybrid cristae with mixedcomposition predominantly exist at the fusion sites flanked bycristae with a preserved composition of OXPHOS complexes
(Fig. 7B, early state). After several rounds of fusion and fission amosaic mitochondrion comprising alternating preserved zones(red and green parts) and parts with mixed composition (yellow)
at the former fusion sites evolves (Fig. 7B, intermediate state). Inthe light microscope this generates the patchy appearance ofmitochondria. By time and corresponding to repetitive fusion/
fission cycles, mitochondrial heterogeneity decreases. ElongatedSIMH mitochondria possess larger patches of conserved regionsand less hybrid cristae. This can be explained when a relative
increase in fusion results in the addition of further mitochondrialmaterial without true mixing and underlines the significance ofintermediate fission events for the merging process. Only byundergoing balanced fusion/fission mitochondria progressively
reach a well-mixed state with respect to inner membrane proteindistribution (Fig. 7B, late state).
A possible alternative to explain the mosaic composition of
mitochondria is while the OMM is fused completely, the innermembrane is not (Liu et al., 2009). This would result in singularmitoplasts surrounded by a common OMM (Skulachev et al.,
2004). Our EM micrographs gave no evidence for transientfusion or mitoplasts, though. The mitochondria we investigateddisplayed normal shape and matrix appearance, and a regulararrangement of cristae with no segmentation of the IMM. We
thus exclude that incomplete inner membrane fusion is the reasonfor the mosaic appearance.
The explanation we provide here is that diffusion and thus
spreading of OXPHOS complexes in the IMM microcompartmentsis restricted. Single particle trajectory analysis revealed thatcomplex V particles showed confined diffusion in cristae
membranes and punctual immobility (supplementary materialFig. S6B, box), while transitions between the CM and IBM or CMand CM compartments were only rarely observed. It was for longer
suggested that cristae junctions are diffusion barriers (Sukhorukovand Bereiter-Hahn, 2009), a discussion that recently found supportby the finding that a large protein complex exists in the CJ region(Harner et al., 2011; Hoppins et al., 2011; von der Malsburg et al.,
2011; Alkhaja et al., 2012). It is likely that this MINOS/MitOScomplex with a size of ,1200 kDa constitutes a diffusion barrierfor the transition of proteins between the CM and IBM
microcompartment.
How supercomplex formation influences diffusibility ofOXPHOS complexes, is not clear, yet. OXPHOS complexes I,
III and IV assemble in supercomplexes of different stoichiometry(Schagger and Pfeiffer, 2000; Eubel et al., 2004; Dudkina et al.,2005; Schafer et al., 2006; Wittig et al., 2006; Althoff et al.,
Retarded mixing of OXPHOS complexes 113
Journ
alof
Cell
Scie
nce
2011), while dimers of F1F0 ATP synthase often organize in row
like structures in cristae membranes (Davies et al., 2011).
According to the Saffman-Delbruck model, the translational
mobility is independent of the amount by which the particle
sticks out of the membrane sheet (Saffman and Delbruck, 1975)
and diffusion coefficients of membrane domains are only
logarithmically related to domain radii suggesting little
influence (Petrov and Schwille, 2008). In the future, diffusion
analysis of single membrane proteins and complexes hopefully
will help to elucidate these relations further.
Localization and mobility analysis of succinate dehydrogenase
(complex II) revealed its exceptional role within the OXPHOS
complex ensemble. Complex II has a dual role in mitochondria: it
is part of the OXPHOS system, but is also a key membrane
complex of the citric acid cycle. Complex II does not translocate
protons and thus not necessarily need to be confined to cristae.
Indeed, a substantial amount of molecules were found within the
IBM microcompartment in line with previous results showing a
strong activity staining in this membrane part (Kalina et al., 1969;
Bertoni-Freddari et al., 2001). Mobility of CII was significantly
higher than of complex V and thus the mixing of OXPHOS
complexes with complex II was best. This finding endorses our
model that the homogeneity of dynamic mitochondria is
determined and limited by the diffusion ability of inner
membrane proteins.
Following this, the described heterogeneous spatiotemporal
organization of OXPHOS complexes – trapped in the cristae
microcompartment – provides an explanation for mitochondrial
heterogeneity. Therefore, zones of different membrane potential
within single mitochondria (Bereiter-Hahn and Voeth, 1998;
Collins et al., 2002; Distelmaier et al., 2008; Wikstrom et al.,
2009) could be assigned to local accumulation of functional
compromised OXPHOS complexes that are not or only slowly
exchanged by remixing. For the future, it would be exciting to
identify and characterize these zones more precisely and correlate
local membrane potential with the actual distribution and
functionality of the present OXPHOS complexes.
Materials and MethodsGeneration of fluorescent proteins
The different fluorescent fusion proteins were generated using plasmid cassettes
obtained by substitutions of eGFPm or DsRed–HA into pSEMS-26 m vector fromNEB biosciencesH. Indicated subunits of OXPHOS complexes were N-terminallyfused to fluorescent proteins with monomeric DsRed–HA and monomeric eGFP
(DsRed amplified from pDsRed-Monomer-N1 vector from HBD biosciencesH;modified monomeric eGFP, a gift from J. Sieber, Gottingen), as described by
Muster et al. (Muster et al., 2010). For genetic selection of double transfected cellsthe neomycin resistance was exchanged for a puromycin resistance in one type ofvector. For tracking experiments, respective subunits were cloned N-terminally of
the HaloTag7 in the pSEMS-26m-HaloTag7 vector (Lisse et al., 2011). CII-Haloand CV-Halo were then covalently labeled in situ with 1 nM HTL-TMR (HaloTag
conjugated with tetramethylrhodamine ligand) for 20 min. Before measurements,the labeling medium was replaced by medium without HTL-TMR.
Cell culture
HeLa cells were cultured in Minimal Essential Medium with Earle’s salts (PAA
1-ethanesulfonic acid (HEPES, PAA Lab GmbH) (MEM++) at 37 C with 5% CO2.The cells were transfected with the plasmids described in the text using the methodof Muster et al. (Muster et al., 2010). Neomycin (800 mg/ml G418) and puromycin
(0.5 mg/ml) resistance were used for selection of stable cell lines. Hyperfusion wasinduced by starvation stress 30 min after PEG-mediated fusion. After incubation
for 2 h in PBS, cells were prepared for IEM. Longer incubation times with PBSturned out to be too stressful for cells.
Cell fusion and co-transfection
For the fusion assays, stable expressing cells (CI-eGFPm and CIII-DsRed; CI-eGFPm and CV-DsRed; CI-DsRed–HA and CIII-eGFPm) were sown on 6 cmdiameter Petri dishes and co-cultured for 24 h. For fusion, the cells were incubatedwith prewarmed 40% PEG in PBS (37 C) for 1 min. Afterwards, cells werecultured in medium for 4–7 h before microscopic analysis.
For co-transfection assays, cells stable expressing CI-DsRed–HA and CIII-eGFPm were generated. Cells stable expressing CI-DsRed–HA were transientlytransfected with CII-eGFPm and cells stable expressing CI-pa-eGFPm weretransiently transfected with CIV-DsRed–HA.
Confocal laser scanning microscopy
Mixing of OXPHOS in fused cells was followed using an Olympus Fluoview FV1000cLSM equipped with a 606 objective (UPLSAPO oil, NA 1.35) and two spectraldetectors. DsRed was excited with a 559 nm laser diode and emission was recorded inthe range of 580–630 nm, eGFP was excited with the 488 nm wavelength of an argonion laser and emission was collected in the range of 500–560 nm. Measurements wereperformed in a sequential excitation mode to avoid cross-talk. Z-stacks ofmitochondria were taken in certain region of interests (12612 mm2), with a pixelsize corresponding to 30 nm.
Immunoelectron microscopy
Cells were prepared according to previously described methods (Tokuyasu, 1978;Tokuyasu, 1973; Oorschot et al., 2002). In short, cells were fixed with 2%paraformaldehyde and 0.2% glutaraldehyde in 0.1 M phosphate buffer (pH 7.4) atroom temperature, embedded as monolayer or pellet in 10% gelatin, mounted onpins, frozen in liquid nitrogen and cut at 2120 C (Leica UCT). Grids were washedwith PBS, 20 mM glycine in PBS, blocked with 1% BSA in PBS, incubated withthe primary antibodies against eGFPm (rabbit polyclonal to eGFPm, Abcam,ab6556, 1:100) and HA (mouse monoclonal to HA.11, Covance, BIOT-101L,1:100) for 1 h at room temperature, washed with 0.1% BSA in PBS and incubatedwith the secondary antibody-gold-complexes (6 nm goat anti-mouse and 12 nmgoat anti-rabbit, Jackson Immuno Research, 1:50, no. 115-195-146 and 111-205-144; 20 nm goat anti-mouse, Abcam, ab27242, 1:50). Cells were stained in amixture of 1.6% methylcellulose/0.4% uranyl acetate, and analyzed usingtransmission electron microscopy (TEM; Zeiss 902A).
Image processing
Images were processed with HBitplane Imaris and ImageJH (NIH, Bethesda, MD,USA). The datasets were deconvolved using Autoquant software to reduce noiseand improve image quality. A stack of 1000 images recording single moleculeswas collected and averaged to create the equivalent of an epi-fluorescence image.Single trajectories were projected on this pseudo-average image.
TEM micrographs were recorded using iTEM software (SIS). The images wereprocessed afterwards in Adobe Photoshop CS4, making linear adjustments tocontrast and brightness. Adobe Photoshop CS4 was also used to color the originalmicrographs subsequently. To outline single cristae we used a Wacom IntuosH4drawing tablet. All figures were assembled in Adobe Illustrator CS4 and convertedinto TIFF using LZW compression.
Quantitative analysis
To dissect the distribution of OXPHOS complexes in the IMM a representativemodel of a crista was generated as described (Vogel et al., 2006). The dimensionsof this model were obtained by averaging 141 cristae in cryosectioned HeLa cells.The cristae dimensions and the distances of the gold particles to the membraneswere measured with iTEM (SIS) and superimposed to the immunogold-labeledcristae (digitalized by Adobe Photoshop CS4 and Adobe Illustrator CS4). Themeasured distances represent the absolute values of 160 gold particles of eachantigen that were plotted to this model. Particles close to badly preservedmembranes, those bound to large cristae more than 450 nm distal from the cristaejunction or particles which could not be assigned to a membrane within a space of60 nm radius around a membrane were not counted. The specific, labeled subunitsof the different OXPHOS complexes required the adaptation of a radius oftolerance in which a gold particle was assigned to the membrane. This wasconsidered for plotting the distribution ratio diagram of localization between OM/IBM, CM and matrix space. The specific distances of the labeled subunits to themembrane for each of the five complexes were determined according to formerpublished structures (Efremov et al., 2010; Yoshikawa et al., 1998; Zhang et al.,1998; Sun et al., 2005; Watt et al., 2010). Box-and-whisker plot analyses wereperformed for each of the complexes using Microsoft Office Excel software(Microsoft Corporation, Redmond, WA, USA) and Microcal Origin 6.0 software(OriginLab Corporation, Northampton, MA, USA). Statistical significance wasperformed on original data and determined by one-way-ANOVA with MicrocalOrigin 6.0 software (OriginLab Corporation, Northampton, MA, USA). Analysisof the mixing degree in fused and coexpressing cells was performed by thedetermination of the distances of differently sized antibodies in single hybridcristae. To compare the mixing in normally fused and SIMH mitochondria, a
Journal of Cell Science 126 (1)114
Journ
alof
Cell
Scie
nce
nearest neighbor analysis was performed because although the degree of labelingin the normal and SIMH specimen was comparable the overall number of hybridcristae in SIMH cells was low. Thus, an analysis of distances between differentlabels within one hybrid cristae was limited by the number of hybrid cristae. Forthe analysis of the relative and absolute distribution of CV alongside cristae,approximately the same set of raw images was used. Starting from the IBM region,the true positions (in shorter and longer cristae) were recalculated to thecorresponding position in an average crista (20% distal from CJ in actual cristae isequal to 20% distal from CJ in the average crista).
Single molecule tracking and localization microscopy
For single molecule (SM) recording, an inverse microscope (IX71, Olympus)equipped with a TIRF condenser (Olympus), and a back-illuminated EMCCDcamera (Andor iXON 897) was used. For excitation of TMR, a solid state laser(561 nm, 200 mW; CrystaLaser) was focused onto 700 mm multi-mode-opticalpolarization maintaining monomode fiber (KineFlex, Pointsource) and transmittedvia the rear illumination port of the microscope. For excitation, the HiLo mode(illumination with a highly inclined and thin beam) was used (Tokunaga et al.,2008). By this, the signal to background ratio can be significantly improved. Theestimated intensity in the thin light sheet with a thickness of 9 mm was 2568 kW/cm2 (561 nm, 200 mW, CrystaLaser). A digitally synchronized mechanical shuttercontrolled exposure times. Laser light reflected from a dichroic mirror (OBS-U-M3TIR 405/488/561, Semrock) passed through a high-numerical apertureobjective (1506 TIRF objective NA 1.45, Olympus, UAPO). Fluorescenceemission from TMR was passed through a bandpass filter (Semrock BrightLineFF01-523/610-25), and was projected on top a back-illuminated EMCCD camerayielding an image pixel size of 107 nm. Equivalent fiber and condenser equipmentwas used for coupling the 488 nm laser line of a Saphire laser (200 mW, Coherent)for paGFP visualization into the system. The photoactivation of paGFP by therecording 488 nm laser line was sufficient and activation by 405 nm pre-excitationwas not necessary. The camera was operated continuously using the FrameTransfer Mode of the CCD allowing full-frame acquisition at 60 Hz. Forlocalization of single emitters, a modified 2D Gaussian mask for approximationwas used (Thompson et al., 2002; Gould et al., 2009). Single molecules weretracked using the multiple-target tracing algorithm (Serge et al., 2008). Multipledeflation loops were performed to ensure identification of all particles. Particletrajectories were recovered based on maximum likelihood estimators (Serge et al.,2008). For more details see Appelhans et al. (Appelhans et al., 2012).
In dual color super-resolution experiments a combination of fluorescent paGFPand Halo/TMR was used as described recently (Appelhans et al., 2012; Wilmeset al., 2012). paGFP and TMR were excited in parallel allowing a recording rate of30 Hz. Up to 3000 frames were recorded. Fluorescence emissions from paGFP andTMR were passed through a bandpass filter (Semrock BrightLine FF01-523/610-25). The dual view (Photometrics) was equipped with an according dichroid mirrorand filters (Chroma 585 DCXR; HQ 525/50; brightline HC 620/52). Possiblecrosstalk signals of paGFP signals in the TMR channel were erased by a renderingprocedure after single molecule localization allowing only signal intensities abovea certain threshold (usually 100 counts). The count to photon conversion factor was20.5 under our conditions (gain 300, 1506objective/oil, 1.45 NA, 16). For singlemolecule localization a 2D fitting algorithm (kindly provided by Sam T. Hess,University of Maine, Orono, ME) was used (Gould et al., 2009).
AcknowledgementsWe thank Achim Paululat and Jacob Piehler for continuous support,Dirk Wenzel for initial technical advice and Christian Ungermannfor critically reading the manuscript.
FundingThe study was supported by the Deutsche Forschungsgemeinschaft[grant number Bu 2288/1 to K.B.B.] and a SFB 944 grant to K.B.B.
ReferencesAlkhaja, A. K., Jans, D. C., Nikolov, M., Vukotic, M., Lytovchenko, O., Ludewig, F.,
Schliebs, W., Riedel, D., Urlaub, H., Jakobs, S. et al. (2012). MINOS1 is a
conserved component of mitofilin complexes and required for mitochondrial function
and cristae organization. Mol. Biol. Cell 23, 247-257.
Althoff, T., Mills, D. J., Popot, J. L. and Kuhlbrandt, W. (2011). Arrangement of
electron transport chain components in bovine mitochondrial supercomplex
I1III2IV1. EMBO J. 30, 4652-4664.
Appelhans, T., Richter, C. P., Wilkens, V., Hess, S. T., Piehler, J. and Busch, K. B.
(2012). Nanoscale organization of mitochondrial microcompartments revealed by
combining tracking and localization microscopy. Nano Lett. 12, 610-616.
Arimura, S., Yamamoto, J., Aida, G. P., Nakazono, M. and Tsutsumi, N. (2004).Frequent fusion and fission of plant mitochondria with unequal nucleoid distribution.Proc. Natl. Acad. Sci. USA 101, 7805-7808.
Arnold, I. and Langer, T. (2002). Membrane protein degradation by AAA proteases inmitochondria. Biochim. Biophys. Acta 1592, 89-96.
Beal, M. F. (2005). Mitochondria take center stage in aging and neurodegeneration. Ann.
Neurol. 58, 495-505.
Bereiter-Hahn, J. and Jendrach, M. (2010). Mitochondrial dynamics. Int. Rev. Cell
Mol. Biol. 284, 1-65.
Bereiter-Hahn, J. and Voeth, M. (1998). Do single mitochondria contain zones withdifferent membrane potential? Exp. Biol. Online 3, 1-13. doi: 10.1007/s00898-998-0012-4
Bereiter-Hahn, J. and Voth, M. (1994). Dynamics of mitochondria in living cells:shape changes, dislocations, fusion, and fission of mitochondria. Microsc. Res. Tech.
27, 198-219.
Bertoni-Freddari, C., Fattoretti, P., Casoli, T., Di Stefano, G., Solazzi, M. and
Meier-Ruge, W. (2001). Quantitative cytochemical mapping of mitochondrialenzymes in rat cerebella. Micron 32, 405-410.
Bieling, P., Telley, I. A., Hentrich, C., Piehler, J. and Surrey, T. (2010). Fluorescencemicroscopy assays on chemically functionalized surfaces for quantitative imaging ofmicrotubule, motor, and +TIP dynamics. Methods Cell Biol. 95, 555-580.
Busch, K. B., Bereiter-Hahn, J., Wittig, I., Schagger, H. and Jendrach, M. (2006).Mitochondrial dynamics generate equal distribution but patchwork localization ofrespiratory Complex I. Mol. Membr. Biol. 23, 509-520.
Campello, S. and Scorrano, L. (2010). Mitochondrial shape changes: orchestrating cellpathophysiology. EMBO Rep. 11, 678-684.
Collins, T. J., Berridge, M. J., Lipp, P. and Bootman, M. D. (2002). Mitochondria aremorphologically and functionally heterogeneous within cells. EMBO J. 21, 1616-1627.
Davies, K. M., Strauss, M., Daum, B., Kief, J. H., Osiewacz, H. D., Rycovska, A.,
Zickermann, V. and Kuhlbrandt, W. (2011). Macromolecular organization of ATPsynthase and complex I in whole mitochondria. Proc. Natl. Acad. Sci. USA 108,14121-14126.
Davies, K. M., Anselmi, C., Wittig, I., Faraldo-Gomez, J. D. and Kuhlbrandt, W.(2012). Structure of the yeast F1Fo-ATP synthase dimer and its role in shaping themitochondrial cristae. Proc. Natl. Acad. Sci. USA 109, 13602-13607.
Distelmaier, F., Koopman, W. J., Testa, E. R., de Jong, A. S., Swarts, H. G.,
Mayatepek, E., Smeitink, J. A. and Willems, P. H. (2008). Life cell quantificationof mitochondrial membrane potential at the single organelle level. Cytometry A 73,129-138.
Dudkina, N. V., Eubel, H., Keegstra, W., Boekema, E. J. and Braun, H. P. (2005).Structure of a mitochondrial supercomplex formed by respiratory-chain complexes Iand III. Proc. Natl. Acad. Sci. USA 102, 3225-3229.
Efremov, R. G., Baradaran, R. and Sazanov, L. A. (2010). The architecture ofrespiratory complex I. Nature 465, 441-445.
Eubel, H., Heinemeyer, J. and Braun, H. P. (2004). Identification and characterizationof respirasomes in potato mitochondria. Plant Physiol. 134, 1450-1459.
Frezza, C., Cipolat, S., Martins de Brito, O., Micaroni, M., Beznoussenko, G. V.,
Rudka, T., Bartoli, D., Polishuck, R. S., Danial, N. N., De Strooper, B. et al. (2006).OPA1 controls apoptotic cristae remodeling independently from mitochondrial fusion.Cell 126, 177-189.
Gavin, P. D., Prescott, M., Luff, S. E. and Devenish, R. J. (2004). Cross-linking ATPsynthase complexes in vivo eliminates mitochondrial cristae. J. Cell Sci. 117, 2333-2343.
Gilkerson, R. W., Selker, J. M. and Capaldi, R. A. (2003). The cristal membrane ofmitochondria is the principal site of oxidative phosphorylation. FEBS Lett. 546, 355-358.
Gomes, L. C., Di Benedetto, G. and Scorrano, L. (2011). During autophagymitochondria elongate, are spared from degradation and sustain cell viability. Nat.
Cell Biol. 13, 589-598.
Gould, T. J., Verkhusha, V. V. and Hess, S. T. (2009). Imaging biological structureswith fluorescence photoactivation localization microscopy. Nat. Protoc. 4, 291-308.
Harmon, H. J., Hall, J. D. and Crane, F. L. (1974). Structure of mitochondrial cristaemembranes. Biochim. Biophys. Acta 344, 119-155.
Harner, M., Korner, C., Walther, D., Mokranjac, D., Kaesmacher, J., Welsch, U.,Griffith, J., Mann, M., Reggiori, F. and Neupert, W. (2011). The mitochondrialcontact site complex, a determinant of mitochondrial architecture. EMBO J. 30, 4356-4370.
Hess, S. T., Girirajan, T. P. and Mason, M. D. (2006). Ultra-high resolution imagingby fluorescence photoactivation localization microscopy. Biophys. J. 91, 4258-4272.
Hoppins, S., Collins, S. R., Cassidy-Stone, A., Hummel, E., Devay, R. M., Lackner,
L. L., Westermann, B., Schuldiner, M., Weissman, J. S. and Nunnari, J. (2011). Amitochondrial-focused genetic interaction map reveals a scaffold-like complexrequired for inner membrane organization in mitochondria. J. Cell Biol. 195, 323-340.
Ishihara, N., Jofuku, A., Eura, Y. and Mihara, K. (2003). Regulation of mitochondrialmorphology by membrane potential, and DRP1-dependent division and FZO1-dependent fusion reaction in mammalian cells. Biochem. Biophys. Res. Commun. 301,891-898.
James, D. I., Parone, P. A., Mattenberger, Y. and Martinou, J. C. (2003). hFis1, anovel component of the mammalian mitochondrial fission machinery. J. Biol. Chem.
278, 36373-36379.
Kalina, M., Weavers, B. and Pearse, A. G. (1969). Fine structural localization ofsuccinoxidase complex on the mitochondrial cristae. Nature 221, 479-480.
Kurz, T., Terman, A., Gustafsson, B. and Brunk, U. T. (2008). Lysosomes andoxidative stress in aging and apoptosis. Biochim. Biophys. Acta 1780, 1291-1303.
Lisse, D., Wilkens, V., You, C., Busch, K. and Piehler, J. (2011). Selective targetingof fluorescent nanoparticles to proteins inside live cells. Angew. Chem. Int. Ed. Engl.
50, 9352-9355.Liu, X., Weaver, D., Shirihai, O. and Hajnoczky, G. (2009). Mitochondrial ‘kiss-and-
run’: interplay between mitochondrial motility and fusion-fission dynamics. EMBO J.
28, 3074-3089.Lu, B. (2009). Mitochondrial dynamics and neurodegeneration. Curr. Neurol. Neurosci.
Rep. 9, 212-219.Mai, S., Klinkenberg, M., Auburger, G., Bereiter-Hahn, J. and Jendrach, M. (2010).
Decreased expression of Drp1 and Fis1 mediates mitochondrial elongation insenescent cells and enhances resistance to oxidative stress through PINK1. J. Cell Sci.
123, 917-926.Malka, F., Guillery, O., Cifuentes-Diaz, C., Guillou, E., Belenguer, P., Lombes, A.
and Rojo, M. (2005). Separate fusion of outer and inner mitochondrial membranes.EMBO Rep. 6, 853-859.
Mannella, C. A., Marko, M., Penczek, P., Barnard, D. and Frank, J. (1994). Theinternal compartmentation of rat-liver mitochondria: tomographic study using thehigh-voltage transmission electron microscope. Microsc. Res. Tech. 27, 278-283.
Minauro-Sanmiguel, F., Wilkens, S. and Garcıa, J. J. (2005). Structure of dimericmitochondrial ATP synthase: novel F0 bridging features and the structural basis ofmitochondrial cristae biogenesis. Proc. Natl. Acad. Sci. USA 102, 12356-12358.
Mouli, P. K., Twig, G. and Shirihai, O. S. (2009). Frequency and selectivity ofmitochondrial fusion are key to its quality maintenance function. Biophys. J. 96,3509-3518.
Muster, B., Kohl, W., Wittig, I., Strecker, V., Joos, F., Haase, W., Bereiter-Hahn, J.and Busch, K. (2010). Respiratory chain complexes in dynamic mitochondria displaya patchy distribution in life cells. PLoS ONE 5, e11910.
Nakada, K., Inoue, K. and Hayashi, J. (2001). Interaction theory of mammalianmitochondria. Biochem. Biophys. Res. Commun. 288, 743-746.
Ono, T., Isobe, K., Nakada, K. and Hayashi, J. I. (2001). Human cells are protectedfrom mitochondrial dysfunction by complementation of DNA products in fusedmitochondria. Nat. Genet. 28, 272-275.
Oorschot, V., de Wit, H., Annaert, W. G. and Klumperman, J. (2002). A novel flat-embedding method to prepare ultrathin cryosections from cultured cells in their in situorientation. J. Histochem. Cytochem. 50, 1067-1080.
Parsons, D. F. (1963). Mitochondrial structure: two types of subunits on negativelystained mitochondrial membranes. Science 140, 985-987.
Paumard, P., Vaillier, J., Coulary, B., Schaeffer, J., Soubannier, V., Mueller, D. M.,Brethes, D., di Rago, J. P. and Velours, J. (2002). The ATP synthase is involved ingenerating mitochondrial cristae morphology. EMBO J. 21, 221-230.
Perkins, G. A., Tjong, J., Brown, J. M., Poquiz, P. H., Scott, R. T., Kolson, D. R.,
Ellisman, M. H. and Spirou, G. A. (2010). The micro-architecture of mitochondriaat active zones: electron tomography reveals novel anchoring scaffolds and cristaestructured for high-rate metabolism. J. Neurosci. 30, 1015-1026.
Perotti, M. E., Anderson, W. A. and Swift, H. (1983). Quantitative cytochemistry ofthe diaminobenzidine cytochrome oxidase reaction product in mitochondria of cardiacmuscle and pancreas. J. Histochem. Cytochem. 31, 351-365.
Petrov, E. P. and Schwille, P. (2008). Translational diffusion in lipid membranesbeyond the Saffman-Delbruck approximation. Biophys. J. 94, L41-L43.
Rabl, R., Soubannier, V., Scholz, R., Vogel, F., Mendl, N., Vasiljev-Neumeyer, A.,Korner, C., Jagasia, R., Keil, T., Baumeister, W. et al. (2009). Formation of cristaeand crista junctions in mitochondria depends on antagonism between Fcj1 and Su e/g.J. Cell Biol. 185, 1047-1063.
Rambold, A. S., Kostelecky, B. and Lippincott-Schwartz, J. (2011). Together we arestronger: fusion protects mitochondria from autophagosomal degradation. Autophagy
7, 1568-1569.Saffman, P. G. and Delbruck, M. (1975). Brownian motion in biological membranes.
Proc. Natl. Acad. Sci. USA 72, 3111-3113.Schafer, E., Seelert, H., Reifschneider, N. H., Krause, F., Dencher, N. A. and Vonck,
J. (2006). Architecture of active mammalian respiratory chain supercomplexes.J. Biol. Chem. 281, 15370-15375.
Schagger, H. and Pfeiffer, K. (2000). Supercomplexes in the respiratory chains of yeastand mammalian mitochondria. EMBO J. 19, 1777-1783.
Scherz-Shouval, R. and Elazar, Z. (2007). ROS, mitochondria and the regulation ofautophagy. Trends Cell Biol. 17, 422-427.
Serge, A., Bertaux, N., Rigneault, H. and Marguet, D. (2008). Dynamic multiple-target tracing to probe spatiotemporal cartography of cell membranes. Nat. Methods
5, 687-694.
Skulachev, V. P., Bakeeva, L. E., Chernyak, B. V., Domnina, L. V., Minin, A. A.,Pletjushkina, O. Y., Saprunova, V. B., Skulachev, I. V., Tsyplenkova, V. G.,
Vasiliev, J. M. et al. (2004). Thread-grain transition of mitochondrial reticulum as astep of mitoptosis and apoptosis. Mol. Cell. Biochem. 256-257, 341-358.
Strauss, M., Hofhaus, G., Schroder, R. R. and Kuhlbrandt, W. (2008). Dimer ribbonsof ATP synthase shape the inner mitochondrial membrane. EMBO J. 27, 1154-1160.
Sukhorukov, V. M. and Bereiter-Hahn, J. (2009). Anomalous diffusion induced bycristae geometry in the inner mitochondrial membrane. PLoS ONE 4, e4604.
Sukhorukov, V. M., Dikov, D., Busch, K., Strecker, V., Wittig, I. and Bereiter-
Hahn, J. (2010). Determination of protein mobility in mitochondrial membranes ofliving cells. Biochim. Biophys. Acta 1798, 2022-2032.
Sun, F., Huo, X., Zhai, Y., Wang, A., Xu, J., Su, D., Bartlam, M. and Rao, Z. (2005).Crystal structure of mitochondrial respiratory membrane protein complex II. Cell 121,1043-1057.
Thompson, R. E., Larson, D. R. and Webb, W. W. (2002). Precise nanometerlocalization analysis for individual fluorescent probes. Biophys. J. 82, 2775-2783.
Tokunaga, M., Imamoto, N. and Sakata-Sogawa, K. (2008). Highly inclined thinillumination enables clear single-molecule imaging in cells. Nat. Methods 5, 159-161.
Tokuyasu, K. T. (1973). A technique for ultracryotomy of cell suspensions and tissues.J. Cell Biol. 57, 551-565.
Tokuyasu, K. T. (1978). A study of positive staining of ultrathin frozen sections.J. Ultrastruct. Res. 63, 287-307.
Tondera, D., Grandemange, S., Jourdain, A., Karbowski, M., Mattenberger, Y.,Herzig, S., Da Cruz, S., Clerc, P., Raschke, I., Merkwirth, C. et al. (2009). SLP-2is required for stress-induced mitochondrial hyperfusion. EMBO J. 28, 1589-1600.
Truta-Feles, K., Lagadari, M., Lehmann, K., Berod, L., Cubillos, S., Piehler, S.,
Herouy, Y., Barz, D., Kamradt, T., Maghazachi, A. et al. (2010). Histaminemodulates cd-T lymphocyte migration and cytotoxicity, via Gi and Gs protein-coupled signalling pathways. Br. J. Pharmacol. 161, 1291-1300.
Twig, G., Graf, S. A., Wikstrom, J. D., Mohamed, H., Haigh, S. E., Elorza, A., Deutsch,M., Zurgil, N., Reynolds, N. and Shirihai, O. S. (2006). Tagging and trackingindividual networks within a complex mitochondrial web with photoactivatable GFP.Am. J. Physiol. Cell Physiol. 291, C176-C184.
Twig, G., Hyde, B. and Shirihai, O. S. (2008). Mitochondrial fusion, fission andautophagy as a quality control axis: the bioenergetic view. Biochim. Biophys. Acta
1777, 1092-1097.Vogel, F., Bornhovd, C., Neupert, W. and Reichert, A. S. (2006). Dynamic
subcompartmentalization of the mitochondrial inner membrane. J. Cell Biol. 175,237-247.
von der Malsburg, K., Muller, J. M., Bohnert, M., Oeljeklaus, S., Kwiatkowska, P.,Becker, T., Loniewska-Lwowska, A., Wiese, S., Rao, S., Milenkovic, D. et al.
(2011). Dual role of mitofilin in mitochondrial membrane organization and proteinbiogenesis. Dev. Cell 21, 694-707.
Watt, I. N., Montgomery, M. G., Runswick, M. J., Leslie, A. G. and Walker, J. E.(2010). Bioenergetic cost of making an adenosine triphosphate molecule in animalmitochondria. Proc. Natl. Acad. Sci. USA 107, 16823-16827.
Wikstrom, J. D., Twig, G. and Shirihai, O. S. (2009). What can mitochondrialheterogeneity tell us about mitochondrial dynamics and autophagy? Int. J. Biochem.
Cell Biol. 41, 1914-1927.Wilmes, S., Staufenbiel, M., Lisse, D., Richter, C. P., Beutel, O., Busch, K. B., Hess,
S. T. and Piehler, J. (2012). Triple-color super-resolution imaging of live cells:resolving submicroscopic receptor organization in the plasma membrane. Angew.
Chem. Int. Ed. Engl. 51, 4868-4871.Wittig, I., Carrozzo, R., Santorelli, F. M. and Schagger, H. (2006). Supercomplexes
and subcomplexes of mitochondrial oxidative phosphorylation. Biochim. Biophys.
Acta 1757, 1066-1072.Wurm, C. A., Neumann, D., Lauterbach, M. A., Harke, B., Egner, A., Hell, S. W.
and Jakobs, S. (2011). Nanoscale distribution of mitochondrial import receptorTom20 is adjusted to cellular conditions and exhibits an inner-cellular gradient. Proc.
Natl. Acad. Sci. USA 108, 13546-13551.Yoon, Y., Krueger, E. W., Oswald, B. J. and McNiven, M. A. (2003). The
mitochondrial protein hFis1 regulates mitochondrial fission in mammalian cellsthrough an interaction with the dynamin-like protein DLP1. Mol. Cell. Biol. 23, 5409-5420.
Yoshikawa, S., Shinzawa-Itoh, K. and Tsukihara, T. (1998). Crystal structure ofbovine heart cytochrome c oxidase at 2.8 A resolution. J. Bioenerg. Biomembr. 30, 7-14.
Zhang, Z., Huang, L., Shulmeister, V. M., Chi, Y. I., Kim, K. K., Hung, L. W.,Crofts, A. R., Berry, E. A. and Kim, S. H. (1998). Electron transfer by domainmovement in cytochrome bc1. Nature 392, 677-684.