RESTRICTED I +RT, ^ ReportNo. TO-629a \ WlTtQli ONE WEEK This report was prepared for use within the Bank and its affiliated organizations. They do not accept responsibility for its accuracy or completeness. The report may not be published nor may it be quoted as representing their views. INTERNATIONAL BANK FOR RECONSTRUCTION AND DEVELOPMENT INTERNATIONAL DEVELOPMENT ASSOCIATION APPRAISAL OF THE DISTRIBUTION EXPANSION AND DEVELOPMENT PROGRAM OF THE ELECTRICITY CORPORATION OF GHANA GHANA May 27, 1968 Projects Department Public Disclosure Authorized Public Disclosure Authorized Public Disclosure Authorized Public Disclosure Authorized
Transcript
RESTRICTED
I +RT, ^ Report No. TO-629a
\ WlTtQliONE WEEK
This report was prepared for use within the Bank and its affiliated organizations.They do not accept responsibility for its accuracy or completeness. The report maynot be published nor may it be quoted as representing their views.
INTERNATIONAL BANK FOR RECONSTRUCTION AND DEVELOPMENT
INTERNATIONAL DEVELOPMENT ASSOCIATION
APPRAISAL OF THE DISTRIBUTION EXPANSION AND
DEVELOPMENT PROGRAM OF
THE ELECTRICITY CORPORATION OF GHANA
GHANA
May 27, 1968
Projects Department
Pub
lic D
iscl
osur
e A
utho
rized
Pub
lic D
iscl
osur
e A
utho
rized
Pub
lic D
iscl
osur
e A
utho
rized
Pub
lic D
iscl
osur
e A
utho
rized
CURRENCY EQUIVALENTS
One New Cedi (N¢) = 100 New Pesewa (NP)One New Cedi (N(t) = US$0. 98One US$ dollar (US $) = N¢1. 02One million New Cedi (N¢) = US$980, 000
MEASURES EQUIVALENTS
One megawatt (MW) = 1, 000 kilowattsOne gigawatt hour (GWh) = 1 million kilowatt hours
ECG's Financial Year = Calender Year
GHANA
APPRAISAL OF THE DISTRIBUTION EXPANSION AND
DEVELOP NENT PROGRAM OF
THE ELECTRICITY CORPORATION OF GHANA
TABLE OF CONTENTSPage No.
SUMMARY i
1. INTRODUCTION 1
2. THE BORROIJER 1
3. ELECTRIC POWER IN GHANA 2
4. THE ELECTRICITY CORPORATION OF GHANA 3
Organization and Management 4Consultants 5Present Facilities of ECG 5
5. THE POWER IARKET 6
Purchases, Generation and Losses 7
6. THE PROGRAM4 8
Distribution System Improvements 833/11 kv Overhead Lines 8Miscellaneous Low Tension Projects andHouse Connecting Materials 9
New Diesel Generating Stations andDistribution Systems 9
Four Small Substations 9Cost Estimate 9
7. THE CREDIT 10
Cost Estimate 11Procurement and Disbursement 12Construction Schedule 13
8. JUSTIFICATION 13
(contd.)
This report is based on the findings of missions to Ghana in Apriland September of 1967 by Messrs. E.A. Minnig, A.A. Raizen and D.W. Vollmer.
1/1 Availability of Volta River Power - Minimum Smelter Load, 1967-19801/2 Availability of Volta River Power - Maximum Smelter Load, 1967-19801/3 Generation, Sales and laximum Demand, 1961-1972
2/1&2 Basis for Sales Forecast2/3 Energy Sales, 1961-1972
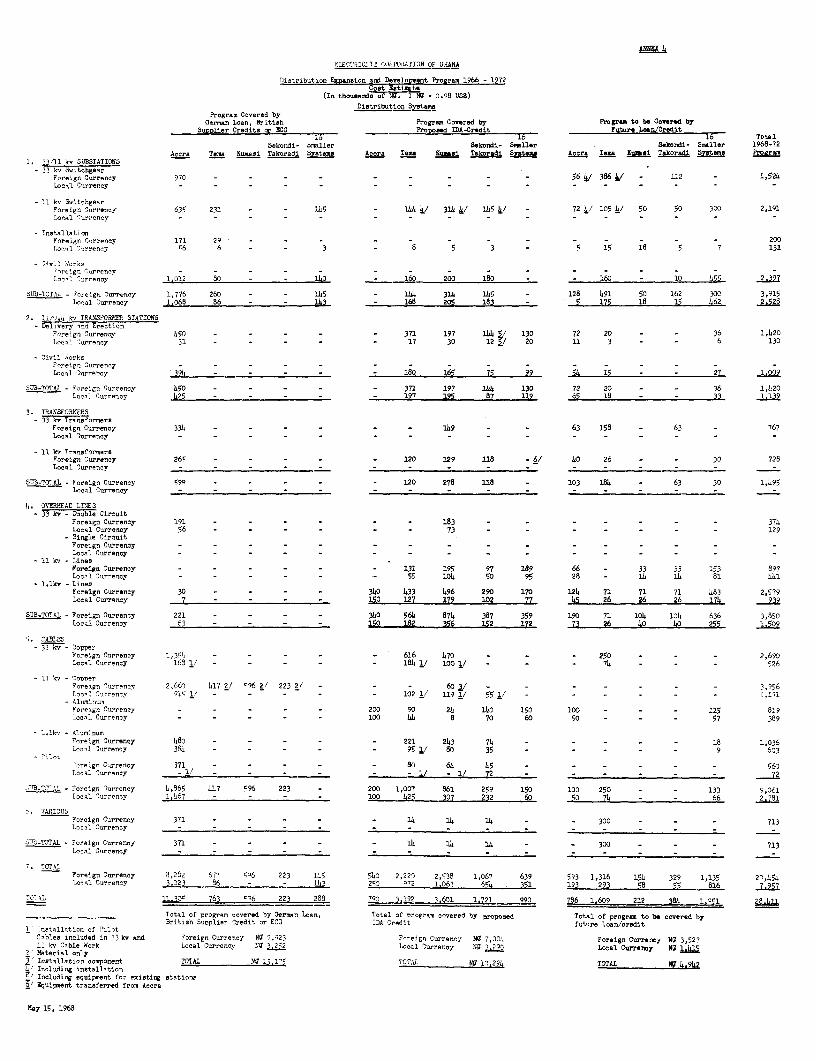
3 List of Quantities, Distribution Systems, 1966-1972
4 Cost Estimate, Distribution Systems, 1966-1972
5 Transmission Lines Included in Distribution Expansion andDevelopment Program,1966-1972
6 Summary Cost Estimate, 1966-1972
7 Description of Tariff Schedule
B i?evenue Statistics, 1961-1972
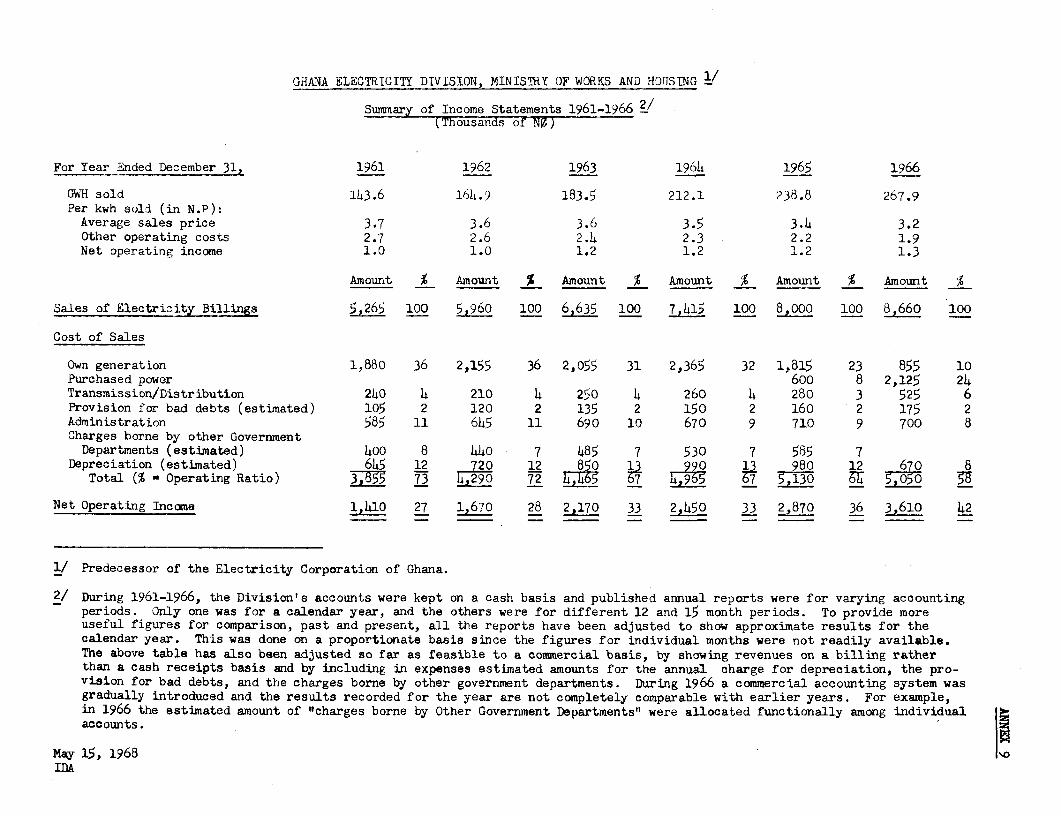
9 Summary of Income Statements, 1961-1966
10 Estimated Sources and Applications of Funds, July 1, 1967-December 31, 1972
11 Summary of Actual and Forecast Income Statements, 1966-1972
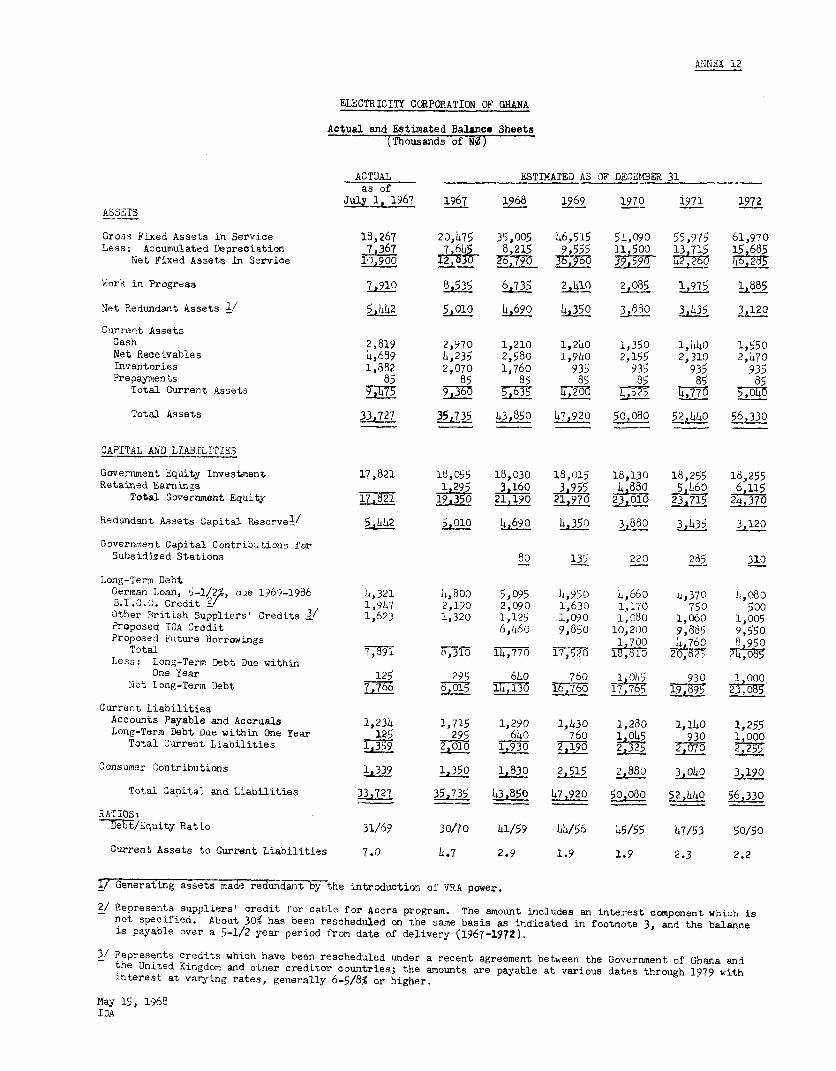
12 Actual and Estimated Balance Sheets, 1967-1972
MAP
Ghana: Areas Served by ECG
GHANA
APPRAISAL OF TIIE DISTRIBTJTION EXPANISION AND
DEVELOPMENT PRCGRAM OF
THE ELECTRICITY CORPORATION OF GHANA
i. This report covers the appraisal of a proposed distribution andexpansion project of the Electricity Corporation of Ghana (ECG) for thethree year period 1968-1970, as part of ECG's 1966-1972 development program.An IDA Credit of US.$10.0 million equivalent would cover the foreign exchangecost of the project, the total cost of which is estimated at US$14.9 million.
ii. The Borrower would be the Republic of Ghana and the Beneficiarythe Electricity Corporation of Ghana, an autonomous corporation of theGovernment of Ghana. No loans or credits have to date been made to ECG.One Bank loan, Loan 310-GH for US$47.0 million equivalent, was made in 1962to the Volta Aiver Authority (VRA) for the construction of the Volta RiverProject. Experience with this loan has been satisfactory.
iii. The distribution expansion and development project is technicallysound, the estimated costs are reasonable and the construction arrangementssatisfactory. The distribution facilities are essential to meet the demandsfor power and to utilize to the maximum extent energy available from theVolta River Project by replacing diesel generation in areas aLready connectedto or to be connected to the VRA transmission system.
iv. The ECG would be a suitable Beneficiary of an IDA Credit. Sincethe decree establishing the Corporation in early 1967 satisfactory effortshave been made to correct inherited doficiencies in organization, staff,manapa;ce,nt, administration and accouniting. It is reasonable to expectfurther progress in these fields in the future.
v. In order to effect a reasonable financing plan for the projectand the remainder of ECG's expansion program, ECG has agreed to review itstariffs in 1968 and to maintain a rate of return of 8% on its average netfixed assets in service plus working capital. To achieve this, tariffswould have to be increased from 1969 onwards to produce 3-6% more revenue.This would enable ECG not only to meet the rate of return requJiremncjt butalso to pay dividends of about 5-6% to the Government on its substantialequity investment.
vi. On the basis of agreements reached during negotiations with theGovernment and EGG the construction program to be carried out during 1968-1970 would be a suitable basis for an IDA Credit of US$10.0 million equiva-lent to the Government of Ghana to be relent to ECG at an interest rate of6-1/4,% for 20 years including a three-year grace period.
GHA1NA
APPRAISAL OF THE DISTRIBUTION EXPANSION AND
DEVELCPNENT Pi.OGRAM OF
THE ELECTRICITY CORPORATION OF GHANA
l. INTRODUCTION
1.01 The Government of Ghana has requested a Credit of US$10 millionequivalent from IDA to finance part of the foreign exchange cost of the"Distribution Expansion and Development Program" of the Electricity Corpo-ration of Ghana (ECG). This program provides for the rehabilitation andextension of distribution systems in various cities and towns of Ghana andthe building of overhead transmission lines to connect new individualindustrial loads and to supply centers presently using diesel power withpower purchased from the Volta River Authority (VRA). VRA operates a largehydroelectric project, which was partially financed by a Bank Loan (310-GH)of US$47 million. Since this project began operating in late 1965, VRA hasbeen the principal source of power distribu.ted by ECG. The expansion anddevelopment program will substantially increase EOG's ability to utilizeavailable VRA power.
1.02 The program has been designed by ECG's consultants to meet loadrequirements up to 1980. The 1966-1972 portion of this program, with whichthis report is primarily concerned is estimated to cost N443.1 million(US$42.2 million) of which N030.4 million (US$29.8 million) represents theforeign cost component and N¢12.7 million (US$12.4 million) the local costcomponent.
1.03 Part of the 1966-1972 work is already under construction orcommitted. Of the imports for the portion of the work underway or committed,US$7.5 million are being financed by a German Loan and a British SupplierCredit, and US$4.7 million by EGG and the Government. This leaves a balanceof US$17.6 million required to cover the remaining foreign exchange require-ments of the first stage program.
1.04 The IDA Credit of US$10.0 million would finance the foreignexchange costs of work during 1968, 1969 and part of 1970. The balance ofthe work planned for 1970-1972 is expected to be financed through futureborrowings.
1.05 This report is based on the findings of missions to Ghana in Apriland September of 1967 by Messrs. E.A.Minnig, A.A.Raizen and D.W.Vollmer.
2. THE BORROIER
2.01 The borrower would be the Aepublic of Ghana. Proceeds of theproposed IDA Credit would be relent by the Government to EGG (see para-graph 9.23). A Project Agreement would be entered into between IDA andECG.
- 2 -
3. ELECTRIC POWER IN GHANA
3.01 Public electricity supply in Ghana started in 1914, when theRailway Administration began service in Sekondi, the country's principalport. This supply was extended in 1928 to the adjoining city of Takoradi.In 1922, the Public Works Department installed a small power station inAccra, Ghana's capital city, and in several other towns in the followingyears. Nine power stations were in operation in 1947, when a separateElectricity Department under the Ministry of Works and Housing was organizedto take over the electricity facilities of the Public Works and RailwayDepartments. The demand for electricity increased sharply after World War IIreaching by 1952 an annual growth rate of 20%. By 1959, when the Departmentbecame the Electricity Division, there were 20 power stations in operation,all diesel, totalling 34 MW and serving 39,000 connections.
3.02 The hydro-electric potential of the Volta River had been known andinvestigated since 1915. The large size and cost of any possible develop-ment were out of proportion to the modest power demand and the viability ofa project was dependent on the establishment of a large power consumingindustry. In 1950, the Volta Preparatory Commission was formed to undertakea comprehensive study of the Volta River Basin power potential and its usein the manufacture of aluminum utilizing the bauxite deposits of Ghana. Thereport published in 1956 recommended the construction of a project to supplypower to an aluminum plant.
3.03 This recommendation was not implemented and in 1958 the Governmentcommissioned Kaiser Engineers and Constructors Inc. (KECI) to review theearlier proposal and to reconsider the justification of a power-aluminumdevelopment. This review led to the Volta River Project and to the sponsor-ship by Kaiser Aluminum and Chemical Corporation of an aluminum smelter atTema.
3.04 In 1961, the Volta River Authority (VRA) was established as anautonomous Government owned corporation to construct and operate the hydro-electric project at Akosombo and the Bank made a loan (Loan No. 310-GH) forUS$47.o million equivalent to assist in financing the project. The projectconsists of an earth and rock-fill dam; a power house with an initial capa-city of 588 MW in four units, with provisions for the installation of furthertwo units bringing final capacity to 882 MW and firm capacity to 640 MW;and a 500 mile long, 165 kv transmission system. It was substantiallycompleted in early 1966, a year ahead of schedule, and the first power wascommercially generated in late 1965. Power from Akosombo is supplied to thealuminum smelter at Tema, to various gold and diamond mines and to theElectricity Corporation for distribution in the main towns and villages ofSouthern Ghana.
3.05 The Volta Aluminum Company (VALCO) was formed at about the sametime and construction of the two projects was coordinated. The smeltercame into commercial operation on April 25, 1967 with three potlines eachof 70 MW capacity. Consideration is being given to extending the smelterby adding the fourth and fifth potlines in the future.
- 3 -
3.06 The Volta Hydro Project was estimated to cost US$180.6 million andcompleted for US$170.9 million or US$9.7 million below the estimate. (Ineach case allowance has been made for the 30C devaluation of the Ghanaiancurrency in July 1967). Operations have been satisfactory and service hasbeen reliable. The 165 kv transmission system supplies the ECG and the mineswith power and energy at costs below those for diesel generation. It isestimated that net foreign exchange savings for fuel oil, after allowing fordebt service, would amount to about US$7.0 million equivalent for the periodl965-1971.
3.07 Annex 1, pages 1 and 2, shows the utilizatior. of VRA power, basedon the Volta i-iver Appraisal Report of 1961 and on current estir,mates. IWithfour units in operation VRA has available 384 MW of firm power. In 1968,220 14W are expected to be supplied to the smelter, 27 4JW to the mines andabout 80 M$W to ECG. Surplus firm capacity therefore now arnounts to 57 MW.
3.08 The contract between VALCO and VRA, concluded for a period of 30years, requires a constant availability of power for the smelter increasingat stated intervals up to 390 MW including transmission losses. However, anincrease above the present level of 220 IMW, requires a one-year notice fromVALCO to go to 330 MW and a two-year notice for 390 MI. Although VALCO hasnot yet given any notice, it is expected that the smelter will be expandedto require 330 1W by 1971 or 1972.
3.09 To meet the increased smelter demand and to provide the securityof service required by the smelter, VRA is planning to install the final twounits at Akosombo to be ready for operation by mid 1971. To meet the expectednon-smelter demand additional generating facilities will be required by 1976or 1977. If this additional power is to come from the Kpong hydroelectricproject downstream of Akosombo, construction may need to start as early as1972. On the other hand it may be possible to defer Kpong for a number ofyears by the integration of the Ghanaian and Nigerian systems by the con-struction of an EHV transmission line.
3.10 For the next few years, VRA is expected to have a limited excessof firm capacity and negotiations are currently under way for the export ofmodest amounts of power to Togo and Dahomey. The total Togo and Dahomeydemand is estimated to increase from about 12 MW in 1970 to about 23 IMIW by1976.
3.11 When the Volta Project was presented, it was clearly understoodthat its long range success would depend on the future development of non-smelter denand served by ECG, and that it was essential that distributionfacilities in Ghana should keep pace with the development of generatingfacilities. The present project, which will make it possible for ECG tomeet the increasing demands of its customers, will also result in a greatincrease in its purchases of power from VRA. It is thus a logical sequenceto the Volta Project which will add materially to the profitability of VRA.
4. THE ELECTRICITY CORPORATION OF GHANA
4.01 In connection with the Bank Loan (310-GH) for the Volta River Hydro-electric Project, the Government of Ghana agreed that it would reorganize the
Electricity Division as an autonomous corJoration comparable to VRA to beoperated as a public utility on a sound commercial basis. This reorganiza-tion was to take place no later than the date when power became availablefrom the VRA but was delayed because of political changes in Ghana, and thetime required to formulate the basic charter of the new corporation and toselect the initial Board of Directors. The Government Decree establishingthe Corporation (EGG) was published on January 20, 1967, and the vesting ofthe Electricity Division's assets and liabilities in EGG took place onJuly 1, 1967.
4.02 The decree authorizes ECG to generate, puchase electricity inbulk from V&A, transmit, supply and distribute electricity. ECG is specifi-cally authorized to supply electricity in bulk or to individual consumers(other than VRA, Akosombo township which is served by VRA, and certain mines)at voltages not exceeding 34.5 kv and with demands normally not more than30 MVA. In addition, ECG is empowered to make regulations for the controlof the generation and supply of electricity by private enterprise and bystatutory corporations other than VIA. Localities served are shown on theattached map.
4.03 ECG has the power to sue and to be sued, to acquire and to disposeof property, to borrow, and to enter into any contract or other transactionnecessary for the discharge of its functions. The Government may provideECG with funds for capital development works and working capital and mayprescribe the maximum amounts which ECG may borrow. ECG is exempt fromincome tax and is also exempt for an initial working period of ten yearsfrom all duties and sales taxes.
Organization and Management
4.04 ECG is governed by a Board of eight Directors consisting of aChairman; the Principal Secretary of the linistry responsible for ECG (atpresent, the Ministry of Works and Housing); the Principal Secretary of theMinistry responsible for Finance; the EGG Managing Director; the ChiefExecutive of VRA; and three other persons - of whom one shall representindustry and one other consumers of electricity. The Chairman and the latterthree members are appointedby the Government to hold office for three yearterms which are staggered: none may be an employee of the Corporation andno more than one may be employed by the Government. No person shall be amember of the Board who is a member of any assembly or other body havingauthority to enact laws which have effect throughout Ghana.
4.05 The Managing Director, who is appointed by the Government, is thechief executive officer of ECG. Subject to directions of the Board on generalmatters of policy, he is charged with the direction of the business of ECG,its administration and organization, and with control of its employees.Appointments and dismissals of the more senior staff are made by the Boardacting on the recommendation of the lanaging Director. Other personnelactions are within the discretion of the M4anaging Director. At the end of1966, there were 4,248 employees, of whom 1,490 were salaried. In additionto its Head Office in Accra, ECG has district and regional offices responsiblefor its operations in different parts of the country.
- 5 -
4.o6 The Managing Director of ECG is a Ghanaian who previously served asChief Engineer of the Electricity Division, a post to which he was appointedin 1966. The Managing Director is able, but he lacks adequate supportingstaff. ECG has inherited weaknesses in staff and organization from theElectricity Division. A number of senior positions are vacant; some staffmembers do not have enough experience, initiative and organizational talent;in general, supervision, control and reporting procedures are in need ofimprovement. During negotiations agreement was reached with the Governmentthat future appointments to the post of Managing Director, and with ECG thatany proposed appointments to the positions of Chief Financial Officer orChief Engineer, be made only after prior consultation with IDA.
4.07 ECG is taking a number of steps to improve its staff situation, oneof which is to increase its salary and wage levels substantially so that theyare comparable with those paid in private industry in Ghana. In this way ithopes to be able to attract and hold capable personnel and to increase theefficiency of the existing staff. Efforts to obtain foreign technical assis-tance to fill vacant senior positions and to help train Ghanaians have beenpartially successful, and continuing efforts are under way to fill severalother key vacant posts, including Chief Accountant, Deputy Chief Engineer,Chief Internal Auditor, and Chief Cost Accountant. Some of EOG's staffhave also received practical training in German factories to familiarizethemselves with the equipment being supplied for the Accra system. A supple-mentary agreement between ECG and its technical consultants provides for thesecondment by the consultants of staff to operate the 33/11 kv distributionnetwork of Accra and Tema for a period of about one year and to provideon-site training for Ghanaian personnel.
Consultants
4.08 Electrical engineering consultants, W. Lalbmeyer & Co., (Germany)were retained in 1962 to design and plan the reconstruction and expansionof the Electricity Division's facilities. They are now under contract toassist ECG until the end of 1971 to prepare specifications and tenderdocuments, review tenders, and supervise construction and commissioning.
4.09 The management consultancy services of Cooper Brothers & Co.(the Accra, Ghana branch of a United Kingdom firm) have been utilized sinceSeptember 1965. Cooper Brothers, who also are auditors, were retained toassist in the establishment of ECG by preparing and helping to implement asystem of commercial accounting and budgetary control. The commercialaccounting system was introduced in mid 1967, when the corporation began oper-ating. The existing accounting staff taken over from the Electricity Divisionis unfamiliar with commercial accounting. In addition to the urgent need tofill several key senior accounting posts now vacant (see paragraph 4.07),the effectiveness of the improvement programs being set up by Cooper Brotherswill depend on the success realized in training the existing staff and inrecruiting other qualified junior staff to perform the new duties. EOG hasagreed to retain the services of management consultants as long as necessaryto help establish sound business and accounting procedures.
Present Facilities of ECG
4.10 Diesel generating capacity of 90 MW is presently installed intwenty-nine power plants. Eleven of these plants with 64.o MW have become
- 6 -
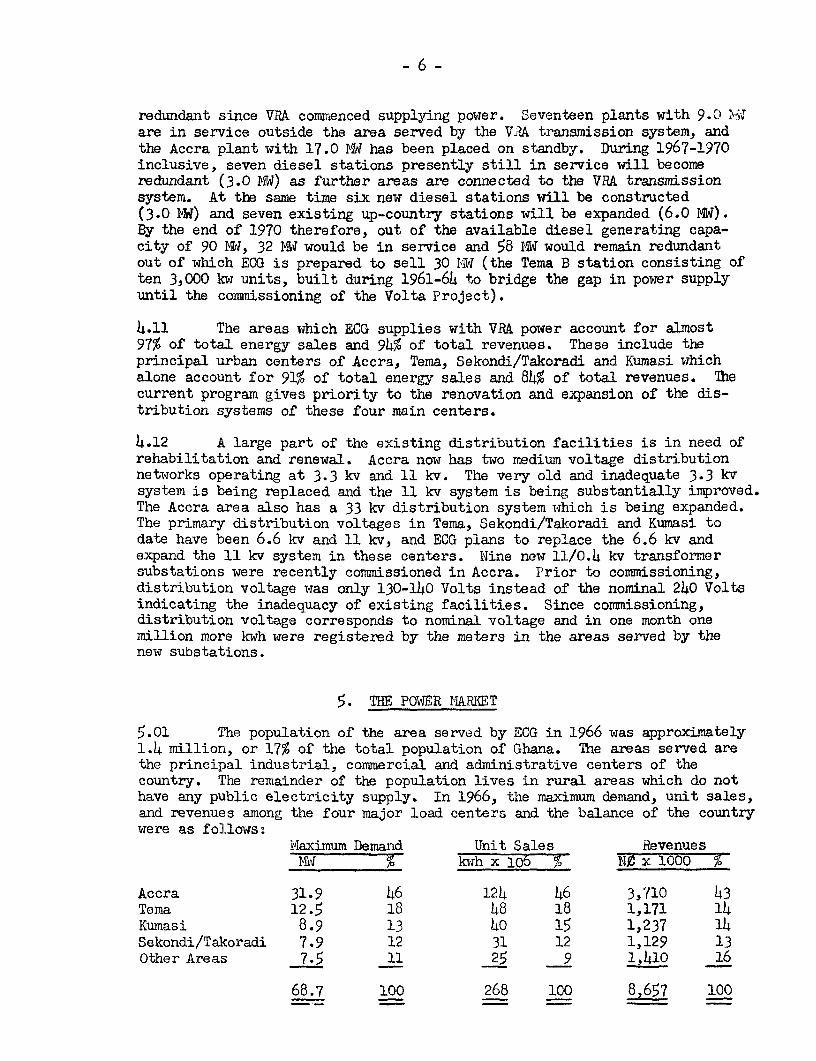
redundant since VRA commenced supplying power. Seventeen plants with 9.0 >)Jare in service outside the area served by the VIA transmission system, andthe Accra plant with 17.0 Mq has been placed on standby. During 1967-1970inclusive, seven diesel stations presently still in service will becomeredundant (3.0 MW) as further areas are connected to the VRA transmissionsystem. At the same time six new diesel stations will be constructed(3.0 %M) and seven existing up-country stations will be expanded (6.0 MW).By the end of 1970 therefore, out of the available diesel generating capa-city of 90 I', 32 MW would be in service and 58 IW would remain redundantout of which ECG is prepared to sell 30 14W (the Tema B station consisting often 3,000 kw units, built during 1961-64 to bridge the gap in power supplyuntil the commissioning of the Volta Project).
4.11 The areas which ECG supplies with VRA power account for almost97% of total energy sales and 94% of total revenues. These include theprincipal urban centers of Accra, Tema, Sekondi/Takoradi and Kumasi whichalone account for 91% of total energy sales and 84% of total revenues. Thecurrent program gives priority to the renovation and expansion of the dis-tribution systems of these four main centers.
4.12 A large part of the existing distribution facilities is in need ofrehabilitation and renewal. Accra now has two medium voltage distributionnetworks operating at 3.3 kv and 11 kv. The very old and inadequate 3.3 kvsystem is being replaced and the 11 kv system is being substantially improved.The Accra area also has a 33 kv distribution system which is being expanded.The primary distribution voltages in Tema, Sekondi/Takoradi and Kumasi todate have been 6.6 kv and 11 kv, and ECG plans to replace the 6.6 kv andexpand the 11 kv system in these centers. Nine new 11/0.4 kv transformersubstations were recently commissioned in Accra. Prior to commissioning,distribution voltage was only 130-140 Volts instead of the nominal 240 Voltsindicating the inadequacy of existing facilities. Since commissioning,distribution voltage corresponds to nominal voltage and in one month onemillion more kwh were registered by the meters in the areas served by thenew substations.
5. THE POWER IARIT
5.01 The population of the area served by ECG in 1966 was approximately1.4 million, or 17% of the total population of Ghana. The areas served arethe principal industrial, commercial and administrative centers of thecountry. The remainder of the population lives in rural areas which do nothave any public electricity supply. In 1966, the maximum demand, unit sales,and revenues among the four major load centers and the balance of the countrywere as follows:
Maximum Demand Unit Sales Revenues_M__ k_vh x 106 7- % x iooo %
As indicated by the above table, Accra is the largest sales area. In rc3actyears, however, the load in Tema has been increasing more rapidly than else-where as a result of its development as the main entry port for Ghana, modelcity and industrial area. Consequently, unit sales in Tema as a percentageof the total increased from 4% in 1961 to 18% in 1966.
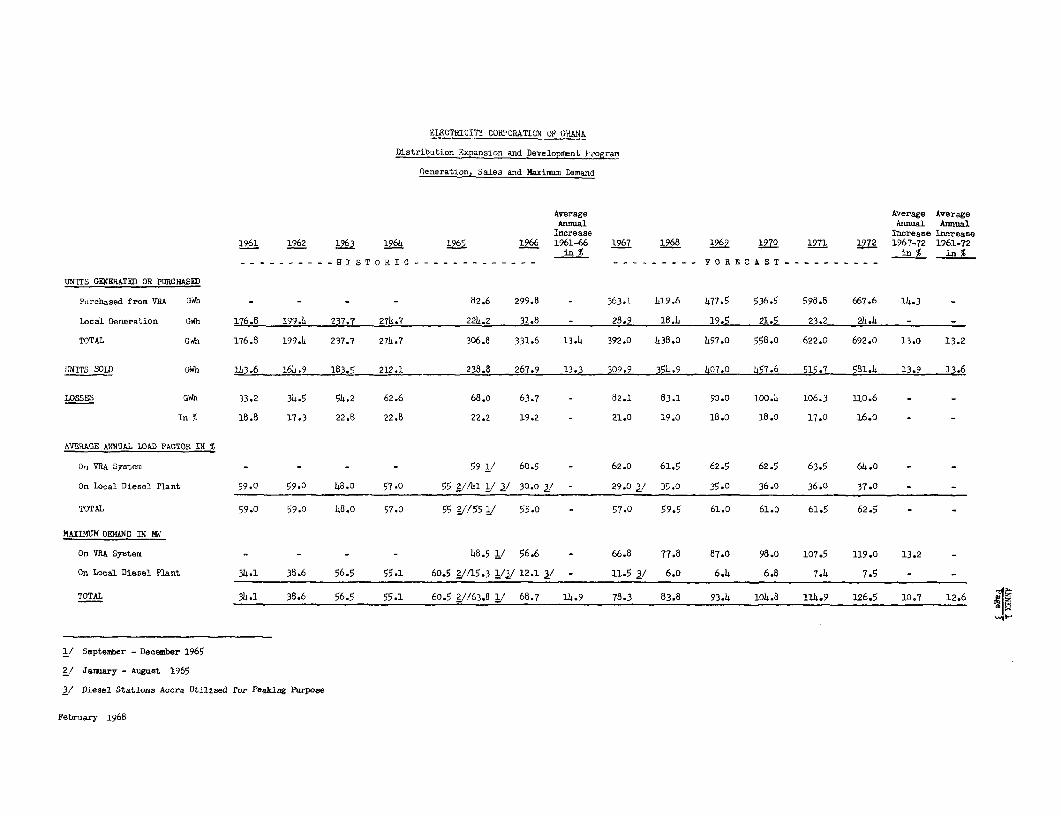
5.02 The sum of the maximum demands of the various distribution centersserved by ECG increased from 34.1 MW in 1961 to 68.7 MW in 1966, an averageincrease of 15% per annum. During the same period total sales increased from144 million kwh in 1961 to 268 million kwh in 1966, an average increase of 13%per annum. It is estimated that during the six year period 1967-1972, themaximum demand will increase at an average rate of about 11% per annum, risingto 126 MW by 1972, and that sales will increase at about 14% perannum to atotal of 581 million kwh in 1972. Annex 1, page 3, shows the historical andforecast data for maximum demand, energy generated and purchased, system losses,and annual load factors.
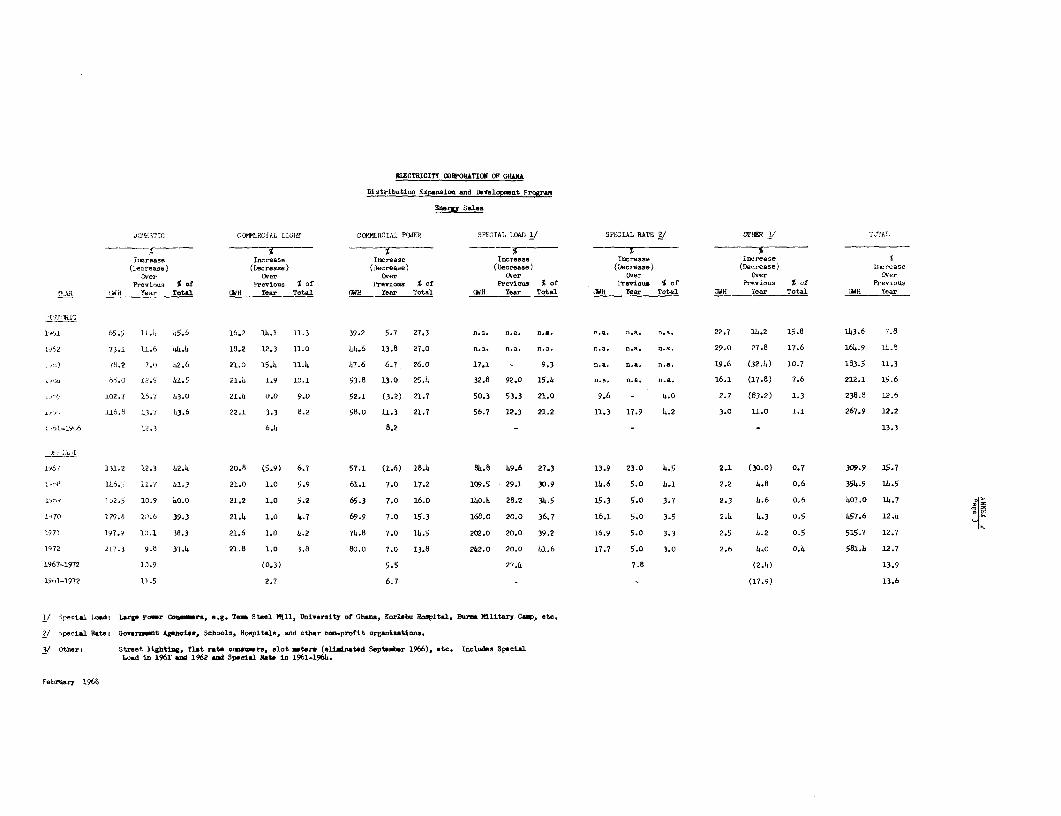
5.03 The forecast for sales increases in the various categories of consu-mers and tariffs and the basis for the forecast are described in Annex 2 andare briefly set out in the following table:
Average AnnualConsumer In millions of kwh Increase in %Category 1966 1972 1967-1972
Domestic 117 217 11Commercial Light 22 22 -Commercial Power 58 80 6Special Load - i.e., Large Power Users 57 241 27Special Rate - i.e., Military Hospitalsand Non-profit Organizations 11 18 8
Other 3 3 _
Total 268 581 14
Purchases, Generation and Losses
5.04 As shown in Annex 1, page 3, in 1966 total power purchased andgenerated amounted to 332 million kwh, of which 300 million kwh or 90% werepurchased from VRA& and 32 million kwJh or 10% were generated by ECG. Of thelatter figure, almost 17 million kwh were generated for peaking or emergencypurposes at diesel stations in areas supplied by the VRA transmission network,particularly in Accra because of the inadequacy of distribution facilitiesto absorb VRA power. This should no longer be necessary by 1968 when distri-bution system improvements now in progress are completed. Thus estimateddiesel generation for 1968 should be reduced to 18 million kwh for use inareas not connected to the VRA system.
5.05 Estimates of future purchases from VRA and of diesel generationreflect the sales forecast and assumptions as to system losses and loadfactor. Losses have been comparatively high. They were over 22% in 1963-1965; dropped to 19% in 1966 after purchases from VRA began and station useceased to be an important factor; and are estimated at 21% for 1967. Inaddition to normal line losses, these high figures reflect the inadequaciesof the existing distribution system; to some extent they also are due toillegal connections and deficient metering and billing procedures. As theplanned system improvements become operational and as expected corrections
- 8 -
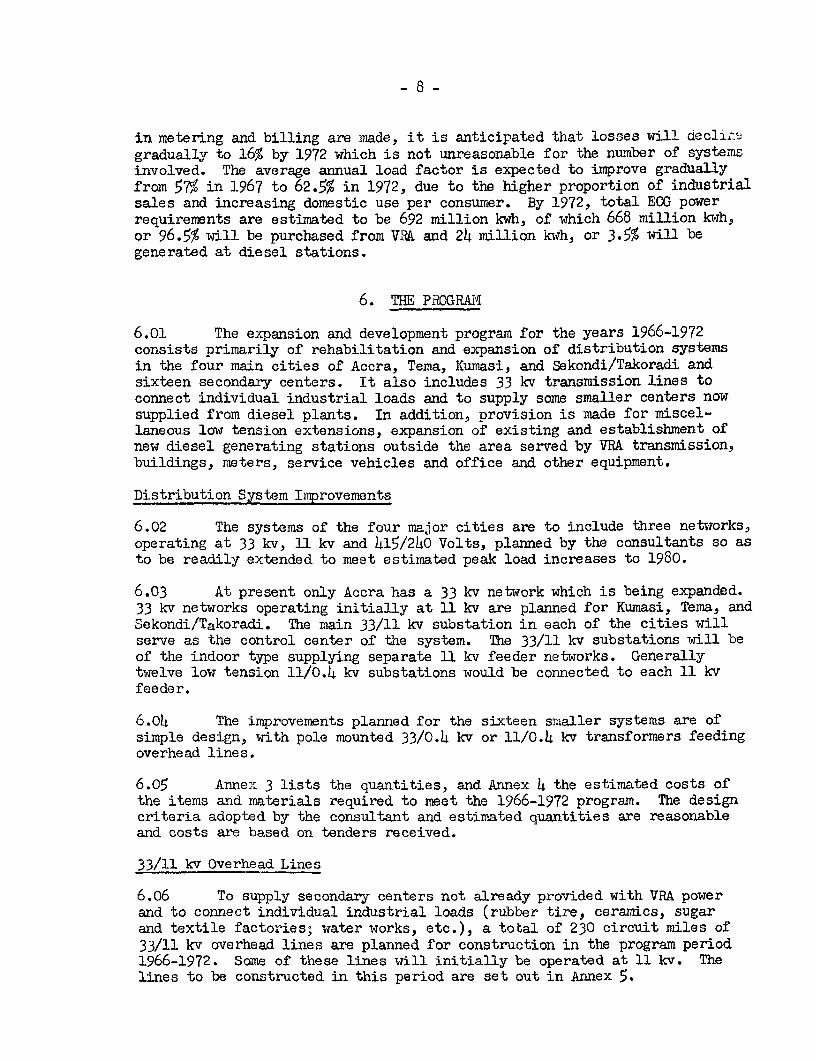
in metering and billing are made, it is anticipated that losses will decli'^:gradually to 16% by 1972 which is not unreasonable for the number of systemsinvolved. The average annual load factor is expected to improve graduallyfrom 57, in 1967 to 62.5% in 1972, due to the higher proportion of industrialsales and increasing domestic use per consumer. By 1972, total ECG powerrequirements are estimated to be 692 million kwh, of which 668 million kwh,or 96.5% will be purchased from VR& and 24 million kwh, or 3.5% will begenerated at diesel stations.
6. THE PROGRAM
6.01 The expansion and development program for the years 1966-1972consists primarily of rehabilitation and expansion of distribution systemsin the four main cities of Accra, Tema, Kumasi, and Sekondi/Takoradi andsixteen secondary centers. It also includes 33 kv transmission lines toconnect individual industrial loads and to supply some smaller centers nowsupplied from diesel plants. In addition, provision is made for miscel-laneous low tension extensions, expansion of existing and establishment ofnew diesel generating stations outside the area served by VRA transmission,buildings, meters, service vehicles and office and other equipment.
Distribution System Improvements
6.02 The systems of the four major cities are to include three networks,operating at 33 kv, 11 kv and 415/240 Volts, planned by the consultants so asto be readily extended to meet estimated peak load increases to 1980.
6.03 At present only Accra has a 33 kv network which is being expanded.33 kv networks operating initially at 11 kv are planned for Kumasi, Tema, andSekondi/Takoradi. The main 33/11 kv substation in each of the cities willserve as the control center of the system. The 33/11 kv substations will beof the indoor type supplying separate 11 kv feeder networks. Generallytwelve low tension 11/0.4 kv substations would be connected to each 11 kvfeeder.
6.04 The improvements planned for the sixteen smaller systems are ofsimple design, with pole mounted 33/0.4 kv or 11/0.4 kv transformers feedingoverhead lines.
6.05 Annex 3 lists the quantities, and Annex 4 the estimkated costs ofthe items and materials required to meet the 1966-1972 program. The designcriteria adopted by the consultant and estimated quantities are reasonableand costs are based on tenders received.
33/11 kv Overhead Lines
6.o6 To supply secondary centers not already provided with VRA powerand to connect individual industrial loads (rubber tire, ceramics, sugarand textile factories; water works, etc.), a total of 230 circuit miles of33/11 kv overhead lines are planned for construction in the program period1966-1972. Some of these lines will initially be operated at 11 kv. Thelines to be constructed in this period are set out in Annex 5.
- 9 -
Miscellaneous Low Tension Projects and House Connecting liaterials
6.07 In addition to the program as prepared by the consultant, ECG hasincluded allowances for miscellaneous low tension extensions not included inthe consultant's program principally in various up-country locations. ECGproposes to extend the technical consultant's contract to include the townsof Bolgatanga, Tamale, Sunyani and Ho. With the exception of routine work,new connections and the extension of supply to the Airforce Base at Tamaleno major low tension projects will be undertaken at these stations until th3consultant's report, to be available by the end of 1968, has been reviewedby IDA.
New Diesel Generating Stations and Distribution Systems
6.o8 ECG plans to use some of its redundant diesel generating capacityin towns which presently have no public electricity supply and which cannotbe economically connected to the VRA transmission system. The work on twoof the new stations at Denu and Mampong (Ashanti), was largely completed in1966-1967. Additional new stations are planned to be built during 1968-1969at Komenda, Kibi, Konongo, Suhum, Bawku, Golokuati, Half Assini and Axim.
6.og Seven of these new stations are expected to operate at a loss forsome time and are being established at the request of the Government inresponse to political and social pressures to extend the areas in which thepopulation enjoys electricity service. In addition to the capital costs forestablishing these stations estimated at about N4375,000, the Government hasagreed to provide subsidies equal to the expected annual operating losseswhich by 1972 are estimated to amount to about N6100,000. Thus the subsidiesrequired for these seven new stations are relatively small.
Four Small Substations
6.10 In 1968 ECG plans, in connection with the 33 kv lines, to buildsubstations at Tafo, Tarkwa, Cape Coast, and Akwatia to improve connectionsto the ViA transmission system. ECG proposes to procure the importedmaterial needed for these, through long-term credits already available tothe Government from United Kingdom and German sources.
Cost Estimate
6.11 A summary of the estimated costs of the 1966-1972 program isgiven below and details are set out in Annex 4, 5 and 6.
- 10 -
ELECTRICITY CORPORATION OF GHANA
Summary Cost Estimate - 1966-72 Program
In Thousands of No In Thousands of US$Foreign Local Total Foreign Local Total
Distribution Systems 20,454 7,957 28,411 20,050 7,769 27,819
Construction Velicles,Meters, Tools, TestEquipment, etc. 2,725 89 2,814 2,671 87 2,758
Consulting Fees 300 391 691 2294 382 676
Contingencies 1,396 1,o4l 2,437 1,369 1,016 2,385
Total 30,400 12,700 L3,100 29,800 12,400 42,200
7. THE CREDIT
7.01 Part of the 1966-1972 program is already under construction orcommitted and financing totalling US$7.5 million to cover the foreign exchangecost is being provided through a West German Loan and a British Supplier Credit.A further US$4.7 million is being provided by ECG and the Government. Thisleaves a balance of US$17.6 million required to cover the remaining foreignexchange requirement of the 1966-1972 program of which US$10.0 million(N¢10.2 million equivalent) would be provided under the proposed IDA Creditto finance the foreign exchange costs of work during 1968, 1969 and part of1970. The balance of the work planned for 1970-1972 is expected to be fi-nanced through future borrowings.
7.02 The 1966-1972 program has therefore been divided into three partsas set out in Annexes 3, 4, 5 and 6. These are:
i. the part of the program being financed by the German Loan, theBritish Supplier Credit, ECG and the Government. This workincludes about 90% of the Accra program; h small substations to
- 11 -
improve connections to the VRA transmission system; the main Temasubstation; four overhead lines totalling 44 circuit miles; somemiscellaneous low tension projects; installation of new and expan-sion of existing diesel generating stations; meters, service andconstruction vehicles, office machinery, tools and test equipmentrequired during 1966, 1967 and part of 1968;
ii. the IDA Credit portion which would cover 5% of the Accra program;about 80% of the Kumasi program; 60% of the Tema program; 75% ofthe Sekondi-Takoradi program; 30% of the 16 Smaller Systems program;five overhead lines totalling 82 circuit miles; some miscellaneouslow tension projects; meters, service and construction vehicles,office machinery, tools and test equipment required during part of1968, 1969 and part of 1970. The IDA Credit portion of the programwould be limited to items which can be completed and placed intooperation by 1970; and
iii. the remainder of the program to be carried out during 1970-1972,expected to be financed under future borrowings. This would con-sist of the remaining 5% of the Accra program; 20% of the Kumasiprogram; 40% of the Tema program; 25% of the Sekondi-Takoradiprogram; 70% of the 16 Smaller Systems program; six overheadlines totalling 104 circuit miles; miscellaneous low tensionprojects; meters, service and construction vehicles, officemachinery, tools and test equipment required during part of 1970,1971 and 1972.
7.03 In Accra the work to built with the IDA Credit will permit facili-ties financed from other sources to be utilized more fully. It is thusdependent on their satisfactory completion and the project descriptionaccordingly includes these facilities. In the other areas IDA will be finan-cing all the work to be carried out in Tema, Kumasi, Sekondi-Takoradi and16 smaller centers, except for the main Tema substation already under con-struction and four small substations to improve connections to the VRAtransmission system, both financed by ECG and estimated to require N0405,000of foreign exchange. The remaining parts of the program in these areas areexpected to be executed in 1970-1972; but the facilities financed by IDAwould be justified even in the unlikely event that these other works werenot completed (see paragraph 8.08).
7.04 The work to be carried out during 1966-1970 has been limited to agreat extent to the principal urban centers which account for about 91% oftotal energy sales and 84% of total revenues (see paragraph 4.11). 85% ofthe total expansion and development investments 1966-1970, which includesinvestments totalling N01,379,000 to connect individual industrial loads,are concentrated in these urban centers and 15% in the smaller centers andup-country stations, thus reflecting the same proportion as revenues.
Cost Estimate
7.05 A summary of the estimated costs of that part of the program to becovered by the proposed IDA Credit is given below and shown in detail inAnnex 4, 5 and 6.
- 12 -
ELECTRICITY CORPORATION OF GH{ANA
Summary Cost Estimate - Proposed IDA Project
In Thousands of N' In Thousands of US$Foreign Local Total Foreign Local Total
Four Major Systems - Accra,Tema, Kumasi, Sekondi/Takoradi 6,365 2,939 9,304 6,240 2,880 9,120
Construction Vehicles,Meters, Tools, TestEquipment, etc. 1,068 60 1,128 1,048 59 1,107
Consulting Fees 123 140 263 121 137 258
Contingencies 712 551 1,263 698 540 12238
Total 10,200 5,000 15,200 10,000 4,900 14,900
7.06 A contingency allowance of about 7%0 has been made on the foreignexchange portion and about 11% on the local currency costs of work coveredby the proposed Credit. The higher allowance for local costs reflects thegreater uncertainty of the effect on local prices of the July, 1967 devalua-tion of the Ghanaian currency. If the contingency allowances are not neededor there are other savings on the proposed InA project, the savings could beutilized for some of the remainder of the 1966-1972 program now expected tobe financed under future borrowings, to the extent that this work can becompleted in 1970.
Procurement and Disbursement
7.07 Procurement would be on the basis of international competitivebidding in accordance with the "Guidelines for Procurement under World BankLoans and IDA Credits". Specifications for the major items accounting forabout 90% of the estimated foreign exchange component of the project havebeen prepared by the consulting engineers and tenders issued and receivedon an international basis. No contracts have been awarded to date. Speci-fications for the remaining 10% of the foreign costs of the project formiscellaneous items such as construction vehicles, meters, office equipment,tools, etic. will be prepared at a later date. Disbursements of the proposed
D 13 -
Credit would be made only for the actual foreign exchange cost of equipment,material and services and the foreign exchange component of erection costsas specified in the contracts.
Construction Schedule
7.08 Construction of the Accra system commenced in 1966 and the majorportion of the work should be completed by late 1968. By early 1970, about95, of the work in Accra scheduled under the 1966-1972 program should be com-pleted. Ifork on the Tema system was started in late 1967 and that portionof the program to be financed out of the proposed IDA. Credit is scheduledto start by mid 1968 for completion by mid 1970. WTork on the Kumasi systemis scheduled to start in mid 1968 and that portion of the program to befinanced under the proposed IDA Credit should be completed by mid 1970.Work on the Sekondi-Takoradi system is scheduled to commence by late 1968and that portion of the program to be financed under the proposed IDA Creditshould be completed by mid 1970. Work on the 16 smaller systems is scheduledto commence by mid 1969 and that portion of the program to be financed underthe proposed IDA Credit should be completed by mid 1970. The 33/11 kv over-head lines to be financed under the proposed IDA Credit would be erectedduring the period mid 1968 to end 1970.
8. JUSTIFICATION
8.01 There are four main elements in the justification of the 1966-1972program:
i. it will bring about some standardization of equipment whichwill make for lower inventories and lower maintenance costs;
ii. it will rehabilitate the distribution system thus improvingvoltage and meter registrations and reducing losses;
iii. it will permit fuller use of VRA power, thus substituting alower cost energy source for the diesels presently in use andsaving foreign exchange; and
iv. it Iwill enable ECG to meet the growth of demand discussed inSection 5.
8.02 The modern 11 kv system is being expanded to replace the old andinadequate 3.3 kv distribution system in Accra. To meet forecast demandmore efficiently existing 6.6 kv systems in Kumasi and Sekondi-Takoradi areplanned for replacement by 11 kv systems. The resulting voltage and equip-ment standardization will reduce maintenance costs and inventories.
8.03 After a decrease from 221 in 1965 to 19% in 1966, when VRA powuerbecame available, losses increased again to 21% in 1967. With system improve-ments, losses are forecast to decrease to at least 16% by 1972. In the fiveyears 1968-1972 savings due to reduced losses are estimated to total aboutN¢0.8 million and thereafter would amount to at least N0O.4 million perannum.
- 14 -
8.04 With the exception of overhead lines to connect individual indus-trial consumers (see paragraph 8.07) and some smaller centers now beingsupplied with diesel generation (see paragraph 8.05), virtually all of theinvestments included in the 1966-1972 program are required regardless whetherpower is purchased from VRA or provided by diesel generation. In addition,rehabilitation of distribution facilities included in the program will permita greater use of VRA power instead of diesel generation, resulting in substan-tial savings to ECG. Because of inadequate conductor cross-sections in Accraand failure of cables from overloading in Tafo-Koforidua, diesel generatingstations in these areas already connected to and served by the VRA trans-mission system were required to generate peak and emergency power. For thispurpose 17.0 million kwh were generated in 1966 and a conservative estimatefor 1972, if no rehabilitation work were carried out, would be 38 million kwh.Since diesel fuel, excluding taxes and duties, costs ECG 1.9 NP/kwh (18.6 USmills/kwh) ECG would in 1972 save about N.720,000 in foreign exchange, andwith VRA power presently costing ECG 0.775 NP/kwh (7.6 US mills/kwh) the netsavings to ECG would amount to about NZ425,000.
8.o5 There are other areas now served by diesel generating stations,which because of their proximity to existing VRA substations or to overheadlines being built for industrial consumers, can readily be connected to theVRA transmission system. By 1972 these areas would require about 7.0 millionkwh. The annual charge in 1972 of operating and maintaining such connectionsand purchasing power from VRA would cost ECG about N$160,O00. To provide thesame power with diesel generation the annual charge would be about N$210,000.Savings to ECG would therefore be about N050,000 and would increase in sub-sequent years.
8.06 As a consequence of the use of Volta power, diesel generatingequipment has become redundant (see paragraph 4.10). Utilizing suchredundant equipment to expand existing up-country stations and to installin new diesel stations avoids the need for investment in new generatingequipment.
8.07 It may be azked whether the balance of redundant equipment couldnot have been used to supply new industries with diesel power instead ofconstructing some of the 33/11 kv lines listed in Annex 5. By 1972 such newindustries would consume about 74 million kwh per annum. To provide thispower with diesel generation, ECG would be required to utilize foreignexchange for the import of fuel. The present value of such fuel importsover the life of transmission facilities discounted at 8% would representNI16.2 million as against foreign exchange requirements of NA1.2 million forthe construction of the lines. In addition, a comparison of the two alterna-tive means of supplying these industries with power and energy shows that therate of return on the incremental line investment would be about 28%.
8.08 Expansion of distribution facilities is a continuing process. ECGGsconsultants therefore have provided for an economic development of the systemsin accordance with reasonable load forecasts and sound engineering practice.But even if no other work were carried out after the completion of the 1966-1970 portion of the program the rate of return on the new investments wouldbe at least 10%, which can be considered satisfactory. If as is likely, the
- 15 -
distribution system continues to expand after 1070 the facilities to befinanced by IDA will be more fully utilized and the rate of return on thesewill be higher.
8.09 ECG's present program to rehabilitate and expand its distributionfacilities would enable ECG to efficiently serve the increasing demand ofexisting consumers, would allow it to readily extend facilities to meetfurther demand and would through the increased use of VRA power add materi-ally to the profitability of VRA. This would contribute to the continuedeconomic development of Ghana.
9. FINANCIAL ASPECTS
Tariffs
9.01 Prior to July 1, 1967, when ECG took over the operations of theElectricity Division, there was no specific statutory standard governingtariffs for electricity supply and they were established by the Ministry ofPublic Works at whatever level was deemed advisable. The decree establishingECG directs it to prescribe tariffs so as to ensure that its revenues aresufficient to produce a reasonable return on the fair value of its assets.This return is to be measured by taking ECG's net operating income - i.e.,income after providing for operating expenses including adequate maintenanceand straight-line depreciation but before deducting interest charges - as apercentage of the fair value of its fixed assets in operation plus an appro-priate allowance for working capital. The considerations to be taken intoaccount in determining what constitutes a reasonable return include the needfor net operating income sufficient to meet interest payments, provide fordebt repayments in excess of the annual denreciation charge, provide areasonable proportion of the funds needed .-or ecpansion, and make reasonablepayments into the Government's Consolidated Fund. The latter are to bepayable from time to time in such amounts as the Board of Directors of ECGmay, after consultation with the Minister of Finance and having regard forECG's future financial requirements, think proper.
9.02 This is a satisfactory general standard for fixing ECG's level oftariffs. During negotiations agreement was reached with the Government andECG that tariffs would be adjusted as necessary to produce a return of atleast 8% on the average value of net fixed assets in service, less consumercontributions for assets in service and Government capital contributions forsubsidized stations, and plus an allowance for working capital equal to 5% ofthe net fixed assets in service. On this basis, ECG's earnings (includingaccumulated past earnings) would be sufficient to provide about 4G% of con-struction requirements in the period July 1, 1967 - December 31, 1972 fromnet internal cash generation after payment of debt service and of dividends,beginning about mid 1969, of about 5-6% on the Government's equity investmentin ECG (see paragraphs 9.21, 9.22 and 9.27).
9.03 ECG's present tariff schedules are the same as those in effect whenit operated as the Electricity Division and have been unchanged since May 1,1960. The various tariffs are described in Annex 7. Generally they consistof a combination of a minimum fixed charge and a unit charge per kwh consumed,so that with increased usage or higher load factor the average price per kwhis reduced. The domestic and commercial tariffs are higher in the smallerconters than in the four major cities.
- 16 -
9.04 The average price paid for electricity is comparatively low,except for the commercial lighting and special rate tariffs. This isshown by the following table, which lists the average revenues per kwhsold in 1966 by tariff classification, and which also indicates therelative importance of each tariff classification in terms of the percent-age of total sales and revenues which it accounted for. The difference inthe level of domestic and commercial tariffs in the four major cities andother stations is also shown.
ELECTRICITY CORPORATION OF GHANA
TARIFF CCMPARISONJ, 1966
Average Revenue per kwh,in New Pesewas (NP)2/ Percent of Total
FourTariff Major Other All kwhClassification Cities Stations Stations Sales Revenues
Domestic 2.4 4.5 2.6 4 35
Commercial Light 9.4 10.5 9.6 8 25
Commercial Power 2.6 4.6 2.8 22 18
Special Load - i.e.,Large Power Users 2.1 21 14
Special Rate - i.e.,Military, Hospitals andNon-profit organizations 5.2 4 7
Other 4.0 1 1
Total 3.2 100 100
1/ Since the New Cedi (NO) has a value of US$0.98, the unit prices shown arevirtually equivalent to US cents.. The difference in average revenue per kwhbetween the four major cities and other statinns is shown only for Domestic,Commercial Light and Commercial Power categories, because it is only underthese tariffs that the charge varies depending on the location of thecustomer.
- 17 -
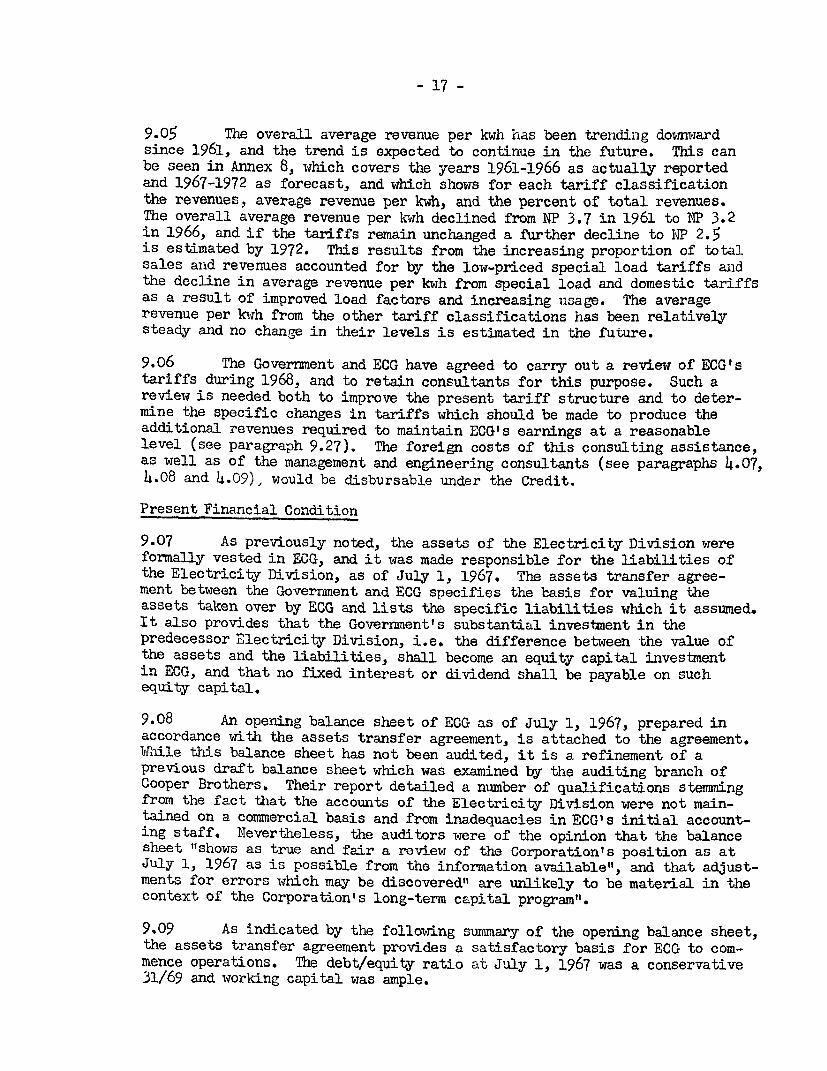
9.05 The overall average revenue per kwh has been trendiing downwiardsince 1961, and the trend is expected to continue in the future. This canbe seen in Annex 8, which covers the years 1961-1966 as actually reportedand 1967-1972 as forecast, and wihich shows for each tariff classificationthe revenues, average revenue per kwh, and the percent of total revenues.The overall average revenue per kwh declined from NP 3.7 in 1961 to NP 3.2in 1966, and if the tariffs remain unchanged a further decline to NIP 2.5is estimated by 1972. This results from the increasing proportion of totalsales and revenues accounted for by the low-priced special load tariffs andthe decline in average revenue per kwh from special load and domestic tariffsas a result of improved load factors and increasing usage. The averagerevenue per kwh from the other tariff classifications has been relativelysteady and no change in their levels is estimated in the future.
9.06 The Government and ECG have agreed to carry out a review of ECG'stariffs during 1968, and to retain consultants for this purpose. Such areview is needed both to improve the present tariff structure and to deter-mine the specific changes in tariffs which should be made to produce theadditional revenues required to maintain ECG's earnings at a reasonablelevel (see paragraph 9.27). The foreign costs of this consulting assistance,as well as of the management and engineering consultants (see paragraphs 4.07,4.08 and 4.09), would be disbursable under the Credit.
Present Financial Condition
9.07 As previously noted, the assets of the Electricity Division wereformally vested in ECG, and it was made responsible for the liabilities ofthe Electricity Division, as of July 1, 1967. The assets transfer agree-ment between the Government and ECG specifies the basis for valuing theassets taken over by ECG and lists the specific liabilities which it assumed.It also provides that the Government?s substantial investment in thepredecessor Electricity Division, i.e. the difference between the value ofthe assets and the liabilities, shall become an equity capital investmentin ECG, and that no fixed interest or dividend shall be payable on suchequity capital,
9.08 An opening balance sheet of ECG as of July 1, 1967, prepared inaccordance with the assets transfer agreement, is attached to the agreement.While this balance sheet has not been audited, it is a refinement of aprevious draft balance sheet which was examined by the auditing branch ofCooper Brothers. Their report detailed a number of qualifications stemmingfrom the fact that the accounts of the Electricity Division were not main-tained on a commercial basis and from inadequacies in ECG's initial account-ing staff. Nevertheless, the auditors were of the opinion that the balancesheet "shows as true and fair a review of the Corporation's position as atJuly 1, 1967 as is possible from the information availablel, and that adjust-ments for errors which may be discovered" are unlikely to be material in thecontext of the Corporation's long-term capital program".
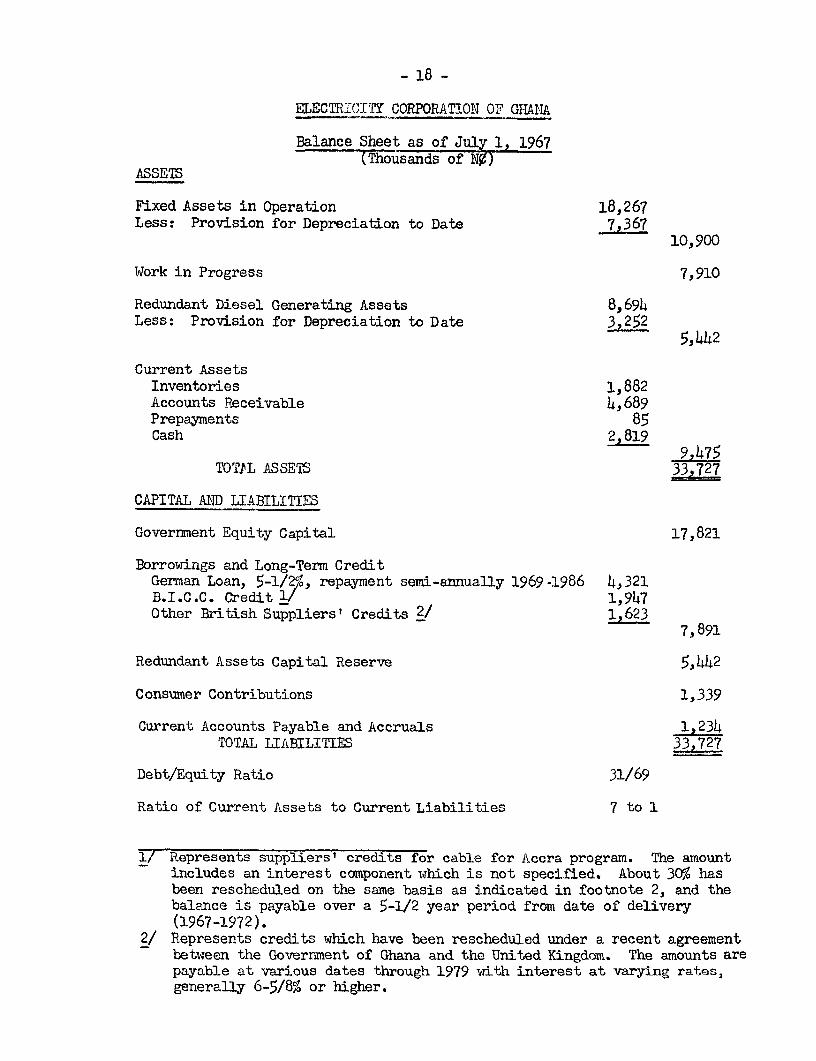
9.09 As indicated by the following summary of the opening balance sheet,the assets transfer agreement provides a satisfactory basis for ECG to com-mence operations. The debt/equity ratio at July 1, 1967 was a conservative31/69 and working capital was ample.
- 18 -
ELECTRICITY CORPORATION OF GNAIIA
Balance Sheet as of July 1, 1967(Thousands of NO)
ASSETS
Fixed Assets in Operation 18,267Less: Provision for Depreciation to Date 7,367
10,900
Work in Progress 7,910
Redundant Diesel Generating Assets 8,694Less: Provision for Depreciation to Date 3,252
5,442
Current AssetsInventories 1,882Accounts Receivable 4,689Prepayments 85Cash 2,819
9,475TOTPL ASSETS 33727
CAPITAL AND LIABILITIES
Government Equity Capital 17,821
Borrowings and Long-Term CreditGerman Loan, 5-1/2%, repayment semi-annually 1969-1986 4,321B.I.C.C. Credit 1/ 1,947Other British Suppliers' Credits 2/ 1,623
7,891
Redundant Assets Capital Reserve 5,442
Consumer Contributions 1,339
Current Accounts Payable and Accruals 1,234TOTAL LIABILITIES 33,727
Debt/Equity Ratio 31/69
Ratio of Current Assets to Current Liabilities 7 to 1
1/ Represents suppliers' credits for cable for Accra program. The amountincludes an interest component which is not specified. About 30% hasbeen rescheduled on the same basis as indicated in footnote 2, and thebalance is payable over a 5-1/2 year period from date of delivery(1967-1972).
2/ Represents credits which have been rescheduled under a recent agreementbetween the Government of Ghana and the United Kingdom. The amounts arepayable at various dates through 1979 with interest at varying rates,generally 6-5/8% or higher.
- 19 -
Fixed Assets
9.10 The Electricity Division kept its accounts on a cash basis inaccordance with the Government budgetary system, and no provision was madefor depreciation of fixed assets. The value of the fixed assets in theopening balance sheet is based on a study made by Preece, Cardew and Rider,consulting engineers to the Division for many years, who were retained tovalue the Division's fixed assets as of December 31, 1966. Their valuationwas made on the basis of original cost or estimated original cost, and itallows for straight-line depreciation at standard rates from the actual orestimated year of acquisition.
9.11 So that the balance sheet would provide a reasonable basis formeasuring the return on capi-tal earned by ECG, accumulated depreciation andthe fixed asset values (except thiose paid for by consumer contributions) havebeen adjusted to reflect the devaluation of Ghana's currency on July 8, 1967,which increased foreign costs as measured in Ghana currency by 43%. Forthis purpose, a conversion factor was determined for each class of asset basedon the estimated foreign exchange element. All work in progress has also beenadjusted accordingly.
Redundant Generating Assets
9.12 Assets at diesel stations which became redundant as a result ofconnection to the VRA grid have been separately classified. These assetswere revalued as in paragraph 9.11 and are offset in thv! balance sheet by acapital reserve until such time as they are sold or brought back into service.As previously noted (see paragraphs 4.10 and 6.08), ECG plans to move certainof the redundant generating assets to existing and new stations not servedby the VRA network, and conversely to close down some existing diesel stationsas the area supplied by MRA power is extended. The net book value of theassets involved will be transferred to and from the capital reserve andgovernment equity accounts. Meamnhile, depreciation on the redundant assetswill be charged against the capital reserve.
Inventories
9.13 Inventories at July 1, 1967 incluled N0727,000 for 11 kv cable,which was bought originally for Accra and is to be used in the constructionprogram for the major cities. Except for this amount, inventories were notrevalued for Ghana's devaluation.
Accounts Receivable
9.14 The control of accounts receivable in the Electricity Division waspoor. While the monthly bills are payable within 28 days of receipt, grossarrears on electricity sales at July 1, 1967 were equal to 56% of the billingsof the previous 12 months. Arrears on Government accounts were especiallyhigh and equalled about twenty months average billings; the State Corporationswere about seven months in arrears; and the balance outstanding on non-govern-ment accounts represented about 3.5 months average billings. The compositionof the accounts receivable at July 1, 1967 was:
- 20 -
N' 000Government Debtors
For electricity consumed 2,607Less adjustment for doubtful billings 315
2,292Other Government obligations 363 2,675
State Corporations 875
Private ConsumersGross receivables 1,960Less provision for bad debts 821 1,139
Total Net Accounts Receivable
9.15 The Government has agreed to pay all arrears on Government andState Corporations accounts no later than the end of 1969. In fact about70% of the arrears on Government accounts and 55% on State Corporationaccounts have already been paid. During negotiations, assurances werealso obtained from the Government that in the future Government organiza-tions will pay for their power consumption promptly.
9.16 Because the consumers's accounts were inadequately controlled,summarized and aged, the auditors report that it was not possible to establishthe gross debtors figure for non-government accounts with any accuracy or toset up a provision for bad debts on a specific basis. Accordingly, the pro-vision on private consumer debts was adjusted so as to leave a net balanceequal to two months estimated average billing, an amount which the auditorsconsider, under all circumstances, fairly states the net value of the accountsreceivable in the balance sheet. Measures to improve billing and collectionprocedures are now being implemented. During negotiations, confirmation wasobtained that this effort will be vigorously pursued.
Liabilities
9.17 The opening balance sheet includes all the liabilities, both long-term and current, which have been identified as the responsibility of ECG.The assets transfer agreement provides tha2t the Government shall be respon-sible for any debts incurred prior to July 1, 1967 which are not listed inthe opening balance sheet.
Audit
9.18 Under the decree establishing it, ECG is required to have its booksand accounts audited each year by an auditor appointed by the ECG Board ofDirectors with the approval of the Government's Auditor-General. Duringnegotiations, ECG agreed toemployindependent auditors satisfactory to IDAand submit annually certified financial statements accompanied by theauditors' report within six months after the close of each calendar year.
- 21 -
Past Earnings Record 1961-1966
9.19 Prior to the establishment of ECG, accounts were kept for theDivision on a cash basis. An attempt has been made to approximate theresults which would have been reported if the accounts had been kept on acommercial basis. To do this, estimates were made of costs not previouslyrecorded, principally depreciation and costs borne by other governmentdepartments, and certain other adjustments were made. The results on thisbasis are shown in Annex 9. Since the figures shown represent estimatesmade on a vary broad basis, they can only be taken as indicative of the trendof the results of the Division over the period.
9.20 The Division's operations apparently were very profitable.Revenues from the sale of energy rose from N05.3 million in 1961 to N08.7million in 1966, or at an average rate of growth of 10% (with the tariffschedule remaining unchanged since May 1, 1960). In the same period, netoperating income, after operating expenses including depreciation but beforeinterest charges which were paid by the Government, increased from N01.4million to N03.6 million, and as a percent of arnual sales revenue, climbedfrom 27% in 1961 to 42% in 1966. lNile an accurate record of the net fixedassets in service was not kept, an approximation of such a base as valuedprior to the 1967 devaluation indicates a rate of return of about 14% in1965 when most of the power sold was generated at ECG's diesel plants, and24% in 1966 when most of the power sold was purchased from URA and very littleof the generating plant was needed in serv-ice.
Proposed Financing Plan
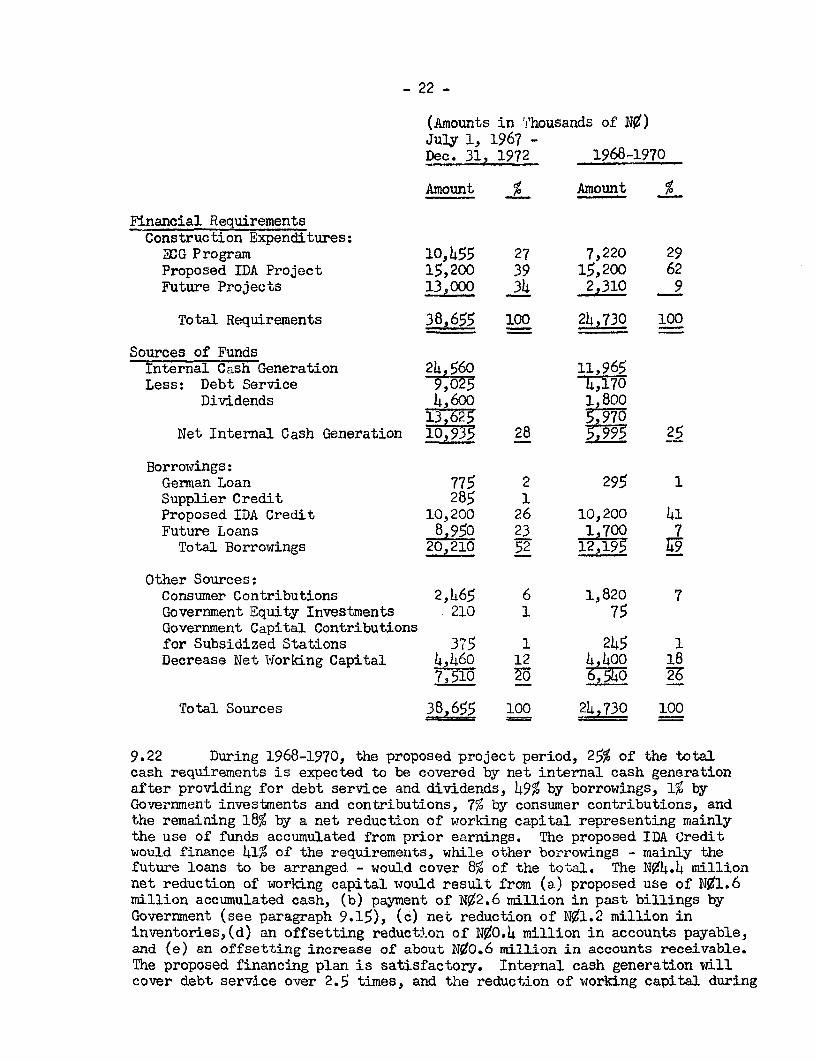
9.21 A forecast of the sources and applications of funds for the 5-1/2year period from July 1, 1967 through December 31, 1972 is attached asAnnex 10. It is summarized in the following table, which shows the financingplan both for the entire period, and for the three year period 1968-1970during which the proposed IDA project will be carried out.
- 22 -
(Amounts in i'housands of N¢)July 1, 1967 -Dec. 31, 1972 1968-1970
Amount % Amount %
Financial RequirementsConstruction Expenditures:3CG Program 10,1455 27 7,220 29Proposed IDA Project 15,200 39 15,200 62Future Projects 13,OOO 34 2,310 9
Total Requirements 38,655 100 24,730 100
Sources of FundsInternal Cash Generation 24 560 11,965Less: Debt Service 94,170
Other Sources:Consumer Contributions 2,465 6 1,820 7Government Equity Investments 210 1 75Government Capital Contributionsfor Subsidized Stations 375 1 245 1Decrease Net Working Capital 4,460 12 4,400 18
7, 10 20 6,5 6
Total Sources 38,655 100 24,730 100
9.22 During 1968-1970, the proposed project period, 25% of the totalcash requirements is expected to be covered by net internal cash generationafter providing for debt service and dividends, 49% by borrowings, 1% byGovernment investments and contributions, 7% by consumer contributions, andthe remaining 18% by a net reduction of working capital representing mainlythe use of funds accumulated from prior earnings. The proposed IDA Creditwould finance 41% of the requirements, while other borrowings - mainly thefuture loans to be arranged - would cover 8% of the total. The N04.4 millionnet reduction of working capital would result from (a) proposed use of N01.6million accumulated cash, (b) payment of N02.6 million in past billings byGovernment (see paragraph 9.15), (c) net reduction of N01.2 million ininventories,(d) an offsetting reduction of N0O.4 million in accounts payable,and (e) an offsetting increase of about N0O.6 million in accounts receivable.The proposed financing plan is satisfactory. Internal cash generation willcover debt service over 2.5 times, and the reduction of working capital during
- 23 -
the construction phase should not impair the financial strength of ECG.During negotiations the Government agreed that it will make available anyfunds needed to complete the proposed project.
9.23 Agreement was reached during negotiations on a subsidiary loanagreement under which the proposed IDA Credit would be relent by the Govern-ment of Ghana to BOG at an interest rate of 6-1/4% per annum, with the princi-pal repayable in semi-annual installments over a period of 17 years after agrace period of three years. The principal and interest will be repayablein Ghana currency in amounts equivalent to the foreign currencies drawn downunder the Credit, and the foreign exchange risk will be borne by ECG.
Estimated Future Earnings
9.24 Estimated annual income statements for ECG for the period 1966-1972are shown in Annex 11. The forecasts for 1967 onward are based on the marketforecast previously described (see paragraphs 5.02 and 5.03) and on a carefulestimate of operating expenses prepared by Cooper Brothers from informationprovided by and agreed with ECG. Income has been estimated on the basis ofthe agreement reached during negotiations that tariffs will be adjusted asnecessary to maintain a minimum rate of return of 8% on average net fixedassets in service plus working capital. This rate of return, and the amountof net operating income in the forecast period, are lower than achieved inthe past. Nevertheless, as previously noted, the forecast earnings will besufficient to permit ECG to meet its needs on the basis of a reasonablefinancial plan and to pay substantial dividends on the Government's equityinvestment.
9.25 Some of the decline in the forecast operating income, compared tothe notional past results, may be attributable to underestimating expensesborne by other government departments prior to July 1, 1967. In addition,increases in expenses after July 1, 1967 are expected due principally tothe following factors:
(a) Increased Salaries and Wages
The expense forecast allows for substantial increases in salary andwage levels to be more competitive with those paid in private industry (seeparagraph 4.07) in 1967 and for further increases in future years both fornormal increments and some further improvement in competitive levels. Allow-ance is also made for increases in staff to fill existing vacancies and forcontinued employment of generating staff at the redundant stations until theend of 1969 when all will be shut down. It is possible that the improvedefficiency which may result from higher pay scales may make it unnecessaryto fill all vacancies. Procedures for reviewing and controlling staff levelsare being introduced by MCG.
(b) Increased Cost of Power Purchased from VRA
The VRA tariff to ECG was increased 10lo effective September 1, 1967.The decision that this increase was needed was made prior to the Ghana deval-uation. VRA may find it necessary to make further increases in its charges
- 24 -
to ECG if VRA is to attain a reasonable earnings level, but no allowance forthis possibility has been made in the forecasts shown in Annex 11.
(c) Increased Costs as Result of Devaluation
The forecast allows for an increase of 43% in the cost of importeditems and a substantial expected increase in local purchases having a foreigncomponent as a result of the devaluation of Ghana's currency on July 8, 1967.
(d) Increased Depreciation Expense
The Ghanaian devaluation has also caused an increase in depreciationexpense because of both the revaluation of existing assets and the highercosts of new construction. The higher depreciation expense also reflects thesubstantial additions to assets in service under the construction program.The annual depreciation provision is equal to about 4Ij of gross fixed assetsin service and contributes substantially to internal cash generation.
9.27 To maintain a minimum rate of return of 8% each year, tariff in-creases would be needed which would produce increased revenues of about 3-6%duringthe period 1969-1972. Even with such increases, the average revenueper kwh would continue to be very reasonable and would decline from NP 2.9(US cents 2.8) in 1968 to NP 2.6 (US cents 2.5) in 1972. On this basis, netoperating income, which is estimated to dec:line from N03.0 million in 1967to N02.4 million in 1968, would increase gradually to N03.4 million in 1972.During this period, interest charges are expected to increase markedly butwould still be covered at least 2.5 times. Net income would decline to alow point of N01.6 million in 1969 and thereafter increase to N¢2.1 millionin 1972. ECG's financial position should be such that dividend payments offrom 4% to 6% on the Government's equity investment should be possible begin-ning about mid 1969.
Future Financial Position
9.28 Annex 12 contains the opening balance sheet of ECG as of July 1,1967 and forecast balance sheets as of December 31 of each of the years 1967through 1972. During this period, gross fixed assets in service will in-crease from N018.3 million to N062.0 million, an increase of 239%. TheGovernment equity increases, as a result principally of accumulated retainedearnings, from N017.8 million to N024.4 million. A substantial increase isforecast for long-term debt from N07.9 million to N024.0 million, but thedebt/equity ratio which would increase from 31/69 to 50/50 would still besatisfactory.
Debt Limitation
9.29 In order to be assured that a satisfactory financial position willbe maintained throughout the term of the subsidiary loan agreement, a long-term debt limitation is included in the credit documents. This provides thatECG shall not incur any debt, without prior IDA approval, unless its netrevenues before provision for depreciation for the fiscal year next precedingsuch incurrence or for a later 12 month period ended prior to the incurrenceshall be at least 1.5 times the maximum debt service for any succeeding fiscal
- 25 -
year on all debt, including the debt to be incurred. Under the proposedfinancial plan it is expected that ECG would meet this test throughout thefive-year period, 1968-1972.
Construction Expenditure Limitation
9.30 ECG also agreed during negotiations that, during the period1968-1970 when the proposed IDA project would be implemented, it will notmake any additions to its construction program without IDA's consent.
10. CONCLUSIONS
10.01 The project is technically sound, the estimated cost is reasonableand the arrangements for construction and commissioning are satisfactory.
10.02 The rehabilitation of the power distribution facilities in Accra,Kumasi, Sekondi-Takoradi and various secondary centers, and the expansionof these and other distribution systems are necessary to meet the expecteddemand. In addition better utilization of power from the Volta River hydro-electric project will be achieved.
10.03 The proposed plan for financing construction is reasonable. About40% of the funds required for the expansion program from July 1, 1967 through1972 is expected to be provided by ECG's earnings (including accumulatedpast earnings), 52% from borrowings, and 8% from other sources, principallyconsumer contributions. The Government and ECG have agreed to adjust tariffsas necessary to permit ECG to maintain a rate of return of 8% on its aver-age net fixed assets in service plus working capital. It is estimated thatthis will require tariff increases producing 3-6% more revenues in theperiod 1969-1972. On this basis, debt service will be adequately covered,and dividend payments of from 4% to 6% on the Government's substantialequity investment in ECG should be possible beginning about mid 1969. Thedebt/equity ratio and working capital position will be satisfactory.
10.04 The construction program to be carried out during 1968-1970 wouldbe a suitable basis for an IDA Credit of US$10 million equivalent to theGovernment of Ghana to be relent to ECG at an interest rate of 6-1/4% for20 years, including a three-year grace period. During negotiations, thefollowing assurances were obtained:
(i) Future appointments to the posts of M~anaging Director, ChiefFinancial Officer and Chief Engineer of ECG will be made onlyafter prior consultation with IDA (paragraph 4.06);
(ii) technical consultants will be retained through 1971, and manage-ment consultants 7.s long as needed to help establish soundbusiness and accounting procedures (paragraphs 4.08 and 4.09);
(iii) ECG's tariffs will be adjusted as necessary to maintain a minimumrate of return of 8% on average net fixed assets in service plusworking capital, and a consultant will be retained in 1968 to de-termine the changes in tariffs needed to accomplish this andimprove the present tariff structure (paragraphs 9.02 and 9.06);
- 26 -
(iv) the Government shall see to it that all arrears on Governmentand State Corporation accounts owed to ECG as of July 1, 1967are paid by the end of 1969, and that in the future Governmentagencies and departments make full and prompt payment for theirpower consumption; ECG shall make every effort to improve itsbilling and collection procedures (paragraphs 9.15 and 9.16);
(v) ECG shall not incur any debt without IDA's consent, unless itsmaximum annual debt service is covered by cash earnings at least1.5 times (paragraph 9.29);
(vi) during the period 1968-1970, no additions to the constructionprogram will be made without IDA's consent, and no major lowtension projects will be undertaken at certain up-countrystations until the consultant's report expected by the end of1968 has been reviewed by IDA (paragraphs 6.07 and 9.30).
ELECTRICITY CORPORATION OF GHANA: DISTRIBUTION EXPANSION AND DEVELOPMENT PROGRAMAVAILABILITY OF VOLTA RIVER POWER(MINIMUM SMELTER LOAD) ____ _
1,100 I _ _, __I-KPONG HYDRO SCHEMiE OR ALTERNATIVE
UNITS S AND 6 IN SERVICE 1/1/72. 01022 MW
i,ooo r1l ,00I ,ooINSTALLATION PERIOD CONSTRUCTION PERIOD KPONG HYDRO SCHEME
UNITS S AND INSTALLED CAPACITY 6 UNITS @ 147 MW 882 MW
900 INSTL-LE 900
-~~~~T 7. " 2 MW
800 - __ .- _ __ _ __CAPABILITY WHEN HEAD AVAILABLE... _ _8
3/ Diesel Stations Accra Utilised for Peaking Purpose
February 1968
ANNEX 2Page 1
EIECTRICITY CORPORATION OF GIIAA
Basis for Sales Forecast
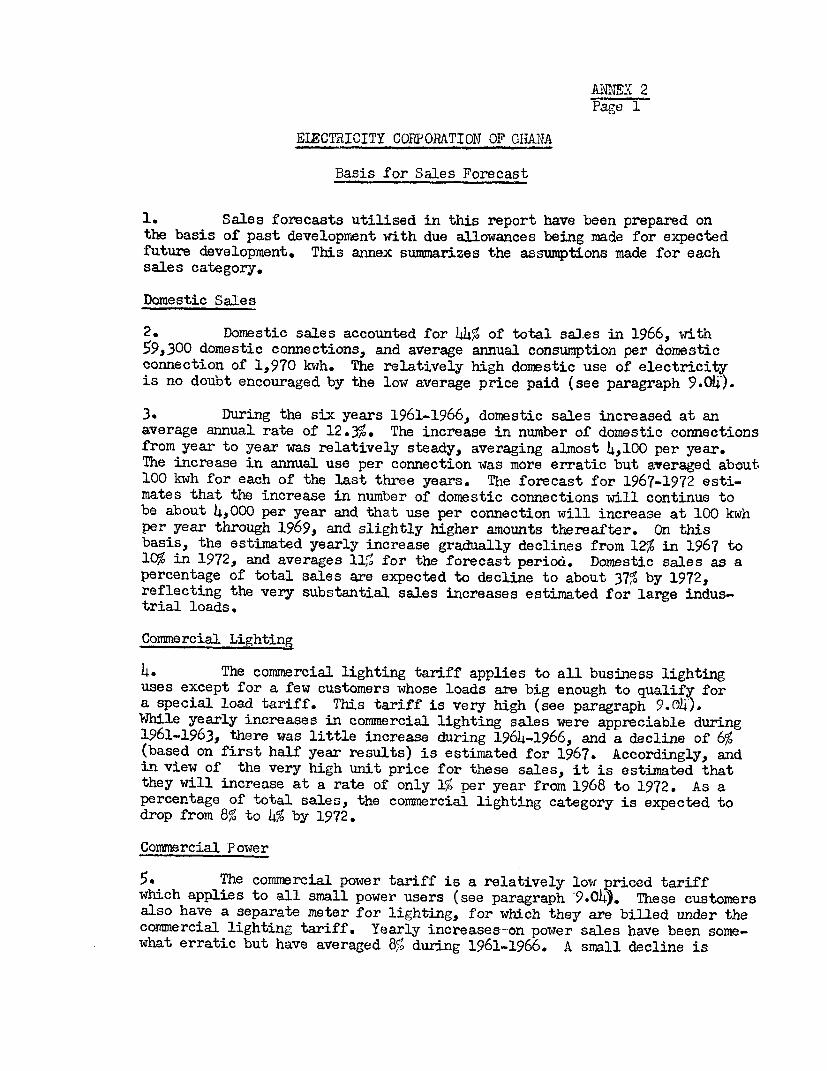
1. Sales forecasts utilised in this report have been prepared onthe basis of past development with due allowances being made for expectedfuture development. This annex summarizes the assumptions made for eachsales category.
Domestic Sales
2. Domestic sales accounted for 44% of total sa]es in 1966, with59,300 domestic connections, and average annual consumption per domesticconnection of 1,970 kwh. The relatively high domestic use of electricityis no doubt encouraged by the low average price paid (see paragraph 9.0).
3. During the six years 1961-1966, domestic sales increased at anaverage annual rate of 12.3%. The increase in number of domestic connectionsfrom year to year was relatively steady, averaging almost 4,100 per year.The increase in annual use per connection was more erratic but averaged about100 kwh for each of the last three years. The forecast for 1967-1972 esti-mates that the increase in number of domestic connections will continue tobe about 4,000 per year and that use per connection will increase at 100 kwhper year through 1969, and slightly higher amounts thereafter. On thisbasis, the estimated yearly increase gradually declines from 12% in 1967 to10% in 1972, and averages 11% for the forecast period. Domestic sales as apercentage of total sales are expected to decline to about 37% by 1972,reflecting the very substantial sales increases estimated for large indus-trial loads.
Commercial Lighting
4. The commercial lighting tariff applies to all business lightinguses except for a few customers whose loads are big enough to qualify fora special load tariff. This tariff is very high (see paragraph 9.04).While yearly increases in commercial lighting sales were appreciable during1961-1963, there was little increase during 1964-1966, and a decline of 6%(based on first half year results) is estimated for 1967. Accordingly, andin view of the very high unit price for these sales, it is estimated thatthey will increase at a rate of only 1% per year from 1968 to 1972. As apercentage of total sales, the commercial lighting category is expected todrop from 8/% to 4% by 1972.
Commercial Power
5. The commercial power tariff is a relatively low priced tariffwhich applies to all small power users (see paragraph 9.O4). These customersalso have a separate meter for lighting, for which they are billed under thecommercial lighting tariff. Yearly increases-on power sales have been some-what erratic but have averaged 8%o during 1961-1966. A small decline is
AMNEX 2
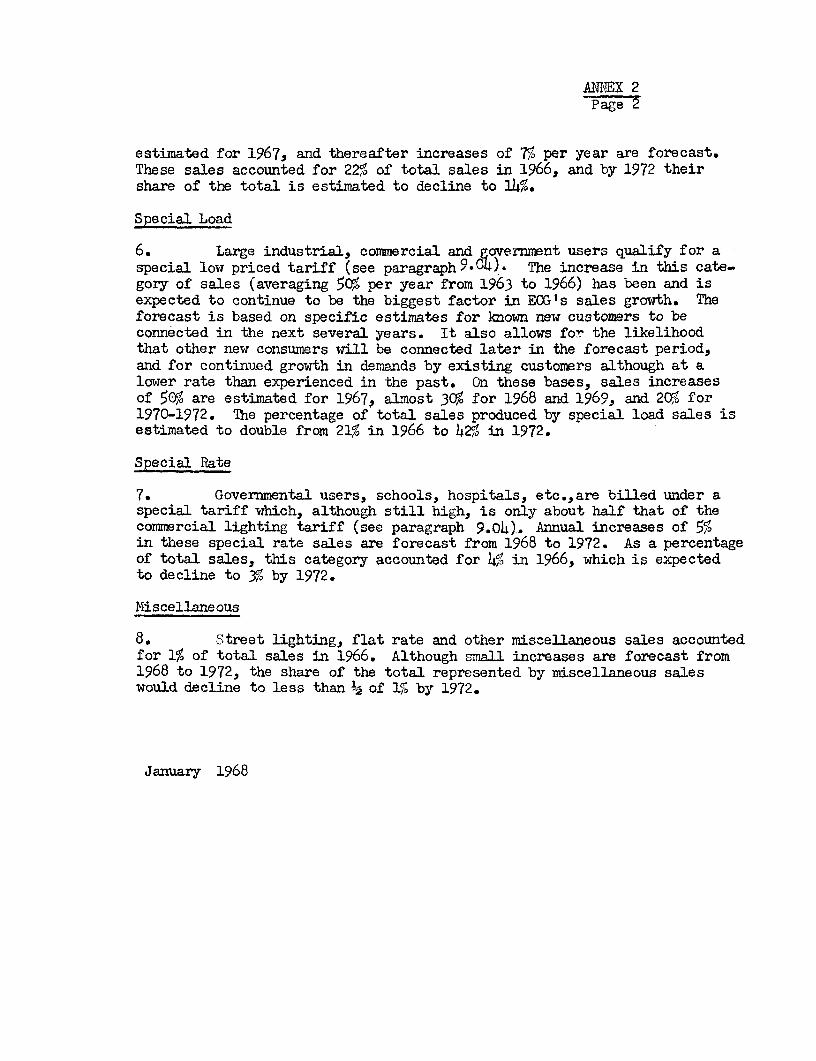
estimated for 1967, and thereafter increases of 7% per year are forecast.These sales accounted for 22% of total sales in 1966, and by 1972 theirshare of the total is estimated to decline to 14%.
Special Load
6. Large industrial, commercial and government users qualify for aspecial low priced tariff (see paragraph9-O ). The increase in this cate-gory of sales (averaging 50%0 per year from 1963 to 1966) has been and isexpected to continue to be the biggest factor in ECG's sales growth. Theforecast is based on specific estimates for known new customers to beconnected in the next several years. It also allows for the likelihoodthat other new consumers will be connected later in the forecast period,and for continued growth in demands by existing customers although at alower rate than experienced in the past. On these bases, sales increasesof 5CF16 are estimated for 1967, almost 3C% for 1968 and 1969, and 2C, for1970-1972. The percentage of total sales produced by special load sales isestimated to double from 21% in 1966 to h42l in 1972.
Special Rate
7. Governmental users, schools, hospitals, etc.,are billed under aspecial tariff which, although still high, is only about half that of thecommercial lighting tariff (see paragraph 9.04). Annual increases of 5%in these special rate sales are forecast from 1968 to 1972. As a percentageof total sales, this category accounted for 14% in 1966, which is expectedto decline to 3% by 1972.
Miscellaneous
8. Street lighting, flat rate and other miscellaneous sales accountedfor 1% of total sales in 1966. Although small increases are forecast from1968 to 1972, the share of the total represented by miscellaneous saleswould decline to less than ½g of 1% by 1972.
January 1968
HLECTRICITY OUiORPTION OF OHUNA
Distribution Expasion and Dasvlopeot YrograM
Energy Sales
J.2932IC CO1r92RCIAL LIGHT COI4MERCIAI, PMMER SPECIAL LOAD 1/ SPECIAL RATE 2/ OFlER 3/ T1FAL
1/ Special Load: Large Por Cowmrs, e.g. Tem Steel Mll, University of rhane, Korlebu Hospital, Bum I4Alitary CA, etc.
2/ Special Rate: Govsrnment Agencies, Schools, Hospitals, end other nonprofit organisations.
3/ Other; Street lighting, flat rate c.msrs, slot _tre (eliminated September 1966), etc. Includes SpecialLoad in 1961 and 1962 and Special Rate in 1961-1964.
February 1968
ELECTRICITY CORPORATICN OF GRANd
Distrbution Expansion and Develo.pment Program 1966-1972
List of Quantities
Distribution Systeam
program Covered byOerman Loan, British Supplier Program Covered by Program Covered by
Credits or ECG Propoed ISA-Credit Future Loan/Credit
16 16 16Sekondi Smaller Sekondi Saller Sekondi Smaller Total
Total of prngrcn covered by German Loan, Total of crogram covered by proposed Total of progrm to be covered byBritish Sosilier Credit or ECO IDA Credit future lorn/credit
1InstalLtion cf Plc-tCables included in 03 kv ard Foreign Currency N5 ?,Q23 Foreign Currency NV 7,34L Foreign Currency NO 3,52711 kv iCble Work Local Currency NV 3,282 Local Currency N9 3.290 Local Currercy NV 1.415
2 Mcteri 1 only
' Installation component TOTAL NO 13,175 TOTAL NJ 13.294 TOTAL W 4.942Including inetallationIncluding equipment for existing stations
sEquipment transferred from Accra
may 15, 1968
ELECTRICITY CORPORATION OF GHANA
Transmission Lines Included in
Distribution Expansion and Development Program 1966-1972
Cost Estimate (In Thousands of NOZ. 1 NO = 0.98 US$)
Financed by ECG Covered by Proposed IDA-Credit Future Loan Total 1966-1972 ProgramService Number LengthVoltage of in Foreign Local Foreign Local Foreign Local Foreign Local
LINE kv Circuits Miles Currency Currency Total Currency Currenec Total Currency Currenc Total Currency Currency Total
1/ Estimated costs of unspecified future industrial load connections O NVt 200,00?each, 2 per arnum 1970-1972 only
2/ Subject to review when consultants report available (12/31/68)Utilizing available Diesel GeneratorsF Pour small substations
May 15, 1968
ANNEX 7
EISCTRICITY CORPORATION OF GlANA
Description of Tariff Schedules
A. Published Tariffs
(i) Domestic - this applies to sales to private residences; it is atwo part tariff consisting of a monthly fixed charge based onfloor area plus a unit charge for each kwh consuned of 1.6 NP inthe four major cities and 2.5 NP at other stations.
(ii) Commercial Lighting - this applies to sales for lighting purposesin offices, factories and shops; it consists of a monthly minimumcharge of 2 NP plus a unit charge for each kwh consumed of 9.2 NPin the four major cities and 10 NP at other stations.
(iii) Commercial Power - this applies to conmmrcial and industrial powersupplies other than lighting; it consists of a monthly fixed chargebased on the KVA or brake horsepower installed, plus a unitcharge for each kwh consumed of 1.6 NP in the four major citiesand 2.5 NP at other stations.
(iv) Flat Rate Lighting - this applies to unmetered sales to a relativelyfew customers at small stations.
B. Special Tariffs
(i) Special Load - this applies to large consumers, generally thosewho have installed capacity of 200 KVA or more, and coversall their uses, including lighting. The tariff is negotiatedindividually with each customer and consists of a monthly orannual maximum demand charge plus a unit charge per kwh whichbecomes progressively lower as the load factor increases.
(ii) Special Rate - this applies to sales to the military, hospitals,schools, and non-profit organizations. It is similar to thecommercial lighting tariff, but the unit charge is much lower:5 NP to non-profit organizations, 6 INP to military, and 7 NPto hospitals.
January 1968
ELECTRICITY CORPORATION OF GHANA
Distributimc huandio and DIelopent Progra. 1 Now Cedi (NO) = 0.98 USs
Ravenam Statistics 1 New Pesawa (NP) = 0.98 USCents
DOFESTI.: COWtERCIAL LIGHT COMWERCIAL POWER SPECTAL LOAD Y/ SPECIAL RATE OTHER 1/ T;TAL
Average Average Average Average Average Average AveragePrjico/i" Price/kwh Price/kwh Price/kwh Price/kwh Price/kwh Price/kvh
Pvvo nua Sold S of Revenue Sold % of Revenue Sold % of Revenue Sold % of Revenue Sold 9 of Revenue Sold J of Rerenue SoldYrar (9iillon Nit (N.P.) Total (Million N) R.P.) Total (Million W) (N.P.) Total (Million80) (N.P.) Total (MillionW) (N.P.) Total (Million ) (N.P.) Total (MillionN3) (N.F.)
lTDeoxal Load: Large Power Conaueers, a.g. Ta Steel Mill, Iiversitfr of Ohana, Korlebu Hospital, ibr Military COW, etc.
2/ Special Rate: Government Agencies, Sohools, Hospitals, and other non-profit organi-ationa.
3/ Other: Street lighting, flat rate consuners, slot meters (eliminated September 1966), etc. Includes Special Load in 1961 and 1962 and Special Rate in 1961_1964.
4/ Based on tariff schedule currently in force.
5/ Assuning tariffs are adjusted to achieve a minilux 8% return (see Annex 11). Since the tariffs required for this purpose are to be determined after a review of the present tariff structwre, only totai reve:.ueshave been estimated.
May 15, 1968IDA
GHANA ELECTRICITY DIVISION, MINISTRY OF WORKS AND HOUSING VSummary of Income Statements 1961-1966 2/
(Thousands of NW)
For Year Ended December 31, 1961 1962 1963 1964 1965 1966
GWH sold 143.6 164.9 183.5 212.1 238.8 267.9Per kwh sold (in N.P):Average sales price 3.7 3.6 3.6 3.5 3.4 3.2Other operating costs 2.7 2.6 2.4 2.3 2.2 1.9Net operating income 1.0 1.0 1.2 1.2 1.2 1.3
Net Operating Income 1,1410 27 1,670 28 2,170 33 2,450 33 2,870 36 3,610 42
1/ Predecessor of the Electricity Corporation of Ghana.
2/ During 1961-1966, the Division's accounts were kept on a cash basis and published annual reports were for varying accountingperiods. Only one was for a calendar year, and the others were for different 12 and 15 month periods. To provide moreuseful figures for comparison, past and present, all the reports have been adjusted to show approximate results for thecalendar year. This was done on a proportionate basis since the figures for individual months were not readily available.The above table has also been adjusted so far as feasible to a commercial basis, by showing revenues on a billing ratherthan a cash receipts basis and by including in expenses estimated amounts for the annual charge for depreciation, the pro-vision for bad debts, and the charges borne by other government departments. During 1966 a commercial accounting system wasgradually introduced and the results recorded for the year are not completely comparable with earlier years. For example,in 1966 the estimated amount of "charges borne by Other Government Departments" were allocated functionally among individualaccounts. I
May 15, 1968 soIDA
ANNEX 10
ELECTRICITY CORPORATION OF GHANA
Estimated Sources and Applications of Funds, July 1, 1967 - December 31, 1972(Thousands of N¢)
July 1 - 5½ Year TotalDec. 31 Year Ending Decemner 31 July 1, 1967 _
Pate base 14,905 10,145 19,170 31,185 37,305 39,755 43,075
ThOe i arose in operatino expenses whish is reflected in an increase in the operatmg ratio from 58% in 1966 to 69% in 1967 and to about 77% in 1968-1972, is dueprircipally to ths following factors: (i) probable underestimates of expenses borne by other government departments prior to Joly 1, 1967, when the operationsof SBO as an autcnoorsus corporation begar; (ii) substantial increases in salary and wage levels to be more competitive with thcse payable in private industryfrom November 196'; (iii) a 10% Increase in cost of power purchased from VRA fram september 1967, and (tv) increased depreciation charges as a result of thei.ghor capital costs due to devaluation in July 1967 and substantial additions to assets in service.
2/ lnterest charges and net income for 1966 are not shown, since the Government which serviced the debt made no allocations for payments applicable to theilectricity Division.
3, Sale- ani reverso as aotuallv reported; expense aata for 19fi is estinated.
May is, 1969IDA
ANNEX 12
ELECTRICITY CORPORATION OF GHANA
Actual and Estimated Balance Sheets(Thousands of N0)
Total Capital and Liabilities 33,727 35,735 47,920 08 ,0 56,330
RATIOS:Debt/Equity Ratio 31/69 30/70 41/59 14/56 45/55 47/53 50/50
Current Assets to Current Liabilities 7.0 4.7 2.9 1.9 1.9 2.3 2.2
l/ Generating assets made redundant by the introduction of VRA power.
2/ Represents suppliers' credit for cable for Accra program. The amount includes an interest component which isnot specified. About 30% has been rescheduled on the same basis as indicated in footnote 3, and the balanceis payable over a 5-1/2 year period from date of delivery (1967-1972).
3J Represents credits which have been rescheduled under a recent agreement between the Government of Ghana andthe United Kingdom and other creditor countries, the amounts are payable at various dates through 1979 withinterest at varying rates, generally 6-5/8% or higher.
May 15, 1968IDA
ELECTRICITY CORPORATION OF GHANADISTRIBUTION EXPANSION & DEVELOPMENT PROGRAM