28
Prepared by: Carrie Levy, Ph.D. Kate Julian, Ph.D. Research, Evaluation, & Assessment Evanston Township High School April, 2014 Restructured Freshman Year Initiative Evaluation Report #1
Prepared by: Carrie Levy, Ph.D. Kate Julian, Ph.D.
Research, Evaluation, & Assessment
Evanston Township High School
April, 2014
RestructuredFreshmanYearInitiativeEvaluationReport#1

Acknowledgements
i
Evanston Township High School would like to express a special thank you to the following individuals
who provided their valuable time and expertise to this evaluation report: David Figlio, Ph.D.,
Northwestern University; Charles Whitaker, Northwestern University; John Diamond, Ph.D., University
of Wisconsin‐Madison; Shazia Miller, Ph.D., American Institutes for Research; and Larry Friedman, Ph.D.,
American Institutes for Research.
Background
Evanston Township High School’s (ETHS) goal is to ensure that the greatest number of students take challenging honors‐level classes and develop the academic skills and capital required to succeed in the competitive and rapidly changing 21st century. To meet this goal, ETHS has begun to grapple with a long‐identified problem in which lower than desired numbers of 10th through 12th grade students had access to the challenging curriculum available in AP and honors‐level courses. Historically, the opportunity to earn honors credit was based on placement criteria that did not necessarily take into account how well students performed in class. To address this problem, ETHS restructured its 1 humanities and biology courses, developing a model that affords all first‐year students the opportunity to work toward honors credit. The changes to these courses are designed to improve learning for all ETHS students and to create a school where many more students reach their full academic potential. Pedagogically, this is a heady charge. To achieve the best outcomes, ETHS is providing professional development for teachers to help them succeed in the implementation of the new curriculum. Under the new model, all 9th grade students in the 1 humanities and biology courses receive rigorous instruction aligned with Advanced Placement (AP) frameworks, ACT College Readiness, and Common Core Standards. This affords every entering student the opportunity to demonstrate the depth and breadth of his/her skills, and to earn honors credit. A multi‐year evaluation plan has been developed to look at short‐, medium‐, and long‐term outcomes related to this initiative. This report reflects the first full year of implementation for both the 1 humanities and biology courses.
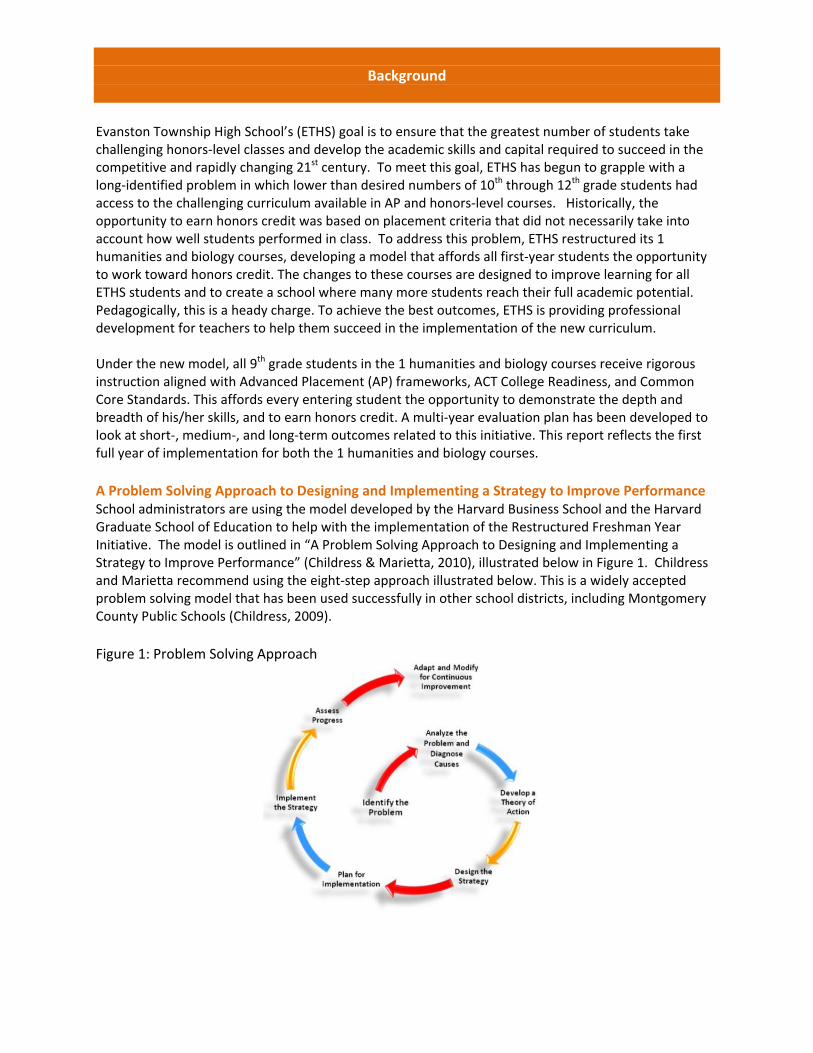
A Problem Solving Approach to Designing and Implementing a Strategy to Improve Performance School administrators are using the model developed by the Harvard Business School and the Harvard Graduate School of Education to help with the implementation of the Restructured Freshman Year Initiative. The model is outlined in “A Problem Solving Approach to Designing and Implementing a Strategy to Improve Performance” (Childress & Marietta, 2010), illustrated below in Figure 1. Childress and Marietta recommend using the eight‐step approach illustrated below. This is a widely accepted problem solving model that has been used successfully in other school districts, including Montgomery County Public Schools (Childress, 2009).
Figure 1: Problem Solving Approach
2
Theory of Action As illustrated in Figure 1, the problem solving model required administrators to develop a Theory of Action. The Restructured Freshman Year Initiative’s Theory of Action is summarized in Dr. Witherspoon’s recommendation to the D202 Board of Education:
This recommendation to restructure the freshman experience is designed to benefit all students by creating a stronger learning environment—to assure that high achievers are challenged at the highest level and held to the highest standards; to assure that far more 9th graders are taking challenging classes; to create pathways for many more students to take honors and advanced classes at ETHS; and to raise expectations for all students. Those achieving at the top will benefit from increased academic standards and skills, and those capable of greatly improved achievement will be supported in meeting much higher expectations.
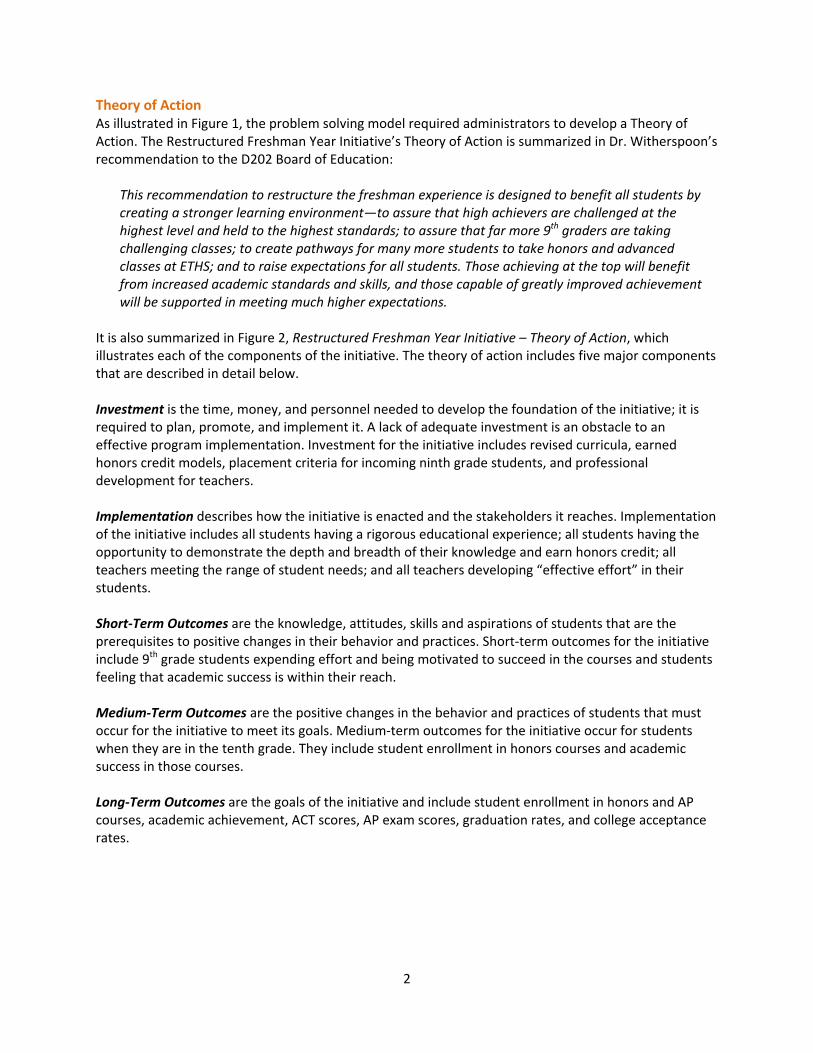
It is also summarized in Figure 2, Restructured Freshman Year Initiative – Theory of Action, which illustrates each of the components of the initiative. The theory of action includes five major components that are described in detail below. Investment is the time, money, and personnel needed to develop the foundation of the initiative; it is required to plan, promote, and implement it. A lack of adequate investment is an obstacle to an effective program implementation. Investment for the initiative includes revised curricula, earned honors credit models, placement criteria for incoming ninth grade students, and professional development for teachers. Implementation describes how the initiative is enacted and the stakeholders it reaches. Implementation of the initiative includes all students having a rigorous educational experience; all students having the opportunity to demonstrate the depth and breadth of their knowledge and earn honors credit; all teachers meeting the range of student needs; and all teachers developing “effective effort” in their students. Short‐Term Outcomes are the knowledge, attitudes, skills and aspirations of students that are the prerequisites to positive changes in their behavior and practices. Short‐term outcomes for the initiative include 9th grade students expending effort and being motivated to succeed in the courses and students feeling that academic success is within their reach. Medium‐Term Outcomes are the positive changes in the behavior and practices of students that must occur for the initiative to meet its goals. Medium‐term outcomes for the initiative occur for students when they are in the tenth grade. They include student enrollment in honors courses and academic success in those courses. Long‐Term Outcomes are the goals of the initiative and include student enrollment in honors and AP courses, academic achievement, ACT scores, AP exam scores, graduation rates, and college acceptance rates.
3
Figure 2: Restructured Freshman Year Initiative – THEORY OF ACTION Model
Background InvestmentWhat we invest.
Shaded items are not included in this report and will be evaluated in later reports.
‐ All teachers use strategies to differentiate
instruction based on student need
‐ Students achieve academically as measured by
course grades in 1 humanities and/or biology.
‐ Professional
development for
teachers
‐ Professional
development for
teachers
Biology:
‐ All students have the opportunity to demonstrate
the depth and breadth of their skills and earn
honors credit
1 Humanities and Biology:
All biology students receive rigorous instruction:
‐ aligns with the AP Biology Curriculum Framework
What medium-term results are. What the ultimate impact is.→
Honors designation
based on placement
critera that do not
account for students'
performance in course
→→
‐ Curriculum
‐ Earned Honors Credit
Model
‐ Placement critieria for
incoming 9th graders
‐ Curriculum
Lower than desired
number of 10th‐12
th grade
students are successful
in Honors and AP‐level
courses
Not all students have
access to the best
curriculum
Not all students have the
opportunity to earn
honors credit
1 Humanities:
‐ Earned Honors Credit
Model
‐ Placement critieria for
incoming 9th graders
All 1 humanities students receive rigorous
instruction:
‐ aligns with AP, ACT College Readiness and
Common Core Standards
‐ includes reasoning, analysis, collaboration,
writing, synthesizing and creating
‐ includes significant amounts of reading and
writing
Outcomes
Short‐Term Medium‐Term Long‐Term
Implementation→What we do and who we reach. →
(9th Grade)
What short-term results are.(10
th Grade) (11
th and 12
th grades)
Students expend effort to succeed
in 1 humantiies and/or biology
classes as measured by student
surveys.
Students are motivated to succeed
in 1 humanities and/or biology
classes as measured by student
surveys.
Increase in enrollment in honors
courses.
Increase in college acceptance
rates.
Increase in enrollment in honors
and AP courses.
Increase in academic achievement
as measured by course grades and
GPA.
Increase in graduation rates.
Increase in academic achievement
as measured by course grades and
GPA.
Increase in ACT scores.
Increase in AP Exam scores.
Increase in PLAN scores (English,
Science).
Students feel they have control
over their success in 1 humanities
and/or biology classes as
measured by student surveys.
Evaluation of the Restructured Freshman Year Initiative
4
To monitor the Restructured Freshman Year Initiative, the District 202 Board of Education requested that ETHS’ administration evaluate it beginning in 2012‐13, the first full year of implementation. The Theory of Action Model (Figure 2) provides the foundation for the evaluation, this report, and future reports.
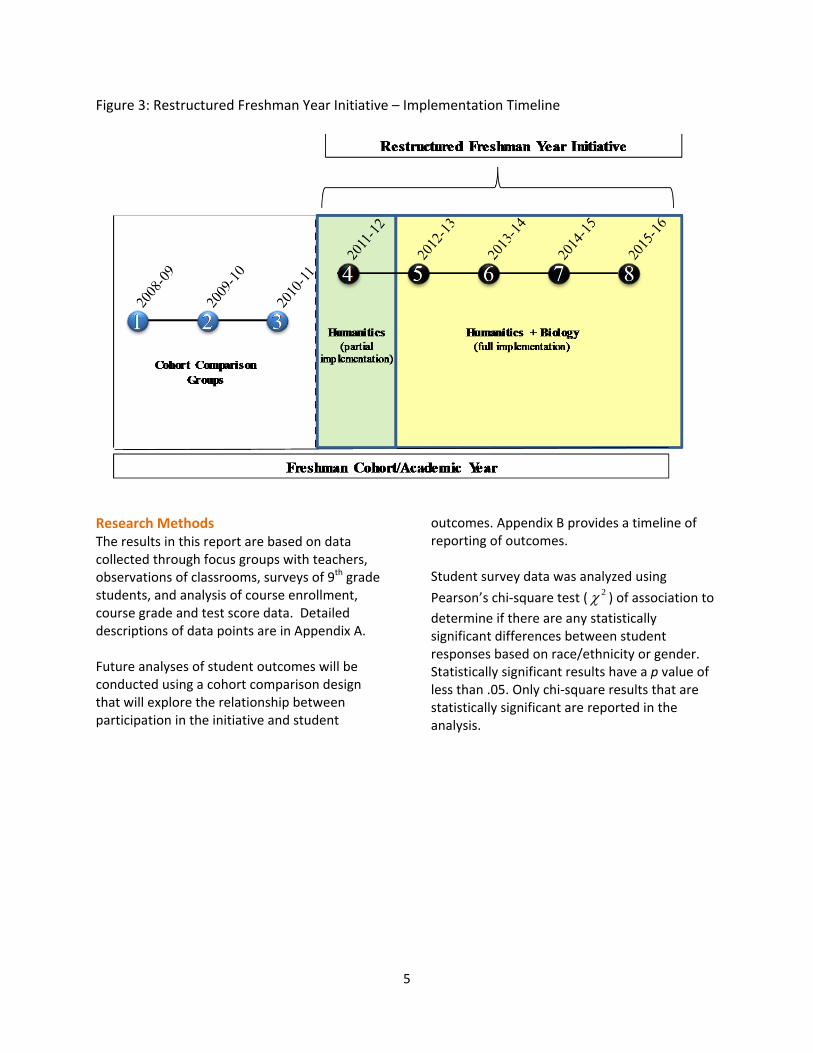
Evaluation Report #1 Theory of Action. This report assesses progress toward realizing the Theory of Action. It is not a final evaluation report, but a waypoint for use in adapting and improving the initiative. The Theory of Action Model (Figure 2) provides a guide to this report. The items shaded in gray are excluded, and will be addressed in future reports. Implementation Timeline. The timeline of the initiative is laid out in Figure 3.
2008‐09 through 2010‐11: 9th graders were sorted into academically leveled tracks in 1 humanities and biology courses based on their 8th grade EXPLORE or MAP scores. These three groups of 9th grade students are called “comparison cohorts” or “cohort comparison groups.”
2011‐12: 9th graders participated in the restructured 1 humanities course, but the biology course was unchanged from previous years. This group is called the “partial implementation cohort.”
2012‐13: 9th graders participated in both the restructured 1 humanities and biology courses. This group is called the “full implementation cohort.”
Contents of This Report. This report reflects the initiative’s first year of full implementation (2012‐13). It includes information about the development of the 1 humanities and biology curricula; implementation of the curricula (1 humanities – 2011‐12 and 2012‐13; biology – 2012‐13), short‐term outcomes (1 humanities – 2012‐13 cohort); and medium‐term outcomes (1 humanities – 2012‐13 cohort); limitations to the evaluation; and next steps. Data from 2011‐12 is excluded from the analysis since 2011‐12 was a partial implementation year. This and future evaluation reports will compare outcomes from the comparison cohorts (2008‐09~2010‐11) to those of the full implementation cohorts starting with the 2012‐13 cohort.
5
Figure 3: Restructured Freshman Year Initiative – Implementation Timeline
Research Methods The results in this report are based on data collected through focus groups with teachers, observations of classrooms, surveys of 9th grade students, and analysis of course enrollment, course grade and test score data. Detailed descriptions of data points are in Appendix A. Future analyses of student outcomes will be conducted using a cohort comparison design that will explore the relationship between participation in the initiative and student
outcomes. Appendix B provides a timeline of reporting of outcomes. Student survey data was analyzed using
Pearson’s chi‐square test ( 2 ) of association to
determine if there are any statistically significant differences between student responses based on race/ethnicity or gender. Statistically significant results have a p value of less than .05. Only chi‐square results that are statistically significant are reported in the analysis.
Evaluation Findings – Investment
6
Curriculum 1 humanities and biology courses were revised to align to Advanced Placement (AP) frameworks, ACT College Readiness Standards, and the Common Core State Standards. 1 Humanities. The English curriculum has significantly increased the amount of writing required of students. Before the initiative, the honors curriculum included two semester writing prompts and some common writing assignments. The new curriculum includes earned honors assessments. These assessments include two papers designed to sharpen students’ analytical skills, one on‐demand writing assessment, and four research projects with written requirements. All of the required writing utilizes AP aligned rubrics. These expectations are in place for all 1 humanities students. Semester exams in English are now aligned to the Common Core Standards and the ACT College Readiness Standards. History uses the nationally recognized World History for Us All curriculum as the foundation for a global world history approach. World History for Us All is a national collaboration of scholars, teachers, professors, and educational technology specialists and is aligned to the World History AP curriculum. This curriculum represents a shift from a predominately Western Civilizations focus to a more comprehensive, global curriculum. The new curriculum significantly increases the amount of writing required of students. Among the changes are the new earned honors assessments of two document‐based questions (DBQs) and two free response essays. A DBQ asks students to contextualize, synthesize, and construct an argument around a series of documents. This set of skills is explicitly assessed in AP history courses. All essays and DBQs are graded with rubrics aligned with AP. Semester exams are aligned with Common Core Standards and the National Standards for History.
Students in 1 humanities work on research skills at least four times a year. Among the topics students have researched are banned books, ancient artifacts, and the origins of communities. While research topics vary by 1 humanities team, the essential skills involved in quality research are common. Executing research, showing written evidence of that research, and then integrating the research into a written form is one of the skills of the Common Core State Standards that has been embedded into the new freshman program. Biology. The biology curriculum is aligned to the AP Biology Curriculum Framework that was revised in 2012. There was a shift from strictly content memorization to skill application and inquiry embedded within the context. The biology course focuses on conceptual understandings, science reasoning, and laboratory skills. Students learn to use the scientific method, interpret graphical and textual scientific information, conduct experiments to create and analyze data graphically, and draw conclusions from data. Earned honors assessments in the first semester focus on annotation, graphical analysis, and graph creation, and interpretation. In the second semester, earned honors assessments require students to analyze various sources and then write a succinct conclusion using the claim‐evidence‐reasoning model practiced in class. The biology semester exams are aligned with ACT College Readiness Standards and the AP Biology Framework. Semester Exams. Prior to the initiative, semester exams varied across teachers and there were no common assessments. As part of the initiative, an assessment consultant trained a team of teachers on best practices in test construction and reviewed the exams to ensure reliable and valid items. These common semester exams have a high reliability. The Kuder‐Richardson Formula 20 (KR‐20) score is a
7
reliability estimate that measures how well individual test questions correlate to each other. Reliability attempts to determine how much variability in test scores is a result of variability in students taking the test and not some other random error. A test with a higher KR‐20 value has greater internal consistency than a test with a lower KR‐20 value. The first semester exam for English has a reliability score of KR‐20: .87 and the first semester exam for history has a KR‐20: .90. The second semester exam for both courses has a KR‐20: .88. As a point of comparison, the AP English exam has a KR‐20: 0.85. The first and second semester exams for biology have a KR‐20: .93. Placement Criteria for Incoming 9th Graders Prior to 2011‐12, students were placed in 1 humanities course levels based primarily on their scores on the EXPLORE reading assessment administered in the 8th grade. The 1 humanities course levels included mixed‐level course taken for regular credit (EXPLORE reading score between the 40‐69th national percentile), mixed‐level course taken for honors credit (EXPLORE reading score between the 70‐94th percentile), and honors credit courses (EXPLORE reading score at or above the 95th percentile). Prior to 2012‐13, students were placed in biology course levels based primarily on their scores on the EXPLORE reading and math assessments administered in the 8th grade. The biology course levels included regular credit, mixed‐level taken for regular credit, mixed‐level taken for honors credit, and honors credit courses. Since the initiative, all students are placed into the same 1 humanities and biology courses. Students with an EXPLORE reading score in the 40‐50th percentile range are provided with supplemental reading support. Students with EXPLORE reading scores below the 50th percentile are not placed in biology in their freshman year and students with EXPLORE reading scores below the 40th percentile
continue to be placed in the 1 humanities with support course.
Earned Honors Credit Model Since freshman year at ETHS is a launch year for students, the goal of the restructured freshman year is to ensure students receive the most rigorous academic freshman experience in an environment of high expectations for all students, while also subsequently increasing the number of students who enroll in honors and AP level courses. Earning honors credit is part of the process towards the greater outcome of increasing demand for honors and AP classes for students as they progress through high school beyond freshman year. An earned honors credit model was implemented in 1 humanities and biology. The model requires students to perform well each semester in a series of assessments designed to allow them to demonstrate both the depth and breadth of their skills. Students also need to earn a semester course grade of a C or better to earn honors credit. The earned honors model ensures:
consistent curriculum with earned honors assessments that evaluate the intellectual skills and knowledge of the subject matter. Expectations for a consistent curriculum are maintained across teachers. Expectations do not vary depending upon which teacher a student happens to get. (Schmoker, 2010). AP is a similarly consistent curriculum.
students read, write, and discuss in the analytic and argumentative modes because they are assessed in these areas (Schmoker, 2010).
clear, curriculum‐based objectives and assessments, followed by multiple cycles of instruction, guided practice, checks for understanding, and ongoing adjustments to instruction (Schmoker, 2010).
a learning environment that provides high challenge and support (Tomlinson, 2010). ETHS accomplishes this by requiring all
8
students to participate in the earned honors model and by maintaining a robust system of support.
the curriculum emphasizes deep understanding of content and ensures that both teachers and students recognize what
is essential for students to know, understand and do (Tomlinson, 2010). Through the use of rubrics ETHS clarifies to students and teachers what will be emphasized and delivered in the curriculum.
Professional Development for Teachers Beginning in 2007‐08, English teachers had a multi‐year foundation of training on differentiated instruction. Between 2010‐11 and 2012‐13, all teachers received year‐long professional development on teaching differentiated instruction and effective effort strategies. Experienced master teachers were assigned to teach the 1 humanities classes. In 2012‐13, biology teachers received 10 sessions, ½ day in length, on differentiating instruction in biology classrooms.
Evaluation Findings – Implementation
9
Rigor A definition of rigor was included in a 2009 report to the D202 Board. Rigor was defined as: creating a nurturing environment in which each student is expected to learn at high levels, each student is supported so he or she can learn at high levels, and each student demonstrates learning at high levels. This is supported in our core belief in one school: equity and excellence. The message to students in our definition of rigor is one of effective effort: “you can do it, we believe in you, we won’t give up on you.”
A second, classroom‐specific definition of rigor is necessary to provide a clear picture of what a rigorous classroom looks like. In the classroom, rigor is the depth to which a student is expected to reason, analyze, collaborate, write, synthesize, and create. This definition is driven by collegiate and work expectations and is grounded in content (Wagner, 2010). A rigorous curriculum is focused, coherent, and challenging. Adding rigor to the curriculum cannot be achieved by moving standards, benchmarks and course requirements around. It is essential to describe the skills that students will be expected to master – rather than just the content they will memorize. Rigor does not mean more homework; instead, rigor is about the depth and quality of the thinking. It is both academic intensity and academic quality (ACT, 2007). This bifocal view of a rigorous classroom links content and critical thinking. ETHS believes that all students have the right to access and experience rigorous curriculum at all instructional levels.
Is the restructured freshman year initiative implemented as a rigorous curriculum for all students? 1 Humanities. In focus groups with history teachers in 2011‐12, teachers discussed the sense of community they saw developing in their classrooms and they noted the added rigor in the courses, particularly concerning the additional skills that are being taught.
This is substantiated by two years of classroom observations which showed the revised English and history curricula significantly increased the amount of reading and writing required of students. That increase can be seen in the amount of reading, writing, and interacting with the text students are doing in the classroom as well as in their assignments. The increased amount of writing comes in the form of students being prepped to write, writing to learn, and learning to write. In addition, teachers were observed using a variety of differentiated instructional strategies to teach students, including giving students the opportunity to approach learning in different ways through content (i.e., choice of assignment), process (i.e. different ways to take notes or analyze text), or product (i.e. different ways to present completed work). In 2011‐12, the only combined earned honors credit assessments were the research projects, which were administered quarterly. In response to feedback from teachers and student data, adjustments were made in 2012‐13 and they included:
grouping the Research A & B quarterly projects together to make them the earned honors credit assessment within the 1st quarter.
integrating a combined writing on‐demand essay in the first semester. This is a shared earned honors credit assessment grade between history and English.
revising the reading competency assessment into a process paper. The original reading competency assessment is now used in the English classes as a diagnostic reading screener at the beginning of the year.
adding a combined English and history writing prompt as part of semester exams.
offering summer curriculum projects to teachers to provide extra time to plan before the year began. These projects were intended to help address teachers’ concerns
10
about the lack of time they have during the year to plan and meet with their partner.
In 2012‐13, a majority of the English teachers agreed that flexible scheduling, more opportunities to teach writing and annotating, greater book choice, and access to honors curriculum for all students continued to be strengths of the program. Most of the history teachers felt the sense of community is a continued strength of the program, as well as the strong focus on skill development. Based on teacher feedback and other data in 2012‐13, adjustments made in 2013‐14 include:
continuing to refine the rubrics and establish a common criteria for success across disciplines.
adjusting the grading formula from 30% earned honors credit assessment, 30% summative work, and 40% formative work to a formula of 20% earned honors credit assessment, 40% summative work, and 40% formative work.
incorporating the opportunity for students to demonstrate mastery, which includes a chance to rewrite process papers. Time for this new process was built into teacher planning and the earned honors credit process.
identifying the semester exam as a poor marker for distinguishing earned honors credit, especially since it is included in 20% of a student’s semester grade.
In addition, in 2013‐14 ETHS offered a Modern World History course for 10th graders as a continuation of the World History for Us All curriculum that integrates DBQs, essay writing, and common semester exams.
Biology. In 2012‐13, the biology teachers also discussed the sense of community they saw developing in the classrooms and the added rigor to the courses, including the higher level skills being taught in biology.
Observations of the biology classes in 2012‐13 indicate there are high‐quality opportunities for students to strengthen their higher‐order thinking skills and deepen their understanding through extended back and forth exchanges. These opportunities were not always sustained and were occasionally brief or limited in depth. At times the content‐based discussions moved quickly among topics and did not consistently engage students in extended dialogues. There were opportunities for metacognition, where students can think about their own thinking through explanations, self‐evaluations, reflection, and planning, and occasionally teachers modeled metacognition by “thinking out loud;” but these instances did not always explicitly bring students’ attention to the thought processes that underlie the learning process. There is an opportunity to incorporate more metacognitive strategies into instruction that would help take students’ thinking to a higher level.
Biology teachers cited the need for professional development in differentiated instruction that is meaningful and biology‐specific. They also suggested more collaboration with District 65 so the middle school science teachers can see what high school science looks like and what the expectations are for incoming freshman. In response to teacher feedback, District 202 biology teachers have met with a representation of science teachers from District 65 to share curriculum and identify skills addressed in each area. Based on the classroom observations, there was limited evidence of the use of multiple instructional strategies or those strategies were not used consistently. This is consistent with the biology teachers’ feedback about a need for additional professional development on differentiated instruction. In 2013‐14, biology teachers received additional support and professional development on how to incorporate differentiated instructional strategies into their classrooms that are content‐specific to biology.
11
In 2013‐14, the biology grading formula remained the same as 2012‐13, with a 30‐30‐40 formula representing 30% earned honors credit assessment, 30% summative work, and 40% formative work. In 2014‐15, the grading formula will change to mirror that of the humanities, with the 20‐40‐40 formula that represents 20% earned honors credit assessment, 40% summative work, and 40% formative work. Similar to 1 humanities, in 2013‐14 biology removed the semester exam as a marker for earning honors credit since it is already included in 20% of a student’s semester grade.
Common Grading Scale. In 2011‐12 and 2012‐13, to earn honors credit a student needed to earn a combined total of at least 320 points on the earned honors credit assessments; earn a C or better on their semester exam; and earn a C or better on their semester grade. Beginning in 2013‐14, the requirement for earning a C or better on the semester exam was removed. This
requirement was thought to penalize students twice since the semester exam grade counted as 20% of the final semester grade. Prior to the initiative, there were two grading scales used in the 1 humanities and biology courses. Students assigned the course for regular credit were on the A(90) scale, and students assigned the course for honors credit were on the A(93) scale. Multiple grading scales are problematic for a variety of reasons. They establish inconsistent expectations for students, diminish the importance of any single grade, and complicate the school‐wide analysis of grading practices. As part of the initiative, all students are evaluated on the A(93) grading scale. This means that all students in 1 humanities are held to the same grading standard.
In the new grading system there is greater commonality across teachers and classes; teachers have grading agreements where all teachers grade with a common percent for assignments, and there is a common grading rubric for the earned honors credit assessments, as well as semester exams. Due to the difference in the grading system between the comparison and implementation cohorts, only grade data for 2012‐13 is reported. Comparison of semester grades between the comparison cohorts and 2012‐13 is not meaningful because of the differences in grading scales, greater commonality across teachers and classes, grading agreements where all teachers grade with a common percent for assignments, and the common grading rubric for the earned honors credit assessments and semester exams. The evaluation will only report semester grades starting with the first full implementation cohort (2012‐13).
Table 1: Comparison of A(90) Grading Scale to A(93) Grading Scale Grade A A‐ B+ B B‐ C+ C C‐ D+ D F
A(90) 90 87 84 80 77 74 70 67 64 57 0
A(93) 93 90 87 83 80 77 73 70 67 60 0
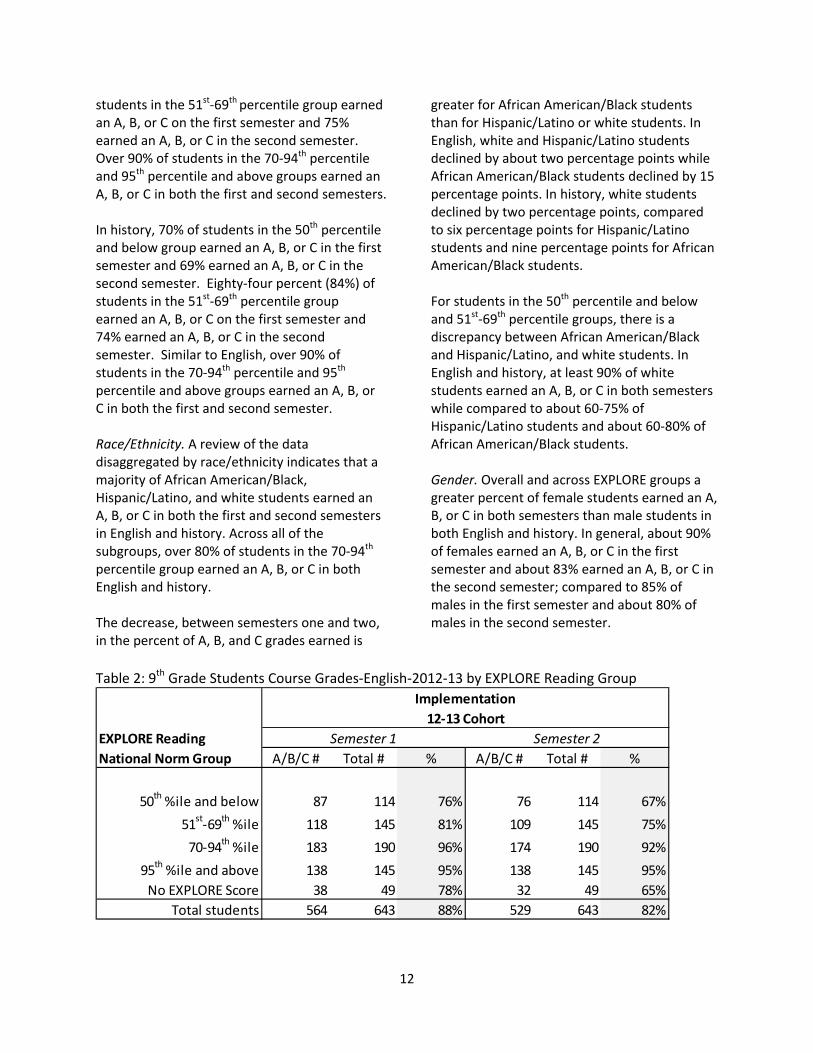
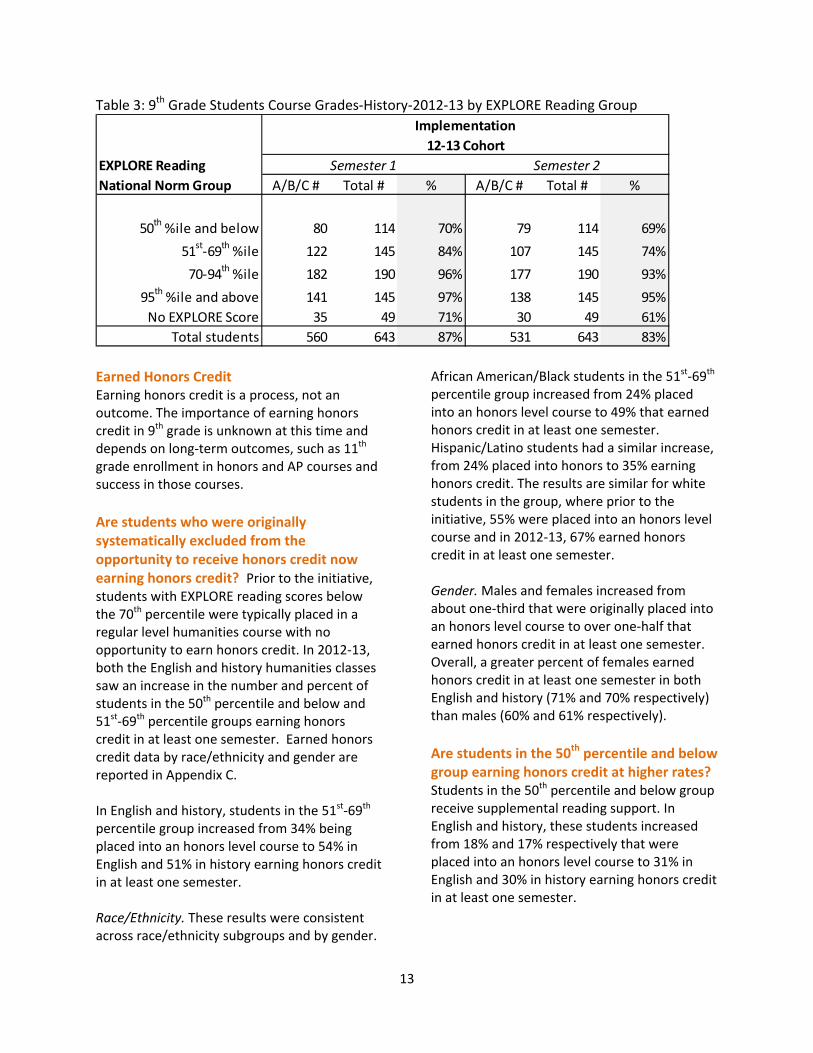
How are students in the 1 humanities course performing on their semester grades? The number and percent of students earning course grades of A, B, or C in English and history courses are summarized in Tables 2 and 3. Here the evaluation is interested in how students are performing overall in this more rigorous course. Overall, over 80% of the 2012‐13 cohort earned an A, B, or C in both semesters in English and history. More students earned an A, B, or C in the first semester than the second semester in all but one EXPLORE group. In English, 76% of students in the 50th percentile and below group earned an A, B, or C in the first semester and 67% earned an A, B, or C in the second semester. Eighty‐one percent (81%) of
12
students in the 51st‐69th percentile group earned an A, B, or C on the first semester and 75% earned an A, B, or C in the second semester. Over 90% of students in the 70‐94th percentile and 95th percentile and above groups earned an A, B, or C in both the first and second semesters. In history, 70% of students in the 50th percentile and below group earned an A, B, or C in the first semester and 69% earned an A, B, or C in the second semester. Eighty‐four percent (84%) of students in the 51st‐69th percentile group earned an A, B, or C on the first semester and 74% earned an A, B, or C in the second semester. Similar to English, over 90% of students in the 70‐94th percentile and 95th percentile and above groups earned an A, B, or C in both the first and second semester. Race/Ethnicity. A review of the data disaggregated by race/ethnicity indicates that a majority of African American/Black, Hispanic/Latino, and white students earned an A, B, or C in both the first and second semesters in English and history. Across all of the subgroups, over 80% of students in the 70‐94th percentile group earned an A, B, or C in both English and history. The decrease, between semesters one and two, in the percent of A, B, and C grades earned is
greater for African American/Black students than for Hispanic/Latino or white students. In English, white and Hispanic/Latino students declined by about two percentage points while African American/Black students declined by 15 percentage points. In history, white students declined by two percentage points, compared to six percentage points for Hispanic/Latino students and nine percentage points for African American/Black students. For students in the 50th percentile and below and 51st‐69th percentile groups, there is a discrepancy between African American/Black and Hispanic/Latino, and white students. In English and history, at least 90% of white students earned an A, B, or C in both semesters while compared to about 60‐75% of Hispanic/Latino students and about 60‐80% of African American/Black students. Gender. Overall and across EXPLORE groups a greater percent of female students earned an A, B, or C in both semesters than male students in both English and history. In general, about 90% of females earned an A, B, or C in the first semester and about 83% earned an A, B, or C in the second semester; compared to 85% of males in the first semester and about 80% of males in the second semester.
Table 2: 9th Grade Students Course Grades‐English‐2012‐13 by EXPLORE Reading Group
A/B/C # Total # % A/B/C # Total # %
50th %ile and below 87 114 76% 76 114 67%
51st‐69
th %ile 118 145 81% 109 145 75%
70‐94th %ile 183 190 96% 174 190 92%
95th %ile and above 138 145 95% 138 145 95%
No EXPLORE Score 38 49 78% 32 49 65%
Total students 564 643 88% 529 643 82%
Implementation
12‐13 Cohort
EXPLORE Reading
National Norm Group
Semester 1 Semester 2
13
Table 3: 9th Grade Students Course Grades‐History‐2012‐13 by EXPLORE Reading Group
Earned Honors Credit Earning honors credit is a process, not an outcome. The importance of earning honors credit in 9th grade is unknown at this time and depends on long‐term outcomes, such as 11th grade enrollment in honors and AP courses and success in those courses.
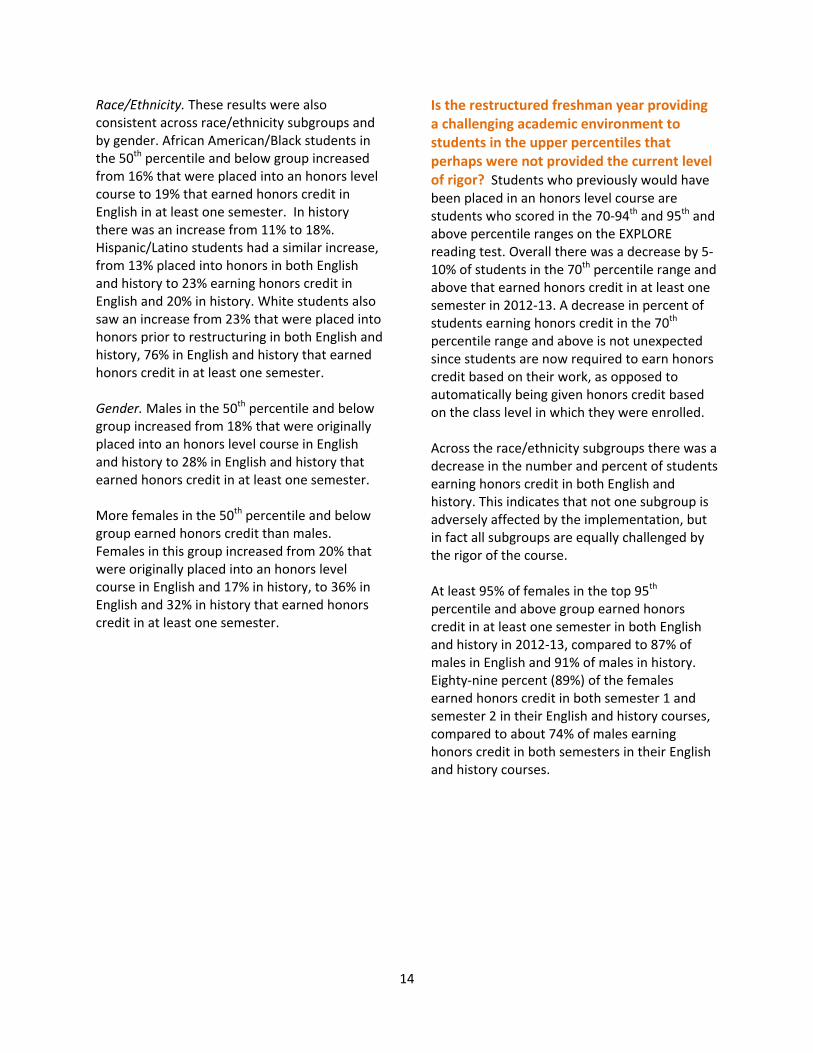
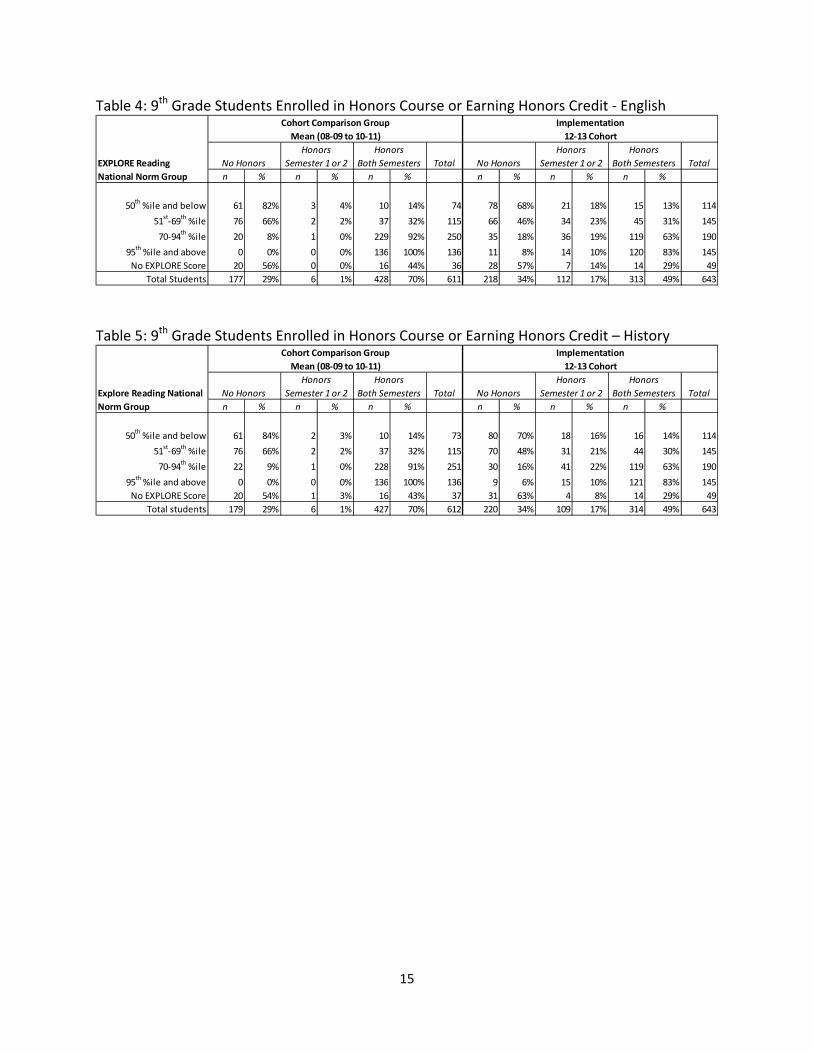
Are students who were originally systematically excluded from the opportunity to receive honors credit now earning honors credit? Prior to the initiative, students with EXPLORE reading scores below the 70th percentile were typically placed in a regular level humanities course with no opportunity to earn honors credit. In 2012‐13, both the English and history humanities classes saw an increase in the number and percent of students in the 50th percentile and below and 51st‐69th percentile groups earning honors credit in at least one semester. Earned honors credit data by race/ethnicity and gender are reported in Appendix C. In English and history, students in the 51st‐69th percentile group increased from 34% being placed into an honors level course to 54% in English and 51% in history earning honors credit in at least one semester. Race/Ethnicity. These results were consistent across race/ethnicity subgroups and by gender.
African American/Black students in the 51st‐69th percentile group increased from 24% placed into an honors level course to 49% that earned honors credit in at least one semester. Hispanic/Latino students had a similar increase, from 24% placed into honors to 35% earning honors credit. The results are similar for white students in the group, where prior to the initiative, 55% were placed into an honors level course and in 2012‐13, 67% earned honors credit in at least one semester. Gender. Males and females increased from about one‐third that were originally placed into an honors level course to over one‐half that earned honors credit in at least one semester. Overall, a greater percent of females earned honors credit in at least one semester in both English and history (71% and 70% respectively) than males (60% and 61% respectively).
Are students in the 50th percentile and below group earning honors credit at higher rates? Students in the 50th percentile and below group receive supplemental reading support. In English and history, these students increased from 18% and 17% respectively that were placed into an honors level course to 31% in English and 30% in history earning honors credit in at least one semester.
A/B/C # Total # % A/B/C # Total # %
50th %ile and below 80 114 70% 79 114 69%
51st‐69
th %ile 122 145 84% 107 145 74%
70‐94th %ile 182 190 96% 177 190 93%
95th %ile and above 141 145 97% 138 145 95%
No EXPLORE Score 35 49 71% 30 49 61%
Total students 560 643 87% 531 643 83%
Semester 1 Semester 2EXPLORE Reading
National Norm Group
Implementation
12‐13 Cohort
14
Race/Ethnicity. These results were also consistent across race/ethnicity subgroups and by gender. African American/Black students in the 50th percentile and below group increased from 16% that were placed into an honors level course to 19% that earned honors credit in English in at least one semester. In history there was an increase from 11% to 18%. Hispanic/Latino students had a similar increase, from 13% placed into honors in both English and history to 23% earning honors credit in English and 20% in history. White students also saw an increase from 23% that were placed into honors prior to restructuring in both English and history, 76% in English and history that earned honors credit in at least one semester. Gender. Males in the 50th percentile and below group increased from 18% that were originally placed into an honors level course in English and history to 28% in English and history that earned honors credit in at least one semester. More females in the 50th percentile and below group earned honors credit than males. Females in this group increased from 20% that were originally placed into an honors level course in English and 17% in history, to 36% in English and 32% in history that earned honors credit in at least one semester.
Is the restructured freshman year providing a challenging academic environment to students in the upper percentiles that perhaps were not provided the current level of rigor? Students who previously would have been placed in an honors level course are students who scored in the 70‐94th and 95th and above percentile ranges on the EXPLORE reading test. Overall there was a decrease by 5‐10% of students in the 70th percentile range and above that earned honors credit in at least one semester in 2012‐13. A decrease in percent of students earning honors credit in the 70th percentile range and above is not unexpected since students are now required to earn honors credit based on their work, as opposed to automatically being given honors credit based on the class level in which they were enrolled. Across the race/ethnicity subgroups there was a decrease in the number and percent of students earning honors credit in both English and history. This indicates that not one subgroup is adversely affected by the implementation, but in fact all subgroups are equally challenged by the rigor of the course. At least 95% of females in the top 95th percentile and above group earned honors credit in at least one semester in both English and history in 2012‐13, compared to 87% of males in English and 91% of males in history. Eighty‐nine percent (89%) of the females earned honors credit in both semester 1 and semester 2 in their English and history courses, compared to about 74% of males earning honors credit in both semesters in their English and history courses.
15
Table 4: 9th Grade Students Enrolled in Honors Course or Earning Honors Credit ‐ English
Table 5: 9th Grade Students Enrolled in Honors Course or Earning Honors Credit – History
Total Total
n % n % n % n % n % n %
50th %ile and below 61 82% 3 4% 10 14% 74 78 68% 21 18% 15 13% 114
51st‐69
th %ile 76 66% 2 2% 37 32% 115 66 46% 34 23% 45 31% 145
70‐94th %ile 20 8% 1 0% 229 92% 250 35 18% 36 19% 119 63% 190
95th %ile and above 0 0% 0 0% 136 100% 136 11 8% 14 10% 120 83% 145
No EXPLORE Score 20 56% 0 0% 16 44% 36 28 57% 7 14% 14 29% 49
Total Students 177 29% 6 1% 428 70% 611 218 34% 112 17% 313 49% 643
EXPLORE Reading
National Norm Group
Honors
Semester 1 or 2
Honors
Both Semesters
Implementation
12‐13 Cohort
Cohort Comparison Group
Mean (08‐09 to 10‐11)
No Honors
Honors
Semester 1 or 2
Honors
Both Semesters No Honors
Total Total
n % n % n % n % n % n %
50th %ile and below 61 84% 2 3% 10 14% 73 80 70% 18 16% 16 14% 114
51st‐69
th %ile 76 66% 2 2% 37 32% 115 70 48% 31 21% 44 30% 145
70‐94th %ile 22 9% 1 0% 228 91% 251 30 16% 41 22% 119 63% 190
95th %ile and above 0 0% 0 0% 136 100% 136 9 6% 15 10% 121 83% 145
No EXPLORE Score 20 54% 1 3% 16 43% 37 31 63% 4 8% 14 29% 49
Total students 179 29% 6 1% 427 70% 612 220 34% 109 17% 314 49% 643
Cohort Comparison Group
Mean (08‐09 to 10‐11)
Implementation
12‐13 Cohort
No Honors
Honors
Semester 1 or 2
Honors
Both Semesters No Honors
Honors
Semester 1 or 2
Honors
Both SemestersExplore Reading National
Norm Group
Evaluation Findings – Short‐Term Outcomes
16
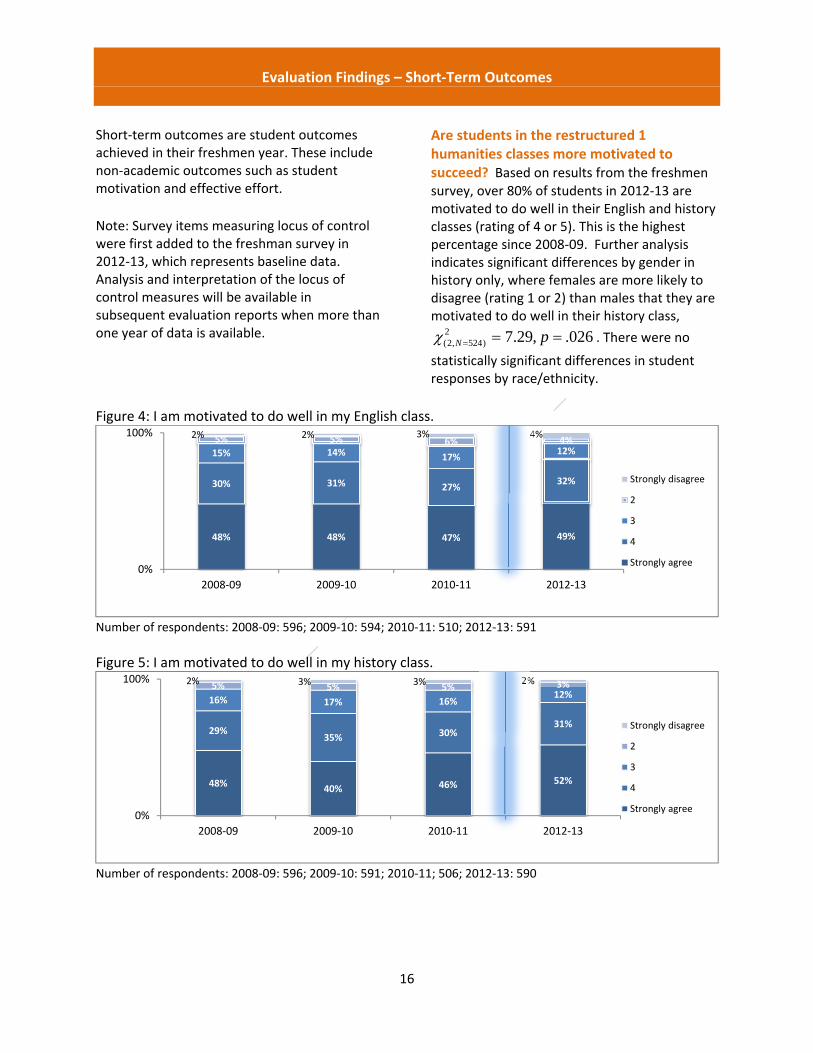
Short‐term outcomes are student outcomes achieved in their freshmen year. These include non‐academic outcomes such as student motivation and effective effort.
Note: Survey items measuring locus of control were first added to the freshman survey in 2012‐13, which represents baseline data. Analysis and interpretation of the locus of control measures will be available in subsequent evaluation reports when more than one year of data is available.
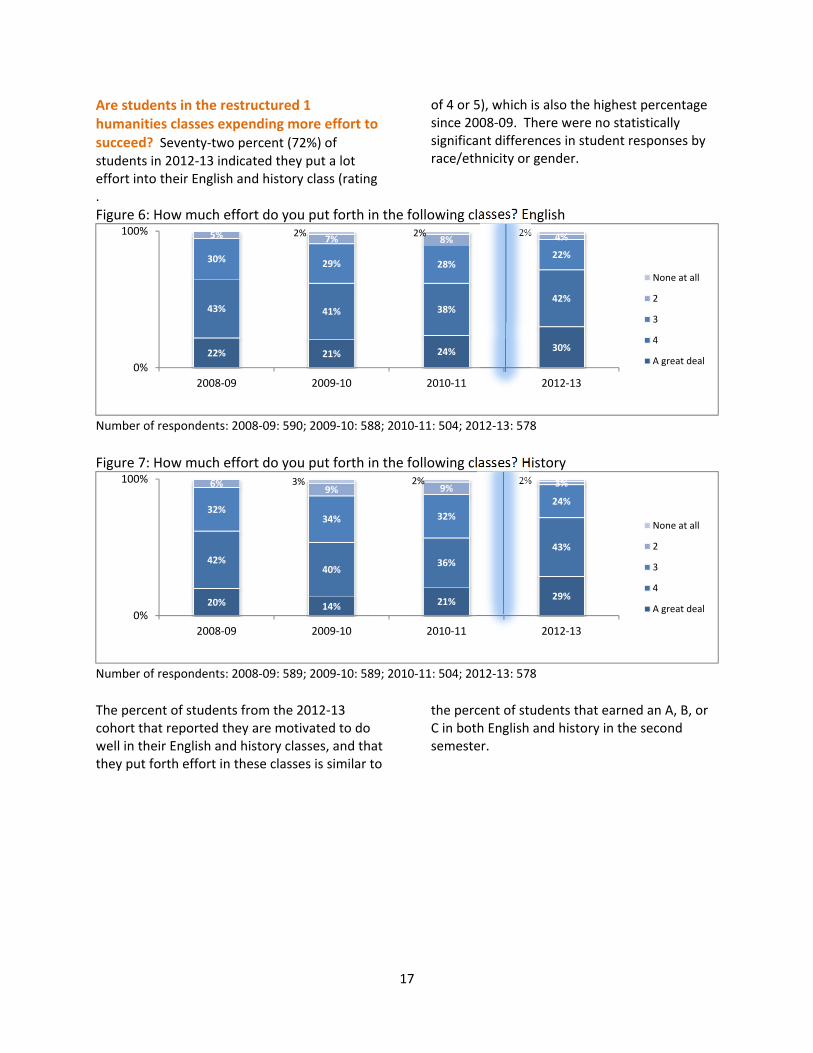
Are students in the restructured 1 humanities classes more motivated to succeed? Based on results from the freshmen survey, over 80% of students in 2012‐13 are motivated to do well in their English and history classes (rating of 4 or 5). This is the highest percentage since 2008‐09. Further analysis indicates significant differences by gender in history only, where females are more likely to disagree (rating 1 or 2) than males that they are motivated to do well in their history class,
2(2, 524) 7.29, .026N p . There were no
statistically significant differences in student responses by race/ethnicity.
Figure 4: I am motivated to do well in my English class.
Number of respondents: 2008‐09: 596; 2009‐10: 594; 2010‐11: 510; 2012‐13: 591
Figure 5: I am motivated to do well in my history class.
Number of respondents: 2008‐09: 596; 2009‐10: 591; 2010‐11; 506; 2012‐13: 590
48% 48% 47% 49%
30% 31% 27%32%
15% 14% 17%12%
5% 5% 6% 4%2% 2% 3% 4%
0%
100%
2008‐09 2009‐10 2010‐11 2012‐13
Strongly disagree
2
3
4
Strongly agree
48%40% 46% 52%
29%35% 30%
31%
16% 17% 16%12%
5% 5% 5% 3%2% 3% 3% 2%
0%
100%
2008‐09 2009‐10 2010‐11 2012‐13
Strongly disagree
2
3
4
Strongly agree
17
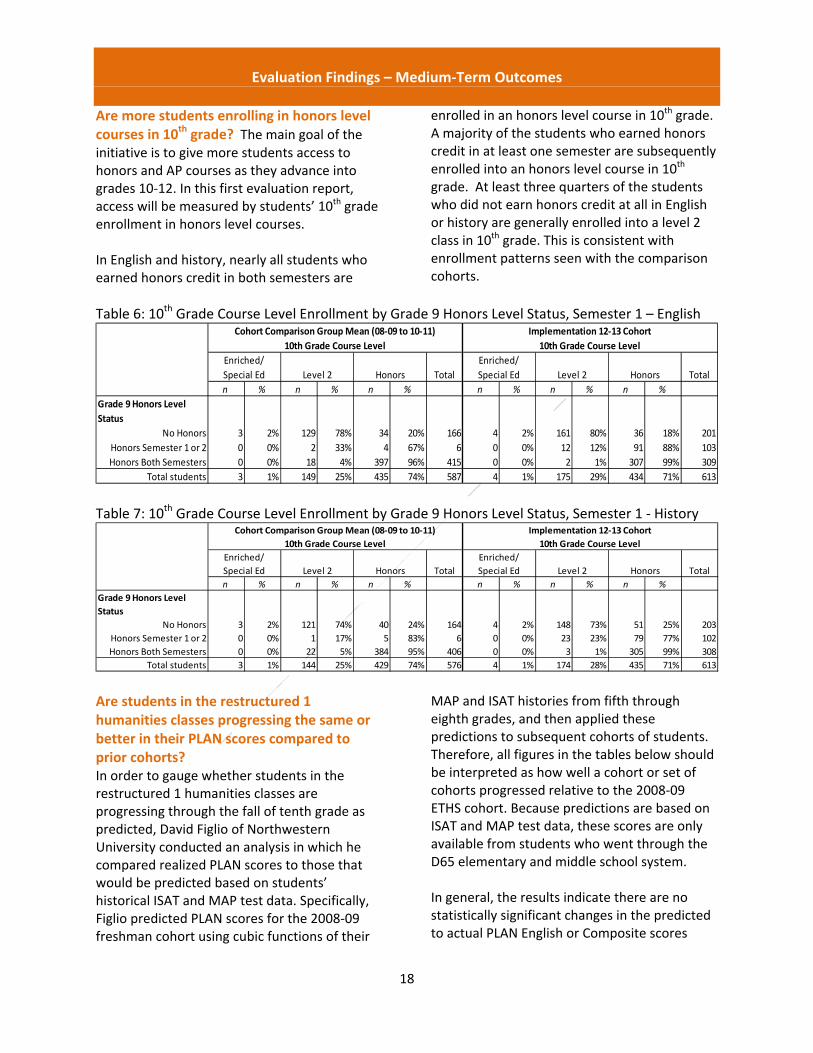
Are students in the restructured 1 humanities classes expending more effort to succeed? Seventy‐two percent (72%) of students in 2012‐13 indicated they put a lot effort into their English and history class (rating
of 4 or 5), which is also the highest percentage since 2008‐09. There were no statistically significant differences in student responses by race/ethnicity or gender.
.
Figure 6: How much effort do you put forth in the following classes? English
Number of respondents: 2008‐09: 590; 2009‐10: 588; 2010‐11: 504; 2012‐13: 578
Figure 7: How much effort do you put forth in the following classes? History
Number of respondents: 2008‐09: 589; 2009‐10: 589; 2010‐11: 504; 2012‐13: 578
The percent of students from the 2012‐13 cohort that reported they are motivated to do well in their English and history classes, and that they put forth effort in these classes is similar to
the percent of students that earned an A, B, or C in both English and history in the second semester.
22% 21% 24% 30%
43% 41% 38%42%
30% 29% 28%22%
5% 7% 8% 4%2% 2% 2%
0%
100%
2008‐09 2009‐10 2010‐11 2012‐13
None at all
2
3
4
A great deal
20% 14% 21%29%
42%40%
36%
43%
32%34% 32%
24%
6%9% 9% 3%3% 2% 2%
0%
100%
2008‐09 2009‐10 2010‐11 2012‐13
None at all
2
3
4
A great deal
Evaluation Findings – Medium‐Term Outcomes
18
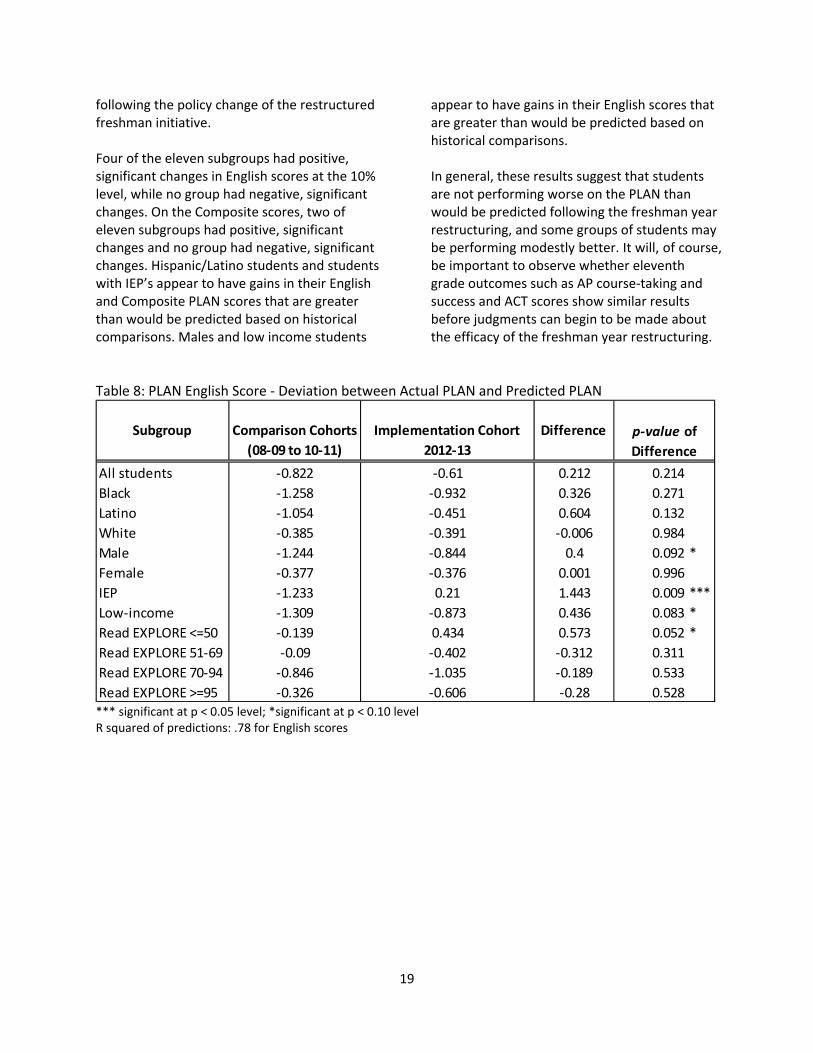
Are more students enrolling in honors level courses in 10th grade? The main goal of the initiative is to give more students access to honors and AP courses as they advance into grades 10‐12. In this first evaluation report, access will be measured by students’ 10th grade enrollment in honors level courses. In English and history, nearly all students who earned honors credit in both semesters are
enrolled in an honors level course in 10th grade. A majority of the students who earned honors credit in at least one semester are subsequently enrolled into an honors level course in 10th grade. At least three quarters of the students who did not earn honors credit at all in English or history are generally enrolled into a level 2 class in 10th grade. This is consistent with enrollment patterns seen with the comparison cohorts.
Table 6: 10th Grade Course Level Enrollment by Grade 9 Honors Level Status, Semester 1 – English
Table 7: 10th Grade Course Level Enrollment by Grade 9 Honors Level Status, Semester 1 ‐ History
Are students in the restructured 1 humanities classes progressing the same or better in their PLAN scores compared to prior cohorts? In order to gauge whether students in the restructured 1 humanities classes are progressing through the fall of tenth grade as predicted, David Figlio of Northwestern University conducted an analysis in which he compared realized PLAN scores to those that would be predicted based on students’ historical ISAT and MAP test data. Specifically, Figlio predicted PLAN scores for the 2008‐09 freshman cohort using cubic functions of their
MAP and ISAT histories from fifth through eighth grades, and then applied these predictions to subsequent cohorts of students. Therefore, all figures in the tables below should be interpreted as how well a cohort or set of cohorts progressed relative to the 2008‐09 ETHS cohort. Because predictions are based on ISAT and MAP test data, these scores are only available from students who went through the D65 elementary and middle school system. In general, the results indicate there are no statistically significant changes in the predicted to actual PLAN English or Composite scores
Total Total
n % n % n % n % n % n %
Grade 9 Honors Level
Status
No Honors 3 2% 129 78% 34 20% 166 4 2% 161 80% 36 18% 201
Honors Semester 1 or 2 0 0% 2 33% 4 67% 6 0 0% 12 12% 91 88% 103
Honors Both Semesters 0 0% 18 4% 397 96% 415 0 0% 2 1% 307 99% 309
Total students 3 1% 149 25% 435 74% 587 4 1% 175 29% 434 71% 613
Enriched/
Special Ed Level 2 Honors
Cohort Comparison Group Mean (08‐09 to 10‐11)
10th Grade Course Level
Implementation 12‐13 Cohort
10th Grade Course Level
Enriched/
Special Ed Level 2 Honors
Total Total
n % n % n % n % n % n %
Grade 9 Honors Level
Status
No Honors 3 2% 121 74% 40 24% 164 4 2% 148 73% 51 25% 203
Honors Semester 1 or 2 0 0% 1 17% 5 83% 6 0 0% 23 23% 79 77% 102
Honors Both Semesters 0 0% 22 5% 384 95% 406 0 0% 3 1% 305 99% 308
Total students 3 1% 144 25% 429 74% 576 4 1% 174 28% 435 71% 613
Cohort Comparison Group Mean (08‐09 to 10‐11)
10th Grade Course Level
Implementation 12‐13 Cohort
10th Grade Course Level
Enriched/
Special Ed Level 2 Honors
Enriched/
Special Ed Level 2 Honors
19
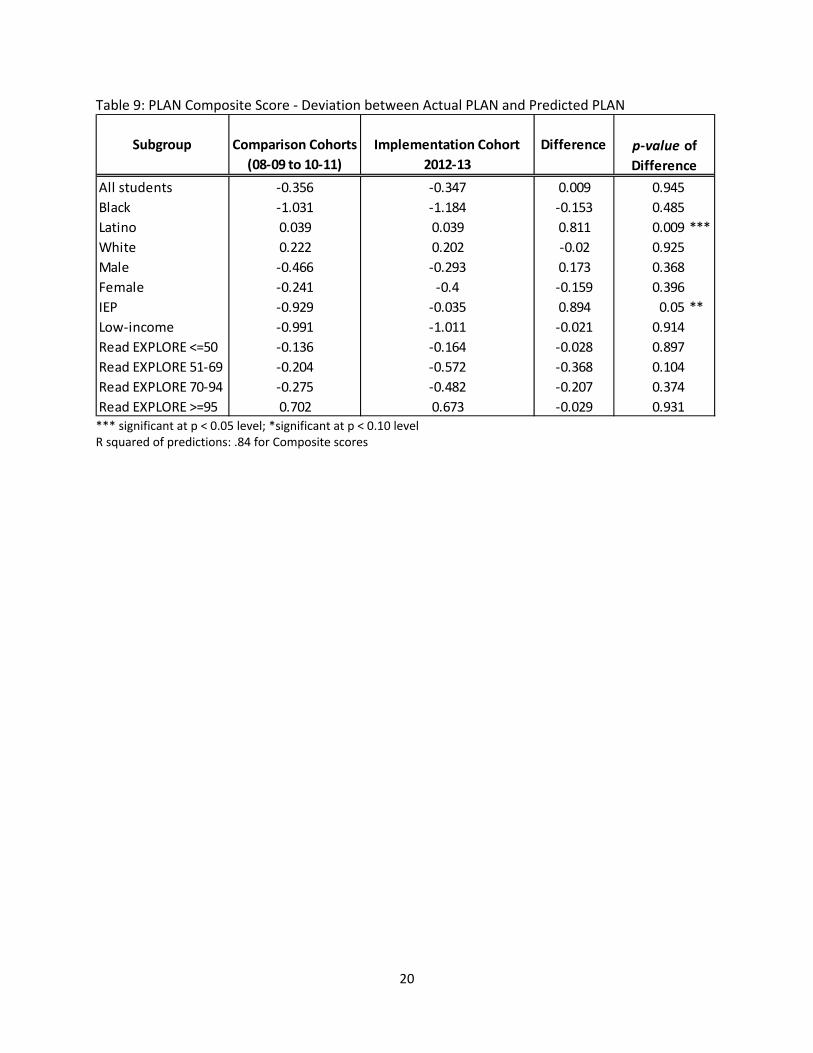
following the policy change of the restructured freshman initiative. Four of the eleven subgroups had positive, significant changes in English scores at the 10% level, while no group had negative, significant changes. On the Composite scores, two of eleven subgroups had positive, significant changes and no group had negative, significant changes. Hispanic/Latino students and students with IEP’s appear to have gains in their English and Composite PLAN scores that are greater than would be predicted based on historical comparisons. Males and low income students
appear to have gains in their English scores that are greater than would be predicted based on historical comparisons. In general, these results suggest that students are not performing worse on the PLAN than would be predicted following the freshman year restructuring, and some groups of students may be performing modestly better. It will, of course, be important to observe whether eleventh grade outcomes such as AP course‐taking and success and ACT scores show similar results before judgments can begin to be made about the efficacy of the freshman year restructuring.
Table 8: PLAN English Score ‐ Deviation between Actual PLAN and Predicted PLAN
*** significant at p < 0.05 level; *significant at p < 0.10 level R squared of predictions: .78 for English scores
Subgroup Comparison Cohorts
(08‐09 to 10‐11)
Implementation Cohort
2012‐13
Difference
All students ‐0.822 ‐0.61 0.212 0.214
Black ‐1.258 ‐0.932 0.326 0.271
Latino ‐1.054 ‐0.451 0.604 0.132
White ‐0.385 ‐0.391 ‐0.006 0.984
Male ‐1.244 ‐0.844 0.4 0.092 *
Female ‐0.377 ‐0.376 0.001 0.996
IEP ‐1.233 0.21 1.443 0.009 ***
Low‐income ‐1.309 ‐0.873 0.436 0.083 *
Read EXPLORE <=50 ‐0.139 0.434 0.573 0.052 *
Read EXPLORE 51‐69 ‐0.09 ‐0.402 ‐0.312 0.311
Read EXPLORE 70‐94 ‐0.846 ‐1.035 ‐0.189 0.533
Read EXPLORE >=95 ‐0.326 ‐0.606 ‐0.28 0.528
p‐value of
Difference
20
Table 9: PLAN Composite Score ‐ Deviation between Actual PLAN and Predicted PLAN
*** significant at p < 0.05 level; *significant at p < 0.10 level R squared of predictions: .84 for Composite scores
Subgroup Comparison Cohorts
(08‐09 to 10‐11)
Implementation Cohort
2012‐13
Difference
All students ‐0.356 ‐0.347 0.009 0.945
Black ‐1.031 ‐1.184 ‐0.153 0.485
Latino 0.039 0.039 0.811 0.009 ***
White 0.222 0.202 ‐0.02 0.925
Male ‐0.466 ‐0.293 0.173 0.368
Female ‐0.241 ‐0.4 ‐0.159 0.396
IEP ‐0.929 ‐0.035 0.894 0.05 **
Low‐income ‐0.991 ‐1.011 ‐0.021 0.914
Read EXPLORE <=50 ‐0.136 ‐0.164 ‐0.028 0.897
Read EXPLORE 51‐69 ‐0.204 ‐0.572 ‐0.368 0.104
Read EXPLORE 70‐94 ‐0.275 ‐0.482 ‐0.207 0.374
Read EXPLORE >=95 0.702 0.673 ‐0.029 0.931
p‐value of
Difference
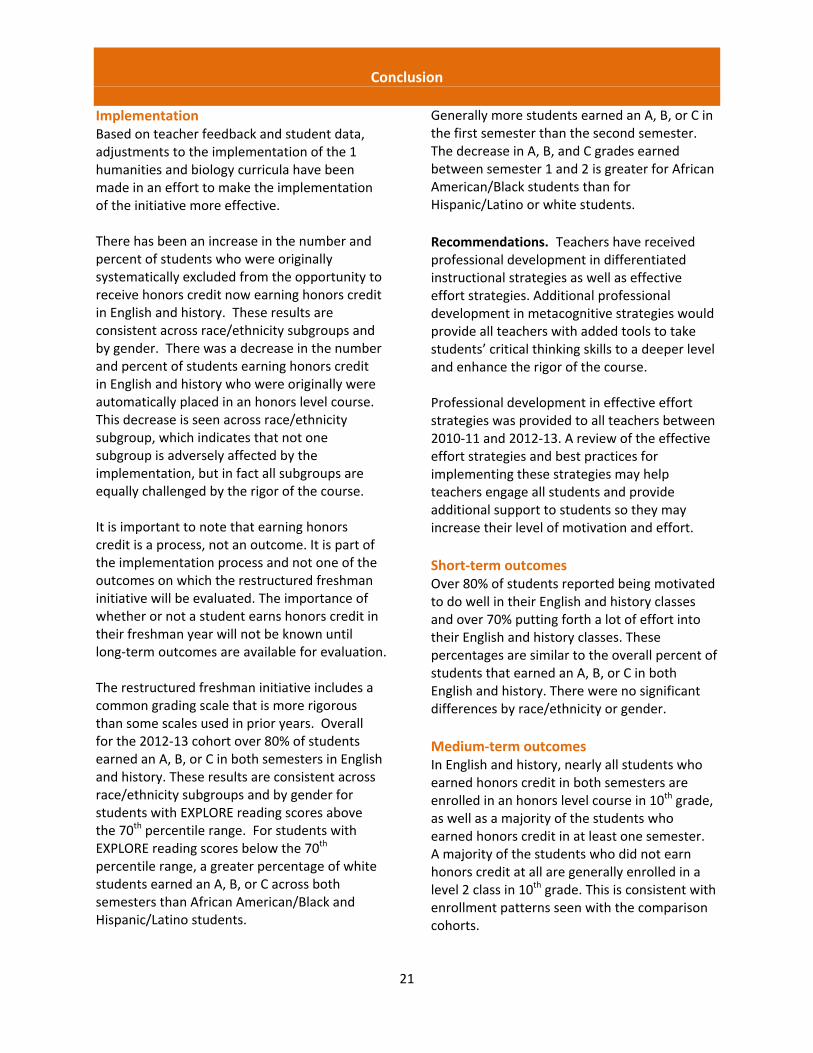
Conclusion
21
Implementation Based on teacher feedback and student data, adjustments to the implementation of the 1 humanities and biology curricula have been made in an effort to make the implementation of the initiative more effective. There has been an increase in the number and percent of students who were originally systematically excluded from the opportunity to receive honors credit now earning honors credit in English and history. These results are consistent across race/ethnicity subgroups and by gender. There was a decrease in the number and percent of students earning honors credit in English and history who were originally were automatically placed in an honors level course. This decrease is seen across race/ethnicity subgroup, which indicates that not one subgroup is adversely affected by the implementation, but in fact all subgroups are equally challenged by the rigor of the course. It is important to note that earning honors credit is a process, not an outcome. It is part of the implementation process and not one of the outcomes on which the restructured freshman initiative will be evaluated. The importance of whether or not a student earns honors credit in their freshman year will not be known until long‐term outcomes are available for evaluation. The restructured freshman initiative includes a common grading scale that is more rigorous than some scales used in prior years. Overall for the 2012‐13 cohort over 80% of students earned an A, B, or C in both semesters in English and history. These results are consistent across race/ethnicity subgroups and by gender for students with EXPLORE reading scores above the 70th percentile range. For students with EXPLORE reading scores below the 70th percentile range, a greater percentage of white students earned an A, B, or C across both semesters than African American/Black and Hispanic/Latino students.
Generally more students earned an A, B, or C in the first semester than the second semester. The decrease in A, B, and C grades earned between semester 1 and 2 is greater for African American/Black students than for Hispanic/Latino or white students.
Recommendations. Teachers have received professional development in differentiated instructional strategies as well as effective effort strategies. Additional professional development in metacognitive strategies would provide all teachers with added tools to take students’ critical thinking skills to a deeper level and enhance the rigor of the course. Professional development in effective effort strategies was provided to all teachers between 2010‐11 and 2012‐13. A review of the effective effort strategies and best practices for implementing these strategies may help teachers engage all students and provide additional support to students so they may increase their level of motivation and effort.
Short‐term outcomes Over 80% of students reported being motivated to do well in their English and history classes and over 70% putting forth a lot of effort into their English and history classes. These percentages are similar to the overall percent of students that earned an A, B, or C in both English and history. There were no significant differences by race/ethnicity or gender.
Medium‐term outcomes In English and history, nearly all students who earned honors credit in both semesters are enrolled in an honors level course in 10th grade, as well as a majority of the students who earned honors credit in at least one semester. A majority of the students who did not earn honors credit at all are generally enrolled in a level 2 class in 10th grade. This is consistent with enrollment patterns seen with the comparison cohorts.
22
Limitations There are several limitations to the evaluation report at this time. It is too early in the program implementation to report many outcomes, particularly long‐term outcomes that reflect the goals of the restructured freshman year initiative. These long‐term goals of the
initiative are student enrollment in honors and AP courses in 11th and 12th grade, academic achievement, ACT scores, AP exam scores, graduation rates, and college acceptance rates. At this time the evaluation report is only able to document a few short‐term and medium‐term outcomes.
Next steps In the 2014‐15 school year, the Illinois State Board of Education will implement a new state testing program to replace the current Prairie State Achievement Exam. Currently the anticipated exam will be the Partnership for Assessment of Readiness for College and Careers (PARCC). This assessment will not include the ACT, which is currently administered to all juniors and is part of the long‐term outcome data. The impact on the restructured freshman initiative and the subsequent evaluation is substantial, and includes an impact on the administration of fourth quarter earned honors credit assessments, as well as the availability of longitudinal ACT data for all students. In January 2014, Illinois approved the Next Generation Science Standards (NGSS). The biology team will be working to align the curriculum to these newly adopted standards.
Next report Evaluation Report #2 is expected to be available in April, 2015 and will include the following outcomes:
implementation of the earned honors credit model for 1 humanities and biology for the 2013‐14 cohort;
semester grade analysis for 1 humanities and biology for the 2013‐14 cohort;
11th grade course enrollment for the 2012‐13 cohort;
freshman survey data for the 2013‐14 cohort; and
junior year survey data for the 2012‐13 and 2013‐14 cohorts.
Appendix A ‐ Data Collection Methods
23
Focus groups: The purpose of the focus groups was to gather feedback from teachers on the strengths and weaknesses of the 1 Humanities and biology curricula and the earned honors credit model, their professional development needs, and improvements to the initiative. Focus groups included:
2011‐12 First Quarter ‐ three‐quarters of the English teachers
2011‐12 Third Quarter ‐ over one‐half of the history teachers
2012‐13 Third Quarter – over three‐quarters of the biology teachers
2012‐13 Fourth Quarter ‐ two‐thirds of the English and history teachers Classroom Observations: 1 Humanities. Throughout the third quarter of 2011‐12, 83 classroom observations were conducted. The observations covered 40 history classrooms and 43 English classrooms for 30 minutes each. Throughout the second quarter of 2012‐13, 45 classroom observations were conducted. The observations covered 20 history classrooms and 25 English classrooms lasting the full 42 minute period. Biology. Throughout the third quarter of 2012‐13, 41 biology classrooms were observed. During each 42 minute class period there were two independent observation cycles that lasted 15 minutes each, for a total of 82 observations. This large number of observations allowed for an increase in the reliability of the Classroom Assessment Scoring System for Secondary (CLASS‐S) measurement tool, as well an opportunity to effectively observe and score student and teacher interactions during the first half of the lesson and the second half of the lesson. The use of the Classroom Assessment Scoring System for Secondary (CLASS‐S) instrument for the biology observations is different than the observation tool used for the 1 humanities classes. While the CLASS‐S instrument is a more valid and reliable measurement tool, this instrument was not available for use until after the observations of the 1 humanities classes had already occurred. Student Survey: All freshmen were surveyed each spring through their humanities classes. The freshman survey has been administered, annually, since 2008‐09, with significant modifications made in 2012‐13 to the survey constructs and questions. The constructs explored in the freshman survey include: effective effort, locus of control (new in 2012‐13), motivation, and rigor. Other Data: Data collected through ETHS’ student database include course enrollment, course grades, and PLAN exam scores.
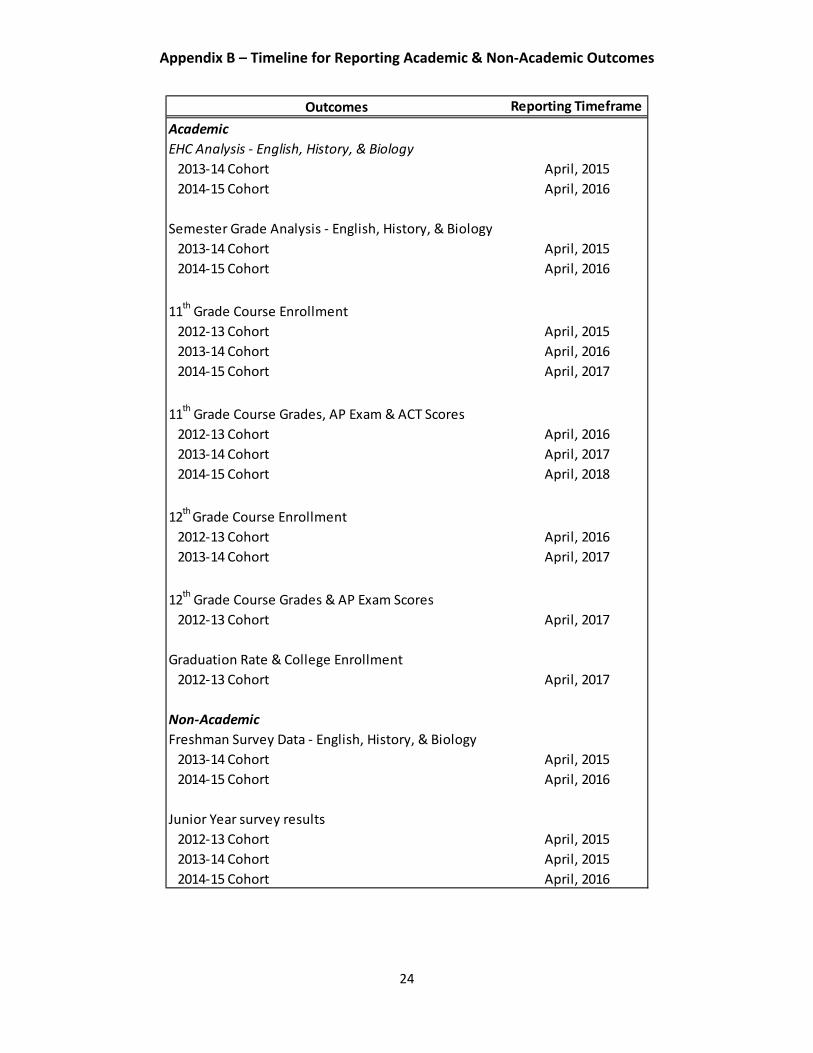
Appendix B – Timeline for Reporting Academic & Non‐Academic Outcomes
24
Outcomes Reporting Timeframe
Academic
EHC Analysis ‐ English, History, & Biology
2013‐14 Cohort April, 2015
2014‐15 Cohort April, 2016
Semester Grade Analysis ‐ English, History, & Biology
2013‐14 Cohort April, 2015
2014‐15 Cohort April, 2016
11th Grade Course Enrollment
2012‐13 Cohort April, 2015
2013‐14 Cohort April, 2016
2014‐15 Cohort April, 2017
11th Grade Course Grades, AP Exam & ACT Scores
2012‐13 Cohort April, 2016
2013‐14 Cohort April, 2017
2014‐15 Cohort April, 2018
12th Grade Course Enrollment
2012‐13 Cohort April, 2016
2013‐14 Cohort April, 2017
12th Grade Course Grades & AP Exam Scores
2012‐13 Cohort April, 2017
Graduation Rate & College Enrollment
2012‐13 Cohort April, 2017
Non‐Academic
Freshman Survey Data ‐ English, History, & Biology
2013‐14 Cohort April, 2015
2014‐15 Cohort April, 2016
Junior Year survey results
2012‐13 Cohort April, 2015
2013‐14 Cohort April, 2015
2014‐15 Cohort April, 2016
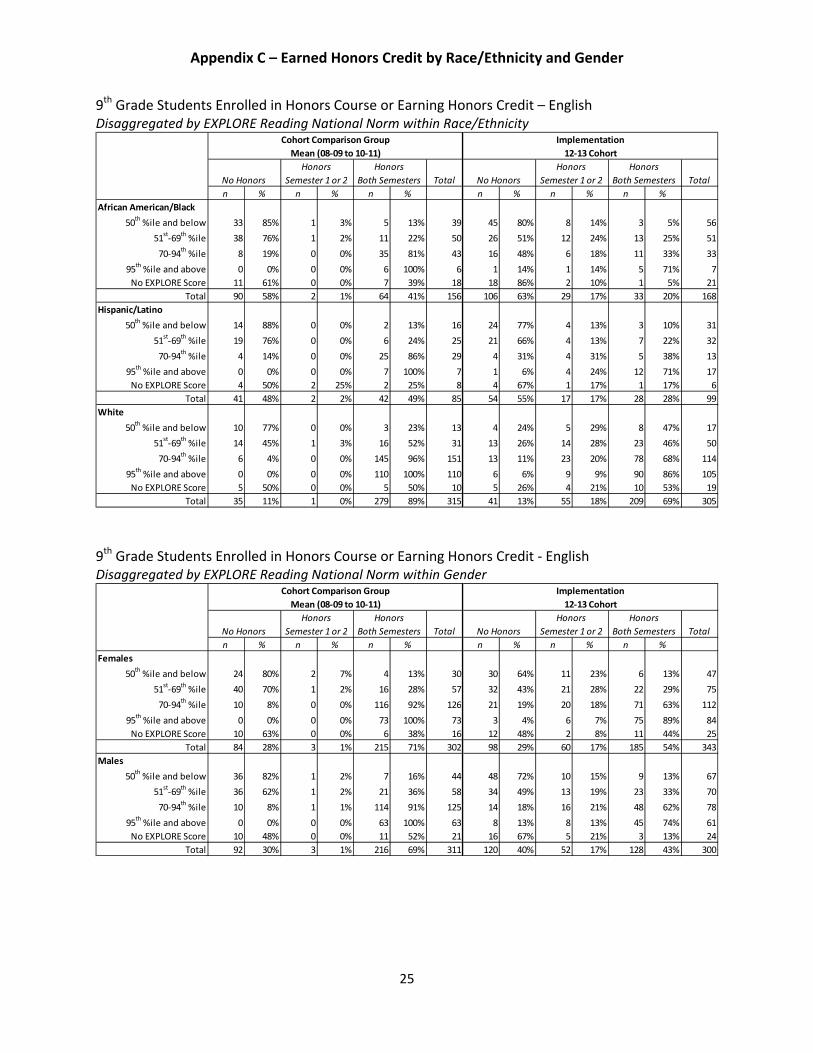
Appendix C – Earned Honors Credit by Race/Ethnicity and Gender
25
9th Grade Students Enrolled in Honors Course or Earning Honors Credit – English Disaggregated by EXPLORE Reading National Norm within Race/Ethnicity
9th Grade Students Enrolled in Honors Course or Earning Honors Credit ‐ English Disaggregated by EXPLORE Reading National Norm within Gender
Total Total
n % n % n % n % n % n %
African American/Black
50th %ile and below 33 85% 1 3% 5 13% 39 45 80% 8 14% 3 5% 56
51st‐69
th %ile 38 76% 1 2% 11 22% 50 26 51% 12 24% 13 25% 51
70‐94th %ile 8 19% 0 0% 35 81% 43 16 48% 6 18% 11 33% 33
95th %ile and above 0 0% 0 0% 6 100% 6 1 14% 1 14% 5 71% 7
No EXPLORE Score 11 61% 0 0% 7 39% 18 18 86% 2 10% 1 5% 21
Total 90 58% 2 1% 64 41% 156 106 63% 29 17% 33 20% 168
Hispanic/Latino
50th %ile and below 14 88% 0 0% 2 13% 16 24 77% 4 13% 3 10% 31
51st‐69
th %ile 19 76% 0 0% 6 24% 25 21 66% 4 13% 7 22% 32
70‐94th %ile 4 14% 0 0% 25 86% 29 4 31% 4 31% 5 38% 13
95th %ile and above 0 0% 0 0% 7 100% 7 1 6% 4 24% 12 71% 17
No EXPLORE Score 4 50% 2 25% 2 25% 8 4 67% 1 17% 1 17% 6
Total 41 48% 2 2% 42 49% 85 54 55% 17 17% 28 28% 99
White
50th %ile and below 10 77% 0 0% 3 23% 13 4 24% 5 29% 8 47% 17
51st‐69
th %ile 14 45% 1 3% 16 52% 31 13 26% 14 28% 23 46% 50
70‐94th %ile 6 4% 0 0% 145 96% 151 13 11% 23 20% 78 68% 114
95th %ile and above 0 0% 0 0% 110 100% 110 6 6% 9 9% 90 86% 105
No EXPLORE Score 5 50% 0 0% 5 50% 10 5 26% 4 21% 10 53% 19
Total 35 11% 1 0% 279 89% 315 41 13% 55 18% 209 69% 305
Honors
Both SemestersNo Honors
Honors
Semester 1 or 2
Honors
Both Semesters No Honors
Honors
Semester 1 or 2
Cohort Comparison Group
Mean (08‐09 to 10‐11)
Implementation
12‐13 Cohort
Total Total
n % n % n % n % n % n %
Females
50th %ile and below 24 80% 2 7% 4 13% 30 30 64% 11 23% 6 13% 47
51st‐69
th %ile 40 70% 1 2% 16 28% 57 32 43% 21 28% 22 29% 75
70‐94th %ile 10 8% 0 0% 116 92% 126 21 19% 20 18% 71 63% 112
95th %ile and above 0 0% 0 0% 73 100% 73 3 4% 6 7% 75 89% 84
No EXPLORE Score 10 63% 0 0% 6 38% 16 12 48% 2 8% 11 44% 25
Total 84 28% 3 1% 215 71% 302 98 29% 60 17% 185 54% 343
Males
50th %ile and below 36 82% 1 2% 7 16% 44 48 72% 10 15% 9 13% 67
51st‐69
th %ile 36 62% 1 2% 21 36% 58 34 49% 13 19% 23 33% 70
70‐94th %ile 10 8% 1 1% 114 91% 125 14 18% 16 21% 48 62% 78
95th %ile and above 0 0% 0 0% 63 100% 63 8 13% 8 13% 45 74% 61
No EXPLORE Score 10 48% 0 0% 11 52% 21 16 67% 5 21% 3 13% 24
Total 92 30% 3 1% 216 69% 311 120 40% 52 17% 128 43% 300
Cohort Comparison Group
Mean (08‐09 to 10‐11)
Implementation
12‐13 Cohort
No Honors
Honors
Semester 1 or 2
Honors
Both Semesters No Honors
Honors
Semester 1 or 2
Honors
Both Semesters
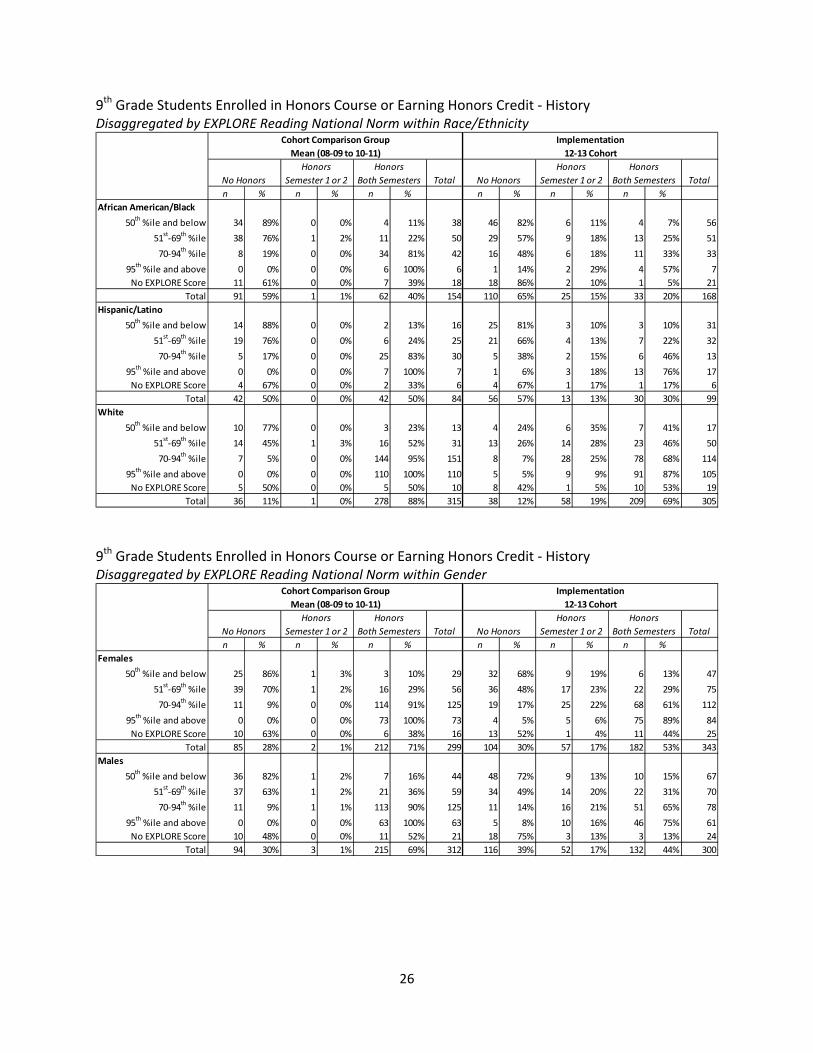
26
9th Grade Students Enrolled in Honors Course or Earning Honors Credit ‐ History Disaggregated by EXPLORE Reading National Norm within Race/Ethnicity
9th Grade Students Enrolled in Honors Course or Earning Honors Credit ‐ History Disaggregated by EXPLORE Reading National Norm within Gender
Total Total
n % n % n % n % n % n %
African American/Black
50th %ile and below 34 89% 0 0% 4 11% 38 46 82% 6 11% 4 7% 56
51st‐69
th %ile 38 76% 1 2% 11 22% 50 29 57% 9 18% 13 25% 51
70‐94th %ile 8 19% 0 0% 34 81% 42 16 48% 6 18% 11 33% 33
95th %ile and above 0 0% 0 0% 6 100% 6 1 14% 2 29% 4 57% 7
No EXPLORE Score 11 61% 0 0% 7 39% 18 18 86% 2 10% 1 5% 21
Total 91 59% 1 1% 62 40% 154 110 65% 25 15% 33 20% 168
Hispanic/Latino
50th %ile and below 14 88% 0 0% 2 13% 16 25 81% 3 10% 3 10% 31
51st‐69
th %ile 19 76% 0 0% 6 24% 25 21 66% 4 13% 7 22% 32
70‐94th %ile 5 17% 0 0% 25 83% 30 5 38% 2 15% 6 46% 13
95th %ile and above 0 0% 0 0% 7 100% 7 1 6% 3 18% 13 76% 17
No EXPLORE Score 4 67% 0 0% 2 33% 6 4 67% 1 17% 1 17% 6
Total 42 50% 0 0% 42 50% 84 56 57% 13 13% 30 30% 99
White
50th %ile and below 10 77% 0 0% 3 23% 13 4 24% 6 35% 7 41% 17
51st‐69
th %ile 14 45% 1 3% 16 52% 31 13 26% 14 28% 23 46% 50
70‐94th %ile 7 5% 0 0% 144 95% 151 8 7% 28 25% 78 68% 114
95th %ile and above 0 0% 0 0% 110 100% 110 5 5% 9 9% 91 87% 105
No EXPLORE Score 5 50% 0 0% 5 50% 10 8 42% 1 5% 10 53% 19
Total 36 11% 1 0% 278 88% 315 38 12% 58 19% 209 69% 305
Honors
Both Semesters
Cohort Comparison Group
Mean (08‐09 to 10‐11)
Implementation
12‐13 Cohort
No Honors
Honors
Semester 1 or 2
Honors
Both Semesters No Honors
Honors
Semester 1 or 2
Total Total
n % n % n % n % n % n %
Females
50th %ile and below 25 86% 1 3% 3 10% 29 32 68% 9 19% 6 13% 47
51st‐69
th %ile 39 70% 1 2% 16 29% 56 36 48% 17 23% 22 29% 75
70‐94th %ile 11 9% 0 0% 114 91% 125 19 17% 25 22% 68 61% 112
95th %ile and above 0 0% 0 0% 73 100% 73 4 5% 5 6% 75 89% 84
No EXPLORE Score 10 63% 0 0% 6 38% 16 13 52% 1 4% 11 44% 25
Total 85 28% 2 1% 212 71% 299 104 30% 57 17% 182 53% 343
Males
50th %ile and below 36 82% 1 2% 7 16% 44 48 72% 9 13% 10 15% 67
51st‐69
th %ile 37 63% 1 2% 21 36% 59 34 49% 14 20% 22 31% 70
70‐94th %ile 11 9% 1 1% 113 90% 125 11 14% 16 21% 51 65% 78
95th %ile and above 0 0% 0 0% 63 100% 63 5 8% 10 16% 46 75% 61
No EXPLORE Score 10 48% 0 0% 11 52% 21 18 75% 3 13% 3 13% 24
Total 94 30% 3 1% 215 69% 312 116 39% 52 17% 132 44% 300
Cohort Comparison Group
Mean (08‐09 to 10‐11)
Implementation
12‐13 Cohort
No Honors
Honors
Semester 1 or 2
Honors
Both Semesters No Honors
Honors
Semester 1 or 2
Honors
Both Semesters


