29
FY 2020 results presentation 52 Weeks to 27 th December 2020 1 Restructured Recapitalised Ready for Relaunch
FY 2020 results presentation52 Weeks to 27th December 20201
Restructured Recapitalised Ready for Relaunch
Agenda
2 FY 2020 results presentation
1. Introduction
2. FY 2020 Results
3. Restructured, Recapitalised and Ready for Relaunch
4. Q&A
Andy Hornby (CEO)
Kirk Davis (CFO)
Andy Hornby
Andy Hornby and Kirk Davis
Summary
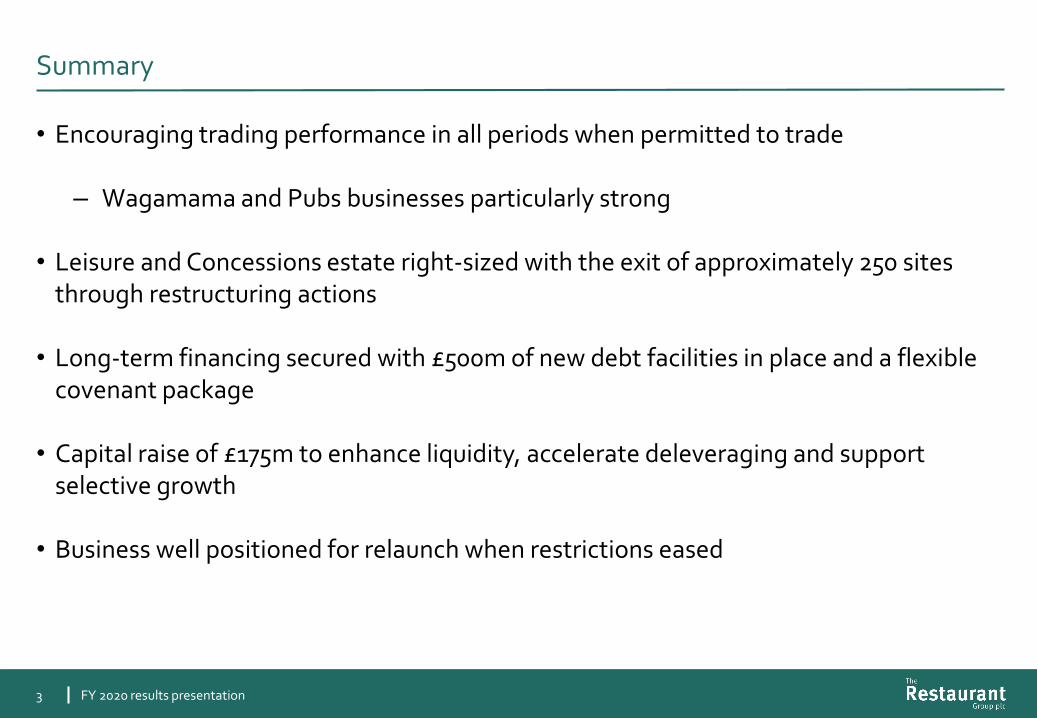
• Encouraging trading performance in all periods when permitted to trade
– Wagamama and Pubs businesses particularly strong
• Leisure and Concessions estate right-sized with the exit of approximately 250 sites through restructuring actions
• Long-term financing secured with £500m of new debt facilities in place and a flexible covenant package
• Capital raise of £175m to enhance liquidity, accelerate deleveraging and support selective growth
• Business well positioned for relaunch when restrictions eased
3 FY 2020 results presentation
4
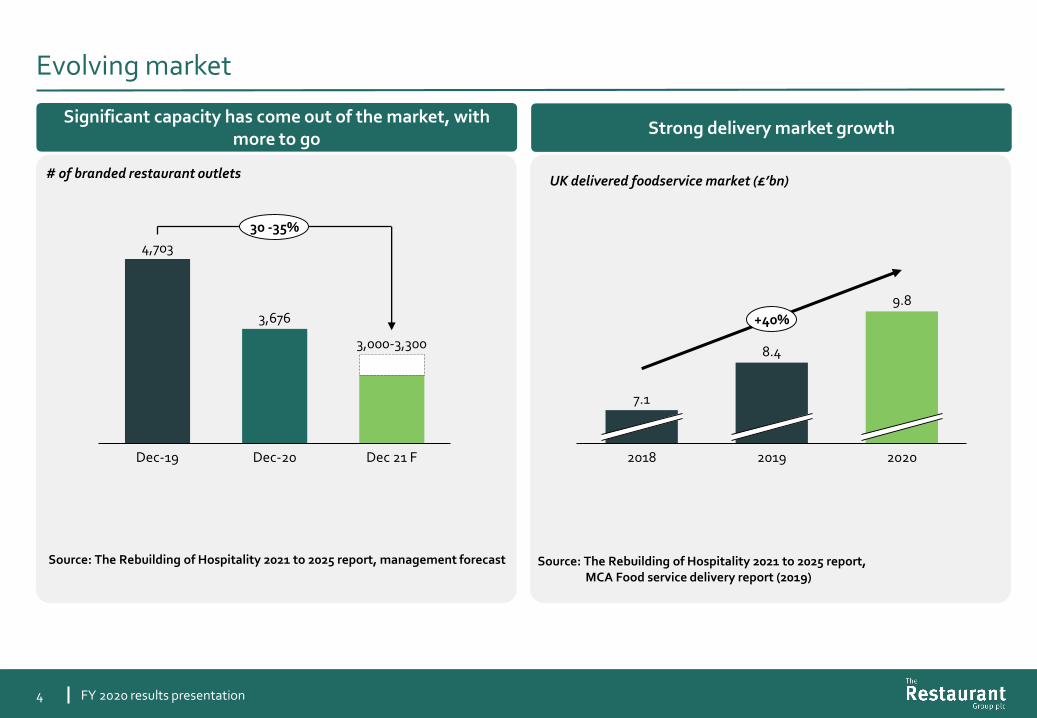
Evolving market
Significant capacity has come out of the market, with more to go
4,703
3,676
Dec-20Dec-19 Dec 21 F
3,000-3,300
30 -35%
# of branded restaurant outletsUK delivered foodservice market (£’bn)
7.1
9.8
8.4
20202018 2019
+40%
Source: The Rebuilding of Hospitality 2021 to 2025 report, management forecast
Strong delivery market growth
Source: The Rebuilding of Hospitality 2021 to 2025 report,MCA Food service delivery report (2019)
FY 2020 results presentation
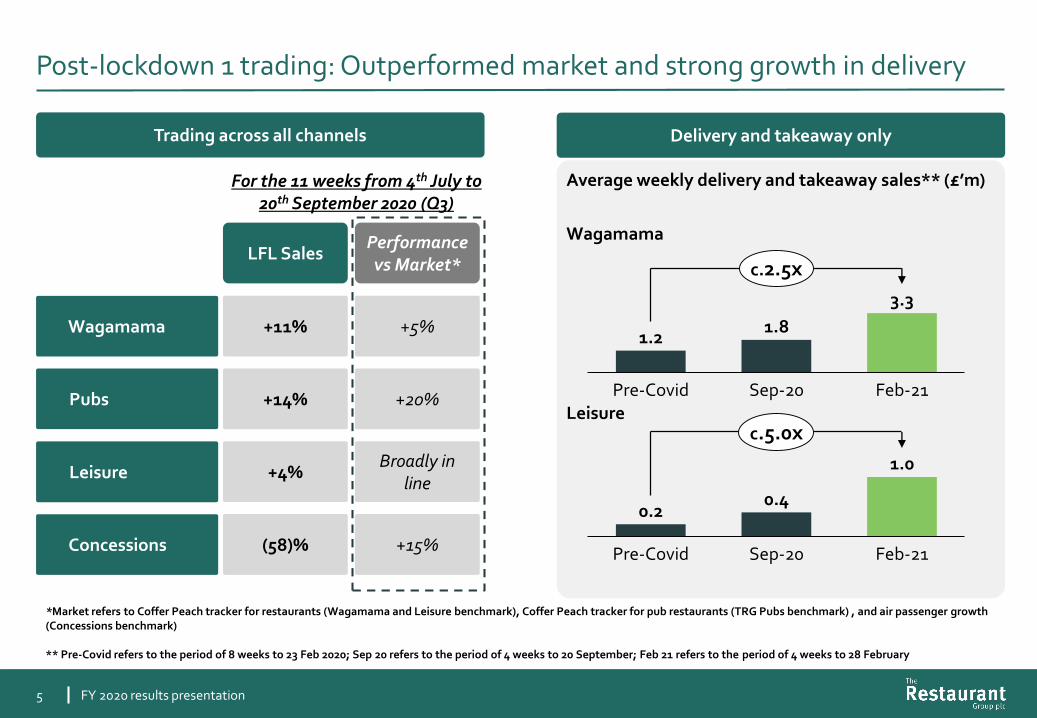
Post-lockdown 1 trading: Outperformed market and strong growth in delivery
5
For the 11 weeks from 4th July to 20th September 2020 (Q3)
*Market refers to Coffer Peach tracker for restaurants (Wagamama and Leisure benchmark), Coffer Peach tracker for pub restaurants (TRG Pubs benchmark) , and air passenger growth (Concessions benchmark)
** Pre-Covid refers to the period of 8 weeks to 23 Feb 2020; Sep 20 refers to the period of 4 weeks to 20 September; Feb 21 refers to the period of 4 weeks to 28 February
+5%
Performance vs Market*
+20%
Broadly in line
+15%
+11%
LFL Sales
+14%
+4%
(58)%
Wagamama
Pubs
Leisure
Concessions
Trading across all channels Delivery and takeaway only
Sep-20Pre-Covid Feb-21
1.21.8
3.3
c.2.5x
Wagamama
Leisure
Average weekly delivery and takeaway sales** (£’m)
Feb-21Sep-20Pre-Covid
0.20.4
1.0
c.5.0x
FY 2020 results presentation
6
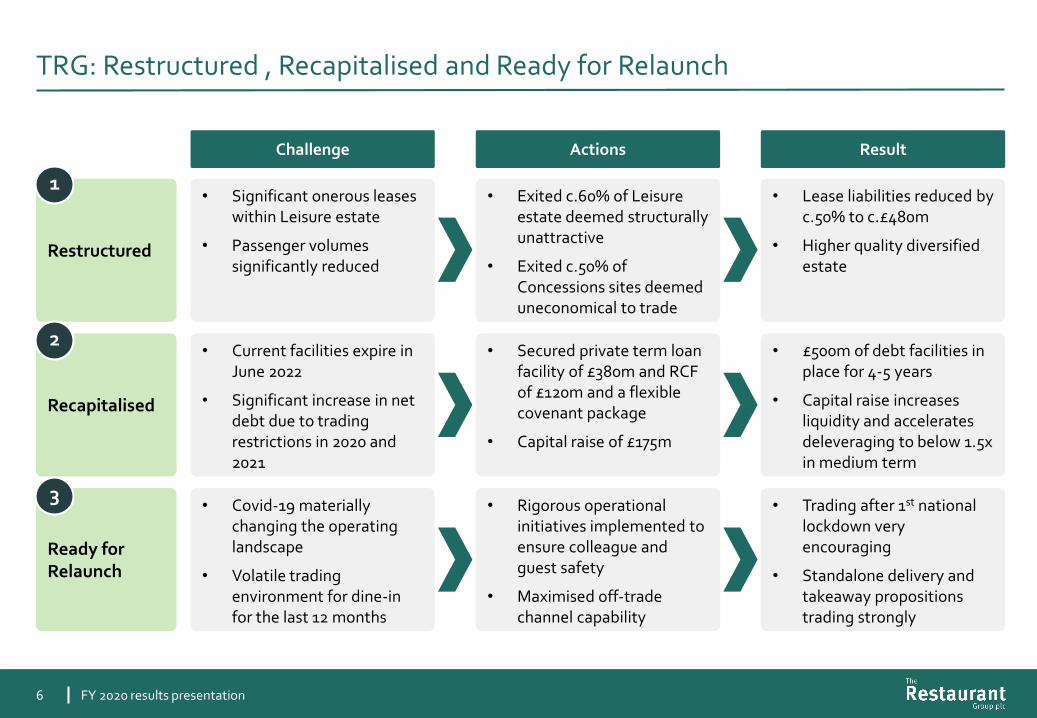
TRG: Restructured , Recapitalised and Ready for Relaunch
Challenge Actions Result
Restructured
• Significant onerous leases within Leisure estate
• Passenger volumes significantly reduced
• Exited c.60% of Leisure estate deemed structurally unattractive
• Exited c.50% of Concessions sites deemed uneconomical to trade
• Lease liabilities reduced by c.50% to c.£480m
• Higher quality diversified estate
Recapitalised
• Current facilities expire in June 2022
• Significant increase in net debt due to trading restrictions in 2020 and 2021
• Secured private term loan facility of £380m and RCF of £120m and a flexible covenant package
• Capital raise of £175m
• £500m of debt facilities in place for 4-5 years
• Capital raise increases liquidity and accelerates deleveraging to below 1.5x in medium term
Ready for Relaunch
• Covid-19 materially changing the operating landscape
• Volatile trading environment for dine-in for the last 12 months
• Rigorous operational initiatives implemented to ensure colleague and guest safety
• Maximised off-trade channel capability
• Trading after 1st national lockdown very encouraging
• Standalone delivery and takeaway propositions trading strongly
1
2
3
FY 2020 results presentation
F Y 2 0 2 0 r e s u l t s p r e s e n t a t i o n
7
FY 2020 Results
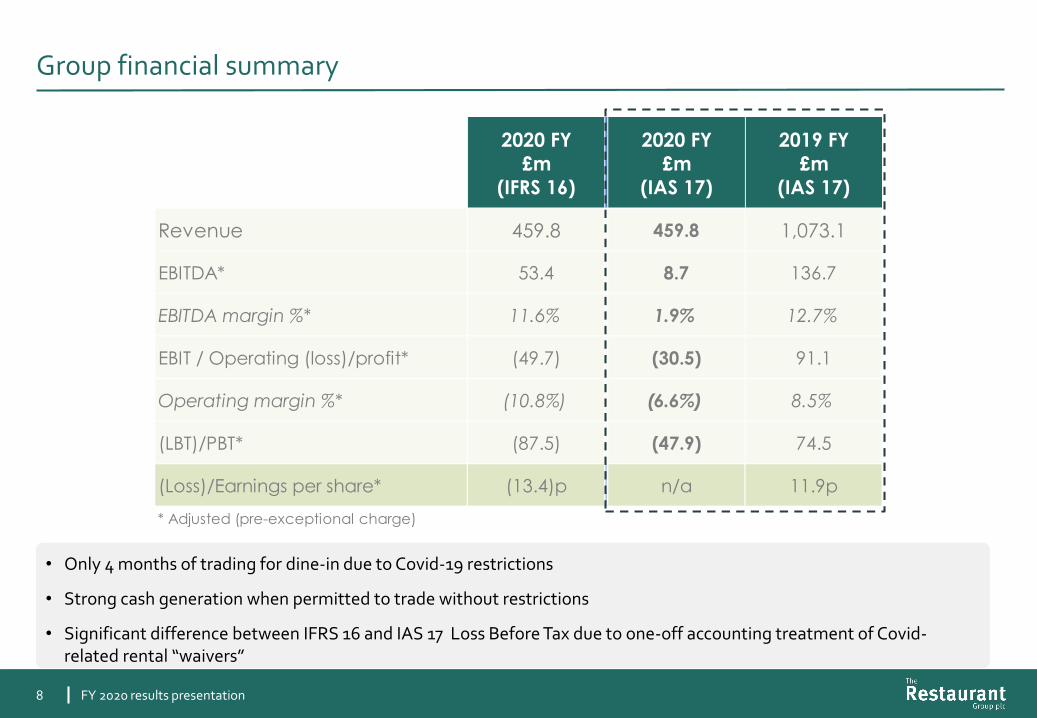
Group financial summary
8
• Only 4 months of trading for dine-in due to Covid-19 restrictions
• Strong cash generation when permitted to trade without restrictions
• Significant difference between IFRS 16 and IAS 17 Loss Before Tax due to one-off accounting treatment of Covid-related rental “waivers”
Column1
2020 FY
£m
(IFRS 16)
2
0
2
1
2020 FY
£m
(IAS 17)
2019 FY
£m
(IAS 17)
Revenue 459.8 459.8 1,073.1
EBITDA* 53.4 8.7 136.7
EBITDA margin %* 11.6% 1.9% 12.7%
EBIT / Operating (loss)/profit* (49.7) (30.5) 91.1
Operating margin %* (10.8%) (6.6%) 8.5%
(LBT)/PBT* (87.5) (47.9) 74.5
(Loss)/Earnings per share* (13.4)p n/a 11.9p
* Adjusted (pre-exceptional charge)
FY 2020 results presentation
Group cash flow (on a pre IFRS-16 basis)
9
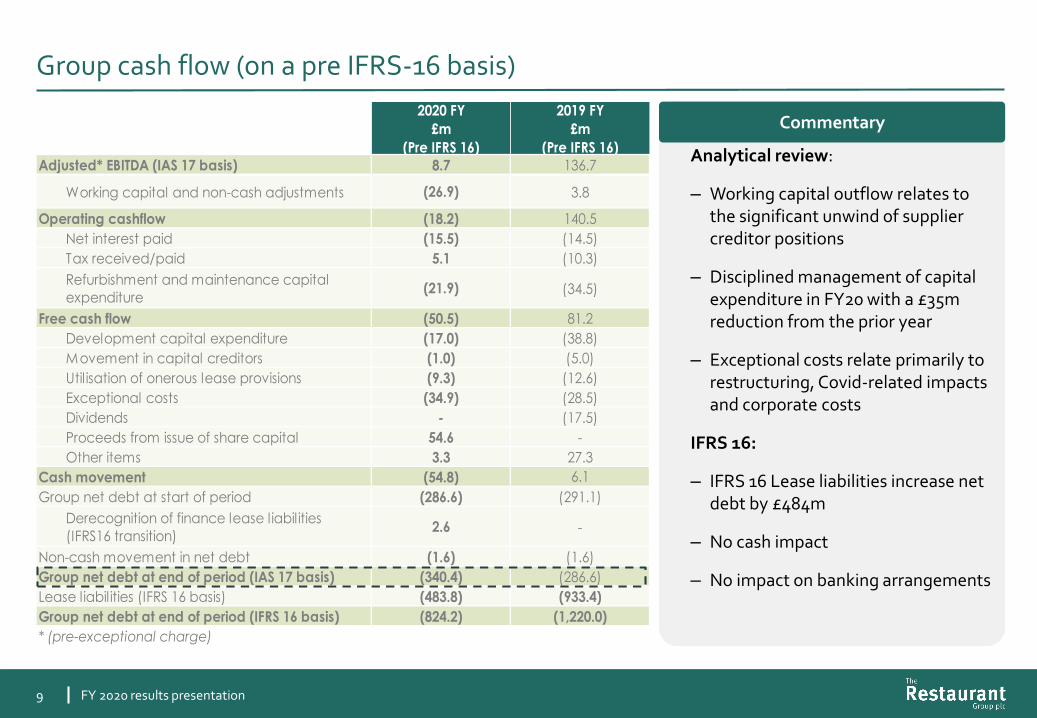
Analytical review:
– Working capital outflow relates to the significant unwind of supplier creditor positions
– Disciplined management of capital expenditure in FY20 with a £35m reduction from the prior year
– Exceptional costs relate primarily to restructuring, Covid-related impacts and corporate costs
IFRS 16:
– IFRS 16 Lease liabilities increase net debt by £484m
– No cash impact
– No impact on banking arrangements
CommentaryColumn1
2020 FY
£m
(Pre IFRS 16)
2019 FY
£m
(Pre IFRS 16)
Adjusted* EBITDA (IAS 17 basis) 8.7 136.7
Working capital and non-cash adjustments (26.9) 3.8
Operating cashflow (18.2) 140.5
Net interest paid (15.5) (14.5)
Tax received/paid 5.1 (10.3)
Refurbishment and maintenance capital
expenditure(21.9) (34.5)
Free cash flow (50.5) 81.2
Development capital expenditure (17.0) (38.8)
Movement in capital creditors (1.0) (5.0)
Util isation of onerous lease provisions (9.3) (12.6)
Exceptional costs (34.9) (28.5)
Dividends - (17.5)
Proceeds from issue of share capital 54.6 -
Other items 3.3 27.3
Cash movement (54.8) 6.1
Group net debt at start of period (286.6) (291.1)
Derecognition of finance lease liabilities
(IFRS16 transition)2.6 -
Non-cash movement in net debt (1.6) (1.6)
Group net debt at end of period (IAS 17 basis) (340.4) (286.6)
Lease liabilities (IFRS 16 basis) (483.8) (933.4)
Group net debt at end of period (IFRS 16 basis) (824.2) (1,220.0)
* (pre-exceptional charge)
FY 2020 results presentation
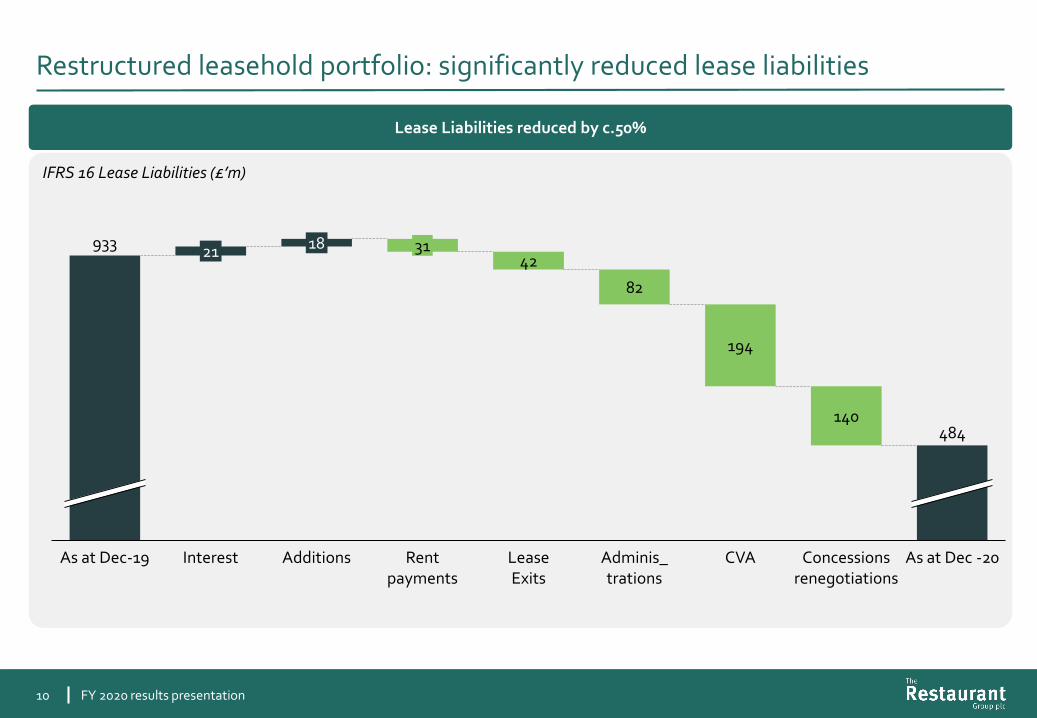
Restructured leasehold portfolio: significantly reduced lease liabilities
10
Lease Liabilities reduced by c.50%
IFRS 16 Lease Liabilities (£’m)
194
As at Dec-19
21 31
Interest CVA
140
Concessions renegotiations
As at Dec -20Adminis_trations
82
LeaseExits
42
Rent payments
Additions
18933
484
FY 2020 results presentation
Secured long-term debt financing
11
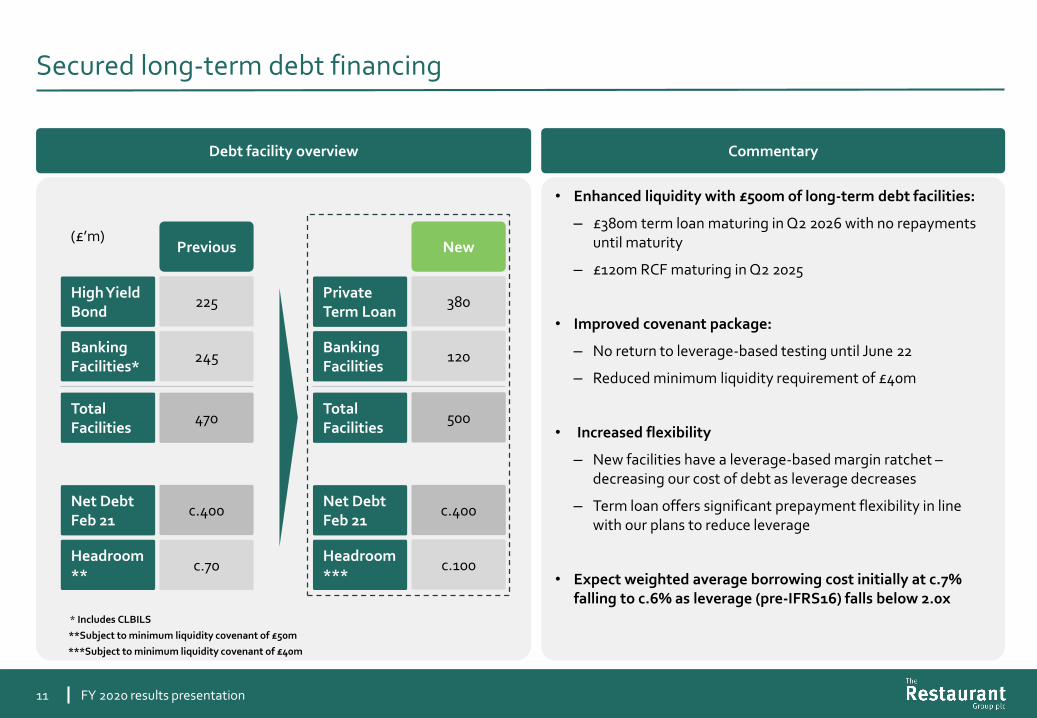
Debt facility overview Commentary
• Enhanced liquidity with £500m of long-term debt facilities:
– £380m term loan maturing in Q2 2026 with no repayments until maturity
– £120m RCF maturing in Q2 2025
• Improved covenant package:
– No return to leverage-based testing until June 22
– Reduced minimum liquidity requirement of £40m
• Increased flexibility
– New facilities have a leverage-based margin ratchet –decreasing our cost of debt as leverage decreases
– Term loan offers significant prepayment flexibility in line with our plans to reduce leverage
• Expect weighted average borrowing cost initially at c.7% falling to c.6% as leverage (pre-IFRS16) falls below 2.0x
225
Previous
245
High Yield Bond
Banking Facilities*
(£’m)
380
New
120
Private Term Loan
Banking Facilities
470Total Facilities
500Total Facilities
c.400
c.70
Net Debt Feb 21
Headroom**
c.400
c.100
Net Debt Feb 21
Headroom***
* Includes CLBILS
**Subject to minimum liquidity covenant of £50m
***Subject to minimum liquidity covenant of £40m
FY 2020 results presentation
12
Restructured,
Recapitalised and
Ready for Relaunch
F Y 2 0 2 0 r e s u l t s p r e s e n t a t i o n
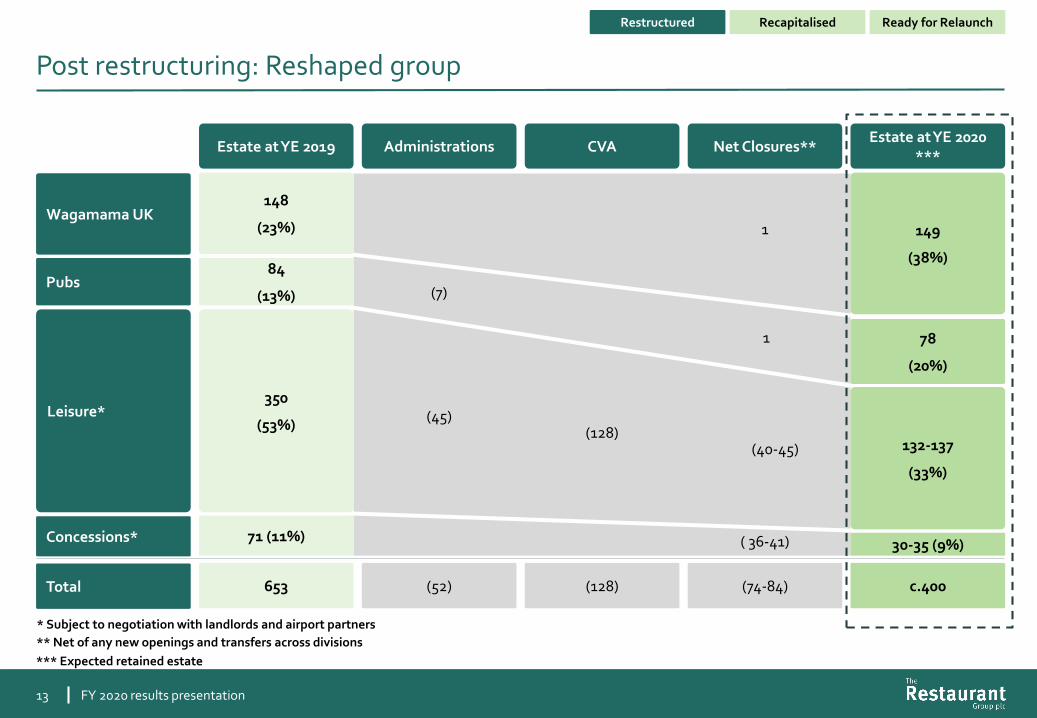
Post restructuring: Reshaped group
13
148
(23%)
Estate at YE 2019
84
(13%)
71 (11%)
653
350
(53%)
Wagamama UK
Pubs
Concessions*
Total
Leisure*
CVA
(128)
(128)
Net Closures**
(74-84)
( 36-41)
(40-45)
1 149
(38%)
Estate at YE 2020***
78
(20%)
c.400
132-137
(33%)
30-35 (9%)
* Subject to negotiation with landlords and airport partners
** Net of any new openings and transfers across divisions
Administrations
(52)
(45)
(7)
*** Expected retained estate
1
Restructured Recapitalised Ready for Relaunch
FY 2020 results presentation
14
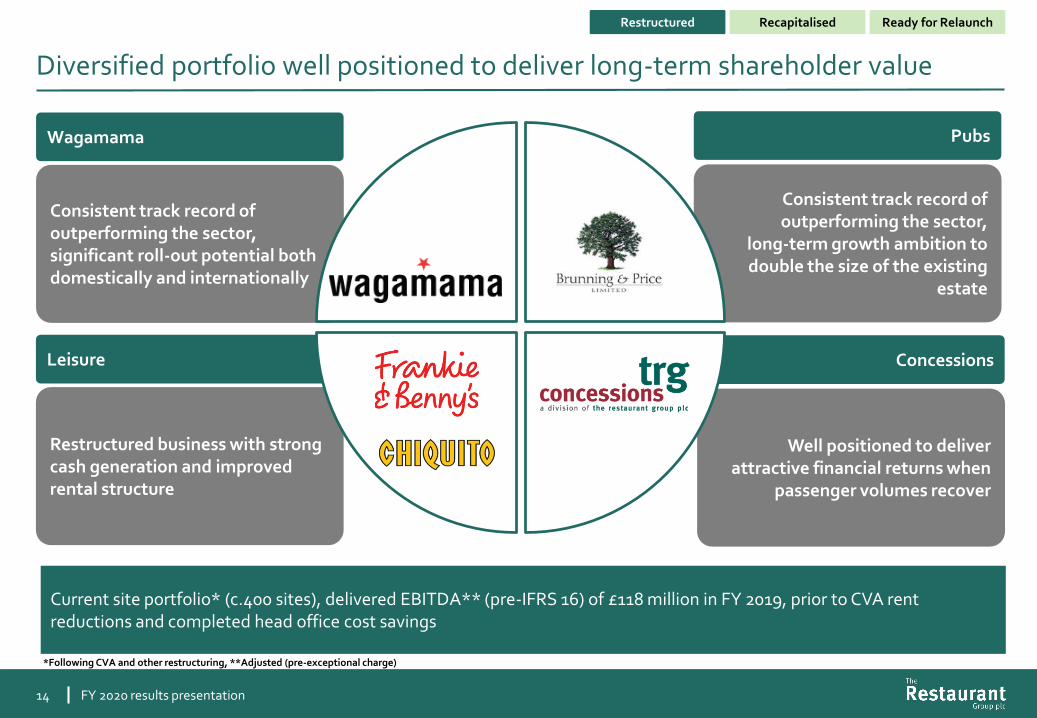
Diversified portfolio well positioned to deliver long-term shareholder value
Well positioned to deliver attractive financial returns when
passenger volumes recover
Concessions
Restructured business with strong cash generation and improved rental structure
Leisure
Consistent track record of outperforming the sector,
long-term growth ambition to double the size of the existing
estate
Pubs
Consistent track record of outperforming the sector,significant roll-out potential both domestically and internationally
Wagamama
Current site portfolio* (c.400 sites), delivered EBITDA** (pre-IFRS 16) of £118 million in FY 2019, prior to CVA rent reductions and completed head office cost savings
*Following CVA and other restructuring, **Adjusted (pre-exceptional charge)
Restructured Recapitalised Ready for Relaunch
FY 2020 results presentation

Wagamama: The UK’s Pan-Asian Market Leader
Proposed £175m capital raise and 2020 Full year results
Market Leading UK LFL SalesCompelling proposition
5%
-5%
15%
-
10%
Q4
Q3
Restaurant MarketWagamama
FY17 FY18 FY19
Q1
Q4
Q2
Q3
Q1
Q4
Q2
Q3
Like-for-like sales %
Strong customer ratings
Top 10 UK casual dining NPS
Q1
Q3
FY20
Excluding lockdown(20 March – 4 July)
(*) (*)
Differentiated brand with no large direct competitor
Fully aligned to key structural trends: fastservice, convenience, delivery and healthy options
Scale food expertise, difficult to replicate
Unique, cohesive culture with industry leading team turnover rate
Cuisine travels extremely well for delivery and takeaway
15
4946
37 35 3430 29 29 28 27
Nandos TGI Pizza Express
Five Guys
Waga mama
Cote PrezzoPizza Hut
Yo Sushi Bills
Note: Results as per TRG financial year quartersSource: Peach Tracker, Restaurants
Source: BrandVue NPS – January 2021*2020 Q1 represents a period of 8 weeks to 23 February 2020; 2020 Q3 represents a period of 11 weeks to 20 September
Restructured Recapitalised Ready for Relaunch
FY 2020 results presentation
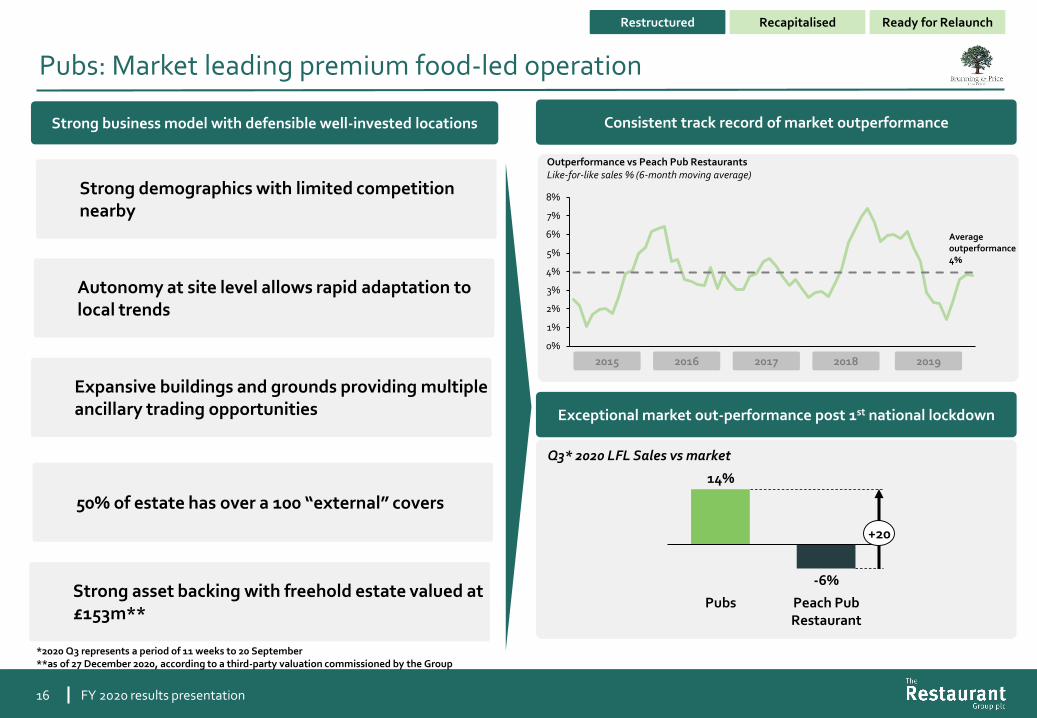
Pubs: Market leading premium food-led operation
Proposed £175m capital raise and 2020 Full year results
Strong business model with defensible well-invested locations
Strong demographics with limited competition nearby
Autonomy at site level allows rapid adaptation to local trends
Expansive buildings and grounds providing multiple ancillary trading opportunities
50% of estate has over a 100 “external” covers
Strong asset backing with freehold estate valued at £153m**
0%
1%
2%
3%
4%
5%
6%
7%
8%
Averageoutperformance 4%
2015 2016 2017 2018 2019
Outperformance vs Peach Pub RestaurantsLike-for-like sales % (6-month moving average)
Q3* 2020 LFL Sales vs market
-6%
Pubs Peach PubRestaurant
14%
+20
Exceptional market out-performance post 1st national lockdown
Consistent track record of market outperformance
16
*2020 Q3 represents a period of 11 weeks to 20 September**as of 27 December 2020, according to a third-party valuation commissioned by the Group
Restructured Recapitalised Ready for Relaunch
FY 2020 results presentation

17
Leisure and Concessions: Restructuring has resulted in a higher quality portfolio
0
30
60
90
4
Number of year to next exit date
3 71 2 65 8 9 >9
Leisure Lease Profile (# of sites)
Leisure Concessions
YE 2019
RestructuredYE 2019
33 (c.45%)
20 (c.30%)
18 (c.25%)
71
4-5 (c.10%)
Retained Estate
17-20 (c.60%)
9-10 (c.30%)
30-35
London airports*
Major city airports*
Regional Airports*
Total
* Includes some sites located in rail stations** Minimum guaranteed rents
Average lease maturity reduced from 6 to 2.3 years
Retained estate (c.40% of 2019 sites) represents c.70% of 2019 outlet EBITDA
Retained estate (c.50% of 2019 sites) represents c.80% of 2019 outlet EBITDA
Achieved improved terms with the majority of our airport partners through reduced MGRs** linked to passenger volumes
Restructured Recapitalised Ready for Relaunch
FY 2020 results presentation
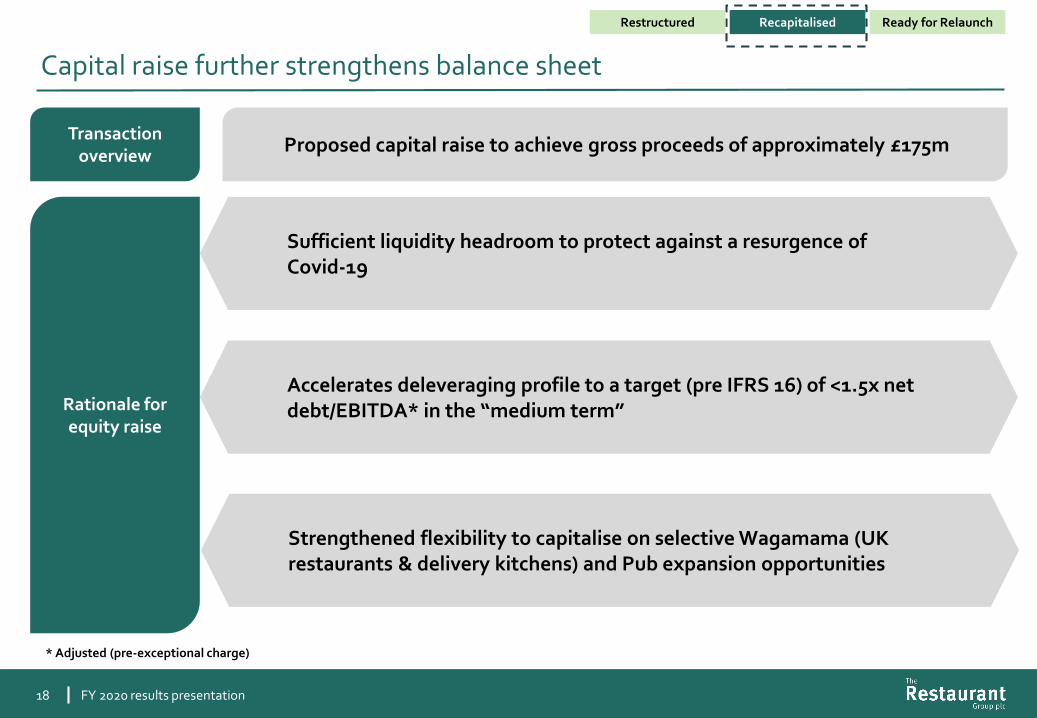
Capital raise further strengthens balance sheet
18
Transaction overview
Rationale for equity raise
Proposed capital raise to achieve gross proceeds of approximately £175m
Sufficient liquidity headroom to protect against a resurgence of Covid-19
Accelerates deleveraging profile to a target (pre IFRS 16) of <1.5x net debt/EBITDA* in the “medium term”
Strengthened flexibility to capitalise on selective Wagamama (UK restaurants & delivery kitchens) and Pub expansion opportunities
Restructured Recapitalised Ready for Relaunch
* Adjusted (pre-exceptional charge)
FY 2020 results presentation
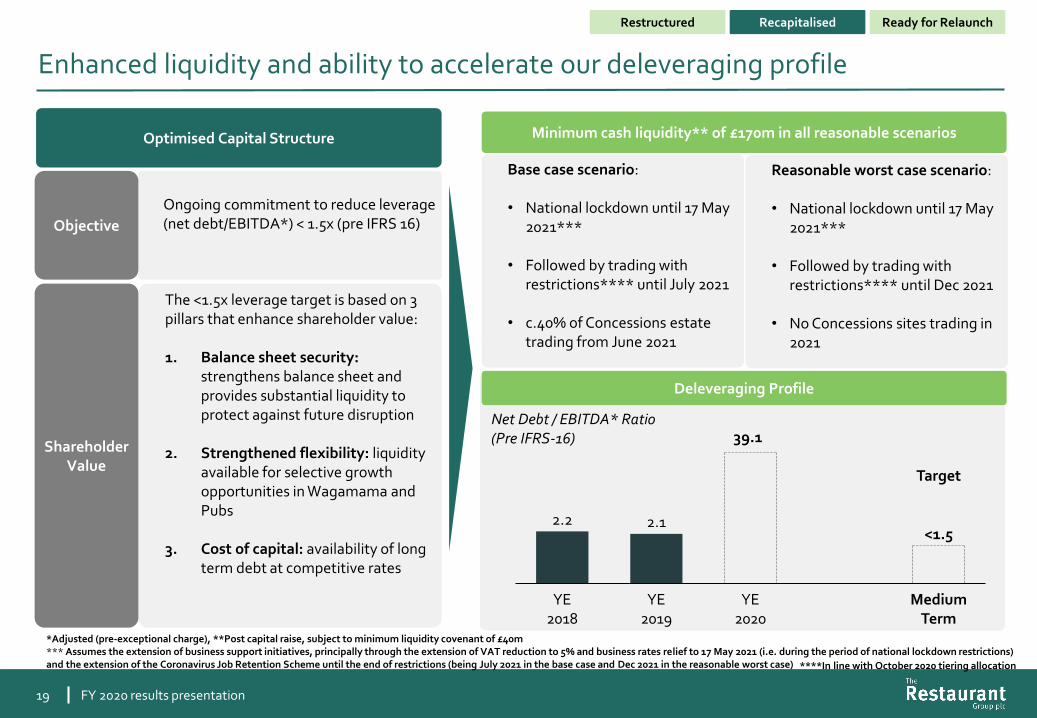
Net Debt / EBITDA* Ratio(Pre IFRS-16)
19
Enhanced liquidity and ability to accelerate our deleveraging profile
2.2 2.1
YE2020
YE2018
YE2019
<1.5
Medium Term
Target
Optimised Capital Structure
Ongoing commitment to reduce leverage (net debt/EBITDA*) < 1.5x (pre IFRS 16)Objective
The <1.5x leverage target is based on 3 pillars that enhance shareholder value:
1. Balance sheet security: strengthens balance sheet and provides substantial liquidity to protect against future disruption
2. Strengthened flexibility: liquidity available for selective growth opportunities in Wagamama and Pubs
3. Cost of capital: availability of long term debt at competitive rates
Shareholder Value
Deleveraging Profile
Minimum cash liquidity** of £170m in all reasonable scenarios
Base case scenario:
• National lockdown until 17 May 2021***
• Followed by trading with restrictions**** until July 2021
• c.40% of Concessions estate trading from June 2021
*Adjusted (pre-exceptional charge), **Post capital raise, subject to minimum liquidity covenant of £40m*** Assumes the extension of business support initiatives, principally through the extension of VAT reduction to 5% and business rates relief to 17 May 2021 (i.e. during the period of national lockdown restrictions) and the extension of the Coronavirus Job Retention Scheme until the end of restrictions (being July 2021 in the base case and Dec 2021 in the reasonable worst case)
39.1
Reasonable worst case scenario:
• National lockdown until 17 May 2021***
• Followed by trading with restrictions**** until Dec 2021
• No Concessions sites trading in 2021
****In line with October 2020 tiering allocation
Restructured Recapitalised Ready for Relaunch
FY 2020 results presentation
20
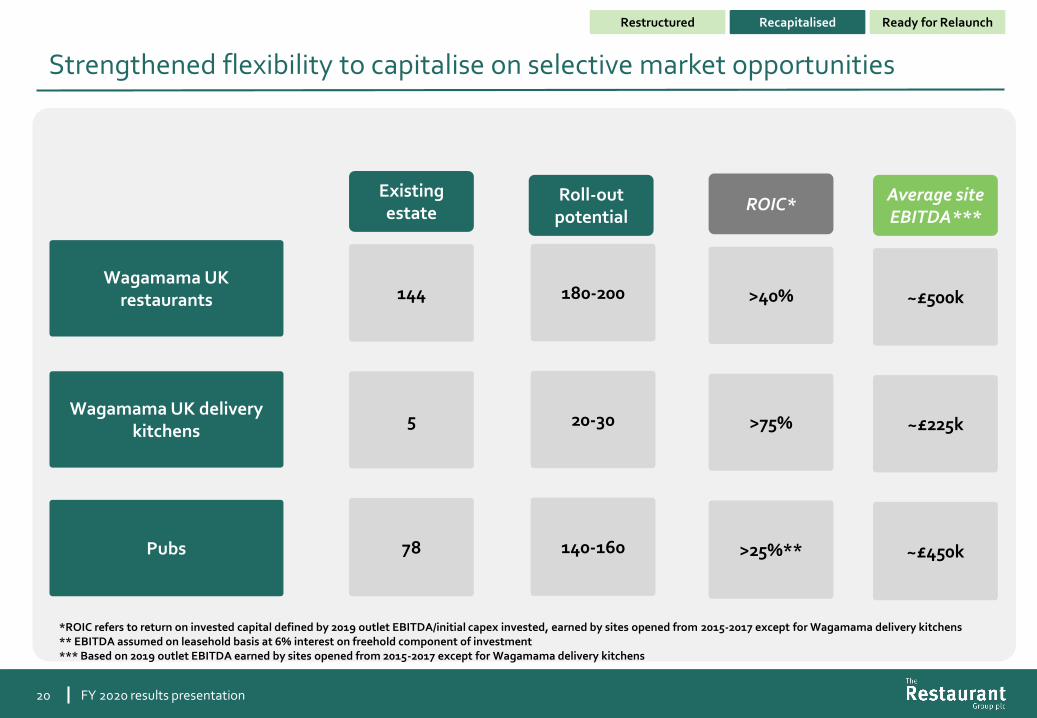
Strengthened flexibility to capitalise on selective market opportunities
144
Existing estate
5
78
Wagamama UK restaurants
ROIC*Roll-out
potential
Wagamama UK delivery kitchens
Pubs
180-200
20-30
140-160
>40%
>75%
>25%**
Average site EBITDA***
~£500k
~£225k
~£450k
*ROIC refers to return on invested capital defined by 2019 outlet EBITDA/initial capex invested, earned by sites opened from 2015-2017 except for Wagamama delivery kitchens ** EBITDA assumed on leasehold basis at 6% interest on freehold component of investment*** Based on 2019 outlet EBITDA earned by sites opened from 2015-2017 except for Wagamama delivery kitchens
Restructured Recapitalised Ready for Relaunch
FY 2020 results presentation
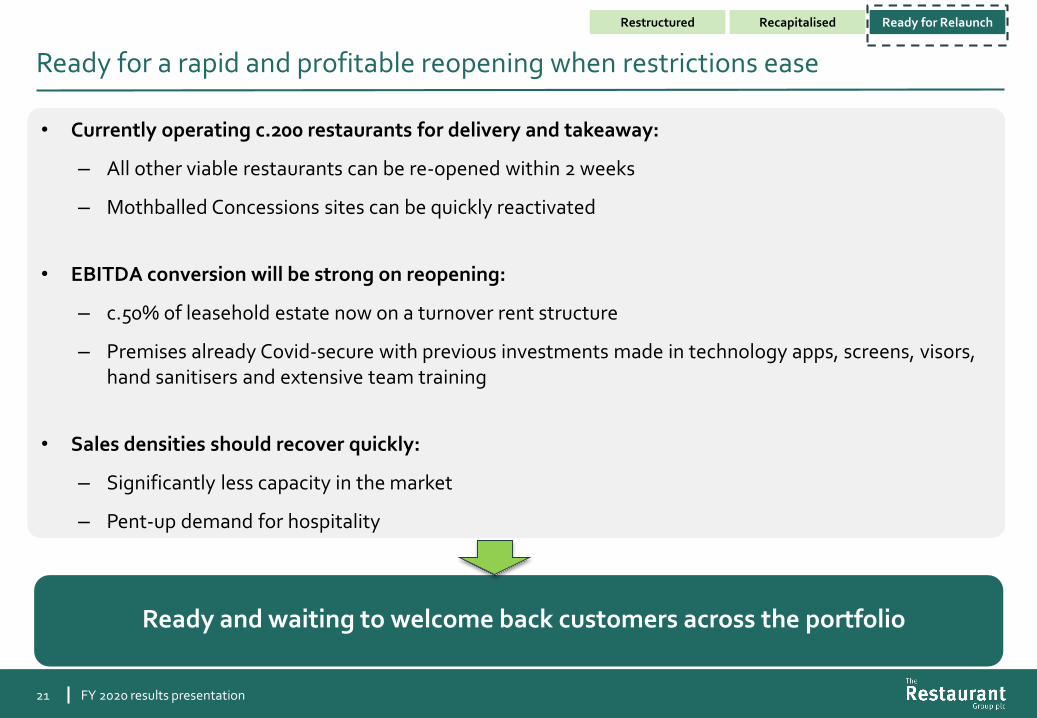
Ready for a rapid and profitable reopening when restrictions ease
21
• Currently operating c.200 restaurants for delivery and takeaway:
– All other viable restaurants can be re-opened within 2 weeks
– Mothballed Concessions sites can be quickly reactivated
• EBITDA conversion will be strong on reopening:
– c.50% of leasehold estate now on a turnover rent structure
– Premises already Covid-secure with previous investments made in technology apps, screens, visors, hand sanitisers and extensive team training
• Sales densities should recover quickly:
– Significantly less capacity in the market
– Pent-up demand for hospitality
Ready and waiting to welcome back customers across the portfolio
Restructured Recapitalised Ready for Relaunch
FY 2020 results presentation
22
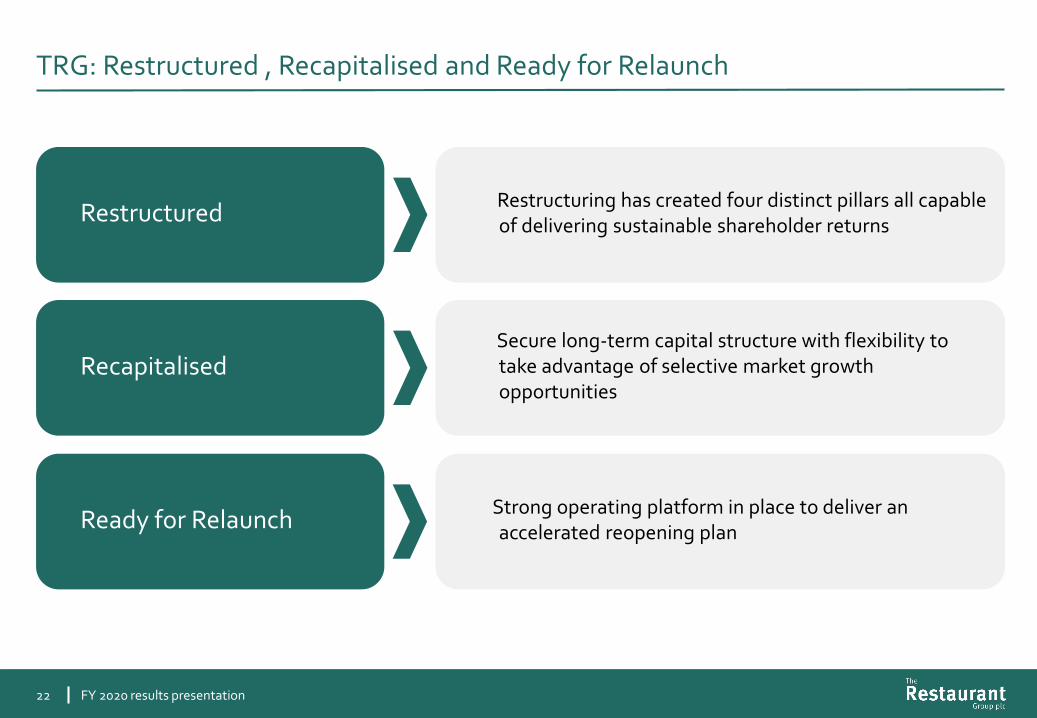
Restructured
Recapitalised
Ready for Relaunch
Restructuring has created four distinct pillars all capable of delivering sustainable shareholder returns
Secure long-term capital structure with flexibility to take advantage of selective market growth opportunities
Strong operating platform in place to deliver an accelerated reopening plan
TRG: Restructured , Recapitalised and Ready for Relaunch
FY 2020 results presentation

F Y 2 0 2 0 r e s u l t s p r e s e n t a t i o n
23
Appendices
24
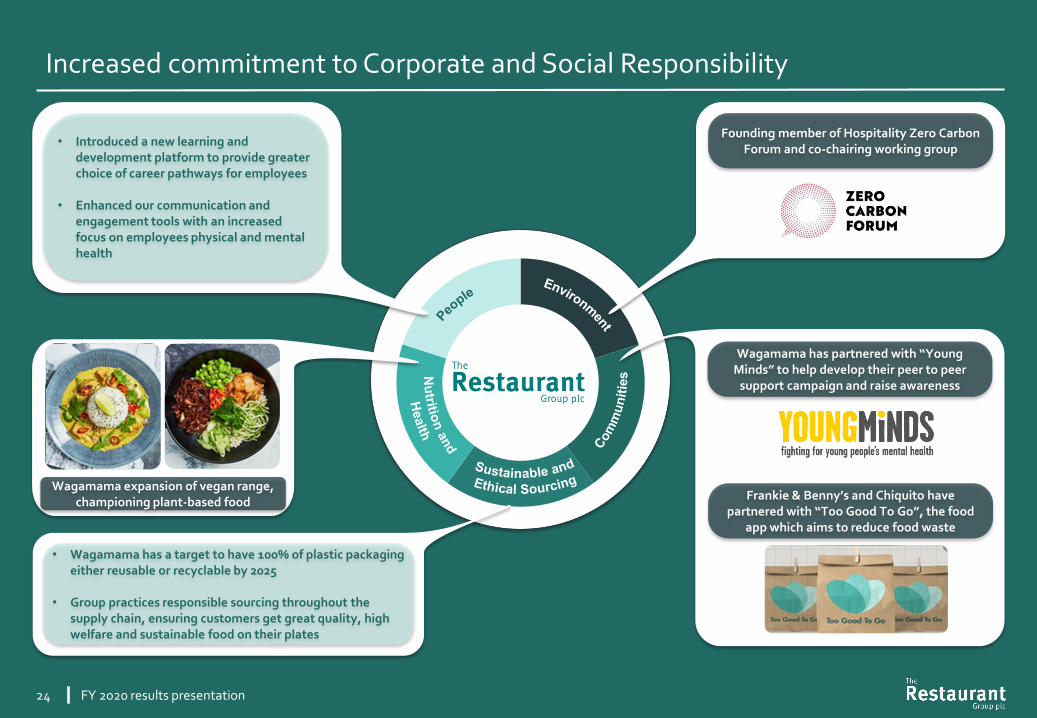
Increased commitment to Corporate and Social Responsibility
Founding member of Hospitality Zero Carbon Forum and co-chairing working group
Wagamama has partnered with “Young Minds” to help develop their peer to peer
support campaign and raise awareness
Frankie & Benny’s and Chiquito have partnered with “Too Good To Go”, the food
app which aims to reduce food waste
• Wagamama has a target to have 100% of plastic packaging either reusable or recyclable by 2025
• Group practices responsible sourcing throughout the supply chain, ensuring customers get great quality, high welfare and sustainable food on their plates
• Introduced a new learning and development platform to provide greater choice of career pathways for employees
• Enhanced our communication and engagement tools with an increased focus on employees physical and mental health
Wagamama expansion of vegan range, championing plant-based food
FY 2020 results presentation
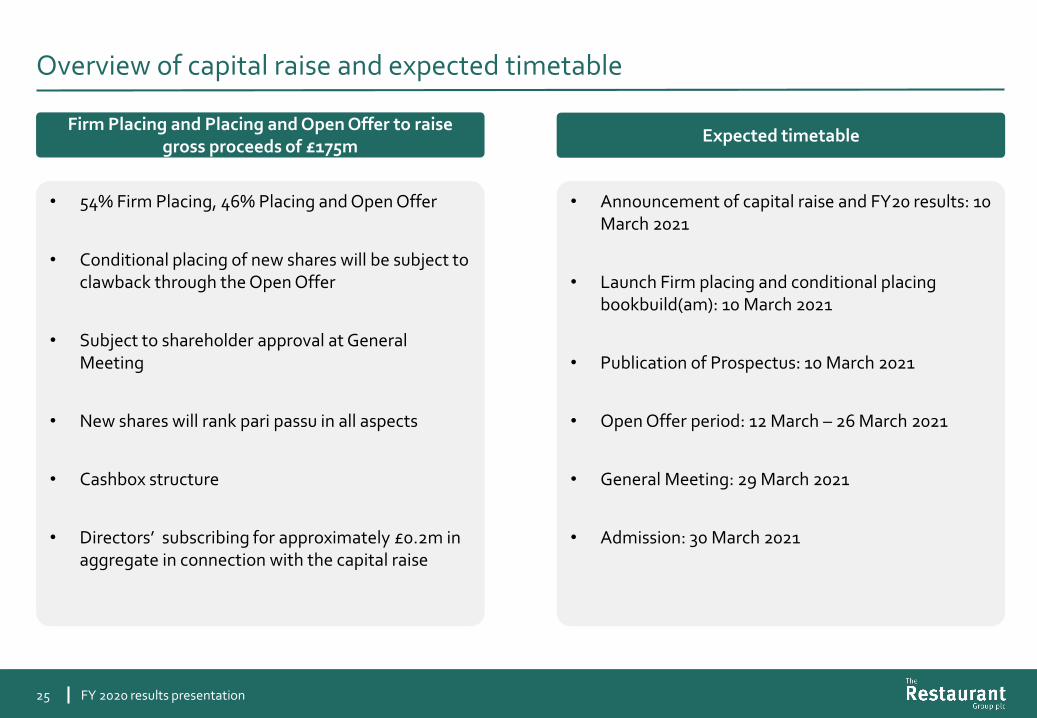
Overview of capital raise and expected timetable
25
• 54% Firm Placing, 46% Placing and Open Offer
• Conditional placing of new shares will be subject to clawback through the Open Offer
• Subject to shareholder approval at General Meeting
• New shares will rank pari passu in all aspects
• Cashbox structure
• Directors’ subscribing for approximately £0.2m in aggregate in connection with the capital raise
• Announcement of capital raise and FY20 results: 10 March 2021
• Launch Firm placing and conditional placing bookbuild(am): 10 March 2021
• Publication of Prospectus: 10 March 2021
• Open Offer period: 12 March – 26 March 2021
• General Meeting: 29 March 2021
• Admission: 30 March 2021
Expected timetableFirm Placing and Placing and Open Offer to raise
gross proceeds of £175m
FY 2020 results presentation
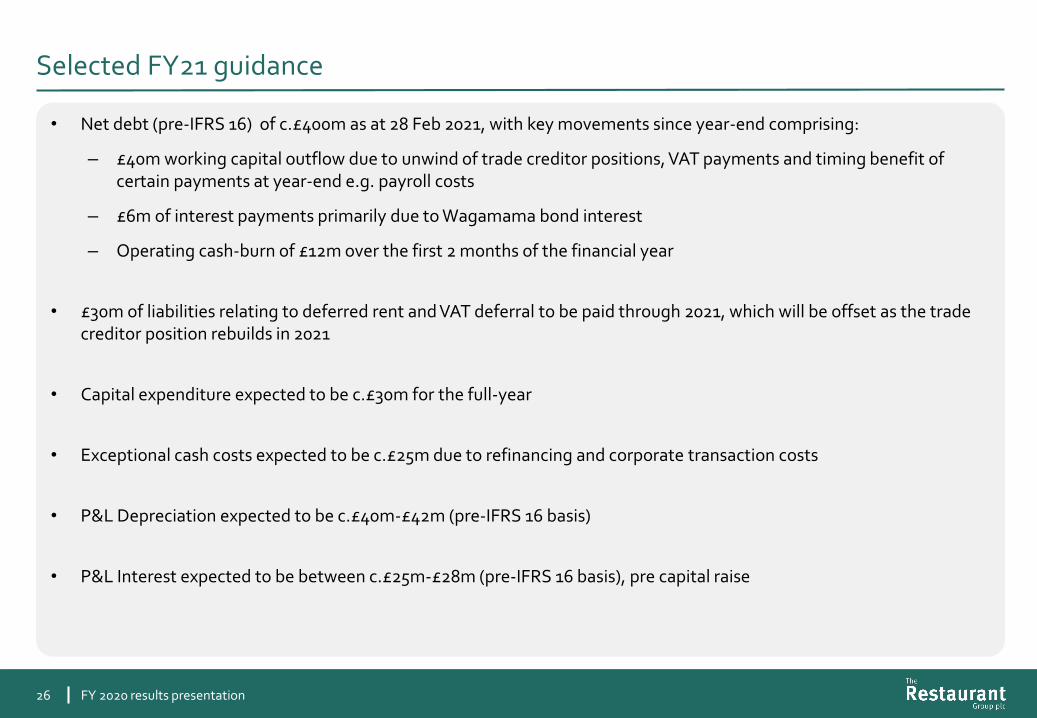
Selected FY21 guidance
26
• Net debt (pre-IFRS 16) of c.£400m as at 28 Feb 2021, with key movements since year-end comprising:
– £40m working capital outflow due to unwind of trade creditor positions, VAT payments and timing benefit of certain payments at year-end e.g. payroll costs
– £6m of interest payments primarily due to Wagamama bond interest
– Operating cash-burn of £12m over the first 2 months of the financial year
• £30m of liabilities relating to deferred rent and VAT deferral to be paid through 2021, which will be offset as the trade creditor position rebuilds in 2021
• Capital expenditure expected to be c.£30m for the full-year
• Exceptional cash costs expected to be c.£25m due to refinancing and corporate transaction costs
• P&L Depreciation expected to be c.£40m-£42m (pre-IFRS 16 basis)
• P&L Interest expected to be between c.£25m-£28m (pre-IFRS 16 basis), pre capital raise
FY 2020 results presentation
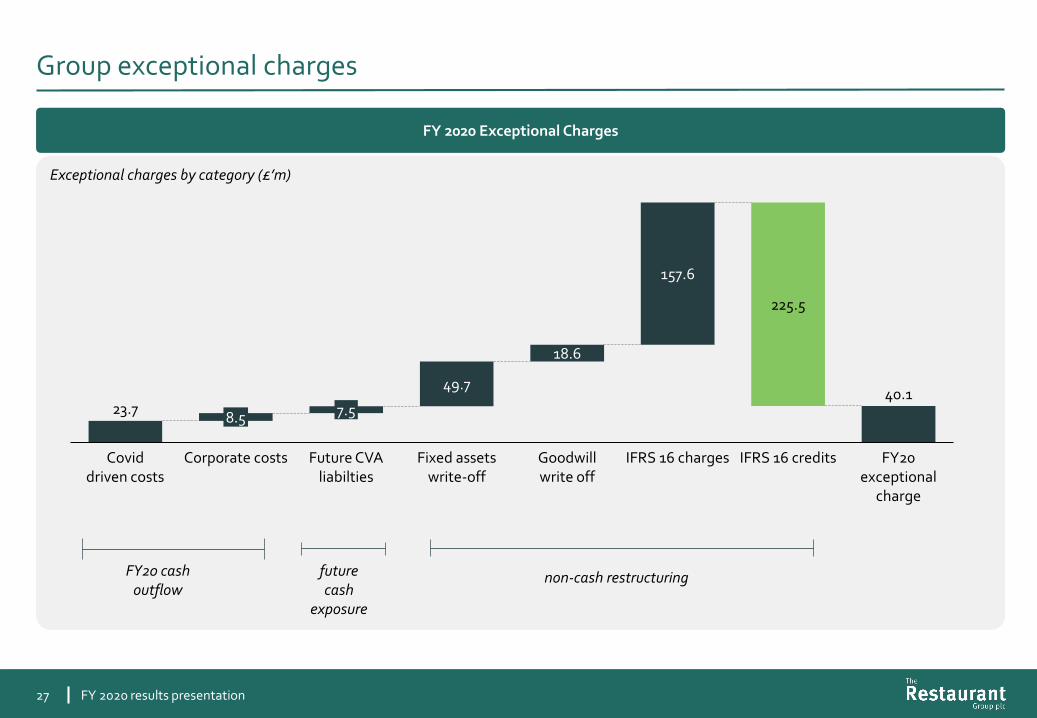
Group exceptional charges
27
Exceptional charges by category (£’m)
23.740.1
49.7
18.6
157.6
225.5
8.5
Goodwill write off
Covid driven costs
Corporate costs
7.5
Future CVA liabilties
Fixed assets write-off
IFRS 16 charges IFRS 16 credits FY20 exceptional
charge
FY 2020 Exceptional Charges
FY20 cash outflow
non-cash restructuringfuturecash
exposure
FY 2020 results presentation
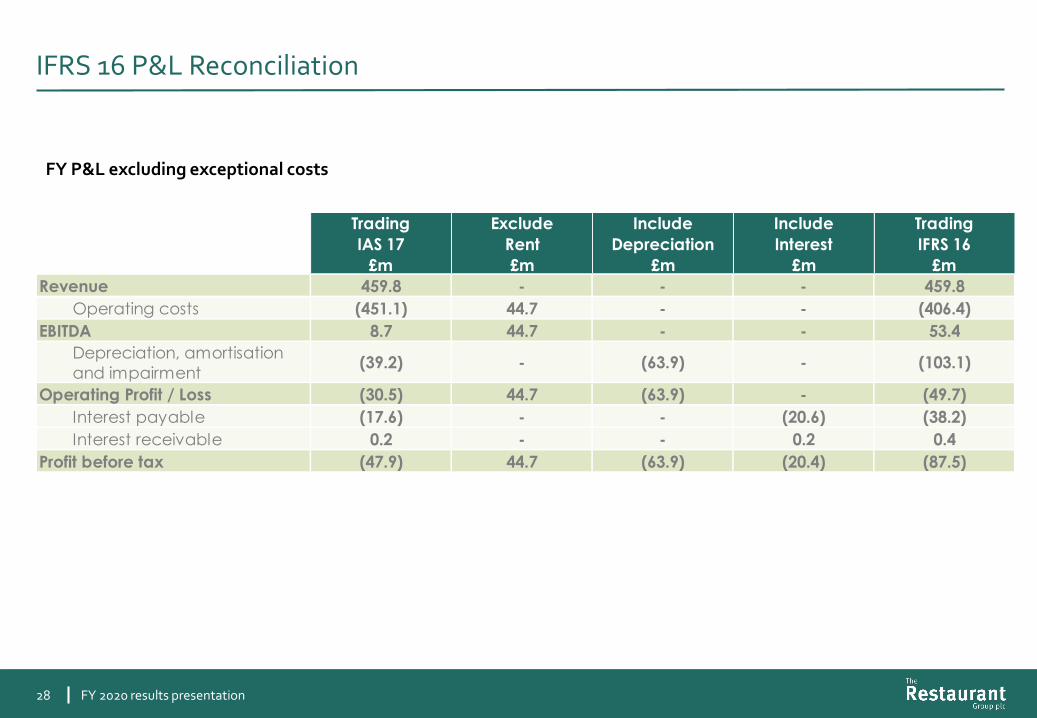
IFRS 16 P&L Reconciliation
28
FY P&L excluding exceptional costs
Column1
Trading
IAS 17
£m
Exclude
Rent
£m
Include
Depreciation
£m
Include
Interest
£m
Trading
IFRS 16
£m
Revenue 459.8 - - - 459.8
Operating costs (451.1) 44.7 - - (406.4)
EBITDA 8.7 44.7 - - 53.4
Depreciation, amortisation
and impairment(39.2) - (63.9) - (103.1)
Operating Profit / Loss (30.5) 44.7 (63.9) - (49.7)
Interest payable (17.6) - - (20.6) (38.2)
Interest receivable 0.2 - - 0.2 0.4
Profit before tax (47.9) 44.7 (63.9) (20.4) (87.5)
FY 2020 results presentation
Disclaimer
29
This presentation does not constitute an offering of securities or otherwise constitute an invitation or inducement to any person to underwrite, subscribe for or otherwise acquire or dispose of securities in The Restaurant Group plc (the "Company") or any other member of The Restaurant Group (the “Group”), nor should it be construed as legal, tax, financial, investment or accounting advice.
This presentation contains forward-looking statements which are subject to known and unknown risks and uncertainties because they relate to future events, many of which are beyond the Group’s control. These forward-looking statements include, without limitation, statements in relation to the Company’s financial outlook and future performance. No assurance can be given that future results will be achieved; actual events or results may differ materially as a result of risks and uncertainties facing the Group. You are cautioned not to rely on these forward-looking statements, which speak only as of the date of this announcement. The Company undertakes no obligation to update or revise any forward-looking statement to reflect any change in its expectations or any change in events, conditions or circumstances. Nothing in this presentation is or should be relied upon as a warranty, promise or representation, express or implied, as to the future performance of the Company or the Group or their businesses.
The Company obtained certain industry and market data used in this presentation from publications and studies conducted by third parties and estimates prepared by the Company based on certain assumptions. While the Company believes that the industry and market data from external sources is accurate and correct, the Company has not independently verified such data or sought to verify that the information remains accurate as of the date of this Presentation and the Company does not make any representation as to the accuracy of suchinformation. Similarly, the Company believes that its internal estimates are reliable, but these estimates have not been verified by any independent sources.
This presentation also contains non-IFRS financial information which the Directors believe is valuable in understanding the performance of the Group. However, non-IRFS information is not uniformly defined by all companies and therefore it may not be comparable with similarly titled measures disclosed by other companies, including those in the Group's industry. Although these measures are important in the assessment and management of the Group’s business, they should not be viewed in isolation or as replacements for, but rather as complementary to, the comparable IFRS measures.
Any securities referred to herein have not been and will not be registered under the U.S. Securities Act of 1933 and may not be offered or sold within the United States absent registration or an applicable exemption from registration requirements.
FY 2020 results presentation


