Reststrahlen band studiesof polycrystalline beryllium oxide
Teddy Chibuye, Carl G. Ribbing, and Ewa WackelgArd
New experimental bulk reflectance and emittance spectra from the 9-15-pm reststrahlen band region ofpolycrystallline beryllium oxide are reported. Note that the polycrystalline material exhibits a dip at 10pm, which is not present in spectra for single crystals. The possible origins of this feature are discussedincluding absorption by a surfaceboscillation excited at boundaries of 20-pum crystalline grains. Owing tothe reststrahlen band, beryllium oxide is selectively low, emitting in the primary atmospheric window,which makes this material useful for frost prevention when electrical conductors cannot be used. Thisprotection is susceptible to reduction by surface contaminants from air pollution. Using an establishedacceleration procedure, we simulated such pollution, and the increase in emittance was measured. Itwas observed that the emissivity increased from 0.31 for a clean surface to 0.36 for a surface heavilypolluted by an industrial atmosphere.
1. Introduction
Beryllium oxide (BeO) is a material with unusualproperties. In particular it combines excellent elec-tric insulating behavior with high thermal conductiv-ity. At room temperature and 99.5% density, theresistivity is higher than 1017 fl cm and the heatconductivity,' 280 W/K m is the highest value encoun-tered among oxide ceramics and glasses2 and compa-rable with that of metallic aluminum. The highcohesive energy manifests itself as extreme hardnessand an unusually high Debye temperature. Themodulus of elasticity, 352 GPa, is one of the highestfound, rivaled among ceramic materials only by thoseof A1 2 0 3 , boron nitride, and SiC.3 A series of studiesby Plendl and Gielisse4-7 have treated the correlationbetween characteristic lattice frequencies and ther-mal, mechanical, and optical properties.
The reststrahlen band is a high-reflectance intervalin the IR wavelength region that is typical for crystalswith at least partial ionic bonding. This band ap-pears as a result of the complex dielectric functionbeing negative, i.e., between the pole and the zero ofe(w). The pole occurs at the lattice resonance fre-quency WT, which corresponds to a zero wave-vector
The authors are with the Department of Solid State Physics,Department of Technology, University of Uppsala, Uppsala,Sweden.
Received 15 July 1993; revised manuscript received 22 Novem-ber 1993.
transverse optical phonon. The zero of E(W) is at wL,
which is the zero wave-vector longitudinal opticalphonon frequency. T is an absorption frequency,whereas a measurement under oblique incidence isrequired for the determination of (L by IR spectros-copy.8 Recently the empirical correlation betweenWT and Young's modulus, as well as the meltingtemperature, was pointed out,9 an observation re-lated to the research mentioned above.- 7
It is straightforward to model the optical latticeexcitation by Lorentz oscillator formalism. In manycases such a model calculation shows good agreementbetween the calculated and the measured spectrum.Admittedly, such a procedure is always open to thequestion of uniqueness, but with some experiencefitting the calculated to the experimental bulk reflec-tance curve will yield reasonable oscillator parameters.These parameters in turn can be used to obtain the IRoptical constants. In the case of BeO this researchwas done almost 25 years ago for single-crystallinesamples.'0 The crystalline structure of BeO is hex-agonal, so the measurements were made with polar-ized light with the E vector parallel and orthogonal tothe crystalline c axis. The oscillator frequenciesthus obtained compared well with the direct determi-nations with Raman spectroscopy. In a recent study,polycrystalline BeO was analyzed with a related, butmore extensive, computer search. As many as sixoscillator frequencies were identified in the proce-dure, which has also been extended to predict thetemperature dependence of the IR properties."
sponds to a band of low emittance covering a range of9-15 [um. This wavelength interval nearly matchesthe primary atmospheric window of 8-13 gim, whichimplies that BeO selectively suppresses thermal radia-tion to outer space from an outdoor object.'2 Inother words, if radiative cooling dominates, which istypical of an evening in a dry atmosphere, a BeOsurface cools slower than most nonmetallic materials.It is well known that the nonselective low emittanceof metals prevents frost formation in such conditions.The combination of metal-like low emittance andhigh visible transmittance, as obtained among agroup of doped, wide-band-gap semiconductors suchas tin oxide and indium tin oxide, is the basis of twopatents for reducing frost formation on vehicle win-dows.'3,4 The meteorological conditions under whichsuch a coating is effective in frost prevention wererecently studied with model atmosphere calcula-tions.15
The condensation of dew or frost upon a surfaceoccurs when the latter is cooled to below the dewpoint, which occurs by radiative exchange with outerspace through the atmospheric window. One cantherefore expect that the selective low emittance ofBeO is almost as effective for frost prevention as thebroadband low emittance of a metal. This effect wasexperimentally demonstrated in Ref. 12. From aphysical point of view the important difference be-tween the nonselective low emittance of a metal andthe selective low emittance of BeO is that the formeris the result of a polarized gas of conduction electrons,whereas the latter is a lattice effect, typical for anionic insulator. An insulating material for frostprevention can find application on high-voltage dctransmission line insulators, over which short cir-cuits sometimes occur because of condensing humid-ity.'6
Apart from thermal emittance a second factor thataffects the frost deposition is the thermal conductiv-ity and capacitance of the material.' 7 The dynamicsof the frost formation is in principle such that thefrost deposits upon surfaces that after sunset coolmost rapidly. Such a surface acts as a cryopump andreduces the local humidity, so that other surfaces,which eventually reach the same temperature, arenot coated with frost. If heat is effectively conductedto the surface from the interior of the body, frost isless readily formed, even if the final temperature is aslow as that of the high-emittance body. As men-tioned above, the heat conductivity of BeO is compa-rable with that of a metal, which again makes BeO agood choice for frost-preventing applications. It wasdemonstrated by interference calculations that ther-mal radiation from BeO in the interval of 7-9.5 glm,
which impairs the frost prevention, could be stronglyreduced if it were used as a thin film on a substrate ofcubic boron nitride.' 8 Cubic boron nitride is one ofthe few compounds with a reststrahlen band at evenshorter wavelengths than that of BeO.
In this paper we are concerned with the IR proper-
ties of polycrystalline BeO. We report new near-normal bulk reflectance and emittance spectra forsamples prepared by different ceramic techniques andalso discuss a secondary absorption that appears inpolycrystalline samples in contrast to single crystals.The results of fitting the classical Lorentz model tothe experimental reflectance, in terms of oscillatorparameters, is given for three different kinds ofpolycrystalline sample and compared with relatedresults from earlier studies.
The application of a tailored IR emittance profile toinsulators for high-voltage direct-current transmis-sion lines would imply exposure to a heavily contami-nated atmosphere over extended periods of time.A layer of atmospheric deposits, such as salt orhydrocarbons, might quench the favorable IR proper-ties of a BeO surface and reduce frost prevention.To evaluate this effect, we exposed BeO samples tosimulated atmospheric contamination in a standardprocedure used for insulating ceramics. The in-crease in emittance after such exposure is reported.
2. Experiment
The polycrystalline samples with grain sizes in therange of 10-20 Am are prepared on a large scale bygreen forming in a powder slurry and subsequentfiring of the shaped part. The fired ceramic is com-mercially available as tape-cast, pressed, or withpolished surfaces.' 9 The material is specified to have99.5% purity with a density of 2.85 compared with thetheoretical 3.01 g/cm3 . The samples were routinelycleaned before the data were taken, but the resultsare representative of as-received materials. The fol-lowing measurements were made: near-normal spec-tral reflectance of tape-cast, polished, and pressedsamples as well as normal spectral emittance at100 C for the clean and contaminated tape-castsamples, which proved to have the strongest rest-strahlen band in the first set of measurements.
The reflectance spectra were recorded with a Perkin-Elmer Model 985 double-beam IR spectrophotometerwith an evaporated aluminum mirror as reference.The reflectance data were used to evaluate the sampleemittance:
E(X) = 1 -R(X), (1)
which is valid provided that the sample is opaque.By convolution with Planck's radiation law, the spec-tral emittance can be used to calculate the average,normal emittance.20 These values integrated overthe entire thermal region are in Table 1. Note thatthey, except for not being hemispherical, are thermalemittance values normally discussed when radiativetransfer is discussed. The emittance values coveringthe limited wavelength region of the primary atmo-spheric window would be much smaller, from 0.27 forclean tape-cast BeO and as high as 0.4, which is arelevant parameter for the selective mechanism men-tioned above.
These measurements were specular, which impliesthat the result may suffer from scattering losses.
The fact that the maximum values were much higherthan 90% makes us somewhat confident that scatter-ing is not great, but we shall see that it probably hassome significance for comparison with the emittancespectra.
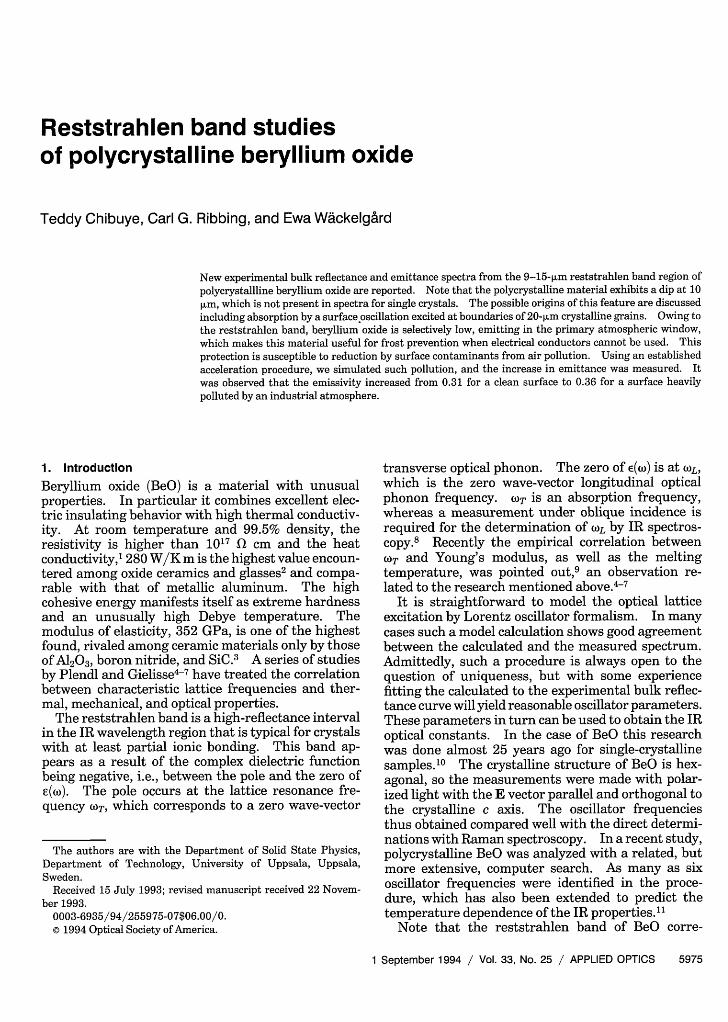
The normal emittance was measured directly withthe same spectrophotometer in the emittance mode.One must heat the sample to obtain a higher radiantintensity from the sample than from the surroundings.A sample holder was constructed and is schematicallyshown in Fig. 1. The holder was an aluminum blockwith dimensions of 8 cm x 5 cm x 5 cm with a 27-4Kanthal resistor in the middle as a heating element.Four samples measuring 35 mm x 50 mm can bemounted simultaneously. The sample temperature,which was measured with a thermocouple attached tothe sample front surface, was stabilized with a tem-perature controller regulating the power supply forthe heater up to a maximum of 40 W. To obtaingood heat transfer, silicon grease was used betweenthe sample and the holder. A sufficient signal-to-noise ratio was ensured by heating the samples to atleast 100 'C. Typically a steady-state temperature isattained after 1 h, during which time the samplecompartment as well as the sample reference slowlywarms. This radiative exchange between the heated
EMITTANCE MODE
_E_ ~POWERThermocouple I I
Fig. 1. Schematic of the arrangement for spectral emittancemeasurements with an IR spectrophotometer: T. C., temperaturecontroller for the heater. The blackbody reference was an alumi-num sheet painted with a high emissive paint.22
sample holder and the sample compartment couldchange the measured sample emittance by 1%.A room-temperature aluminum sheet (RT), paintedwith high emissive black paint,22 was positioned inthe reference channel. To compensate for the factthat the sample not only emits but also reflects someradiation from the surroundings, two recordings weremade in a normalizing procedure. During the firstmeasurement a second black-painted aluminum sheetat 100 C was placed in the sample beam position andthe resulting spectrum was stored. In the secondphase the recording was carried out as shown in Fig.1. By taking the ratio between these two spectra thesample emittance at 100 C is obtained. This proce-dure depends on the black paint having blackbodyproperties, which is only approximately true. It wasverified, however, that there were no significantabsorption bands from the polymeric binder in thewavelength region of the BeO reststrahlen band.
From the geometry of the emittance measurement,with the sample close to the detector house entrance,it appears that the detector accepts more divergentradiation than when the specular attachment for thereflectance measurements is used. We shall comeback to these two latter points when we compare theresults from the two sets of measurements.
As pointed out in Section 1, one might fear that thefrost-preventing effect of a selectively low-emittingsurface might be spoiled by surface deposits. Toobtain a quantitative estimate of the effects fromatmospheric pollution on the IR properties of BeO,the samples were subjected to a standardized acceler-ated atmospheric exposure test.2 ' In this procedurethe samples are immersed in a slurry and then airdried. Two kinds of deposit are treated separately:nonsolvable material, mainly hydrocarbons (non-soluble deposits deposited); solvable, mainly salt(equivalent salt deposits deposited); and kaolin clay.The exposure is expressed in amounts deposited perunit area.
Information about the samples used in our re-search is summarized in Table 1 and in Section 3 withthe emittance values obtained from the specularreflectance measurements at room temperature aswell as the spectral emittance at 100 'C.
3. Results and Discussion
In this section we first present the primary results ofthe measurements described in Section 2 and thenshift to the evaluated data and their implications.
A. Reflectance Spectra of As-Received Material
In Fig. 2 are the bulk, specular, IR reflectance spectrafor the three different kinds of polycrystallinesamples'9 that we have studied. One notices primar-ily that for all cases the reststrahlen band is welldefined and has a low minimum on the high-energyside of the band, which is characteristic of materialswith the screening parameter e, > 1 [see Eq. (2)].The peak has a very sharp edge at the low-energy side,sharper than the corresponding structure for single-
Fig. 2. Bulk specular reflectance spectra in the reststrahlenregion for the BeO polycrystalline samples investigated in thisresearch,'9 prepared as indicated. Details are in the text.
crystalline materials (see Fig. 3). It is, however,close to earlier results for a polycrystalline material."The tape-cast material has a significantly strongerband than the polished and pressed material, whichmay be a direct consequence of the preparationtechnique. Polishing reduces surface roughness andthus the topographic scatter. However, it can simul-taneously cause tension and distortion in the surfacelayer, which could either change the dynamic proper-ties of the lattice and thus weaken the reststrahlenband or increase the amount of nontopographic scat-ter. To verify that the differences seen in Fig. 2 aretruly inherent material differences, the total reflec-tance should be measured.
To elaborate further on the differences betweensingle-crystalline and polycrystalline BeO, we show inFig. 3 the reflectance spectra for the single-crystallineBeO as obtained by Loh.'0 The crystalline structureof BeO is hexagonal; therefore two independent spec-tra, with the electric-field E c and Elc axis, areshown. Compared with Fig. 2 one notices the lesssharp low-energy edge of the reststrahlen band asnoted above. An even more conspicuous differenceis the extra dip, superimposed on the band at - 1000cm-', which is observed for the polycrystalline samples
zQ
0.8
0.6
0.4
0.2
0 1600
WAVENUMBER(cm- 1)
Fig. 3. Bulk specular reflectance spectra in the reststrahlenregion for single-crystalline BeO, as quoted from Ref. 10.Note that the dip in the three versions of the reststrahlen bands inFig. 2 cannot be obtained as n linear combination of these twospectra.
but in neither of the two spectra for the single crystal.This difference is unexpected; in general structuresare averaged out when one goes from a single-crystalline to a polycrystalline sample. The extrastructure is seen also in the band reported in Ref. 11,and it is mentioned in Ref. 23 as a characteristic of the"ceramic" BeO and assigned to a sideband at 1070cm-'. Thus the difference has been reported bythree independent sources and presumably does notoriginate from impurities or other artifacts. Thephysical origin remains to be explained. To eluci-date this question further, we carried out a computer-fitting procedure using a five-oscillator model tosimulate the experimental spectrum. In essence thetechnique is identical to that used in the classicalstudy of SiC (Ref. 24) and later also for BeO,10
although modern computer routines2 5 facilitate anextensive search with multioscillator models. Insummary the method is based on the oscillator equa-tion for a complex dielectric constant:
E(@) = E3 + E 2 .j=1 )j -2 + j
(2)
where es is the screening parameter corresponding tothe square of the (approximately constant) refractiveindex in the visible range, oj is a TO phonon fre-quency for wave vector q = 0, corresponding to an IRactive resonance, fj is the oscillator strength, and yj isa damping factor expressed as a frequency. Eachoscillator resonance is thus characterized by threeparameters, and s is common for the whole set.From Eq. (2) it is straightforward to calculate thebulk normal reflectance, and by varying the 16 param-eters, one can fit the calculated reflectance spectrumto the experimental curve. Our values for the param-eters appear as a result of the best fit based on anupper-limit sum of the square-deviation criterion.The search can be facilitated by the Thomas-Reiche-Kuhn (TRK) sum rule for the oscillator strengths.2 6
In most cases one oscillator dominates in each fre-quency interval, but in this case we are looking for aweak band on the high-energy side of a strongoscillator, which makes the determination somewhatuncertain. The result of the fitting is shown in Fig.4. The overall agreement is satisfactory, but it isnotable that the fitted curve has less sharp structuresthan the experimental curve. The same relationshipbetween the experimental and fitted spectrum can beobserved for the single-crystalline material in Ref. 10.This discrepancy is unexpected in that Eq. (2) doesnot include any effects from broadening by the finiteresolution of the spectrometer. A possibility is thatthe experimental reflectance values should in fact besomewhat bigger, e.g., because of scattering losses,which would cause smaller damping factors in the fit,which in turn would make the structure sharper.The raw experimental spectrum for Fig. 4 does in facthave a small spike, possibly damped by instrumentresolution, at the low-energy edge of the reststrahlen
WAVE NUMBER (cm"l)Fig. 4. Comparison of reflectance spectra from the five-oscillatorfit (points) as described in the text, with the experimental tape-castcurve (continuous curve) obtained. Note the sharpness of theexperimental reststrahlen band low-energy edge, which is notsimulated by the model but is characteristic of the experimentalspectra from tape-cast and pressed samples.
band, which indicates that the maximum should beeven higher.
In Table 2 the w,, values resulting from the fit arelisted with those from earlier investigations of BeO.The dip in the reststrahlen band appears as a weakoscillator at 995 cm-', which is absent in the corre-sponding analysis of the BeO single crystal'0 butappears at 955 cm-' in the five-oscillator fit for thepolycrystalline material." The numbers in parenthe-ses among the data from the present study are thedimensionless oscillator strengths, i.e., fj divided bythe respective resonance wave number squared, whichemerge as a result of the numerical fit. They illus-trate the complete dominance of the main transversemode at 707 cm-', which is in good agreement withthe results of others, shown in Table 2. In view oftheir weakness, the minor discrepancies obtained forthe other four oscillators are of little importance.
. - I
From the fit shown in Fig. 4 we have a value for thescreening parameter Us = 2.93, and we can then usethe fj values in the TRK sum rule mentioned above26
to obtain a value for the static dielectric constant:
(0) = E + E j(j2. (3)
If the present parameter values in Table 2 are usedconsistently, we obtain (0) = 7.13 from Eq. (3).This value for the static dielectric constant is 5%higher than that given in Ref. 11, which is 6.76. Inview of the fact that Eq. (3) involves adding bothexperimental errors and fitting uncertainties, thisdiscrepancy must be considered acceptable.
The physical problem is in identifying a mechanismconnected with the polycrystallinity of BeO thatcauses oscillator absorption at near-normal incidence.Berreman8 demonstrated theoretically and experimen-tally that longitudinal lattice oscillations also causethe absorption of light under oblique incidence againstthin films. The current samples are bulk and thestructure of BeO is hexagonal, not cubic as in Ref. 8.Nevertheless one could speculate that the presence ofgrain boundaries might permit the excitation of longi-tudinal optical photons, which would appear as aweak absorption mechanism. We leave this ques-tion open and emphasize that total reflectance mea-surements should be made on the polycrystallinesamples and compared with single-crystalline spectrato separate scattering from absorption losses.
B. Data for the Exposed Samples
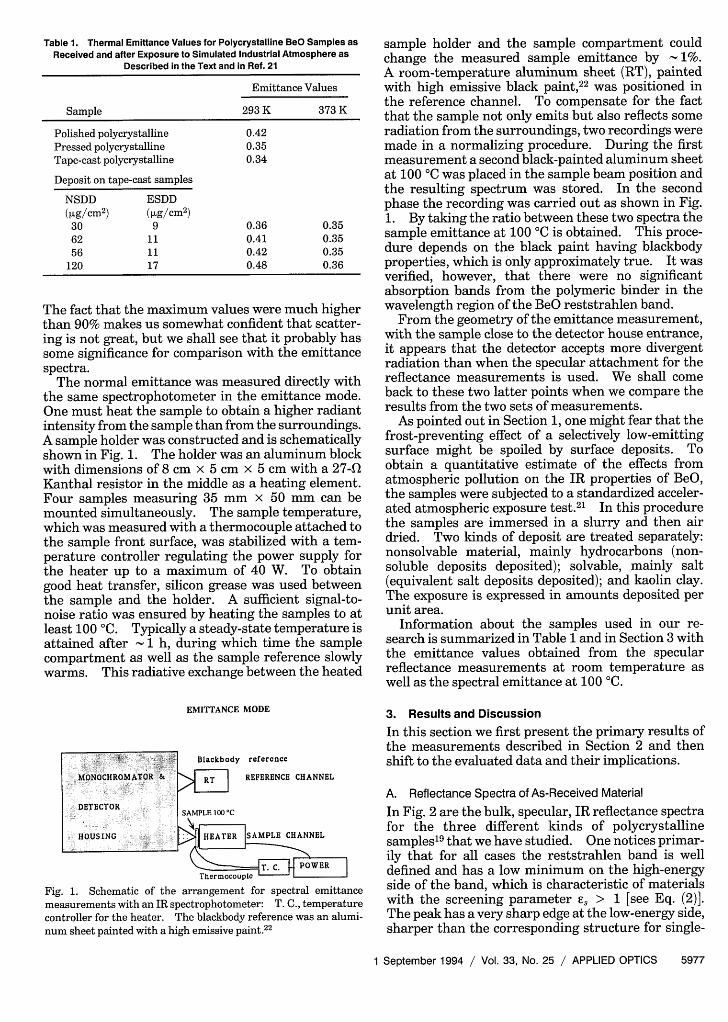
In Fig. 5 the room-temperature specular reflectancespectra for one clean reference and four contami-nated tape-cast samples are reported. As expected,the strength of the reststrahlen band is reduced whenthe amount of surface deposit is increased. Again
Table 2. BeO Oscillator Frequencies as Obtained by Various Authors and Techniquesa
Reference Sample Method Phonon Frequencies (cm-')
27 Single crystals, 1-0.6 mm IR transmittance, 730 1080Pressed plates, 0.3-1 mm oblique incidence
El Ic EIc10 Single crystals Fit to bulk 680 724
IR reflectance 1083 1098Raman spectra 684 725
1085 1095
28 rf Sputtered IR transmittance100-nm film Normal incidence 720
Oblique incidence 720 1070
11 Polycrystalline, bulk Oscillator fit to bulk 710, 790, 865, 900, 955, 1050reflectance
23 Single crystalline Quoted from Ref. 10. 680 724
29 Oriented thin film From reflectance spectrum 739 (L = 950)
Current research Polycrystalline, bulk Oscillator fit to bulk 707, 793, 954, 995, 1089reflectance (4.09, 0.006, 0.091, = 0, 0.006)
aNormalized oscillator strengths, fjl/j 2 , from the current research in parentheses.
Fig. 5. Near-normal specular reflectance spectra for one cleanreference and four samples after accelerated aging correspondingto exposure in an industrial atmosphere.21 The amounts ofnonsolvable and salt deposits are as indicated.
we must caution that at least some of the differencesbetween the spectra are likely to be caused by scatter-ing rather than absorption. This argument isstrengthened by the observation that the reduction inthe reflectance is almost wavelength independent.If absorption was the major cause of the reductions,one would expect relatively sharp dips or at least amore pronounced wavelength dependence. The over-all thermal emittance values exhibit a modest in-crease with the amount of deposited material quanti-fied in Table 1. The spectral results in Fig. 5 show indetail how the deposits affect the specular part of thereststrahlen band. The strongest pollution reducesthe magnitude of the band to about half of theoriginal size, again with reservation for scatteringeffects.
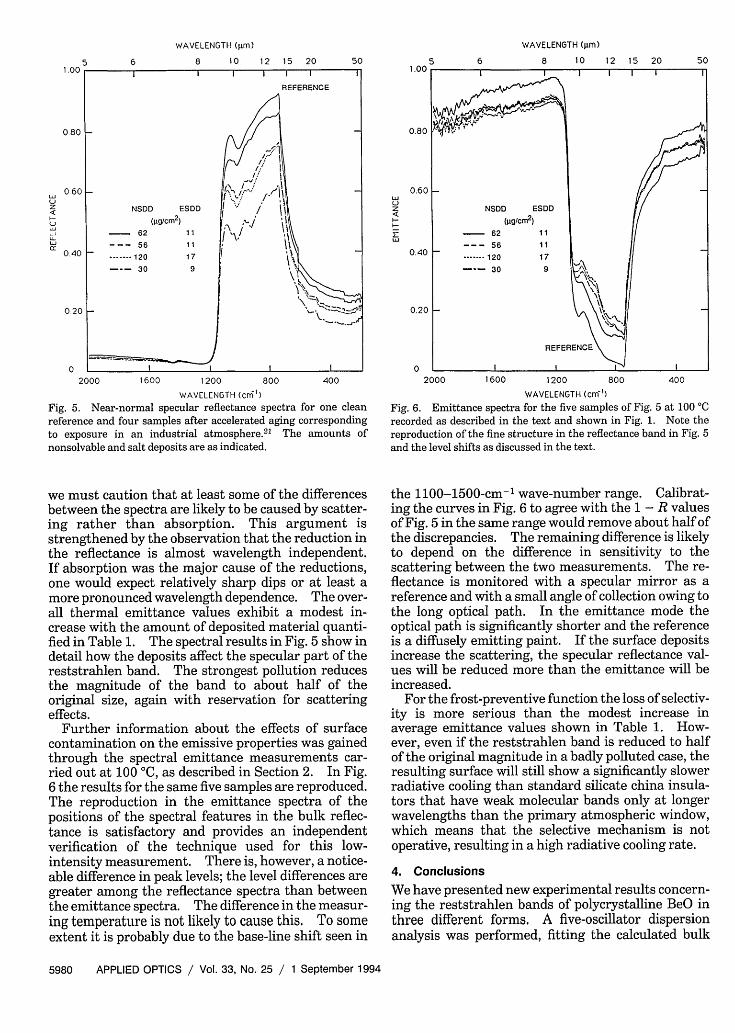
Further information about the effects of surfacecontamination on the emissive properties was gainedthrough the spectral emittance measurements car-ried out at 100 'C, as described in Section 2. In Fig.6 the results for the same five samples are reproduced.The reproduction in the emittance spectra of thepositions of the spectral features in the bulk reflec-tance is satisfactory and provides an independentverification of the technique used for this low-intensity measurement. There is, however, a notice-able difference in peak levels; the level differences aregreater among the reflectance spectra than betweenthe emittance spectra. The difference in the measur-ing temperature is not likely to cause this. To someextent it is probably due to the base-line shift seen in
1.00
0.80
U
z
I-
0.60
0.40
0.20
0
5 6
WAVELENGTH (im)
8 10 12 15 20 50
2000 1600 1200 800 400WAVELENGTH (cm')
Fig. 6. Emittance spectra for the five samples of Fig. 5 at 100 Crecorded as described in the text and shown in Fig. 1. Note thereproduction of the fine structure in the reflectance band in Fig. 5and the level shifts as discussed in the text.
the 1100-1500-cm-' wave-number range. Calibrat-ing the curves in Fig. 6 to agree with the 1 - R valuesof Fig. 5 in the same range would remove about half ofthe discrepancies. The remaining difference is likelyto depend on the difference in sensitivity to thescattering between the two measurements. The re-flectance is monitored with a specular mirror as areference and with a small angle of collection owing tothe long optical path. In the emittance mode theoptical path is significantly shorter and the referenceis a diffusely emitting paint. If the surface depositsincrease the scattering, the specular reflectance val-ues will be reduced more than the emittance will beincreased.
For the frost-preventive function the loss of selectiv-ity is more serious than the modest increase inaverage emittance values shown in Table 1. How-ever, even if the reststrahlen band is reduced to halfof the original magnitude in a badly polluted case, theresulting surface will still show a significantly slowerradiative cooling than standard silicate china insula-tors that have weak molecular bands only at longerwavelengths than the primary atmospheric window,which means that the selective mechanism is notoperative, resulting in a high radiative cooling rate.
4. Conclusions
We have presented new experimental results concern-ing the reststrahlen bands of polycrystalline BeO inthree different forms. A five-oscillator dispersionanalysis was performed, fitting the calculated bulk
reflectance to the experimental spectrum. The re-sults were compared with earlier studies of single-crystalline and thin-film BeO samples. A dip posi-tioned at 1000 cm-' was noticed in the currentsamples in contrast to the single-crystalline material.We speculate that the dip represents an absorptionmechanism connected with a surface oscillation onthe crystalline grains, 20 aLm in size.
The reststrahlen band in BeO represents a newoptical selectivity that may provide a means foravoiding radiative cooling. In Subsection 3.B wegave results from accelerated exposure tests to moni-tor how much of the selective low emittance is lost bythe atmospheric deposition of salt and nondissolvablehydrocarbons on the surface of BeO. Near-normalbulk reflectance and spectral emittance data for theBeO samples with increasing amounts of surfacedeposits are reported. The average thermal emit-tance is increased by only a few percent, but thestrength of the reststrahlen band is reduced to justabove half of its magnitude in the most heavilypolluted case. The depth of the corresponding bandof low emittance is significantly less affected. Wesuggest that part of the reduction seen in the specularreflectance is due to scattering rather than absorp-tion.
We thank Dan Vikstr6m of the Swedish Transmis-sion Research Institute AB for making the acceler-ated atmospheric deposition preparation of thesamples. Gran Grimvall of The Royal Institute ofTechnology, Stockholm, and Michael Thomas of theInstitute of Applied Physics, The John Hopkins Uni-versity, provided helpful comments in our consider-ations of possible sources for the extra structure inthe reststrahlen band.
T. Chibuye is a visiting scientist from the Univer-sity of Zambia, Lusaka Campus, under the auspices ofthe International Science Program of Uppsala Univer-sity.
References and Notes1. D. E. Campbell and H. E. Hagy, "Ceramic materials," in CRC
Practical Handbook of Materials Science, C. T. Lynch, ed.(CRC, Boca Raton, Fla., 1989), Table 6.2-2.
2. W. D. Kingery, H. K. Bowen, and D. R. Uhlmann, Introductionto Ceramics (Wiley, New York, 1976), Sec. 12.7.
3. Ref. 1, Table 6.2-4.4. J. Plendl, "Some new interrelations in the properties of solids
based on anharmonic cohesive forces," Phys. Rev. 123, 1172-1180 (1961).
5. J. Plendl and P. Gielisse, "Hardness of nonmetallic solids onan atomic basis," Phys. Rev. 125, 828-832 (1962).
6. J. Plendl and P. Gielisse, "Infrared spectra of inorganicdielectric solids," Appl. Opt. 3, 943-949 (1964).
7. J. Plendl and P. Gielisse, "Characteristic frequencies frominfrared and elastic data," Appl. Opt. 4, 853-856 (1965).
8. D. W. Berreman, "Infrared absorption at longitudinal optical
frequency in cubic crystal films," Phys. Rev. 130, 2193-2198(1963).
9. C. G. Ribbing and E. Wdckelgard, "Reststrahlen bands asproperty indicators for materials in dielectric coatings," ThinSolid Films 206, 312-317 (1991).
10. E. Loh, "Optical phonons in BeO crystals," Phys. Rev. 166,673-678 (1968).
11. M. E. Thomas and R. J. Joseph, "Optical phonon characteris-tics of diamond, beryllia, and cubic zirconia," in Window andDome Technologies and Materials II, P. Klocek, ed., Proc. Soc.Photo-Opt. Instrum. Eng. 1326, 120-126 (1990).
12. C. G. Ribbing, "Beryllium oxide: a frost preventing insula-tor," Opt. Lett. 15,882-884 (1990); Swedish patent 8901422-9(April 1989).
13. G. Laffay, G. Fadevilhe, F. Schambourgh, and K. Keita,"Improvements in vehicle windows," U.K. patent 1,598,924(August 1977).
14. B. L. Adamson, "Fordonsruta av glas," Swedish Patent7,609,860-7 (September 1976).
15. I. Hamberg, J. S. E. M. Svensson, T. S. Eriksson, C. G.Granqvist, P. Arrenius, and F. Norin, "Radiative cooling andfrost formation on surfaces with different thermal emittance:theoretical analysis and practical experience," Appl. Opt. 26,2131-2136 (1987).
16. S. H6rnfeldt, Swedish Transmission Research Institute AB,Ludvika, now with ABB Corporate Research, Vasteras, Swe-den (personal communication, 1987).
17. C. F. Bohren, "An essay on dew," Weatherwise 41, 226-231(1988).
18. C. G. Ribbing, "Reststrahlen material bilayers: an option fortailoring in the infrared," Appl. Opt. 32, 5531-5534 (1993).
19. Our samples were regular products from the National BerylliaDivision of General Ceramics Inc., Haskell, N.J., preparedfrom Brush & Wellman powder raw material.
20. For example, J. F. Snell, "Radiometry and photometry," inHandbook of Optics, W. G. Driscoll and W. Vaughan, eds.(McGraw-Hill, New York, 1978), Sec. 1.
21. Standard Procedure IEC 507, 2nd ed. (International ElectricCommittee, Geneva, Switzerland).
22. Tiefschwarz 9005, obtained from Mankiewicz Gebr through3M Swedish AB, Bollstanis Vdgens 3, 19189 Sollenthna,Sweden.
23. D. F. Edwards and R. H. White, "Beryllium oxide (BeO)," inHandbook of Optical Constants II, E. D. Palik, ed. (Academic,San Diego, Calif., 1991), pp. 805-814.
24. W. G. Spitzer, D. Kleinman, and D. Walsh, "Infrared proper-ties of hexagonal silicon carbide," Phys. Rev. 113, 127-132(1959).
25. IGOR, WaveMetrics, Lake Oswego, Ore. 97035.26. For example, F. Wooten, Optical Properties of Solids (Aca-
demic, New York, 1972), Sec. 3.6.27. J. R. Durig, R. C. Lord, W. J. Gardner, and L. H. Johnston,
"Infrared transmittance and reflectance of beryllium oxide,"J. Opt. Soc. Am. 52, 1078 (1962).
28. D. Schalch, A. Scharmann, and A. Weiss, "Characterization ofreactively sputtered BeO films," Thin Solid Films 124, 351-358 (1985).
29. T. Takagi, K. Matsubara, and H. Takaoka, "Optical andthermal properties of BeO thin films prepared by reactiveionized-cluster beam technique," J. Appl. Phys. 51, 5419-5424 (1980).