Edelweiss Research is also available on www.edelresearch.com, Bloomberg EDEL <GO>, Thomson First Call, Reuters and Factset. Edelweiss Securities Limited NTPC’s Q4FY17 reported PAT of INR20bn came below our INR29bn estimate due to: a) INR3.8bn jump in wage bill on account of 7th Pay Commission; and b) INR8.7bn impairment on Ratnagiri gas plant. Going forward, till the time the increase in wage bill is cleared by the regulator, NTPC will continue to make quarterly provision of INR1.1bn. The company’s regulated book at INR441bn rose 6% (past 5 years’ average at ~9%) in FY17 as commercialisation of 1.4GW was weak. However, post result commentary suggested that NTPC is going full fledged for commissioning of new capacities (4.7GW targeted), which is likely to drive up regulated book and help sustain the current exit multiples for the company. Retain ‘BUY’. Quarter marked by healthy PLFs Q4FY17 was marked by good operational performance. NTPC registered healthy PLFs in all the 3 fuel categories i.e., coal PLF of 81% (flattish YoY), gas PLF of 24% (up 18% YoY) and hydro PLF of 13.5% (up 13% YoY). Power off take at 60BUs in Q4FY17 (58BUs in Q4FY16) was up 3% YoY. NTPC earned efficiency incentive of INR3bn in FY17 (INR2.7bn in FY16). The company commissioned total ~1.4GW of capacity in FY17, below our ~2.0GW estimate due to certain clearance issues. Strong capacity addition envisaged Management has guided for robust ~5.4GW capacity addition (1.5x FY17) and capex of INR280bn in FY18. Also, commercialisation in FY18 is expected at ~4.7GW i.e., 3x FY17 (we have factored in 4.5GW). The 5.4GW capacity addition will add INR84bn to the regulated equity, implying RoE of 21.1% for FY18. Outlook and valuations: Upbeat prospects; maintain ‘BUY’ We believe step-up in commissioning activity will drive earnings growth over FY18-19 (18%), even as clarity on impact of potential heat loss after the coal unloading stage is a key monitorable. At CMP, the stock trades at 1.3x and 1.2x FY18E and FY19E P/BV, respectively. We maintain ‘BUY/SP’ with SOTP-based TP of INR191. RESULT UPDATE NTPC One-offs mar Q4; commissioning key EDELWEISS 4D RATINGS Absolute Rating BUY Rating Relative to Sector Performer Risk Rating Relative to Sector Low Sector Relative to Market Underweight MARKET DATA (R: NTPC.BO, B: NTPC IN) CMP : INR 156 Target Price : INR 191 52-week range (INR) : 178 / 138 Share in issue (mn) : 8,245.5 M cap (INR bn/USD mn) : 1,290 / 20,004 Avg. Daily Vol.BSE/NSE(‘000) : 4,756.6 SHARE HOLDING PATTERN (%) Current Q2FY17 Q1FY17 Promoters * 69.7 69.7 69.7 MF's, FI's & BK’s 17.0 17.4 16.9 FII's 10.4 10.7 11.1 Others 2.8 2.1 2.2 * Promoters pledged shares (% of share in issue) : NIL PRICE PERFORMANCE (%) Stock Nifty EW Power Index 1 month (4.9) 3.2 (5.0) 3 months (4.0) 8.2 0.8 12 months 11.7 17.8 17.9 Swarnim Maheshwari +91 22 4040 7418 [email protected]Viren Dargar +91 22 6620 3195 [email protected]India Equity Research| Power May 29, 2017 Financials (Standalone) (INR mn) Year to March Q4FY17 Q4FY16 % Change Q3FY17 % Change FY17 FY18E FY19E Revenues 204,167 183,252 11.4 193,959 5.3 782,734 834,484 951,509 EBITDA 54,628 54,467 0.3 52,519 4.0 212,843 254,583 293,010 Adj. net profit 28,624 27,927 2.5 24,693 15.9 93,853 114,065 130,256 Adj. Dil. EPS (INR) 3.5 3.4 2.5 3.0 15.9 11.4 13.8 15.8 P/B (x) 1.3 1.3 1.2 ROAE (%) 10.1 11.6 12.6
Transcript
Edelweiss Research is also available on www.edelresearch.com, Bloomberg EDEL <GO>, Thomson First Call, Reuters and Factset.
Edelweiss Securities Limited
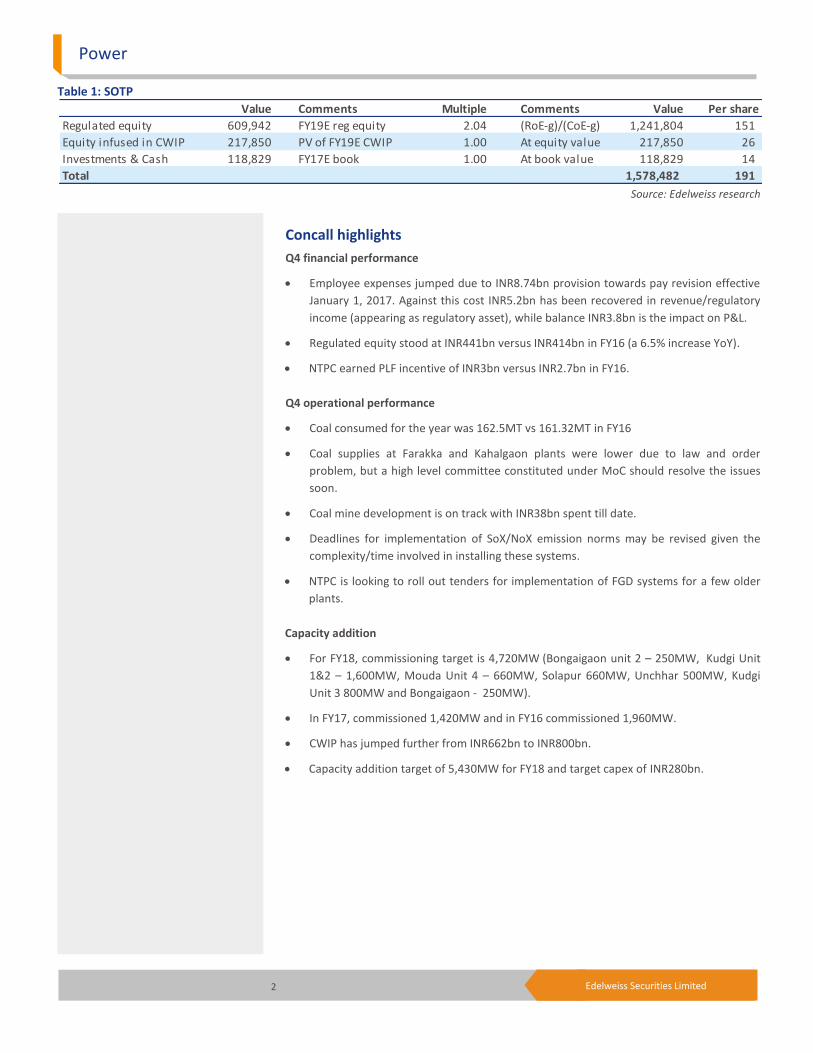
NTPC’s Q4FY17 reported PAT of INR20bn came below our INR29bn estimate due to: a) INR3.8bn jump in wage bill on account of 7th Pay Commission; and b) INR8.7bn impairment on Ratnagiri gas plant. Going forward, till the time the increase in wage bill is cleared by the regulator, NTPC will continue to make quarterly provision of INR1.1bn. The company’s regulated book at INR441bn rose 6% (past 5 years’ average at ~9%) in FY17 as commercialisation of 1.4GW was weak. However, post result commentary suggested that NTPC is going full fledged for commissioning of new capacities (4.7GW targeted), which is likely to drive up regulated book and help sustain the current exit multiples for the company. Retain ‘BUY’.
Quarter marked by healthy PLFs
Q4FY17 was marked by good operational performance. NTPC registered healthy PLFs in
all the 3 fuel categories i.e., coal PLF of 81% (flattish YoY), gas PLF of 24% (up 18% YoY)
and hydro PLF of 13.5% (up 13% YoY). Power off take at 60BUs in Q4FY17 (58BUs in
Q4FY16) was up 3% YoY. NTPC earned efficiency incentive of INR3bn in FY17 (INR2.7bn
in FY16). The company commissioned total ~1.4GW of capacity in FY17, below our
~2.0GW estimate due to certain clearance issues.
Strong capacity addition envisaged
Management has guided for robust ~5.4GW capacity addition (1.5x FY17) and capex of
INR280bn in FY18. Also, commercialisation in FY18 is expected at ~4.7GW i.e., 3x FY17
(we have factored in 4.5GW). The 5.4GW capacity addition will add INR84bn to the
regulated equity, implying RoE of 21.1% for FY18.
Outlook and valuations: Upbeat prospects; maintain ‘BUY’
We believe step-up in commissioning activity will drive earnings growth over FY18-19
(18%), even as clarity on impact of potential heat loss after the coal unloading stage is
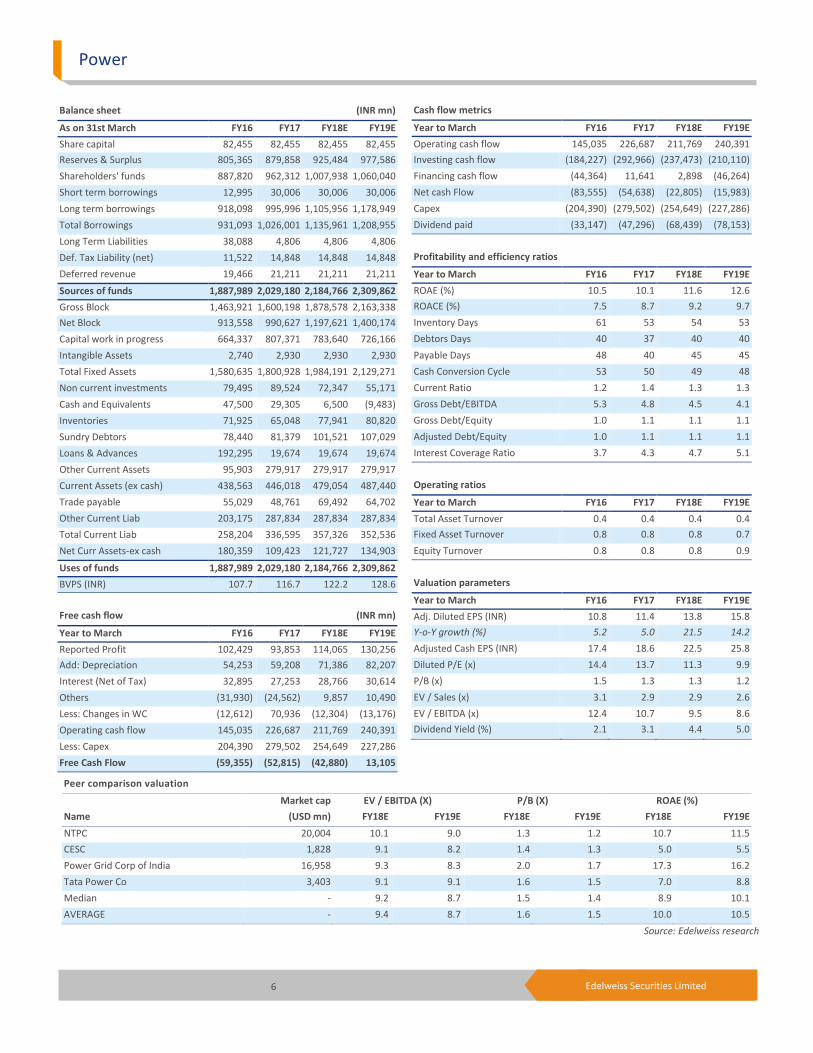
a key monitorable. At CMP, the stock trades at 1.3x and 1.2x FY18E and FY19E P/BV,
respectively. We maintain ‘BUY/SP’ with SOTP-based TP of INR191.
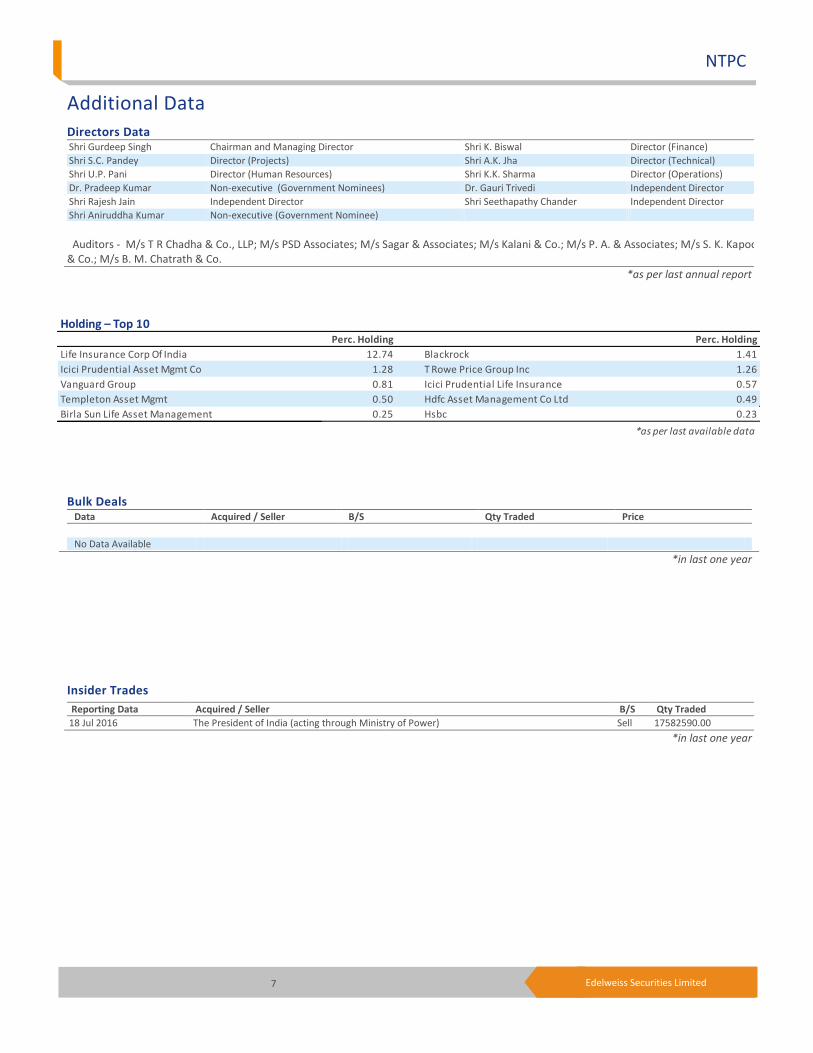
Auditors - M/s T R Chadha & Co., LLP; M/s PSD Associates; M/s Sagar & Associates; M/s Kalani & Co.; M/s P. A. & Associates; M/s S. K. Kapoor & Co.; M/s B. M. Chatrath & Co.
*as per last annual report
8 Edelweiss Securities Limited
Company Absolute
reco
Relative
reco
Relative
risk
Company Absolute
reco
Relative
reco
Relative
Risk
Adani Power HOLD SU H CESC BUY None None
JSW Energy HOLD SP M NTPC BUY SP L
Power Grid Corp of India BUY SO L PTC India BUY None None
Tata Power Co BUY SP M
RATING & INTERPRETATION
ABSOLUTE RATING
Ratings Expected absolute returns over 12 months
Buy More than 15%
Hold Between 15% and - 5%
Reduce Less than -5%
RELATIVE RETURNS RATING
Ratings Criteria
Sector Outperformer (SO) Stock return > 1.25 x Sector return
Sector Performer (SP) Stock return > 0.75 x Sector return
Stock return < 1.25 x Sector return
Sector Underperformer (SU) Stock return < 0.75 x Sector return
Sector return is market cap weighted average return for the coverage universe
within the sector
RELATIVE RISK RATING
Ratings Criteria
Low (L) Bottom 1/3rd percentile in the sector
Medium (M) Middle 1/3rd percentile in the sector
High (H) Top 1/3rd percentile in the sector
Risk ratings are based on Edelweiss risk model
SECTOR RATING
Ratings Criteria
Overweight (OW) Sector return > 1.25 x Nifty return
Equalweight (EW) Sector return > 0.75 x Nifty return
Sector return < 1.25 x Nifty return
Underweight (UW) Sector return < 0.75 x Nifty return
Coverage group(s) of stocks by primary analyst(s): Power
Adani Power, CESC, JSW Energy, NTPC, PTC India, Power Grid Corp of India, Tata Power Co
Distribution of Ratings / Market Cap
Edelweiss Research Coverage Universe
Rating Distribution* 161 67 11 240 * 1stocks under review
Market Cap (INR) 156 62 11
Date Company Title Price (INR) Recos
Recent Research
29-May-17 Adani Power Compensatory tariff reversal singes profitability; Result Update
27 Hold
23-May-17 Tata Power Company
Tripped by one off; Result Update
80 Buy
22-May-17 CESC Demerger prudent; prospects brighten; Result Update
884 Buy
> 50bn Between 10bn and 50 bn < 10bn
Buy Hold Reduce Total
Rating Interpretation
Buy appreciate more than 15% over a 12-month period
Hold appreciate up to 15% over a 12-month period
Reduce depreciate more than 5% over a 12-month period
Rating Expected to
-
149
297
446
594
743
Jan
-14
Feb
-14
Mar
-14
Ap
r-1
4
May
-14
Jun
-14
Jul-
14
Au
g-1
4
Sep
-14
Oct
-14
No
v-1
4
De
c-1
4
(IN
R)
One year price chart
130
140
150
160
170
180
May
-16
Jun
-16
Jul-
16
Jul-
16
Au
g-1
6
Sep
-16
Oct
-16
Oct
-16
No
v-1
6
De
c-1
6
De
c-1
6
Jan
-17
Feb
-17
Feb
-17
Mar
-17
Ap
r-1
7
Ap
r-1
7
May
-17
(IN
R)
NTPC
10 Edelweiss Securities Limited
Power
DISCLAIMER
Edelweiss Securities Limited (“ESL” or “Research Entity”) is regulated by the Securities and Exchange Board of India (“SEBI”) and is licensed to carry on the business of broking, depository services and related activities. The business of ESL and its Associates (list available on www.edelweissfin.com) are organized around five broad business groups – Credit including Housing and SME Finance, Commodities, Financial Markets, Asset Management and Life Insurance.
This Report has been prepared by Edelweiss Securities Limited in the capacity of a Research Analyst having SEBI Registration No.INH200000121 and distributed as per SEBI (Research Analysts) Regulations 2014. This report does not constitute an offer or solicitation for the purchase or sale of any financial instrument or as an official confirmation of any transaction. Securities as defined in clause (h) of section 2 of the Securities Contracts (Regulation) Act, 1956 includes Financial Instruments and Currency Derivatives. The information contained herein is from publicly available data or other sources believed to be reliable. This report is provided for assistance only and is not intended to be and must not alone be taken as the basis for an investment decision. The user assumes the entire risk of any use made of this information. Each recipient of this report should make such investigation as it deems necessary to arrive at an independent evaluation of an investment in Securities referred to in this document (including the merits and risks involved), and should consult his own advisors to determine the merits and risks of such investment. The investment discussed or views expressed may not be suitable for all investors.
This information is strictly confidential and is being furnished to you solely for your information. This information should not be reproduced or redistributed or passed on directly or indirectly in any form to any other person or published, copied, in whole or in part, for any purpose. This report is not directed or intended for distribution to, or use by, any person or entity who is a citizen or resident of or located in any locality, state, country or other jurisdiction, where such distribution, publication, availability or use would be contrary to law, regulation or which would subject ESL and associates / group companies to any registration or licensing requirements within such jurisdiction. The distribution of this report in certain jurisdictions may be restricted by law, and persons in whose possession this report comes, should observe, any such restrictions. The information given in this report is as of the date of this report and there can be no assurance that future results or events will be consistent with this information. This information is subject to change without any prior notice. ESL reserves the right to make modifications and alterations to this statement as may be required from time to time. ESL or any of its associates / group companies shall not be in any way responsible for any loss or damage that may arise to any person from any inadvertent error in the information contained in this report. ESL is committed to providing independent and transparent recommendation to its clients. Neither ESL nor any of its associates, group companies, directors, employees, agents or representatives shall be liable for any damages whether direct, indirect, special or consequential including loss of revenue or lost profits that may arise from or in connection with the use of the information. Our proprietary trading and investment businesses may make investment decisions that are inconsistent with the recommendations expressed herein. Past performance is not necessarily a guide to future performance .The disclosures of interest statements incorporated in this report are provided solely to enhance the transparency and should not be treated as endorsement of the views expressed in the report. The information provided in these reports remains, unless otherwise stated, the copyright of ESL. All layout, design, original artwork, concepts and other Intellectual Properties, remains the property and copyright of ESL and may not be used in any form or for any purpose whatsoever by any party without the express written permission of the copyright holders.
ESL shall not be liable for any delay or any other interruption which may occur in presenting the data due to any reason including network (Internet) reasons or snags in the system, break down of the system or any other equipment, server breakdown, maintenance shutdown, breakdown of communication services or inability of the ESL to present the data. In no event shall ESL be liable for any damages, including without limitation direct or indirect, special, incidental, or consequential damages, losses or expenses arising in connection with the data presented by the ESL through this report.
We offer our research services to clients as well as our prospects. Though this report is disseminated to all the customers simultaneously, not all customers may receive this report at the same time. We will not treat recipients as customers by virtue of their receiving this report.
ESL and its associates, officer, directors, and employees, research analyst (including relatives) worldwide may: (a) from time to time, have long or short positions in, and buy or sell the Securities, mentioned herein or (b) be engaged in any other transaction involving such Securities and earn brokerage or other compensation or act as a market maker in the financial instruments of the subject company/company(ies) discussed herein or act as advisor or lender/borrower to such company(ies) or have other potential/material conflict of interest with respect to any recommendation and related information and opinions at the time of publication of research report or at the time of public appearance. ESL may have proprietary long/short position in the above mentioned scrip(s) and therefore should be considered as interested. The views provided herein are general in nature and do not consider risk appetite or investment objective of any particular investor; readers are requested to take independent professional advice before investing. This should not be construed as invitation or solicitation to do business with ESL.
11 Edelweiss Securities Limited
NTPC
ESL or its associates may have received compensation from the subject company in the past 12 months. ESL or its associates may have managed or co-managed public offering of securities for the subject company in the past 12 months. ESL or its associates may have received compensation for investment banking or merchant banking or brokerage services from the subject company in the past 12 months. ESL or its associates may have received any compensation for products or services other than investment banking or merchant banking or brokerage services from the subject company in the past 12 months. ESL or its associates have not received any compensation or other benefits from the Subject Company or third party in connection with the research report. Research analyst or his/her relative or ESL’s associates may have financial interest in the subject company. ESL and/or its Group Companies, their Directors, affiliates and/or employees may have interests/ positions, financial or otherwise in the Securities/Currencies and other investment products mentioned in this report. ESL, its associates, research analyst and his/her relative may have other potential/material conflict of interest with respect to any recommendation and related information and opinions at the time of publication of research report or at the time of public appearance.
Participants in foreign exchange transactions may incur risks arising from several factors, including the following: ( i) exchange rates can be volatile and are subject to large fluctuations; ( ii) the value of currencies may be affected by numerous market factors, including world and national economic, political and regulatory events, events in equity and debt markets and changes in interest rates; and (iii) currencies may be subject to devaluation or government imposed exchange controls which could affect the value of the currency. Investors in securities such as ADRs and Currency Derivatives, whose values are affected by the currency of an underlying security, effectively assume currency risk.
Research analyst has served as an officer, director or employee of subject Company: No
ESL has financial interest in the subject companies: No
ESL’s Associates may have actual / beneficial ownership of 1% or more securities of the subject company at the end of the month immediately preceding the date of publication of research report.
Research analyst or his/her relative has actual/beneficial ownership of 1% or more securities of the subject company at the end of the month immediately preceding the date of publication of research report: No
ESL has actual/beneficial ownership of 1% or more securities of the subject company at the end of the month immediately preceding the date of publication of research report: No
Subject company may have been client during twelve months preceding the date of distribution of the research report.
There were no instances of non-compliance by ESL on any matter related to the capital markets, resulting in significant and material disciplinary action during the last three years except that ESL had submitted an offer of settlement with Securities and Exchange commission, USA (SEC) and the same has been accepted by SEC without admitting or denying the findings in relation to their charges of non registration as a broker dealer.
A graph of daily closing prices of the securities is also available at www.nseindia.com
Analyst Certification:
The analyst for this report certifies that all of the views expressed in this report accurately reflect his or her personal views about the subject company or companies and its or their securities, and no part of his or her compensation was, is or will be, directly or indirectly related to specific recommendations or views expressed in this report.
Additional Disclaimers
Disclaimer for U.S. Persons
This research report is a product of Edelweiss Securities Limited, which is the employer of the research analyst(s) who has prepared the research report. The research analyst(s) preparing the research report is/are resident outside the United States (U.S.) and are not associated persons of any U.S. regulated broker-dealer and therefore the analyst(s) is/are not subject to supervision by a U.S. broker-dealer, and is/are not required to satisfy the regulatory licensing requirements of FINRA or required to otherwise comply with U.S. rules or regulations regarding, among other things, communications with a subject company, public appearances and trading securities held by a research analyst account.
This report is intended for distribution by Edelweiss Securities Limited only to "Major Institutional Investors" as defined by Rule 15a-6(b)(4) of the U.S. Securities and Exchange Act, 1934 (the Exchange Act) and interpretations thereof by U.S. Securities and Exchange Commission (SEC) in reliance on Rule 15a 6(a)(2). If the recipient of this report is not a Major Institutional Investor as specified above, then it should not act upon this report and return the same to the sender. Further, this report may not be copied, duplicated and/or transmitted onward to any U.S. person, which is not the Major Institutional Investor.
12 Edelweiss Securities Limited
Power
Access the entire repository of Edelweiss Research on www.edelresearch.com
In reliance on the exemption from registration provided by Rule 15a-6 of the Exchange Act and interpretations thereof by the SEC in order to conduct certain business with Major Institutional Investors, Edelweiss Securities Limited has entered into an agreement with a U.S. registered broker-dealer, Edelweiss Financial Services Inc. ("EFSI"). Transactions in securities discussed in this research report should be effected through Edelweiss Financial Services Inc. Disclaimer for U.K. Persons
The contents of this research report have not been approved by an authorised person within the meaning of the Financial Services and Markets Act 2000 ("FSMA"). In the United Kingdom, this research report is being distributed only to and is directed only at (a) persons who have professional experience in matters relating to investments falling within Article 19(5) of the FSMA (Financial Promotion) Order 2005 (the “Order”); (b) persons falling within Article 49(2)(a) to (d) of the Order (including high net worth companies and unincorporated associations); and (c) any other persons to whom it may otherwise lawfully be communicated (all such persons together being referred to as “relevant persons”). This research report must not be acted on or relied on by persons who are not relevant persons. Any investment or investment activity to which this research report relates is available only to relevant persons and will be engaged in only with relevant persons. Any person who is not a relevant person should not act or rely on this research report or any of its contents. This research report must not be distributed, published, reproduced or disclosed (in whole or in part) by recipients to any other person. Disclaimer for Canadian Persons
This research report is a product of Edelweiss Securities Limited ("ESL"), which is the employer of the research analysts who have prepared the research report. The research analysts preparing the research report are resident outside the Canada and are not associated persons of any Canadian registered adviser and/or dealer and, therefore, the analysts are not subject to supervision by a Canadian registered adviser and/or dealer, and are not required to satisfy the regulatory licensing requirements of the Ontario Securities Commission, other Canadian provincial securities regulators, the Investment Industry Regulatory Organization of Canada and are not required to otherwise comply with Canadian rules or regulations regarding, among other things, the research analysts' business or relationship with a subject company or trading of securities by a research analyst. This report is intended for distribution by ESL only to "Permitted Clients" (as defined in National Instrument 31-103 ("NI 31-103")) who are resident in the Province of Ontario, Canada (an "Ontario Permitted Client"). If the recipient of this report is not an Ontario Permitted Client, as specified above, then the recipient should not act upon this report and should return the report to the sender. Further, this report may not be copied, duplicated and/or transmitted onward to any Canadian person. ESL is relying on an exemption from the adviser and/or dealer registration requirements under NI 31-103 available to certain international advisers and/or dealers. Please be advised that (i) ESL is not registered in the Province of Ontario to trade in securities nor is it registered in the Province of Ontario to provide advice with respect to securities; (ii) ESL's head office or principal place of business is located in India; (iii) all or substantially all of ESL's assets may be situated outside of Canada; (iv) there may be difficulty enforcing legal rights against ESL because of the above; and (v) the name and address of the ESL's agent for service of process in the Province of Ontario is: Bamac Services Inc., 181 Bay Street, Suite 2100, Toronto, Ontario M5J 2T3 Canada. Disclaimer for Singapore Persons
In Singapore, this report is being distributed by Edelweiss Investment Advisors Private Limited ("EIAPL") (Co. Reg. No. 201016306H) which is a holder of a capital markets services license and an exempt financial adviser in Singapore and (ii) solely to persons who qualify as "institutional investors" or "accredited investors" as defined in section 4A(1) of the Securities and Futures Act, Chapter 289 of Singapore ("the SFA"). Pursuant to regulations 33, 34, 35 and 36 of the Financial Advisers Regulations ("FAR"), sections 25, 27 and 36 of the Financial Advisers Act, Chapter 110 of Singapore shall not apply to EIAPL when providing any financial advisory services to an accredited investor (as defined in regulation 36 of the FAR. Persons in Singapore should contact EIAPL in respect of any matter arising from, or in connection with this publication/communication. This report is not suitable for private investors.
Copyright 2009 Edelweiss Research (Edelweiss Securities Ltd). All rights reserved