40
I 1 I Press Conference March 11th, 2015 Results 2014 Antoine Kohler (Chairman), Patric Schoch (CFO) Press Conference 11.03.2015

I 1 I
Press Conference March 11th, 2015 Results 2014
Antoine Kohler (Chairman), Patric Schoch (CFO)
Press Conference 11.03.2015
I 2 I
Disclaimer
The information in this presentation does not constitute an offer or invitation and may not be construed as a recommendation by us to purchase, hold or sell shares of Cicor Technologies Ltd. This information or any copy thereof may not be sent or taken to or distributed in any jurisdiction in which such transmission or distribution is unlawful. This document may contain certain ‘forward-looking’ statements. By their nature, forward-looking statements involve risk and uncertainty because they relate to future events and circumstances. Actual outcomes and results may differ materially from any outcomes or results expressed or implied by such forward-looking statements.
Press Conference 11.03.2015

I 3 I
Agenda Press conference
Profile Achievements 2014 “Innovation for Success” Financials 2014 Outlook Q & A
Press Conference 11.03.2015

I 4 I
Profile Antoine Kohler
Press Conference 11.03.2015

I 5 I
The Cicor Group Profile
Global acting Swiss group of leading PCB (Printed Circuit Boards) Microelectronics, Substrates and Electronic Solutions (Electronic Manufacturing Services) companies
Organized into two Divisions (Advanced Microelectronics & Substrates and Electronic Solutions)
From engineering and prototyping to high volume production 11 production sites in Europe and Asia with over 1800 employees Sales organization in Europe, America, Asia Listed on the SIX Swiss Exchange: CICN
183.0
178.7
176.0
190.5
202.5
2011
2012
2010
2013
2014
Net Sales in CHF million
0.1
-2.4
6.1
4.5
6.2
2010
2011
2012
2013
2014
Net Profit in CHF million (bef. minorities)
Press Conference 11.03.2015

I 6 I
Extract only Customer references
11.03.2015 Cicor respects customer confidentiality
Press Conference

I 7 I
Cicor Group Structure Profile
Cicor Technologies Group
Electronic Solutions (ES)
Advanced Microelectronics & Substrates (AMS)
Boudry Switzerland
Sites
Moudon Switzerland
Wangs Switzerland
Ulm Germany
Radeberg Germany
Bronschhofen Switzerland
Arad Romania
Quartino Switzerland
Singapore Singapore
Anam Vietnam
Batam Indonesia
Suzhou China
Sales Region Europe
Sales Region Americas
Press Conference 11.03.2015
Sales Region Asia

I 8 I
Board of Directors / Group Management Profile
Press Conference 11.03.2015
Board of Directors Antoine Kohler Chairman Heinrich Essing Vice Chairman Robert Demuth Andreas Dill Hans Knöpfel Group Management
Patric Schoch acting CEO / CFO Pascal Keller Executive Vice President AMS Division Erich Trinkler Executive Vice President ES Division

I 9 I
31.6
38.2
26.0
20.0 01.01.2014 01.01.2013
40.0
35.0
30.0
01.01.2015
25.0
01.04.2015
Cic
or s
hare
pric
e (d
aily
clo
sing
)
+3%
(SPI +13%)
Share price closed at 35.55 per 31.12.2014 Cicor share price development
Press Conference 11.03.2015
+19%
(SPI +25%)
Registered shares per 31.12.2014 2 892 092
Treasury shares per 31.12.2014 1 500
Ø number of outstanding shares per 31.12.2014 2 888 571
Options exercised in 2014 11 584
Outstanding options per 31.12.2014 35 793
Market capitalisation per 31.12.2014 in TCHF 102 761 Free Flow
60.78% ARGOS Fund 5.01%
HEB Swiss 29.33%
Escatec 4.88%
Shareholding as reported per 31.12.2014

I 10 I
Cicor's global footprint
Global and local presence
Production / sales sites Sales representations
Press Conference 11.03.2015
I 11 I
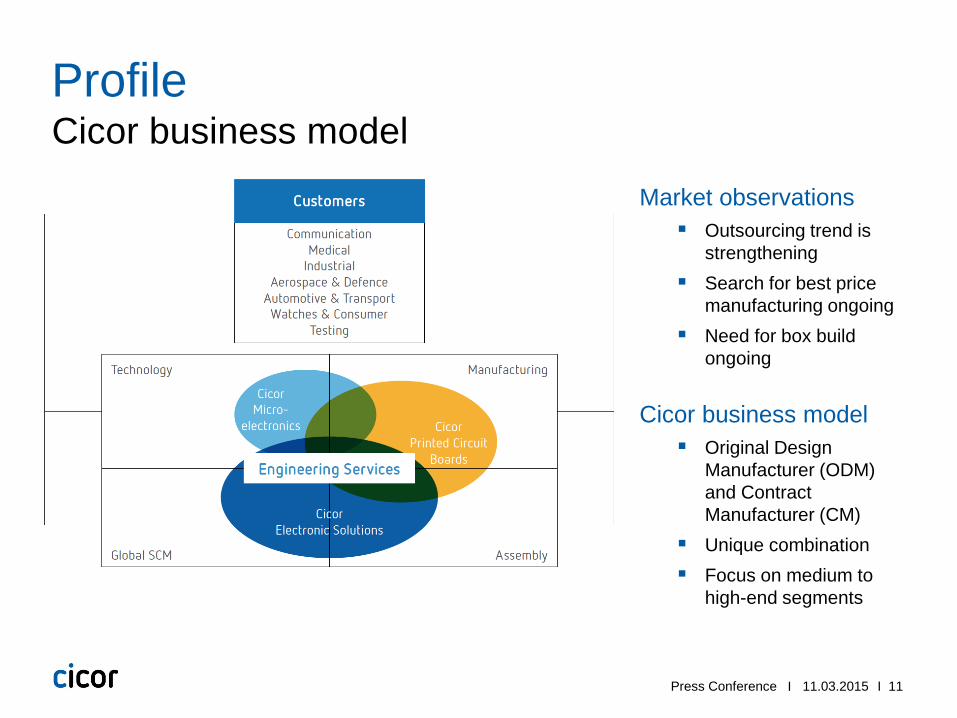
Cicor business model Profile
Market observations Outsourcing trend is
strengthening Search for best price
manufacturing ongoing Need for box build
ongoing
Cicor business model Original Design
Manufacturer (ODM) and Contract Manufacturer (CM)
Unique combination Focus on medium to
high-end segments
Press Conference 11.03.2015

I 12 I
Diversified customer portfolio Markets
Medical
Watches & Consumer
Industrial
Aerospace & Defence
Communication
Automotive & Transport
Press Conference 11.03.2015

I 13 I
Achievements 2014 Patric Schoch
Press Conference 11.03.2015

I 14 I
Highlights Achievements 2014 (1/2)
Further profitable growth in 2014 Net sales grew above the overall estimated market
growth. Continued growth in core segments medical,
industrial and automotive & transport. Higher profitability and good net profit achieved. Excellent free cash flow generated.
Expansion of technological leadership continued Significant investments into renewal and
modernization of production facilities in all regions, but below the high spending rate of 2013 and 2012.
New financing of CHF 65 million secured New financing agreement assures the Group’s long-
term financial flexibility and future growth.
Press Conference 11.03.2015

I 15 I
Highlights Achievements 2014 (2/2)
Strong balance sheet position The equity ratio as at December 31st, 2014 was
54.1% (2013: 55.6%). Net debt was reduced significantly to CHF 21.2
million. Proposed 20% increased pay-out of CHF 0.36 per
share from capital contribution reserves.
Strong management team in place Dr. Jürg Dübendorfer will join per 1 June 2015 as
the new Group CEO, completing the group management team.
Patric Schoch will resume full-time financial leadership of the Group as CFO.
Press Conference 11.03.2015

I 16 I
Return to growth in second-half of the year Advanced Microelectronis & Substrates (AMS)
Press Conference 11.03.2015
Varying market segment performance in 2014 lead to an overall reduction in sales.
The medical and industrial segments performed better, aerospace, defence and nuclear energy segments as well as watches & consumer remained low.
Rising demand in HY2 enabled the Division to outperform the first six months sales by 4.4% in the second half.
Despite the lower sales for the whole 2014, the EBIT remained stable and EBITDA improved vs 2013.
Growth in industrial applications is expected to intensify in 2015, opportunities exist in industrial automation applications and the Internet of things (IoT) or machine-to-machine communication.
The implemented strengthening of the sales organization in the second half of 2014 is expected to bear fruit starting 2015.

I 17 I
On course for growth Electronic Solutions (ES)
The combination of the Asia division and the ES division was well received by customers around the world and strengthened the successful collaboration between the Cicor sites in Europe and Asia.
Overall higher sales and operating results for 2014 vs 2013 were achieved.
Market share gains in medical, industrial and automotive segments.
Also strong demand for hardware and software development services.
Further strengthening of the engineering and test engineering services implemented.
Rapidly reacting to customers’ growing demand was a challenge in 2014 and will continue.
ES is able to quickly increase or decrease work force based on current and forecasted demand.
Press Conference 11.03.2015

I 18 I
Innovation for success Patric Schoch
Press Conference 11.03.2015

I 19 I
Advanced Microelectronics & Substrates Innovation for success
Thin-film-based microfluidic chip with microelectrodes for portable cell analysis
Press Conference 11.03.2015

I 20 I
Advanced Microelectronics & Substrates Innovation for success
Thermal initiator in high volumes with a controlled resistance
Exhaust gas sensor based on a thick film ceramic
Press Conference 11.03.2015

I 21 I
Innovation Insights Innovation for success
Successful first Cicor symposium
Around 70 participants from different industries
Very good press coverage and follow-up
Press Conference 11.03.2015

I 22 I
Financials 2014 Patric Schoch
Press Conference 11.03.2015

I 23 I
Earning power grows disproportionately to sales Financial Summary 2014
Further profitable sales growth achieved Net sales in Swiss francs rose to CHF 202 mio, a growth of 6.3% vs 2013 Simpler and more efficient organization was successfully implemented EBIT margin of 4.7% for 2014 (2013: 4.5%), EBITDA margin of 9.8% (2013:
9.2%)
Increase of EBT and net profit EBT grew by 37% to CHF 8.0 mio (2013: CHF 5.8 mio) Net profit grew in 2014 by 36% to CHF 6.2 mio (2013: CHF 4.5 mio) Earnings per share of CHF 2.11; proposed 20% increased pay-out of CHF
0.36 per share (2012 and 2013: CHF 0.30 per share)
Net working capital (NWC), free cash flow and net debt NWC kept at 2013 level, despite increase in business volume Excellent free cash flow of CHF 8.0 mio Net debt reduced from CHF 28.2 mio in 2013 to CHF 21.2 mio in 2014
Press Conference 11.03.2015

I 24 I
Aerospace & defence
9%
27%
9% Communication
Industrial
11%
Medical
28%
12%
Automotive & transport
Watches & consumer 4%
Other
15%
9%
28%
25%
10%
8% 5% Switzerland
39%
17%
36%
Europe (w/o Switzerland)
Asia
1% North America
7%
Others
0% 5%
19%
37%
39%
Sales by industries and by destination Sales profile
Press Conference 11.03.2015
2014 2013
2014 2013

I 25 I
+36.8%
2014
8.0
2013
5.8
Financial achievements 2014
Orders received Net sales EBIT EBITDA Net profit
-3.4%
2014
194.7
2013
201.7
+6.3%
2014
202.5
2013
190.5
+12.6%
2014
9.6
2013
8.5
+12.6%
2014
19.8
2013
17.6
6.2
2014
+36.5%
2013
4.5
9.8% 9.2%
4.5% (ROS)
4.7%
3.1% 2.4%
(before minorities) EBT
3.9% 3.1%
(all figures in CHF mio at actual FX rates)
Orders received lower by -2.5% in local currencies Net sales grew by +7.4% in local currencies
Press Conference 11.03.2015

I 26 I
Divisional Results 2014 Result improvements in both divisions
ES 2013 2014 %YoY
Sales 131 405 145 662 +10.8%
EBITDA 12 018 13 676 +13.8%
ROS% 9.1% 9.4% +0.3%pt
PPE* Capex 5 888 4 083 -30.7%
Total assets 115 178 124 967 +8.5%
Goodwill** 37 261 37 324 +0.2%
AMS 2013 2014 %YoY
Sales 59 095 56 934 -3.7%
EBITDA 7 740 8 031 +3.8%
ROS% 13.1% 14.1% +1.0%pt
PPE Capex 9 405 6 535 -30.5%
Total assets 105 992 104 576 -1.3%
Goodwill 30 658 30 666 +0.0%
(all figures in TCHF at actual FX rates)
Press Conference 11.03.2015
* PPE = Property, Plant and Equipment
** Goodwill positions are allocated to the cash generating units (CGU)

I 27 I
Net Profit development 2014 vs. 2013
+1.2
+1.0 +1.1+6.2
+4.5
0
2
4
6
8
in C
HF
milli
on
-1.1
+1.7 (+36.5%)
2014 Tax expenses
-0.5
Financial result
Depr. & Amort.
Overhead and others
Margin improvement
2013
3.1% ROS:
2.4%
Press Conference 11.03.2015

I 28 I
Ø Pers. Cost per
Ø FTE 2014
(Ø FTE 1 910)
-6.1%
in T
CH
F
30.7
Ø Pers. Cost per
Ø FTE 2013
(Ø FTE 1 730)
32.7
Ø personnel cost per Ø FTE are still decreasing Reduction in production workforce
179162
-3.1%
1 673
M&S, Admin.
FTE 2013
FTE 2014
Production
1 852 1 912
1 750
Reduction in work force in combination with increase in M&S and Admin Total pers. cost increase
by 3.6% to CHF 58.7 mio (2012: CHF 56.6 mio)
(end of period)
11.03.2015 Press Conference
(end of period)
2 000
1 400
1 600
1 800
1 686
Dec. 2012
1 512 FTE
(end
-of-p
erio
d)
1 953
Dec. 2014
1 852
Dec. 2013
1 912
-5%
Jun. 2013
Jun. 2014
-3%
Ø Pers. Cost
per FTE 2013
29.6
Ø Pers. Cost
per FTE 2014
+7.0%
31.7
in T
CH
F

I 29 I
Efficiency increase in overhead
13.5%
2011
25.6
14.3%
2010
26.5
14.5%
2009
26.6
2008
11.7% 16.6%
27.3
13.1%
2014
23.7 23.8 24.1
-3.6 mio (-13.3%)
Ove
rhea
d in
MC
HF
2013
12.7%
2012
208 mio sales
Rigid cost control and cost awareness Similar sales volume as in
2008 supported by much leaner overhead structure 2014 overhead ratio below
12% of sales, despite 17 additional FTE vs. 2013 (of sales)
160 mio 183 mio 179 mio 176 mio 190 mio width = sales
(all figures at actual FX rates)
203 mio
11.03.2015 Press Conference

I 30 I
Capex / Depreciation ratio back to target corridor Capex and depreciation for PPE*
2014
8 788
2013
7 849
2012
6 820
2011
6 592
2010
7 059
2009
8 452
PPE Capex in TCHF PPE Depreciation in TCHF Capex / Depreciation ratio
* PPE = Property, Plant and Equipment
2014
10 618
2013
15 293
2012
13 168
2011
8 033
2010
5 908
2009
4 268
Average 2009 – 2014 = 1.3
1.91.9
0.8
0.50.4
0.6
0.8
1.0
1.2
1.4
1.6
1.8
2.0
2009 2013
1.2
2012 2011
1.2
2010 2014
Mid-term Target Corridor
11.03.2015 Press Conference

I 31 I
in TCHF Actual 2013 in % Actual
2014 in % %YoY
Net sales 190 453 100.0% 202 458 100.0% +6.3% Material expenses -93 307 -49.0% -101 905 -50.3% +9.2%
Operating expenses -79 542 -41.7% -80 726 -39.9% +1.5%
Depreciation and amortization -9 092 -4.8% -10 243 -5.1% +12.7%
EBIT 8 512 4.5% 9 584 4.7% +12.6%
Financial result -2 696 -1.4% -1 626 -0.8% -39.7%
EBT 5 816 3.1% 7 958 3.9% +36.8%
Income taxes -1 272 -0.7% -1 756 -0.9% +38.1%
Net profit / (loss) 4 544 2.4% 6 202 3.1% +36.5%
Consolidated income statement
11.03.2015 Press Conference

I 32 I
in TCHF Actual 2013
in % Actual 2014
in %
Current assets 90 522 40.0% 95 015 40.9%
Non-current assets 135 777 60.0% 137 293 59.1%
Total Assets 226 299 100.0% 232 308 100.0%
Current liabilities 41 730 18.4% 45 590 19.6%
Non-current liabilities 58 716 25.9% 61 116 26.3%
Equity 125 853 55.6% 125 602 54.1%
Total liabilities and equity 226 299 100.0% 232 308 100.0%
Net Debt 28 221 21 233 Gearing ratio (net debt in % of equity) 22.4% 16.9%
Net debt / EBITDA 1.6 1.1
Equity Ratio 55.6% 54.1%
Consolidated Balance Sheet
11.03.2015 Press Conference

I 33 I
in TCHF Actual 2013
Actual 2014
Profit / (Loss) before tax 5 816 7 958 Non cash items 9 172 10 168
Changes in working capital** -9 375 946
Interest, tax paid / received, disposal of assets -134 -564
Cash flow from operations 5 479 18 508 Property, plant and equipm. (net) -15 164 -10 350
Intangible assets -998 -154
Cash flow from investments -16 162 -10 504
Free Cash Flow -10 683 8 004
Net cash from / (used) in fin.act. 8 928 -5 725
Cash flow -1 755 2 279
Cash Flow Statement
** Working capital including other current assets and other current liabilities Press Conference 11.03.2015

I 34 I
Outlook Patric Schoch
Press Conference 11.03.2015

I 35 I
Continued transparent reporting is guaranteed Switch to Swiss GAAP FER in 2015
The change to Swiss GAAP FER marks a decision by Cicor for a more pragmatic standard of comparative informational value in accordance with the principle of a true and fair view.
In application of the new reporting standard, Cicor will offset all goodwill against equity. It is expected that the equity ratio per 31 December 2014 would be around 45%.
The change would have an expected positive impact on the net profit of 2014 of around CHF 1.1 million.
The interim report for the first half of 2015 will contain reconciled financial statements.
The change in reporting standard also means that Cicor Technologies Ltd. will be transferred from Main Standard to Domestic Standard of SIX Swiss Exchange.
Press Conference 11.03.2015

I 36 I
Costs in CHF reduced to 34% of sales (2011: 53%) CHF dependency reduced since 2011
51% 90 mio
CHF
24% 42 mio
EUR
25% 44 mio
USD
Others
1% 3 mio
Net Sales 2011 (CHF 179 mio)
25% 51 mio
CHF
36% 73 mio
EUR
26% 52 mio
USD
Others
13% 27 mio
Net Sales 2014 (CHF 203 mio)
53% 94 mio CHF
21% 37 mio
EUR
24% 42 mio
USD
Others
3% 5 mio
Cost structure 2011 (CHF 178 mio)
35% 68 mio
CHF
28% 54 mio
EUR
23% 45 mio
USD
Others
13% 26 mio
Cost structure 2014 (CHF 193 mio)
Press Conference 11.03.2015

I 37 I
Cicor is well prepared to face the challenges Outlook
The target for 2015 is to confirm the recent positive performance and to realize new opportunities that may arise
− The reported revenues in Swiss francs will be influenced by the recent exchange rate turbulences.
− The strong CHF could also negatively impact the competitiveness of some of Cicor’s customer groups, but...
+ …it will also push (Swiss) companies to look for outsourcing options outside Switzerland, particularly in East Europe and / or Asia.
+ Cicor has already been able to significantly reduce its dependence on the Swiss franc, but further decisive steps to mitigate the consequences of the appreciation of the Swiss franc are being evaluated by the Group Management.
+ Cicor will do everything in its power to confirm the positive performance of the last two years in spite of the strong currency-related headwinds.
Press Conference 11.03.2015

I 38 I
Questions / Answers
Press Conference 11.03.2015

I 39 I
Agenda 2015 and contacts Investor Relations
IR Agenda 2015 23 April 2015 Annual General Meeting 19 August 2015 Half-year results 2015 March 2016 Annual report 2015 Investor Relations Contacts Cicor Management AG Antoine Kohler, Chairman, and Patric Schoch, CFO WTC, Leutschenbachstrasse 95 8050 Zurich, Switzerland Phone: +41 43 811 44 05
Press Conference 11.03.2015

I 40 I
Thank you!
Press Conference 11.03.2015


