Page 1
71
CHAPTER 4
RESULTS
4.1. Isolation of fluorescent pseudomonad bacteria
Based on the heterotrophic plate count, the total population of culturable aerobic bacteria
and fluorescent bacteria associated with rice rhizosphere was 2.3×10⁵ and 5.6×10² CFU/g
soil, respectively. A total of 443 fluorescent pseudomonad strains were isolated from the
rhizosphere soil.
4.2. Screening of antagonistic fluorescent pseudomonad bacteria
Out of 443 strains screened, strains FP10, PUP6 and PUW5 showed a broad-spectrum
antifungal activity towards phytopathogenic fungi used in the study and induced growth-
free inhibition zones (diameter) ranged from 6.3 to 32 mm towards phytopathogenic fungi
(Table 4).
Strains FP10, PUP6 and PUW5 also exhibited broad-spectrum activities against
bacterial pathogens of plant and human (Table 5). Strains induced growth-free inhibition
zones (diameter) ranged from 7.5 to 23 mm towards bacterial pathogens (Table 5).
Page 2
72
Table 4. Broad-spectrum antagonistic activity against phytopathogenic fungi by strains FP10, PUP6 and PUW5
Test fungus
Disease
Host
Strains and inhibition zone diameter (mm ± SE)*
FP10 PUP6 PUW5
Sarocladium oryzae (SONS) Sheath rot Rice 14.6 ± 0.50d 26.0 ± 0.32b 19.3 ± 0.92a Rhizoctonia solani (RSR1) Sheath blight Rice 19.3 ± 0.17bc 19.0 ± 0.47d 14.0 ± 0.47bc Magnaporthe grisea (MGS) Blast Rice 20.6 ± 0.50b 32.0 ± 0.42a 19.3 ± 1.24a Fusarium oxysporum f.sp. cubense (FOC) Root wilt Banana 17.2 ± 0.56c 21.0 ± 0.19c 14.3 ± 1.20b Cylindrocladium floridanum (ATCC42971) Root necrosis Banana 16.3 ± 0.31c 20.0 ± 0.22cd 14.0 ± 0.67bc Cy. scoparium (ATCC 46300) Root necrosis Banana 22.4 ± 0.45ab 21.0 ± 0.61c 20.0 ± 0.33a Cy. spathiphylli (ATCC 44730) Root necrosis Banana 18.7 ± 0.38b 22.0 ± 0.28c 9.70 ± 0.47d Cy. spathiphylli (Gua5) Root necrosis Banana 25.4 ± 0.27a 32.0 ± 0.24a 9.70 ± 0.47d F. oxysporum f.sp. vasinfectum (FOV) Wilt Cotton 13.0 ± 0.57de 15.0 ± 0.36ef 13.0 ± 0.81c Colletotrichum falcatum (CFL) Red rot Sugarcane 9.70 ± 0.51f 16.0 ± 0.83e 12.6 ± 0.94c Macrophomina phaseolina (MPS) Charcoal rot Groundnut 12.6 ± 0.50e 14.0 ± 0.57f 11.3 ± 0.47cd Botrytis cinerea (BCTNAU) Blight Tobacco 10.3 ± 0.51ef 12.0 ± 0.63g 6.30 ± 0.47e C. capsici (CCL) Fruit rot Chili 12.3 ± 0.51ef 10.0 ± 0.59g 9.60 ± 0.47de Pestalotia theae (PTS) Leaf spot Tea 13.0 ± 0.57de 15.0 ± 0.17ef 17.0 ± 0.87ab C. gleosporoides (CGL) Anthracnose Mango 10.0 ± 0.57f 16.0 ± 0.34e 12.6 ± 1.69c
Means within the column followed by different letters are significantly different according to Duncan’s multiple range test p<0.05.
* Data represents the average of three replications. SE, standard error.
Page 3
73
Table 5. Broad-spectrum antagonistic activity against plant and human pathogenic bacteria by strains FP10, PUP6 and PUW5
Test bacterium
Disease
Host
Strains and inhibition zone diameter (mm ± SE)*
FP10
PUP6
PUW5
Pseudomonas syringae pv. pisi 519 Bacterial blight Pea 8.20 ± 0.30a 0.0 7.50 ± 0.30a
P. syringae pv. glycenia NCPPB1783 Bacterial blight Glycene max 0.0 9.10 ± 0.40a 0.0
P. syringae pv. tomato NCPPB269 Bacterial speck Tomato 0.0 0.0 9.30 ± 0.20b
Staphylococcus aureus Scaled skin-syndrome Human 19.66 ± 1.15c 16.33 ± 0.47bc 23.00 ± 0.81d
Micrococcus luteus Skin infection Human 18.33 ± 0.33b 15.33 ± 0.47b 11.33 ± 0.47b
Bacillus sp. Skin infection Human 18.66 ± 0.47b 17.00 ± 0.81c 18.66 ± 0.47c
Candida albicans Candidiasis Human 21.66 ± 0.47d 18.33 ± 0.47c 19.33 ± 0.47c
Means within the column followed by different letters are significantly different according to Duncan’s multiple range test p<0.05.
* Data represents the average of three replications. SE, standard error.
Page 4
74
4.3. Taxonomic characterization of antagonistic bacteria
4.3.1. Morphological, physiological and biochemical characterization
Morphologically strains FP10, PUP6 and PUW5 were smooth, circular and non-
mucoid, Gram-negative, motile and rod-shaped bacteria. All bacteria showed positive
reactions for fluorescence on King’s medium B (KB) agar. Strain FP10 tested positive
for cytochrome oxidase, arginine dihydrolase, gelatin hydrolysis, citrate utilization but
negative for levan formation and nitrate reduction. Strain FP10 utilized carbon
sources such as xylose, dextrose, galactose, arabinose, mannose, ribose, esculin,
malonate, sorbitol, mannitol and adonitol. This bacterium showed growth at 42oC but
did not grow at 4 oC (Table 6). Strain FP10 showed the optimum growth at 28oC.
Strain PUP6 tested positive for cytochrome oxidase, arginine dihydrolase,
gelatin hydrolysis and citrate utilization. This bacterium utilized L-arabinose, sorbitol
and mannitol as carbon sources but did not utilize other carbon sources used in this
study. Strain PUP6 showed growth at 42oC but did not grow at 4oC (Table 6). Strain
showed the optimum growth at 28oC. Strain PUW5 tested positive for the production
of arginine dihydrolase, cytochrome oxidase, nitrate reductase and citrate utilization
but negative for levan sucrase production and gelatin hydrolysis. Strain PUW5
showed optimum growth at 28oC but did not grow either at 4oC or 42oC. This
bacterium utilized lactose, xylose, fructose, dextrose, galactose, melibiose, L-
arabinose, mannose, ribose, α-methyl-D-mannoside, xylitol, esculin, D-arabinose and
mannitol as carbon sources sucrose but did not utilize glycerol, malonate, sorbose,
trehalose, sorbitol, adonitol and glucosamine (Table 6).
Page 5
75
Table 6. Biochemical characterization of potent fluorescent pseudomonad strains
Trait
Strain
FP10
PUP6
PUW5
Fluorescence on KB + + + Oxidase + + + Arginine dihydrolase + + + Gelatin hydrolysis + + − Levan sucrase production − − − Citrate utilization + + + Nitrate reductase − − − Growth at 4°C − − − Growth at 42°C + + − Assimilation of - Lactose − − + Xylose + − + Fructose − − + Dextrose + − + Galactose + − + Melibiose − − + L-arabinose + + + Mannose + − + Glycerol − − − Ribose + − + α-Methyl-D-mannoside − − + Xylitol − − + Esculin + − + D-arabinose − − + Malonate + − − Sorbose − − − Trehalose − − − Sorbitol + + − Mannitol + + + Adonitol + − − Glucosamine − − −
+, positive reaction; −, negative reaction
Page 6
76
4.3.2. Molecular characterization
4.3.2.1. Isolation, qualitative and quantitative analyses of genomic
DNA
Unsheared total genomic DNA was isolated from strain FP10, PUP6 and PUW5.
Genomic DNA showed the absorption ratio of 1.8 at 260 and 280 nm. The
concentration of the purified DNA was adjusted to 50 ng/ml in TE buffer.
4.3.2.2. Amplification and sequencing of 16S rRNA gene
Primers fD1 and rP2 amplified the 16S rRNA gene when the total genomic DNA of
FP10, PUP6 and PUW5 was used as templates in PCR. Agarose gel electrophoresis
and subsequent ethidium bromide staining of PCR products showed the 1500 bp
amplicons of 16S rRNA. The sequences (Chromas files, Applied Biosystems) were
manually checked for consistency of the results and used for molecular phylogenetic
analyses.
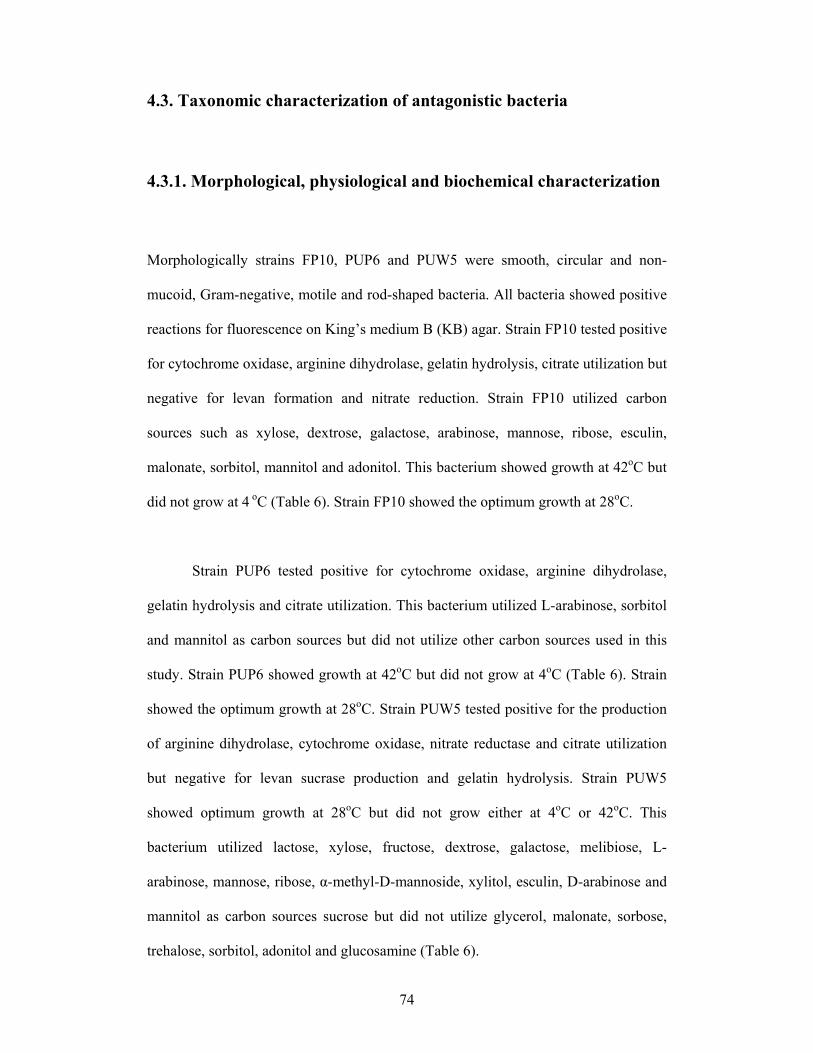
4.3.2.3. Molecular phylogenetic analyses
The 16S rRNA nucleotide sequence of strain FP10 showed 99% similarity towards P.
aeruginosa. Strain PUP6 showed 97% similarity towards P. aeruginosa and strain
PUW5 showed 98% similarity towards P. putida. On the basis of molecular
phylogenetic analysis of the 16S rRNA along with type strains, the taxonomic
affiliation of strains FP10 and PUP6 was confirmed as P. aeruginosa and strain
PUW5 as P. putida (Fig. 2A-C).
Page 7
77
Figure 2A. Phylogenetic tree of strain FP10 based on the nucleotide sequence of
16S rRNA. The tree was constructed by neighbor-joining (NJ) method.
Page 8
78
Figure 2B. Phylogenetic tree of strain PUP6 based on the nucleotide sequence of
16S rRNA. The tree was constructed by neighbor-joining (NJ) method.
Page 9
79
Figure 2C. Phylogenetic tree of strain PUW5 based on the nucleotide sequence of
16S rRNA. The tree was constructed by neighbor-joining (NJ) method.
Page 10
80
4.4. Determination of plant growth-promoting enzymes and
hormones
4.4.1. Production of siderophore
Strains FP10, PUP6 and PUW5 showed change in color of the medium from blue to
orange-red on CAS agar. The positive results of FeCl3 and hydroxamate tests
indicated the production of hydroxamate-type siderophore by strains FP10, PUP6 and
PUW5.
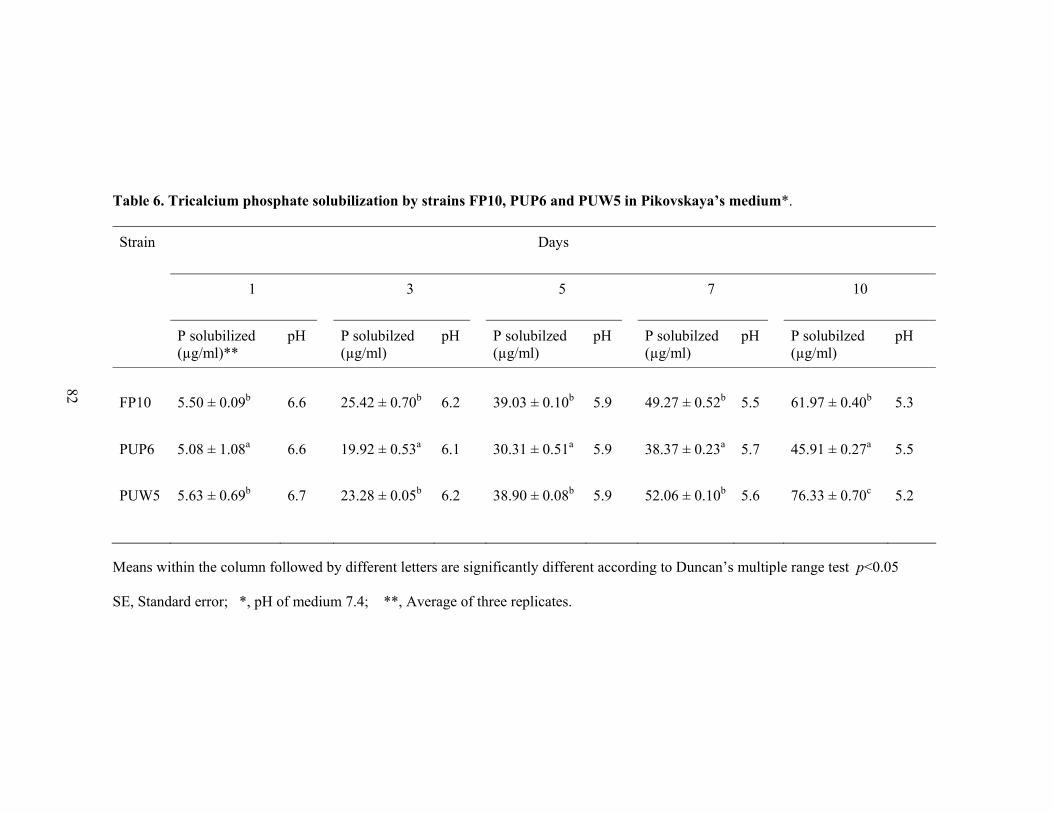
4.4.2. Production and estimation of phosphatase
Strains FP10, PUP6 and PUW5 produced phosphate solubilization on Pikovskaya’s
agar medium by inducing clear zones around the colonies. The solubilization of tri-
calcium phosphate by FP10, PUP6 and PUW5 after 10 days inoculation the soluble
phosphate was estimated to be 45.91 to 76.33 µg/ml (Table 6; Fig. 3A). The pH of
Pikovskaya’s liquid medium (pH 7.4) was reduced to pH 5.2 after 10 days inoculation
(Table 6; Fig. 3B).
4.4.3. Production and estimation of indole-3-acetic acid
Production of indole-3-acetic acid (IAA) was identified in strain FP10 and PUP6 by
the formation of a characteristic red halo on the filter paper immediately surrounding
the colonies. The IAA production was estimated during the stationary phase of
Page 11
81
fermentation in Dworkin and Foster (DF) salts medium amended with 500 µg/ml of
tryptophan. Production of IAA by strains FP10 and PUP6 was estimated up to 19.1
µg/ml and 18.9 µg/ml, respectively (Table 7; Table 8).
4.4.4. Production of 1-aminocyclopropane carboxylate deaminase
Production of 1-aminocyclopropane carboxylate (ACC) deaminase was observed only
in strain PUW5 as shown by the growth on DF minimal salt medium amended with 3
mM ACC. Strains FP10 and PUP6 did not produce ACC deaminase (Table 7).
4.4.5. N-acyl homoserine lactone production
Strain FP10 produced N-acyl homoserine lactone (AHL) as observed by liberation of
the chromogen on the test medium (Table 7).
Page 12
82
Table 6. Tricalcium phosphate solubilization by strains FP10, PUP6 and PUW5 in Pikovskaya’s medium*. Strain Days
1 3 5 7 10
P solubilized (µg/ml)**
pH P solubilzed
(µg/ml) pH P solubilzed
(µg/ml) pH P solubilzed
(µg/ml) pH P solubilzed
(µg/ml) pH
FP10 5.50 ± 0.09b 6.6 25.42 ± 0.70b 6.2 39.03 ± 0.10b 5.9 49.27 ± 0.52b 5.5 61.97 ± 0.40b 5.3 PUP6 5.08 ± 1.08a 6.6 19.92 ± 0.53a 6.1 30.31 ± 0.51a 5.9 38.37 ± 0.23a 5.7 45.91 ± 0.27a 5.5 PUW5 5.63 ± 0.69b 6.7 23.28 ± 0.05b 6.2 38.90 ± 0.08b 5.9 52.06 ± 0.10b 5.6 76.33 ± 0.70c 5.2
Means within the column followed by different letters are significantly different according to Duncan’s multiple range test p<0.05
SE, Standard error; *, pH of medium 7.4; **, Average of three replicates.
Page 13
83
A
2 4 6 8 100
20
40
60
80
Ph
osph
ate
solu
biliz
ed (
µg/
ml)
Time (Days)
FP10 PUP6 PUW5
B
0 2 4 6 8 104.5
5.0
5.5
6.0
6.5
7.0
pH
Time (Days)
FP10 PUP6 PUW5
Figure 3. Determination of phosphate-solubilizing activity of strains FP10, PUP6
and PUW5. (A) Soluble phosphate was estimated from absorbance using the
calibration curve with KH2PO4 at 600 nm. The data obtained for strain PUP6 were
plotted as a function of time. (B) pH variation in Pikovskaya’s medium during growth
of strain PUP6.
Page 14
84
Table 7. Plant growth-promoting traits of strains FP10, PUP6 and PUW5
Strain
Plant growth-promoting trait
Siderophore
IAA
Phosphatase
ACC deaminase
AHL
FP10 + + + − +
PUP6 + + + − −
PUW5 + − + + −
IAA, indole-3-acetic acid; ACC, 1-aminocyclopropane-carboxylate; AHL, N-acyl
homoserine lactone; +, positive reaction; −, negative reaction.
Page 15
85
Table 8. Production of indole-3-acetic acid (IAA) in stationary phase culture of
strains FP10 and PUP6 in the presence of various concentrations of tryptophan
in Dworkin and Foster medium
Tryptophan (µg/ml)
IAA (µg/ml ±SE)*
FP10
PUP6
0 0.30 ± 0.1 0.10 ± 0.7
50 4.40 ± 0.4 4.80 ± 0.3
100 7.90 ± 0.8 8.00 ± 0.5
200 11.2 ± 0.6 10.3 ± 0.2
300 14.4 ± 0.3 13.6 ± 0.8
400 17.9 ± 0.2 17.3 ± 0.5
500 19.1 ± 0.9 18.9 ± 0.4
SE, Standard error; *, Average of three replicates.
Page 16
86
4.5. Determination of potential for degradation of pesticides and
hydrocarbons
4.5.1. Utilization of pesticide/insecticide as sole carbon and energy
source
Strain FP10 was capable of growing on pesticide, lindane when provided as the sole
carbon and energy source. The typical growth pattern of strain FP10 is presented in
Fig. 4A. Strains PUP6 and PUW5 were capable of growing on insecticide, carbofuran.
The typical growth pattern of strains PUP6 and PUW5 is presented in Fig. 4B.
4.5.2. Biodegradation of pesticide, lindane
Percent biodegradation of lindane in the cultures was calculated on the basis of GC-
FID data. The percent biodegradation of lindane by strain FP10 was observed to be
99.22% (Fig. 5A).
4.5.3. Biodegradation of insecticide, carbofuran
Percent biodegradation of carbofuran in the cultures calculated on the basis of HPLC
with a UV detector (220 nm) analyses data. The percent biodegradation of carbofuran
by strains PUP6 and PUW5 was as observed to be 22.8% and 62.9%, respectively
(Fig. 5B).
Page 17
87
A
0 2 4 6 8 10 120.0
0.2
0.4
0.6
Cel
l Den
sity
(OD
600)
Time (Days)
FP10
B
0 2 4 6 8 10 12
0.0
0.2
0.4
0.6
Cel
l Den
sity
(OD
600)
Time (Days)
PUP6 PUW5
Figure 4. Growth characteristics of strain FP10 in minimal medium amended
with lindane (A) and strains PUP6 and PUW5 in minimal medium amended with
carbofuran (B), when provided as the sole source of carbon and energy.
Page 18
88
A
0 2 4 6 8 10 12
0
20
40
60
80
100
% re
mai
ning
lind
ane
Time (Days)
FP10
B
0 4 8 120
20
40
60
80
100
% r
emai
ning
car
bofu
ran
Time (Days)
PUP6 PUW5
Figure 5. Biodegradation of lindane by strain FP10 and carbofuran by strains
PUP6 and PUW5. The percent of remaining lindane (A) and carbofuran (B) in
minimal medium, when provided as the sole source of carbon and energy.
Page 19
89
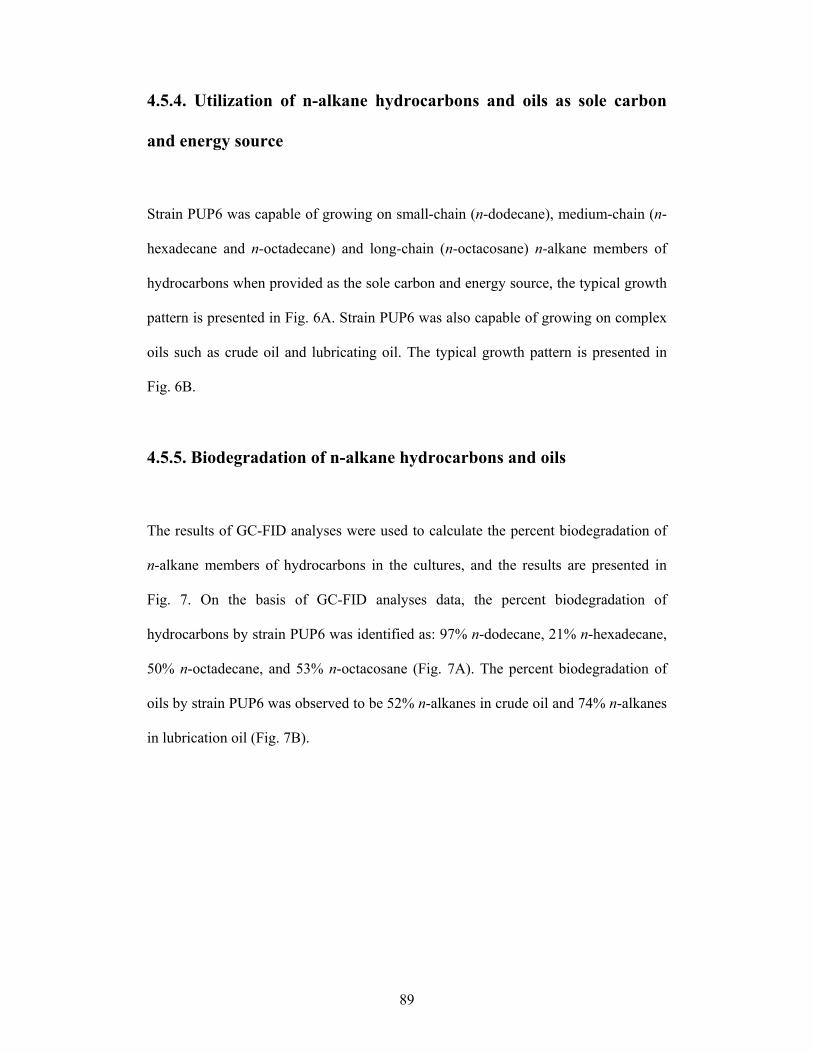
4.5.4. Utilization of n-alkane hydrocarbons and oils as sole carbon
and energy source
Strain PUP6 was capable of growing on small-chain (n-dodecane), medium-chain (n-
hexadecane and n-octadecane) and long-chain (n-octacosane) n-alkane members of
hydrocarbons when provided as the sole carbon and energy source, the typical growth
pattern is presented in Fig. 6A. Strain PUP6 was also capable of growing on complex
oils such as crude oil and lubricating oil. The typical growth pattern is presented in
Fig. 6B.
4.5.5. Biodegradation of n-alkane hydrocarbons and oils
The results of GC-FID analyses were used to calculate the percent biodegradation of
n-alkane members of hydrocarbons in the cultures, and the results are presented in
Fig. 7. On the basis of GC-FID analyses data, the percent biodegradation of
hydrocarbons by strain PUP6 was identified as: 97% n-dodecane, 21% n-hexadecane,
50% n-octadecane, and 53% n-octacosane (Fig. 7A). The percent biodegradation of
oils by strain PUP6 was observed to be 52% n-alkanes in crude oil and 74% n-alkanes
in lubrication oil (Fig. 7B).
Page 20
90
A
B
Figure 6. Growth characteristics of strain PUP6 in minimal medium amended
with each n-alkane member of the hydrocarbons (A) and different oils (B), when
provided as the sole source of carbon and energy.
Page 21
91
A
B
Figure 7. Biodegradation of hydrocarbons and oils by strain PUP6. Percent of
remaining hydrocarbons in minimal medium amended with each n-alkane (A) and
different oils (B), when provided as the sole source of carbon and energy.
Page 22
92
4.6. Determination of fungal cell wall-degrading enzymes
4.6.1. Chitinase production
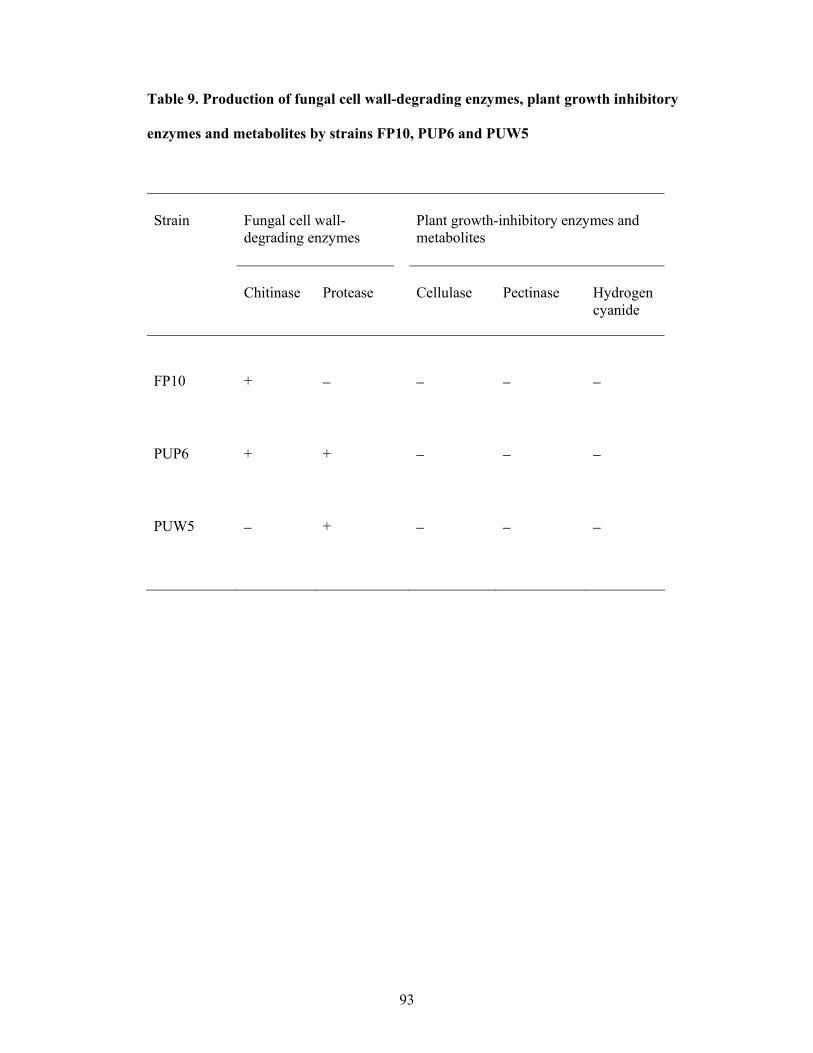
Strains FP10 and PUP6 produced extracellular chitinases as observed by the
formation of clear halos around the bacterial colonies on chitin agar plates (Table 9).
4.6.2. Protease production
Strains PUP6 and PUW5 produced extracellular protease as observed by inducing
clear halos around the bacterial colonies on skim milk agar plates (Table 9).
4.7. Determination of plant growth-inhibitory enzymes and
metabolites
4.7.1. Cellulase production
Strains FP10, PUP6 and PUW5 did not produce extracellular cellulase on congo red -
cellulose agar plates (Table 9).
4.7.2. Pectinase production
Strains FP10, PUP6 and PUW5 did not produce extracellular pectinase on pectin agar
plates (Table 9).
4.7.3. Hydrogen cyanide production
Strains FP10, PUP6 and PUW5 did not produce hydrogen cyanide (HCN) (Table 9).
Page 23
93
Table 9. Production of fungal cell wall-degrading enzymes, plant growth inhibitory
enzymes and metabolites by strains FP10, PUP6 and PUW5
Strain
Fungal cell wall- degrading enzymes
Plant growth-inhibitory enzymes and metabolites
Chitinase
Protease
Cellulase
Pectinase
Hydrogen cyanide
FP10 + − − − −
PUP6 + + − − −
PUW5 − + − − −
Page 24
94
4.8. Detection of antibiotic genes in fluorescent pseudomonads
When total genomic DNA was tested in PCR, primer pair, Phl2a and Phl2b amplified
the DNA fragment (745-bp) corresponding to that of phlD, which is a key gene,
involved in the biosynthesis of DAPG in the test strain FP10 and in the reference
strains P. fluorescens CHAO and P. fluorescens Pf-5, primer pair PhzHup and
PhzHlow amplified the DNA fragment (2000-bp) corresponding to that of PhzH,
which is a key gene in the biosynthesis of PCN in the test strain PUP6 and in the
reference strain P. aeruginosa PAO1. Whereas, all the primer pairs failed to amplify
the genes involved in the production of antibiotics such as DAPG, PCA, PCN, PLT
and PRN (Fig. 8; Table 10) in the test strain PUW5.
Page 25
95
Figure 8. Detection of antibiotic genes by PCR in strains FP10, PUP6 and
PUW5. Lane M, 1 kb DNA ladder (Promega); Lane A, Positive control strain
(P. fluorescens Pf 2-79); Lane B, Positive control strain (P. aeruginosa PAO1);
Lane C, Positive control strain (P. fluorescens CHAO); Lane D, Positive control
strain (P. fluorescens Pf-5); Lane E, Positive control strain (P. fluorescens
CHAO); Lane 1, Strain FP10; Lane 2, Strain PUP6; Lane 3, Strain PUW5.
Page 26
96
Table 10. Detection of antibiotic genes in strains FP10, PUP6 and PUW5 by PCR
Strain
Antibiotic gene (bp)
DAPG (745)
PCA (1100)
PCN (2000)
PRN (786)
PLT (779)
Reference strain
P. fluorescens Pf-5 + − − + +
P. fluorescens CHAO + − − + +
P. fluorescens 2-79 − + − − −
P. aeruginosa PAO1 − − + − −
Test strain
FP10 + − − − −
PUP6 – – + – –
PUW5 − − − − −
DAPG, 2,4-diacetylphloroglucinol; PCA, phenazine-1-carboxylic acid; PCN,
phenazine-1-carboxamide; PRN, pyrolnitrin; PLT, pyoluteorin ; +, positive reaction ;
−, negative reaction.
Page 27
97
4.9. Production, extraction, purification and structural elucidation of
antifungal metabolites
4.9.1. Production and extraction of antifungal metabolites by FP10,
PUP6 and PUW5
Crude extracts by strains FP10, PUP6 and PUW5 showed dark-brown, brown and
orange-brown color, respectively. A total of 3.6 g, 3.4 g and 3.7 g of crude metabolite
was recovered from 10 L of fermentation cultures of strain FP10, PUP6 and PUW5,
respectively.
4.9.2. Purification and structural elucidation of antifungal metabolite
by strain FP10
4.9.2.1. Purification of antifungal metabolite by strain FP10
Crude extract by strain FP10 was purified through silica gel chromatography and
preparative HPLC. After purification, the crude extract yielded 13 mg of purified dark
brown metabolite. The active fractions were identified by in vitro antibiosis against
Cylindrocladium scoparium. TLC of purified metabolite showed the Rf value of 0.77
(Fig. 9A). The homogeneity of metabolite was further confirmed by analytical HPLC.
The metabolite was detected at a wavelength of 270 nm and its retention time was
10.77 min (Fig. 9B).
Page 28
98
A
B
Figure 9. Thin layer chromatogram (A) high performance liquid chromatogram
(B) of antifingal metabolite produced by strain FP10.
Page 29
99
4.9.2.2. Spectroscopic analyses of antifungal metabolite by strain
FP10
4.9.2.2.1. UV-Visible absorption spectroscopic analyses
The absorption spectrum of purified metabolite produced by strain FP10 showed
absorbance at 220 and 270 nm (Fig. 10).
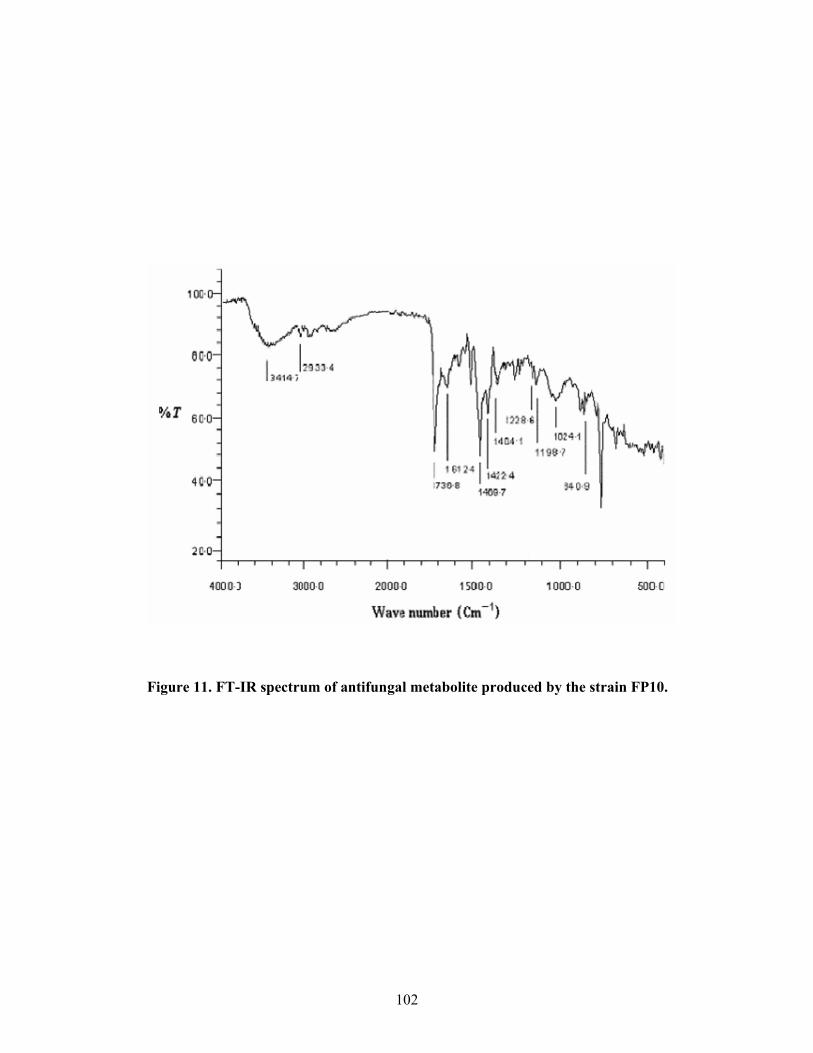
4.9.2.2.2. Fourier transform infrared (FT-IR) spectroscopic analyses
FT-IR spectrum of purified metabolite produced by strain FP10 showed the functional
groups such as H-bonded OH, aromatic ring, C–H groups in C–CH3 compound, aryl
carbonyl compounds, C–OH in alcohols, ethers, acid esters (Fig. 11). Wave numbers
and corresponding groups present in the metabolite produced by FP10 are shown in
Table 11.
4.9.2.2.3. Liquid chromatography-Mass spectroscopic (LC-MS)
analyses of metabolite produced by FP10
The mass spectrum of purified metabolite produced by strain FP10 showed a
molecular ion peak of the metabolite at m/z 211.0 (M+H) (Fig. 12).
Page 30
100
4.9.2.2.4. Structural elucidation of antifungal metabolite production
by FP10
On the basis of spectral data and the literature survey (Keel at al. 1990;
Shanahan et al. 1992) the metabolite has been characterized as 2,4-
diacetylphloroglucinol (DAPG) (Fig. 13). The minimum inhibitory concentration
(MIC) of DAPG towards M. phaseolina, S. aureus, M. luteus, Bacillus sp. S.
pyrogenes and C. albicans was 10 µg.
Page 31
101
Figure 10. UV-visible abosorption spectrum of antifungal metabolite produced
by FP10.
Page 32
102
Figure 11. FT-IR spectrum of antifungal metabolite produced by the strain FP10.
Page 33
103
Table 11. Functional groups of infrared spectrum (FT-IR) of antifungal metabolite
produced by strain FP10
Wave numbers* (cm-1)
Functional groups
3600–3200 H-bonded OH
3420–3250 –OH group in alcohols and phenol
3300 Aromatic ring
2970–1850 C–H groups in C–CH3 compound
1700–1680 Aryl carbonyl compounds
1630–1430 Aromatic ring stretching
1600–1500 Aromatic ring
1200–1015 C–OH in alcohols
1100–130 Alcohols, ethers, acid esters
Functional groups were determined as described by Socrates (2001)
*An average of 40 scans in the frequency range 4000–500 cm-1
Page 34
104
Figure 12. Mass spectrum of antifungal metabolite by strain FP10.
Page 35
105
Figure 13. Structure of antifungal metabolite (2,4-diacetylphloroglucinol)
by strain FP10 based on UV-Visible, IR, NMR and MS data
Page 36
106
4.9.3. Purification and structural elucidation of antifungal metabolite
by strain PUP6
4.9.3.1. Purification of antifungal metabolite by strain PUP6
Crude extract by strain PUP6 was purified through silica gel chromatography and
preparative HPLC. After purification, the crude extract yielded 10 mg of greenish-
yellow metabolite. The active fractions were identified by in vitro antibiosis against
Sarocladium oryzae. TLC of purified metabolite showed the Rf value of 0.48 (Fig.
14A). The homogeneity of metabolite was further confirmed by analytical HPLC. The
metabolite was detected at a wavelength of 254 nm and its retention time was 8.48
min (Fig. 14B).
Page 37
107
A
B
Figure 14. Thin layer chromatogram (A) and high performance liquid
chromatogram (B) of antifungal metabolite by strain PUP6.
Page 38
108
4.9.3.2. Spectroscopic analyses of antifungal metabolite by PUP6
4.9.3.2.1. Ultraviolet-visible absorption spectroscopic analyses
The absorption spectrum of purified metabolite produced by strain PUP6 showed
absorbance at 254 and 360 nm (Fig. 15).
4.9.3.2.2. Fourier transform infrared spectroscopic analyses
Fourier transform infrared (FT-IR) spectrum of purified metabolite produced by strain
PUP6 showed the functional groups such as NH2 streching, NH stretch in aromatic
amide, C-H stretch, several peaks due to aromatic ring, C=O stretch (amide bond),
aromatic ring stretching, C-N stretch (amide bond), C-N stretch, inplane ring bending,
ring deformation (Fig. 16). Wave numbers and corresponding groups present in
metabolite produced by PUP6 are shown in Table 12.
4.9.3.2.3. Liquid chromatography-Mass spectroscopic (LC-MS)
analyses
The mass spectrum of purified metabolite produced by strain PUP6 showed a
molecular ion peak of the metabolite at m/z 224.0 (M+H) (Fig. 17).
Page 39
109
4.9.3.2.4. Nuclear magnetic resonance analyses of antifungal
metabolite produced by PUP6
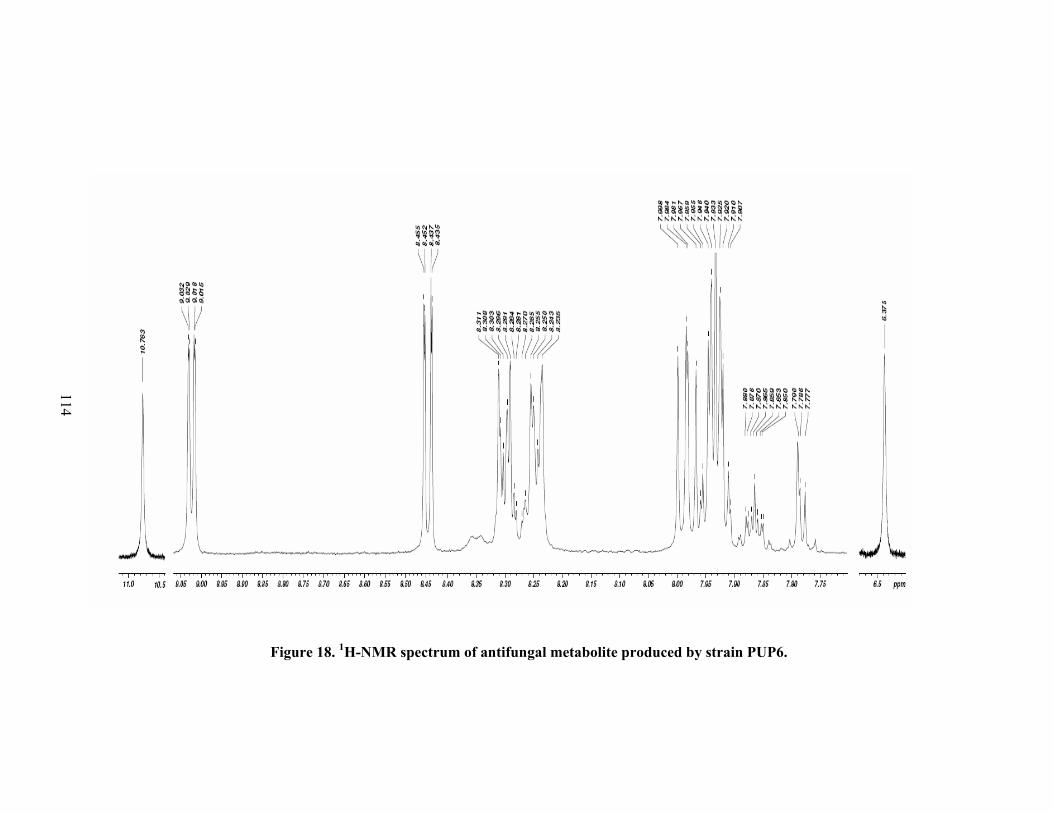
The 1H- nuclear magnetic resonance (NMR) spectrum (500 MHz, CDCl3) of purified
metabolite produced by strain PUP6 showed signals due to the presence of seven
aromatic protons at δ 9.02 (1H, dd, J = 8.2, 2.1 Hz 2-H), 8.45 (1H, dd, J = 8.2, 2.1 Hz,
4-H), 8.32 (1H, ddd, J = 2.4, 5.2, 8.2 Hz, 9-H), 8.31 (1H, ddd J = 2.4, 5.2, 8.2 Hz, 6-
H), 7.97 (1H, dd, J = 8.2, 8.4 Hz, 3-H), 7.94 (1H, dd, J = 8.2, 2.2 Hz, 8-H), 7.92 (1H,
dd, J = 8.2, 2.2 Hz, 7-H). Furthermore, 1H NMR displayed two D2O exchangeable
signals at δ 10.8 (1H, brs NH) and 6.31 (1H, brs NH) (Fig. 18). The carboxamide
proton signals at δ 10.8 ppm confirmed the presence of carboxamide. The 13C NMR
spectra of the compound (120 MHz, CDCl3) showed peaks at δ 166, 143.5, 143.0,
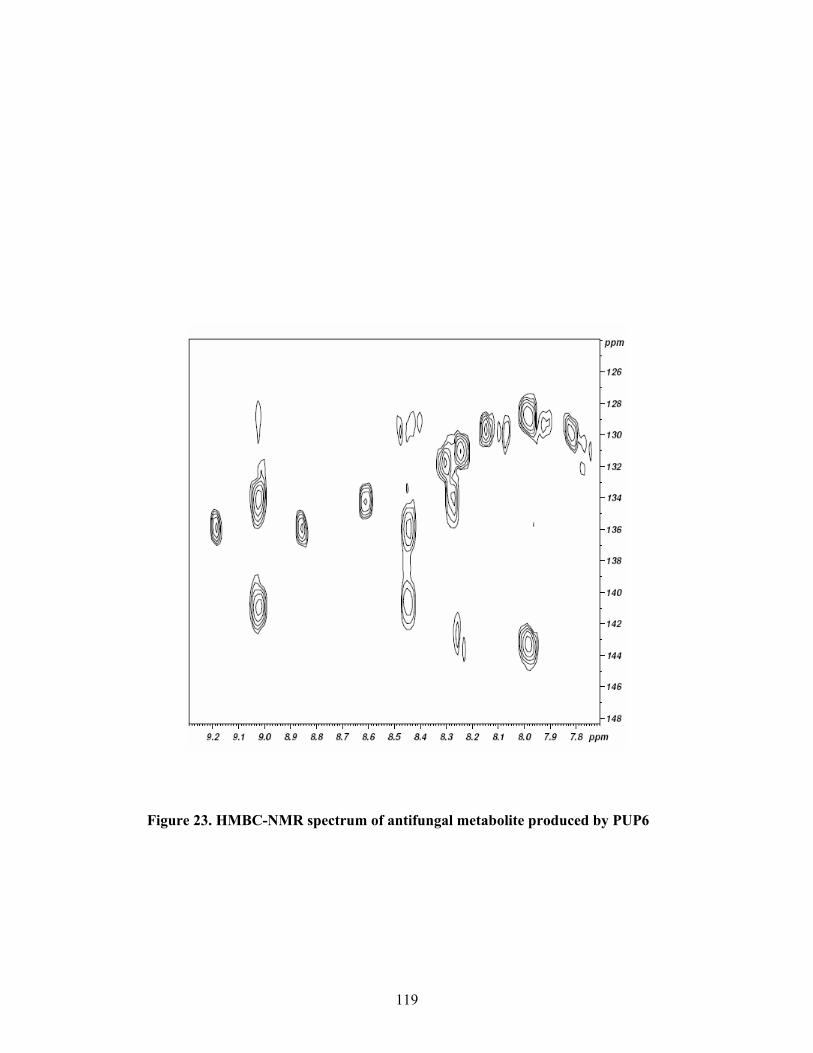
141.5, 140.8, 134.3, 131.7, 131.0, 129.9, 129.1 and 128.8 ppm (Fig. 19). The proton
positions of the antibiotic were assigned using 1H-1H COSY, DQF-COSY, TOCSY,
HMBC, HSQC data (Fig. 20, 21, 22, 23, 24).
4.9.3.2.5. Structural elucidation of antifungal metabolite production
by PUP6
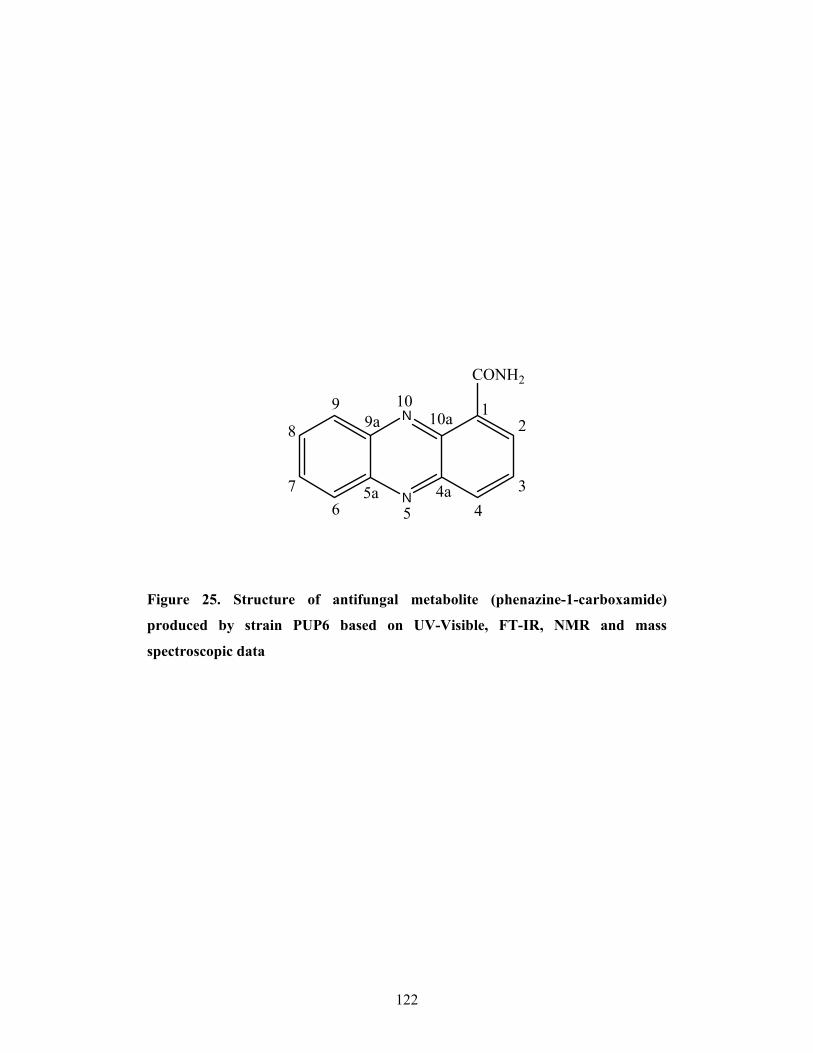
On the basis of spectral data and the literature survey (Chin-A-Woeng et al. 1998) the
metabolite has been characterized as phenazine-1-carboxamide (PCN) (Fig. 25). The
minimum inhibitory concentration of PCN towards S. oryzae, F. oxysporum f. sp.
cubense and S. pyrogenes was 60 µg.
Page 40
110
Figure 15. UV-Visible abosorption spectrum of antifungal metabolite produced
by strain PUP6.
Page 41
111
Figure 16. FT-IR spectrum of antifungal metabolite produced by strain PUP6.
Page 42
112
Table 12. Functional groups of infrared spectrum (FT-IR) of antifungal metabolite
produced by strain PUP6
Wave numbers* (cm-1)
Functional groups
3540-3520 NH2 stretching
3520-3320 -NH stretch in aromatic amide
3100-3000 C-H stretch, several peaks due to aromatic ring
1680-1660 C=O stretch (Amide bond)
1630-1430 Aromatic ring stretching
1420-1400 C-N stretch (Amide bond)
1120-1030 C-N stretch
645-615 Inplane ring bending
580-420 Ring deformation
Functional groups were determined as described by Socrates (2001)
*An average of 40 scans in the frequency range 4000–500 cm-1
Page 43
113
Figure 17. Mass spectrum of antifungal metabolite produced by strain PUP6.
Page 44
114
Figure 18. 1H-NMR spectrum of antifungal metabolite produced by strain PUP6.
Page 45
115
Figure 19. 13C-NMR spectrum of antifungal metabolite produced by strain PUP6.
Page 46
116
Figure 20. 1H-1H-COSY NMR spectrum of antifungal metabolite produced by strain
PUP6.
Page 47
117
Figure 21. DQF-COSY NMR spectrum of antifungal metabolite produced by strain
PUP6.
Page 48
118
Figure 22. TOCSY-NMR spectrum of antifungal metabolite produced by strain
PUP6.
Page 49
119
Figure 23. HMBC-NMR spectrum of antifungal metabolite produced by PUP6
Page 50
120
Figure 24. HSQC-NMR spectrum of antifungal metabolite produced by PUP6
Page 51
121
Table 13. Chemical shift assignments and coupling constant value of antifungal
metabolite produced by PUP6
Proton
Chemical shift (ppm)
Coupling constant J(H, H)/(Hz)
DQF-COSY 1H Cross peaks (ppm)
H-2 8.54 J(2, 3)=8.0, J(2, 4)=1.4 8.05
H-3 8.05 J(3, 2)=8.0, J(3, 4)=8.2 8.54, 8.98
H-4 8.98 J(4, 3)=8.2, J(4,2)=1.4 8.05
H-6 8.36 J(6, 7)=7.8, J(6, 8)=1.2 7.99
H-7 7.99 m 8.36, 8.05
H-8 8.05 m 7.99, 8.30
H-9 8.30 J(9, 8)=8.1, J(9,7)=1.0Hz 8.05
CONH2 10.8 s -
*s, singlet; m, multiplet
Page 52
122
N
N
CONH2
2
345
5a 4a6
7
8
99a
1010a 1
Figure 25. Structure of antifungal metabolite (phenazine-1-carboxamide)
produced by strain PUP6 based on UV-Visible, FT-IR, NMR and mass
spectroscopic data
Page 53
123
4.9.4. Purification and structural elucidation of antifungal metabolite
by strain PUW5
4.9.4.1. Purification of antifungal metabolite by strain PUW5
Crude extract by strain PUW5 was purified through silica gel chromatography and
preparative HPLC. After purification, the crude extract yielded 6 mg of purified
orange-brown metabolite. The active fractions were identified by in vitro antibiosis
against Sarocladium oryzae. TLC of purified metabolite showed the Rf value of 0.65
(Fig. 26A). The homogeneity of metabolite was further confirmed by analytical
HPLC. The metabolite was detected at a wavelength of 254 nm and its retention time
was 6.77 min (Fig. 26B).
Page 54
124
A
B
Figure 26. Thin layer chromatogram (A) and high performance liquid
chromatogram (B) of antifungal metabolite by strain PUW5.
Page 55
125
4.9.4.2. Spectroscopic analyses of antifungal metabolite by PUW5
4.9.4.2.1. UV-Visible absorption spectroscopic analyses
The absorption spectrum of purified metabolite produced by strain PUW5 showed
absorbance at 254, 360 and 430 nm (Fig. 27).
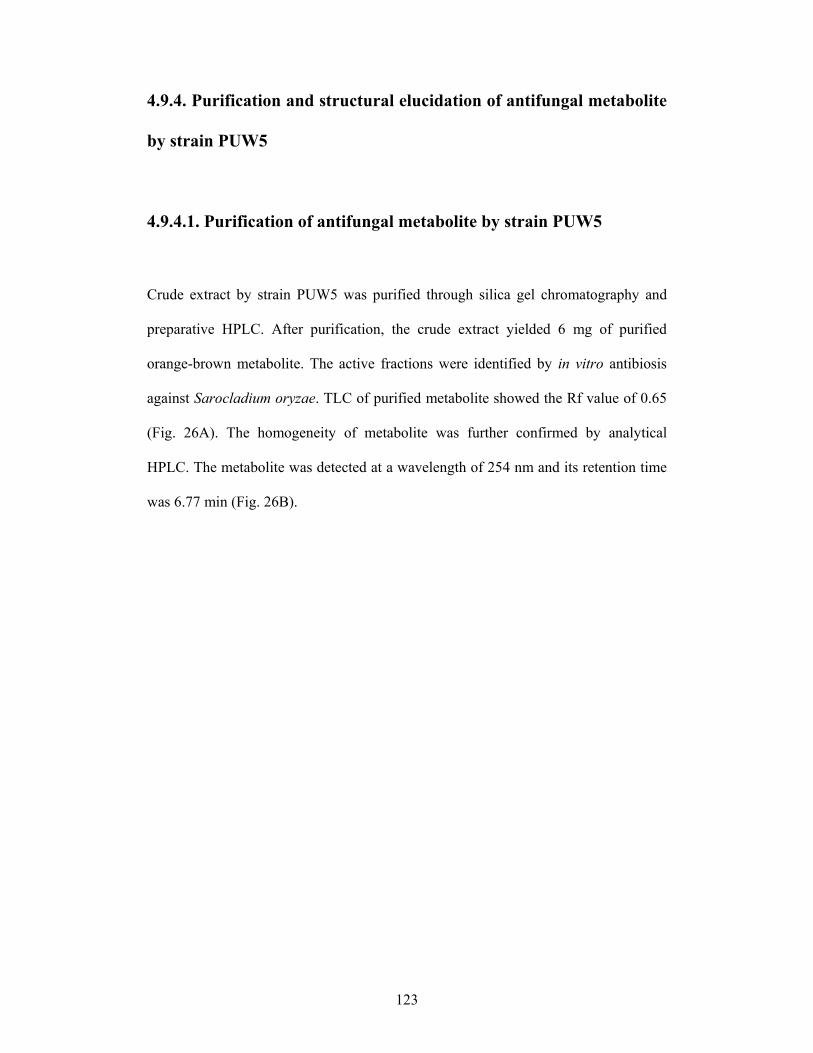
4.9.4.2.2. Fourier transform infrared (FT-IR) spectroscopic analyses
FT-IR spectrum of purified metabolite produced by strain PUW5 showed the
functional groups such as H-bonded OH, -CH antisym and sym stretching, CH3
attached to O or N, C=O in carboxylic acid group, COO- group in carboxylic acid,
aromatic ring stretching, C–OH in alcohols, O-C=O bending in carboxylic acids and
aromatic ring inplane deformation (Fig. 28). The transmittance corresponds to the
functional groups such as (Table 14).
4.9.4.2.3. Electrospray ionization mass spectroscopic (ESI-MS/MS)
analyses
ESI-MS spectrum of purified compound produced by PUW5 showed a molecular ion
peak of the metabolite at m/z 241.1 (M+H) and m/z 263.0 (M+Na+H). The second
dimension mass spectrum (MS/MS) of molecular ion peak m/z 241.1 (M+H), resluted
fragmentation pattern consisting molecular ion peaks at m/z 225.0, m/z 208.1 and m/z
180.1 (Fig. 29).
Page 56
126
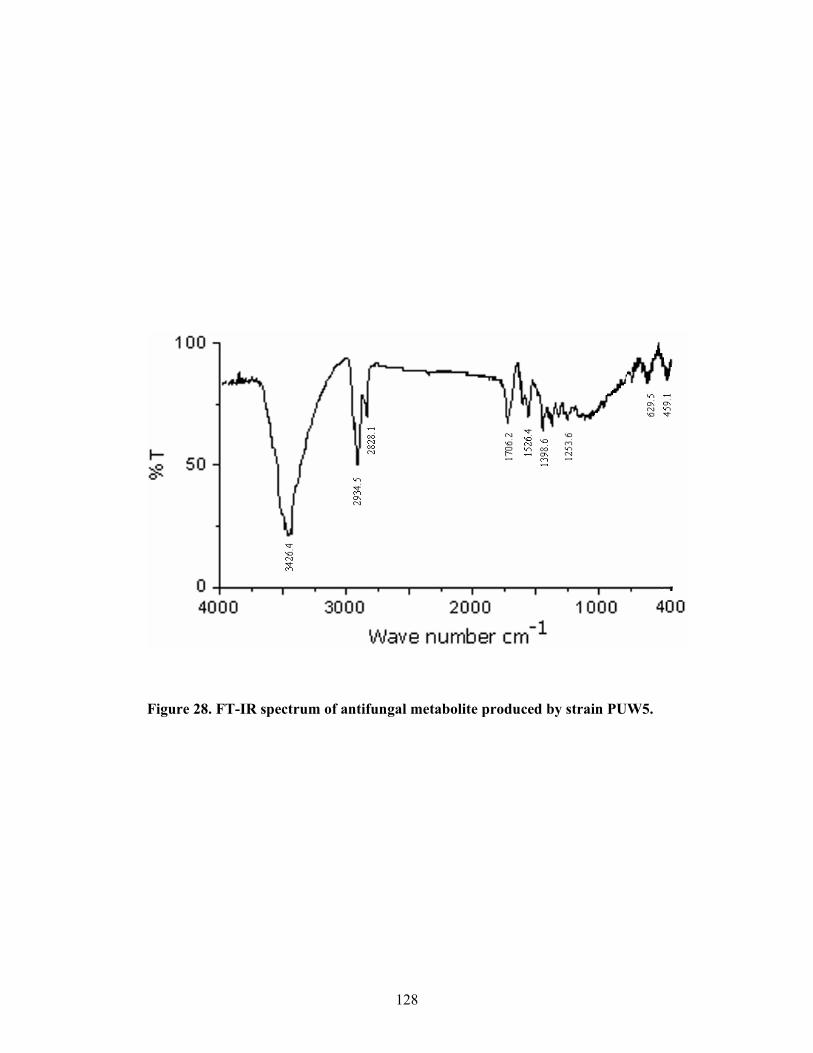
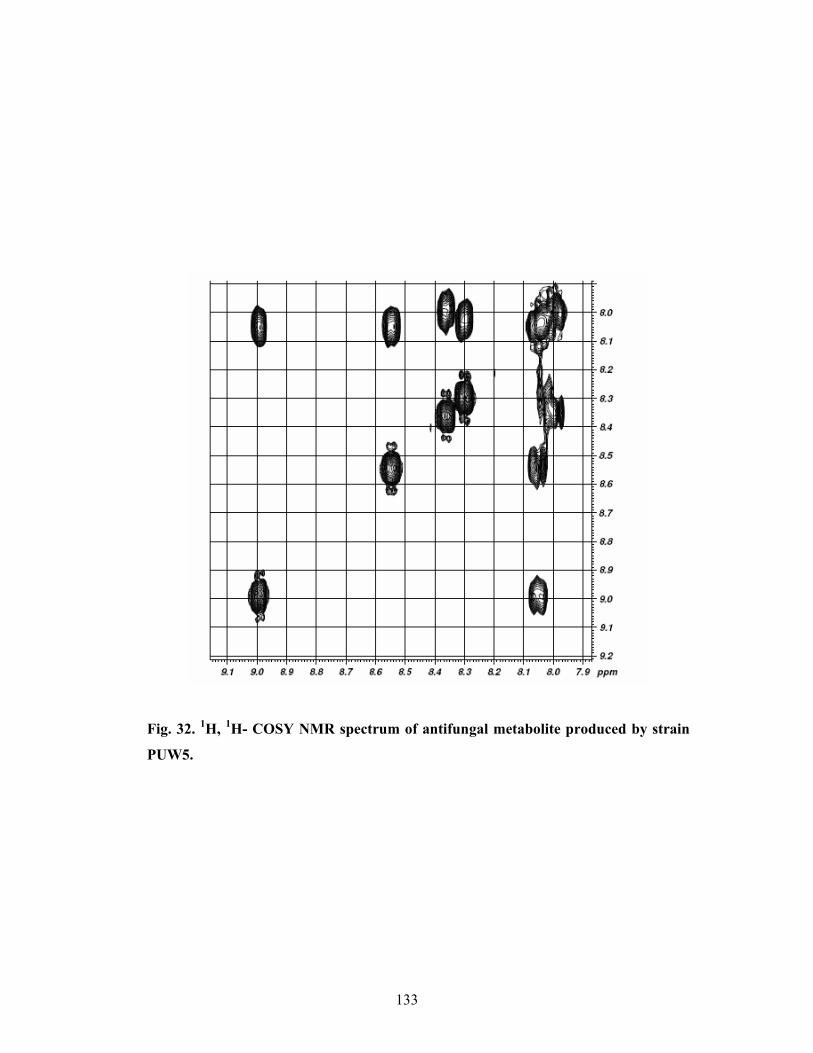
4.9.4.2.4. NMR analyses of antifungal metabolite produced by PUW5
The 1H NMR spectrum (500 MHz, CDCl3) of purified antibiotic isolated from strain
PUW5, showed signals due to the presence of seven aromatic protons at δ 9.00, 8.56,
8.37, 8.31, 8.07, 8.05, 7.99 ppm and carboxylic acid and methyl proton at δ 15.6 and
1.57, respectively (Fig. 30). The 13C NMR spectra of the compound (125.7 MHz,
CDCl3) showed peaks at δ 165.93, 147.11, 144.13, 143.49, 140.54, 137.46, 135.17,
133.24, 131.76, 130.29, 130.15, 127.99, 125.13, and 29.71 ppm (Fig. 31). The proton
positions of the antibiotic were assigned using 1H-1H COSY, DQFCOSY, TOCSY
and HMQC data (Fig. 32, 33, 34, 35; Table 15).
4.9.4.2.5. Structural elucidation of antifungal metabolite production
by PUW5
On the basis of NMR, mass spectroscopic data and literature survey the metabolite
has been identified as 5-methyl phenazine-1-carboxylic acid betaine (MPCB) (Fig.
36). The minimum inhibitory concentration (MIC) of MPCB towards S. oryzae, M.
grisea and S. pyrogenes was 60 µg.
Page 57
127
Figure 27. UV-Visible abosorption spectrum of antifungal metabolite produced
by strain PUW5.
Page 58
128
Figure 28. FT-IR spectrum of antifungal metabolite produced by strain PUW5.
Page 59
129
Table 14. Functional groups of infrared spectrum (FT-IR) of antifungal
metabolite produced by strain PUW5
Wave numbers* (cm-1)
Functional groups
3600–3200 H-bonded OH
2990-2880 -CH antisym and sym stretching
2850-2700 CH3 attached to O or N
1710-1690 C=O in carboxylic acid group
1400-1310 COO- group in carboxylic acid
1630–1430 Aromatic ring stretching
1200-1015 C–OH in alcohols
700-590 O-C=O bending in carboxylic acids
545-520 Aromatic ring inplane deformation
Functional groups were determined as described by Socrates (2001)
*An average of 40 scans in the frequency range 4000–500 cm-1
Page 60
130
Fig. 29. ESI-MS and ESI-MS/MS spectrum (inset) of the antifungal metabolite
produced by strain PUW5.
Page 61
131
Fig. 30. 1H-NMR spectrum of antifungal metabolite produced by strain PUW5.
Page 62
132
Fig. 31. 13C-NMR spectrum of antifungal metabolite produced by strain PUW5.
Page 63
133
Fig. 32. 1H, 1H- COSY NMR spectrum of antifungal metabolite produced by strain
PUW5.
Page 64
134
Fig. 33. DQF-COSY NMR spectrum of antifungal metabolite produced by strain
PUW5.
Page 65
135
Fig. 34. TOCSY-NMR spectrum of antifungal metabolite produced by PUW5.
Page 66
136
Fig. 35. HSQC-NMR spectrum of antifungal metabolite produced by strain
PUW5.
Page 67
137
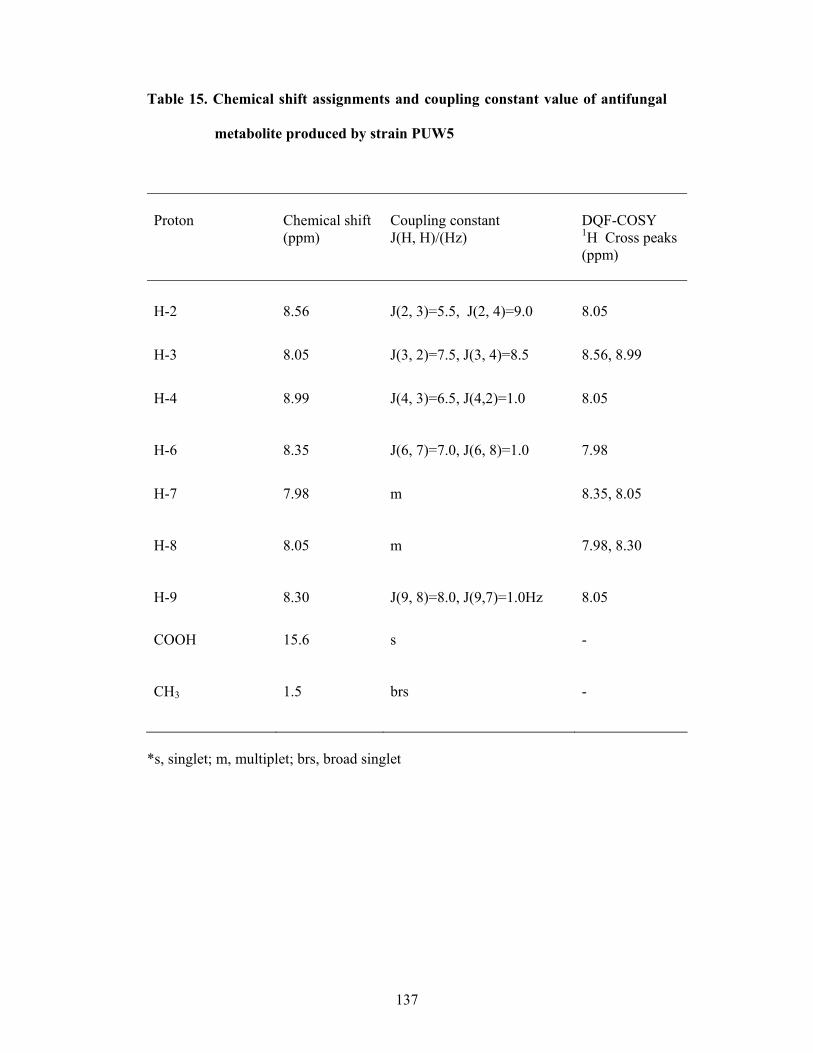
Table 15. Chemical shift assignments and coupling constant value of antifungal
metabolite produced by strain PUW5
Proton
Chemical shift (ppm)
Coupling constant J(H, H)/(Hz)
DQF-COSY 1H Cross peaks (ppm)
H-2 8.56 J(2, 3)=5.5, J(2, 4)=9.0 8.05
H-3 8.05 J(3, 2)=7.5, J(3, 4)=8.5 8.56, 8.99
H-4 8.99 J(4, 3)=6.5, J(4,2)=1.0 8.05
H-6 8.35 J(6, 7)=7.0, J(6, 8)=1.0 7.98
H-7 7.98 m 8.35, 8.05
H-8 8.05 m 7.98, 8.30
H-9 8.30 J(9, 8)=8.0, J(9,7)=1.0Hz 8.05
COOH 15.6 s -
CH3 1.5 brs -
*s, singlet; m, multiplet; brs, broad singlet
Page 68
138
Fig. 36. Structure of antifungal metabolite (5-methyl phenazine-1-carboxylic acid
betaine) produced by strain PUW5 based on FT-IR, NMR and ESI-MS/MS data.