11
Fig. 3. Axial temperature distribution for the at plate experiment. fl
| Date post: | 26-Dec-2015 |
| Category: |
Documents |
| Upload: | dylan-harper |
| View: | 215 times |
| Download: | 2 times |
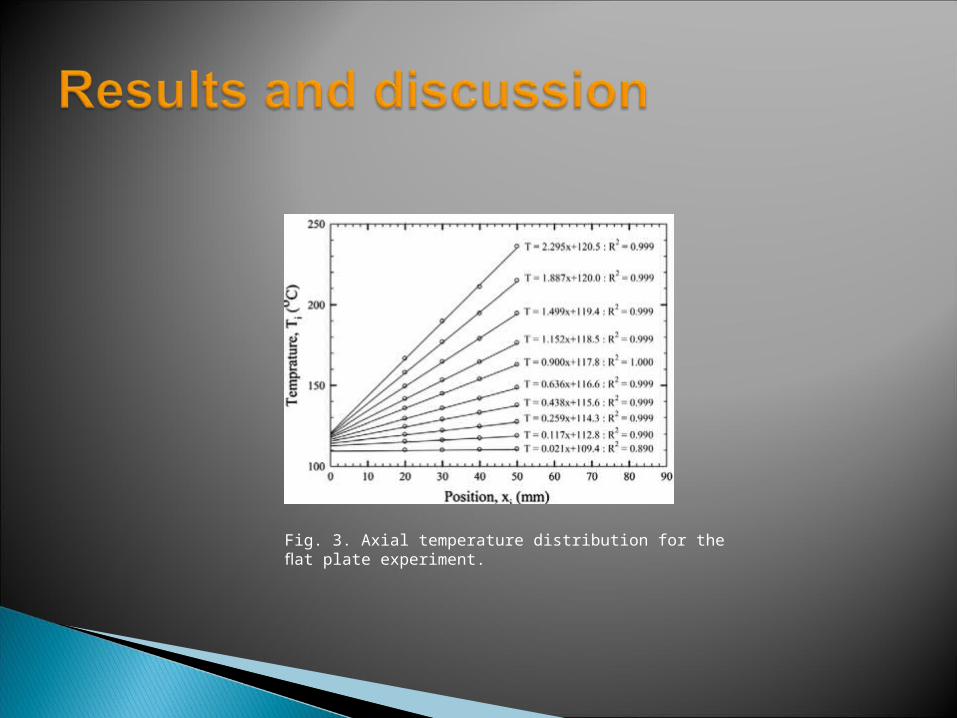
Fig. 3. Axial temperature distribution for the flat plate experiment.

Fig. 4. Comparison of present data with Rohsenow’s correlation and otherresearchers. (See above-mentioned references for further information.)

Fig. 5. Nucleate pool boiling heat transfer of TiO2 –water nanofluids for copper heating surface with roughness 0.2 lm at 1 atm.

Fig. 6. Nucleate pool boiling heat transfer of TiO2 –water nanofluids for copper heating surface with roughness 4 lm at 1 atm.

Fig. 7. Nucleate pool boiling heat transfer of TiO2 –water nanofluids for aluminium heating surface with roughness 0.2 lm at 1 atm.
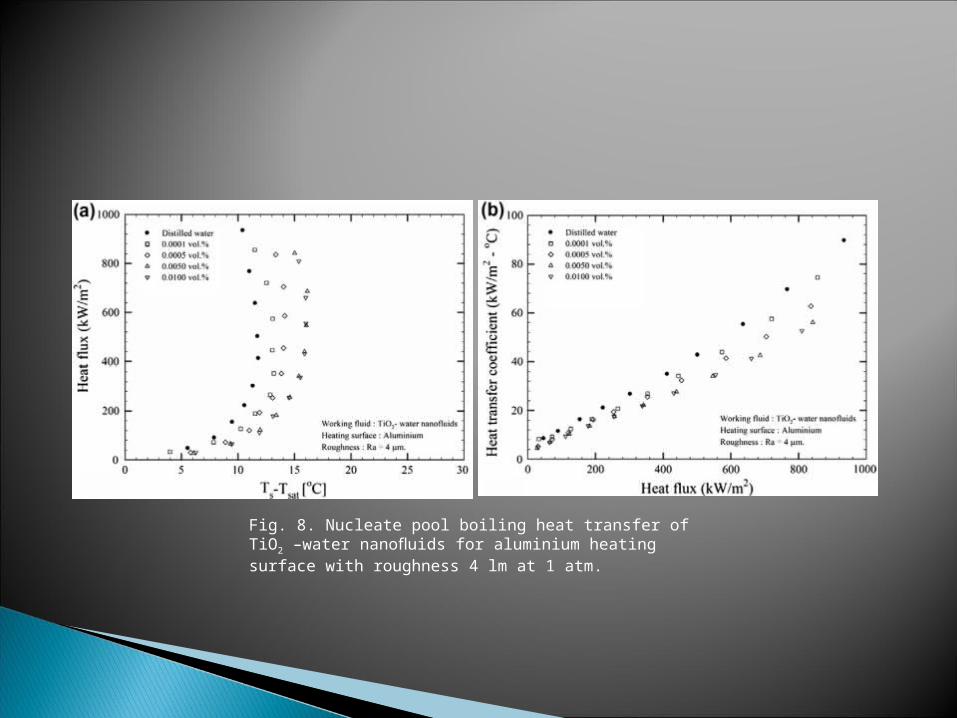
Fig. 8. Nucleate pool boiling heat transfer of TiO2 –water nanofluids for aluminium heating surface with roughness 4 lm at 1 atm.

Fig. 9. Nucleate pool boiling heat transfer of distill water at 1 atm.
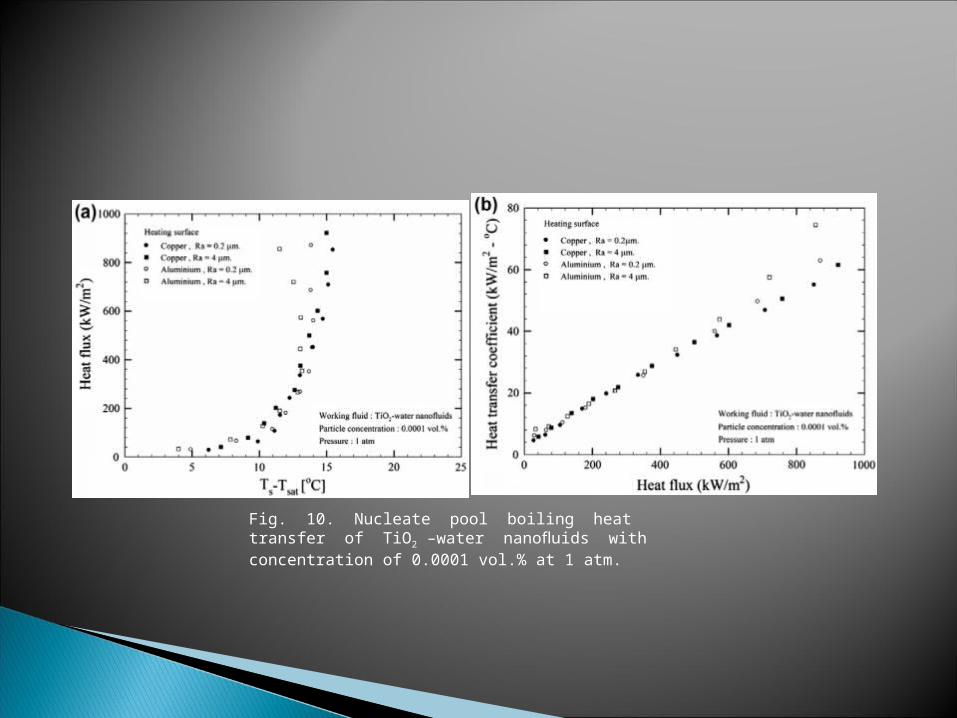
Fig. 10. Nucleate pool boiling heat transfer of TiO2 –water nanofluids with concentration of 0.0001 vol.% at 1 atm.

Fig. 11. Nucleate pool boiling heat transfer of TiO2 –water nanofluids with concentration of 0.0005 vol.% at 1 atm.

Fig. 12. Nucleate pool boiling heat transfer of TiO2 –water nanofluids with concentration of 0.005 vol.% at 1 atm.
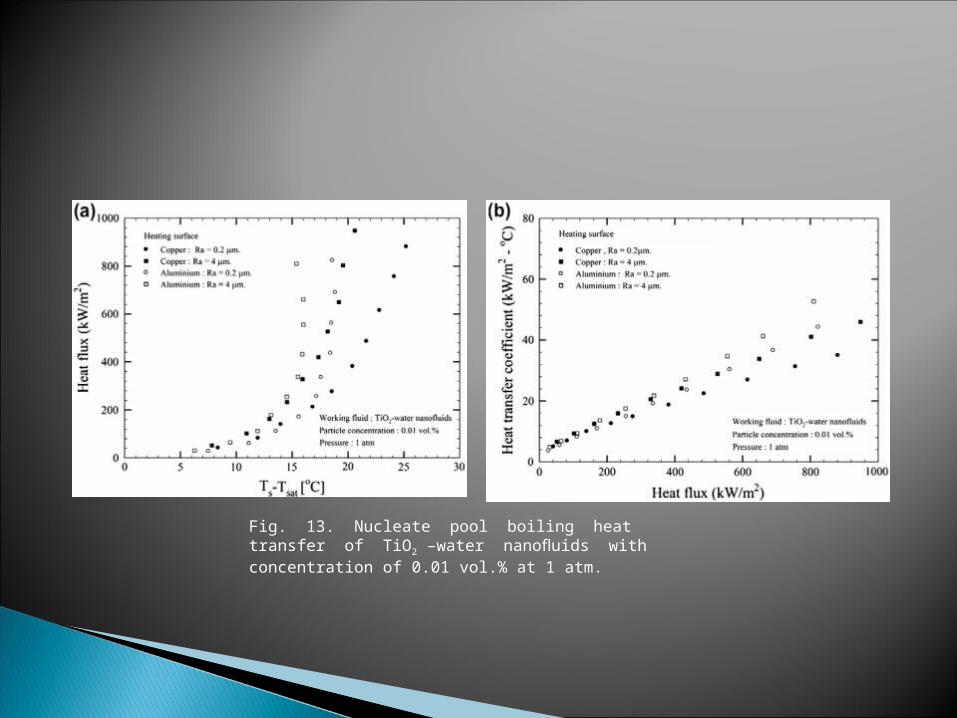
Fig. 13. Nucleate pool boiling heat transfer of TiO2 –water nanofluids with concentration of 0.01 vol.% at 1 atm.


![Journal of Membrane Science - wqjin-group.com filled PEBA... · The pervaporation experiment was conducted on a homemade apparatus [14]. The flat membrane was sealed in a stainless](https://static.documents.pub/doc/80x56/5ba0ca0909d3f2df578d8b22/journal-of-membrane-science-wqjin-groupcom-filled-peba-the-pervaporation.jpg)


