First Quarter 2021 Results May 5, 2021 Our SolvaLite™ composites are up to 40% lighter than metal, allowing manufacturers to create lighter and more energy-efficient vehicles that contribute to reducing CO 2 emissions.
Transcript
First Quarter 2021 ResultsMay 5, 2021
Our SolvaLite™ composites are up to 40% lighter than metal, allowing manufacturers to create lighter and more energy-efficient vehicles that contribute to reducing CO2 emissions.
First Quarter 2021 Earnings
Forenote
This presentation may contain forward-looking information. Forward-looking statements describe expectations, plans, strategies, goals, future events or intentions. The
achievement of forward-looking statements contained in this presentation is subject to risks and uncertainties relating to a number of factors, including general economic
factors, interest rate and foreign currency exchange rate fluctuations, changing market conditions, product competition, the nature of product development, impact of
acquisitions and divestitures, restructurings, products withdrawals, regulatory approval processes, all-in scenario of R&D projects and other unusual items. Consequently,
actual results or future events may differ materially from those expressed or implied by such forward-looking statements.
Should known or unknown risks or uncertainties materialize, or should our assumptions prove inaccurate, actual results could vary materially from those anticipated. The
Company undertakes no obligation to publicly update or revise any forward-looking statements.
This document does not constitute an offer to sell, or the solicitation of an offer to subscribe for or buy, any securities.
page 2
First Quarter 2021 Earnings
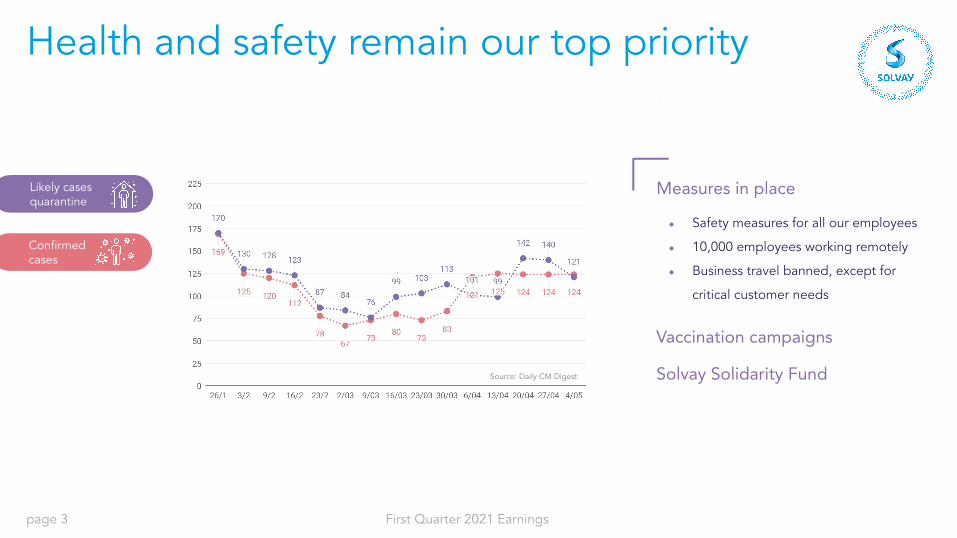
Health and safety remain our top priority
page 3
Source: Daily CM Digest
Confirmedcases
Measures in place
● Safety measures for all our employees
● 10,000 employees working remotely
● Business travel banned, except for
critical customer needs
Vaccination campaigns
Solvay Solidarity Fund
Likely casesquarantine
First Quarter 2021 Earnings
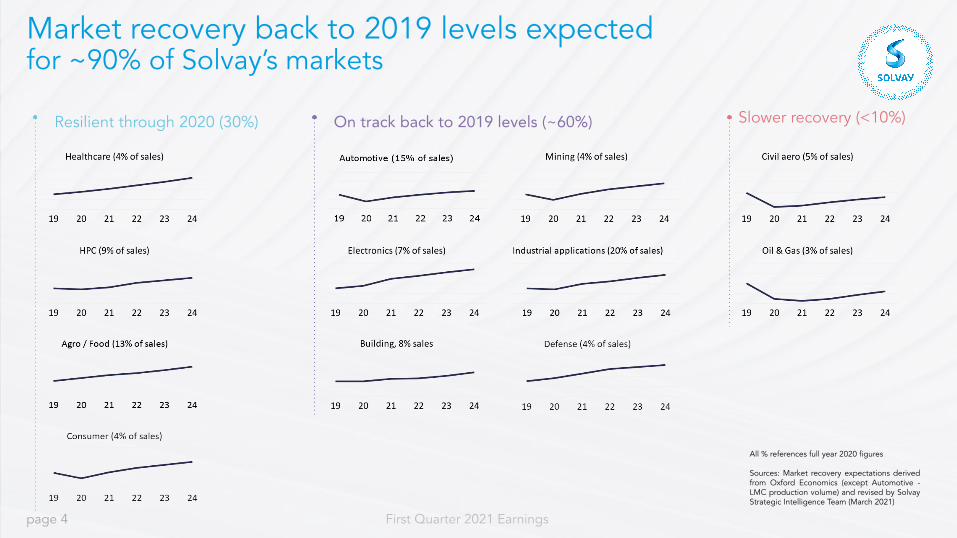
Market recovery back to 2019 levels expected for ~90% of Solvay’s markets
page 4
Resilient through 2020 (30%) On track back to 2019 levels (~60%) Slower recovery (<10%)
All % references full year 2020 figures Sources: Market recovery expectations derived from Oxford Economics (except Automotive - LMC production volume) and revised by Solvay Strategic Intelligence Team (March 2021)
First Quarter 2021 Earnings
Resilient portfolio up 2% organically yoy and 7% sequentiallyup 8.6% excl. composites, oil & gas
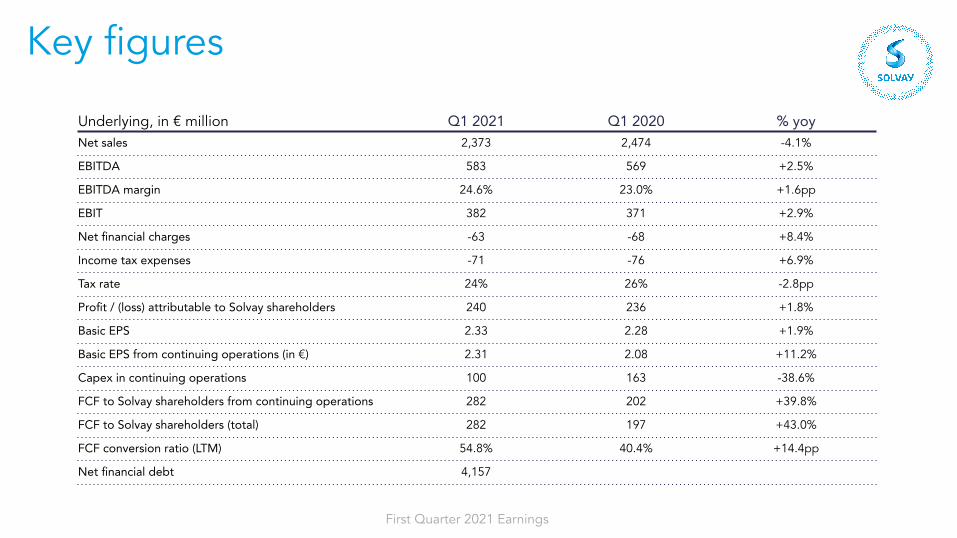
10% organic growth yoy 24.6% Record EBITDA margin
€2.4bn
NET SALES
€583m
UNDERLYING EBITDA
Q1 2021 PerformanceDouble-digit growth in EBITDA, CASH, and record margins
Disciplined working capitalStructural improvements~40% higher vs Q1 2020
€282m
FREE CASH FLOWcontinuing operations
page 5
Also… 7% higher EBITDA than Q1 2019 on comparable FX & scope basis despite 3% lower sales
First Quarter 2021 Earnings
Reinvest to prepare for the rebound
EV batteries Electronics
Automotive
Bio-based care
Healthcare Biosourced ingredients
page 6
First Quarter 2021 Earnings
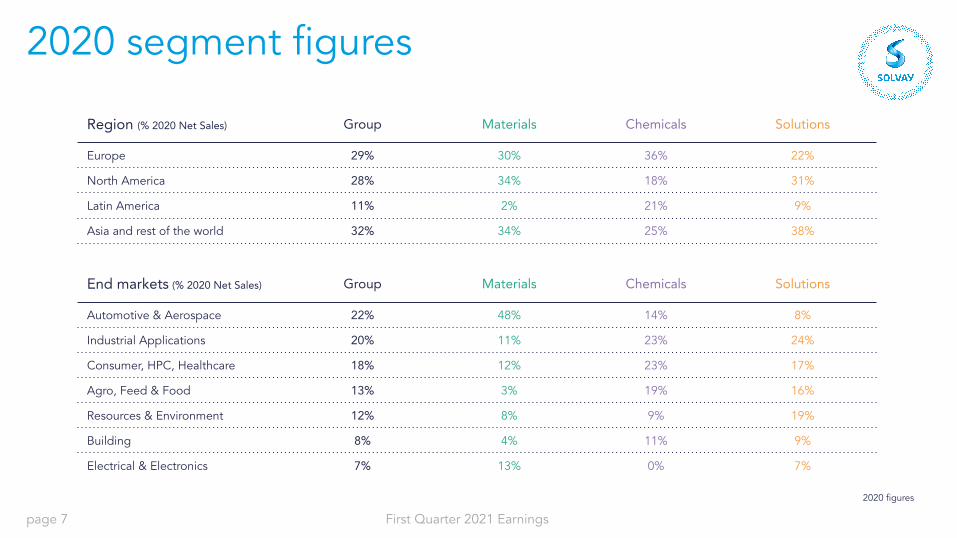
Region (% 2020 Net Sales) Group Materials Chemicals Solutions
Europe 29% 30% 36% 22%
North America 28% 34% 18% 31%
Latin America 11% 2% 21% 9%
Asia and rest of the world 32% 34% 25% 38%
2020 segment figures
page 7
End markets (% 2020 Net Sales) Group Materials Chemicals Solutions
Automotive & Aerospace 22% 48% 14% 8%
Industrial Applications 20% 11% 23% 24%
Consumer, HPC, Healthcare 18% 12% 23% 17%
Agro, Feed & Food 13% 3% 19% 16%
Resources & Environment 12% 8% 9% 19%
Building 8% 4% 11% 9%
Electrical & Electronics 7% 13% 0% 7%
2020 figures
First Quarter 2021 Earnings
Highlights• Volume growth driven by continued strong demand in automotive
and electronics
• 80% growth in batteries for hybrid and electric vehicles
• Headwinds remain in civil aero, yet sequentially improved vs Q4
• Cost savings initiatives especially in Composites support strong margins (+1pp)
page 8
Materials Q1 2021 performance
-8%
NET SALESy/y organic
-5%
EBITDAy/y organic
30%
EBITDAmargin
Net sales vs Q4’20 reported YoY reported YoY organic
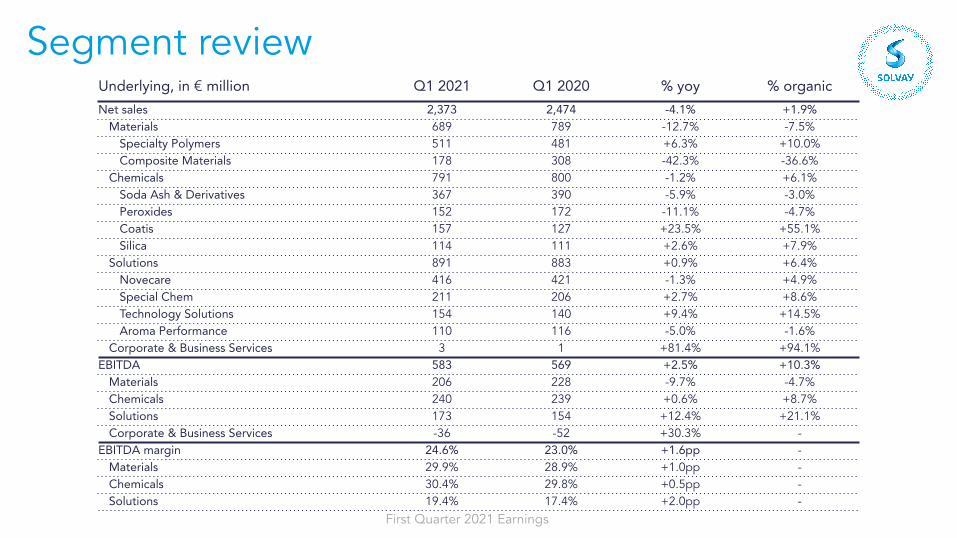
Specialty Polymers +12% +6.3% +10%
Composite Materials +8.6% -42.3% -36.6%
Materials +11.2% -12.7% -7.5%
First Quarter 2021 Earnings
Net sales vs Q4’20 reported YoY reported YoY organic
Soda Ash & Deriv. +2.2% -5.9% -3.0%
Peroxides -6.8% -11.1% -4.7%
Coatis +19.3% +23.5% +55.1%
Silica +3.7% +2.6% +7.9%
Chemicals +3.5% -1.2% +6.1%
Highlights• Growth driven by higher volumes across various markets
• Volume growth in soda ash for building offset partly by container glass softness and lower prices
• Strong growth continues in silica for tires due to market share gains
• Exceptional sales in Coatis with higher volumes and higher prices
• Favorable market conditions combined with lower fixed costs resulted in record EBITDA margin (+0.5pp)
page 9
ChemicalsQ1 2021 performance
+6%
NET SALESy/y organic
+9%
EBITDAy/y organic
30%
EBITDAmargin
First Quarter 2021 Earnings
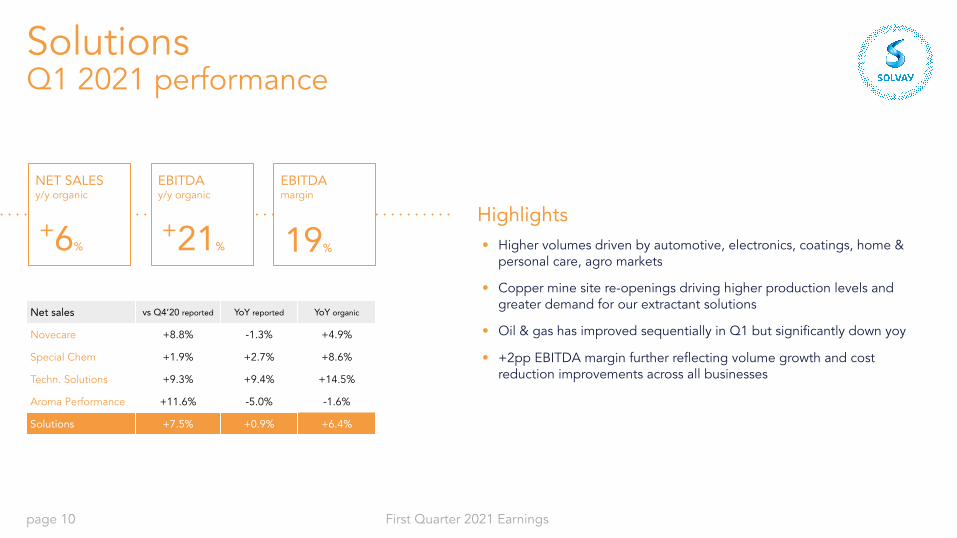
Net sales vs Q4’20 reported YoY reported YoY organic
Novecare +8.8% -1.3% +4.9%
Special Chem +1.9% +2.7% +8.6%
Techn. Solutions +9.3% +9.4% +14.5%
Aroma Performance +11.6% -5.0% -1.6%
Solutions +7.5% +0.9% +6.4%
Highlights• Higher volumes driven by automotive, electronics, coatings, home &
personal care, agro markets
• Copper mine site re-openings driving higher production levels and greater demand for our extractant solutions
• Oil & gas has improved sequentially in Q1 but significantly down yoy
• +2pp EBITDA margin further reflecting volume growth and cost reduction improvements across all businesses
page 10
SolutionsQ1 2021 performance
+6%
NET SALESy/y organic
+21%
EBITDAy/y organic
19%
EBITDAmargin
First Quarter 2021 Earningspage 11
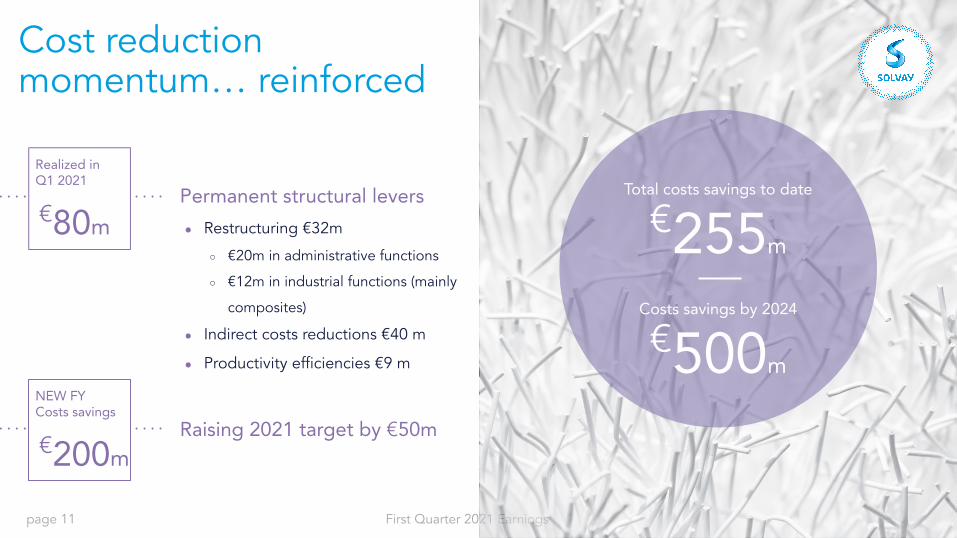
Cost reduction momentum… reinforced
Permanent structural levers
● Restructuring €32m
○ €20m in administrative functions
○ €12m in industrial functions (mainly
composites)
● Indirect costs reductions €40 m
● Productivity efficiencies €9 m
Raising 2021 target by €50m
€80m
Realized in Q1 2021 Total costs savings to date
€255m
Costs savings by 2024
€500m
€200m
NEW FY Costs savings
First Quarter 2021 Earnings
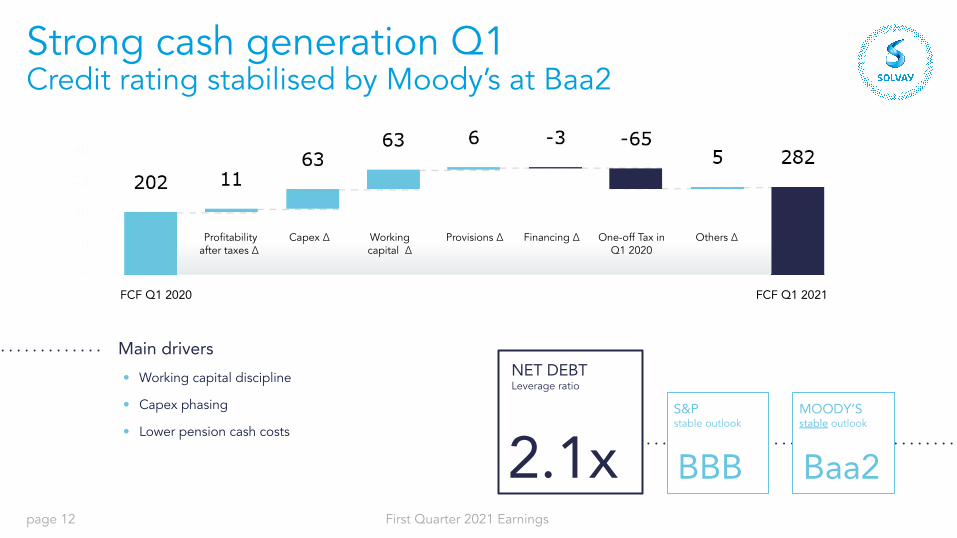
Main drivers
• Working capital discipline
• Capex phasing
• Lower pension cash costs
Strong cash generation Q1Credit rating stabilised by Moody’s at Baa2
page 12
BBB
S&Pstable outlook
Baa2
MOODY’Sstable outlook
2.1x
NET DEBTLeverage ratio
FCF Q1 2020
Profitability after taxes Δ
Capex Δ Working capital Δ
Others Δ
FCF Q1 2021
Provisions Δ Financing Δ One-off Tax in Q1 2020
First Quarter 2021 Earningspage 13
2021 outlook
€200m
COST savings
€650m
FREE CASH FLOW
€2.0bn -
€2.2bn
EBITDA in a range between
Barring additional deterioration related to a 3rd wave of Covid-19 in the second half;Reported 2019 FY EBITDA was 2.3bn, an estimate that is restated to 2.1bn on constant FX and scope
Potential to reach 2019 FY EBITDA level on a comparable FX and scope basis despite exposure to aero and oil & gas markets
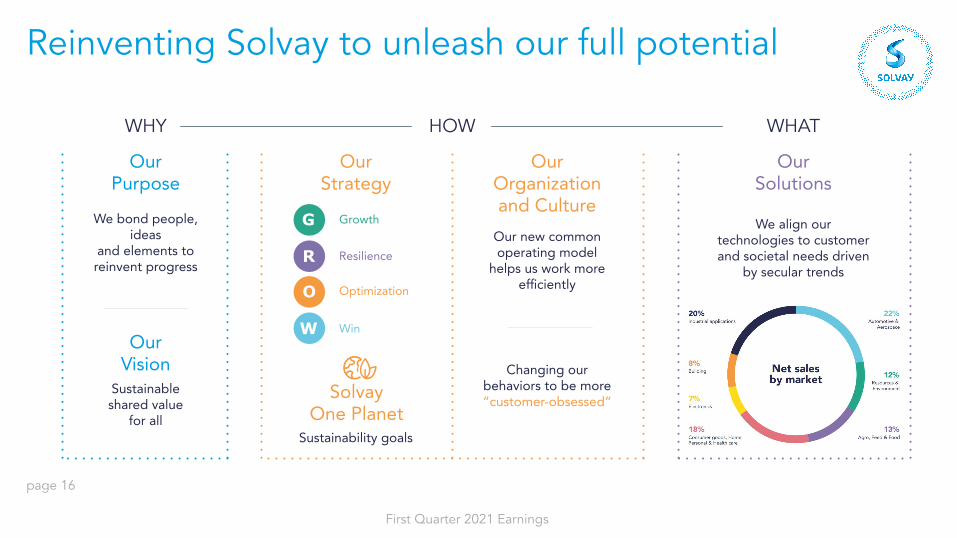
We align our technologies to customer and societal needs driven
by secular trends
Our Organization and Culture
Our new common operating model
helps us work more efficiently
Changing our behaviors to be more “customer-obsessed”
WHY
G
R
O
W
Growth
Resilience
Optimization
Win
First Quarter 2021 Earnings
2030 Solvay One Planet goals
page 17
10 ambitious objectives to reduce our global impact
1: SBTi: Science Based Targets initiative, 2: ReCiPe method for biodiversity impact assessment (under development), 3: Circular economy indicators have been adapted to align with the Circulytics® developed by the Ellen MacArthur Foundation, 4: Medical Treatment Accident Rate2018 baseline
First Quarter 2021 Earnings
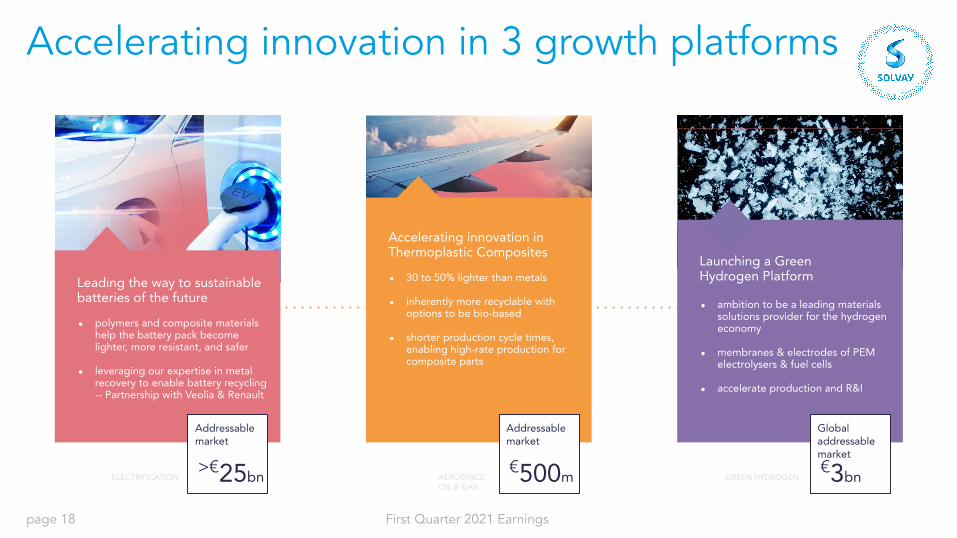
Accelerating innovation in 3 growth platforms
page 18
Leading the way to sustainable batteries of the future
● polymers and composite materials help the battery pack become lighter, more resistant, and safer
● leveraging our expertise in metal recovery to enable battery recycling -- Partnership with Veolia & Renault
Strengthening our balance sheetSignificant reduction in net debt and provisions
page 21
Provisions, end of 2020
Decreased by €1.2 billion in 2020 driven by:● the closing of the Polyamides sale (€1.3 billion proceeds)● the voluntary pension contributions of €0.6 billion● A record free cash flow
Leverage ratio at 2.2x versus 2.0x at the end of 2019
Provisions decreased by €623 million mainly due to: ● €552 million voluntary pension contributions, in addition to the
€114m contributions made in December 2019
First Quarter 2021 Earningspage 22
Balanced maturitiesDeleveraging and reduced of cost of debt
Financial debt [1] in million € and $
Period December 31, 2020 March 31, 2021 Variation over the periodFace value Avg. maturity Avg. cost Face value Avg. maturity Avg. cost Face value Avg. maturity Avg. cost
Capex ● up to €750 million (vs €611 million in 2020)
Total Working capital * ● Additional structural improvement of ~€50m (vs ~€140 in 2020)
Pensions ● Cash-out: ~€80 million (vs €125 million in 2020)
Underlying net financial charges ● P&L: ~ €230 million (vs €270 million in 2020)● Cash: Interest paid (incl. hybrid coupons): ~ €190 million (vs €222 million in 2020)
* TWC = Inventories + Trade A/R + Other Current Receivables – Trade A/P - Other Current Liabilities
First Quarter 2021 Earningspage 24
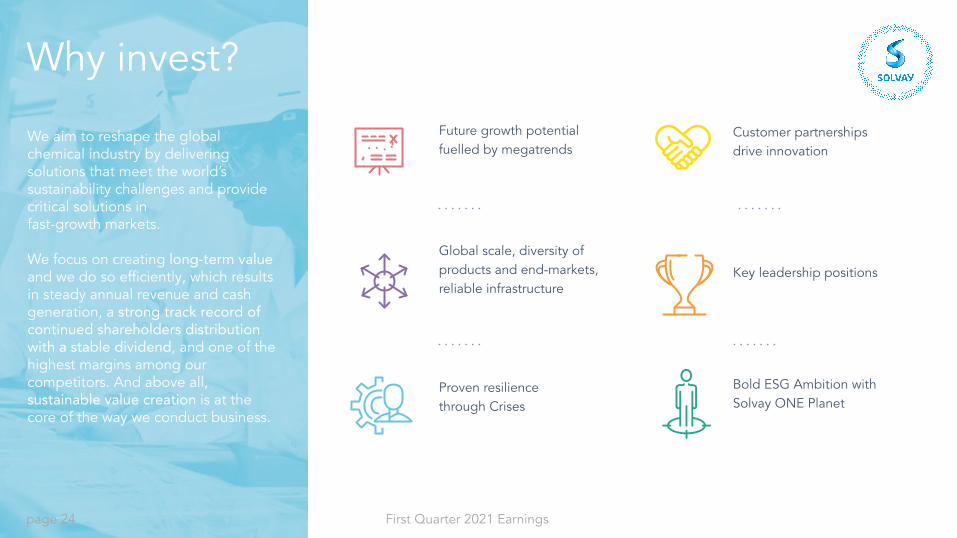
Why invest?
Future growth potential fuelled by megatrends
Global scale, diversity of products and end-markets, reliable infrastructure
Proven resilience through Crises
Bold ESG Ambition with Solvay ONE Planet
Customer partnerships drive innovation
Key leadership positions
We aim to reshape the global chemical industry by delivering solutions that meet the world’s sustainability challenges and provide critical solutions in fast-growth markets.
We focus on creating long-term value and we do so efficiently, which results in steady annual revenue and cash generation, a strong track record of continued shareholders distribution with a stable dividend, and one of the highest margins among our competitors. And above all, sustainable value creation is at the core of the way we conduct business.