55
Q3 and January-September 2018 Results Bodo Uebber Member of the Board of Management Finance & Controlling and Daimler Financial Services October 25, 2018
| Date post: | 09-Mar-2019 |
| Category: |
Documents |
| Upload: | hoangnguyet |
| View: | 213 times |
| Download: | 0 times |

Q3 and January-September 2018 Results
Bodo Uebber
Member of the Board of Management
Finance & Controlling and Daimler Financial Services
October 25, 2018

Daimler AG
Contents
Q3 and January-September 2018 Results / October 25, 2018 / Page 2
Results for Q3 2018
Outlook for 2018
Development at the divisions

Daimler AG
Highlights of Q3 2018
Q3 and January-September 2018 Results / October 25, 2018 / Page 3
World premiere of the new Mercedes-Benz Actros with Active
Drive Assist
Mercedes-Benz Vans opens new Sprinter plant in South Carolina
for the North American market
Presentation of the new A-Class sedan, B-Class and GLE
Unit sales– in thousands of units –
Q3 2017 Q3 2018
824 795
-4%
Net profit– in billions of euros –
Q3 2017 Q3 2018
2.2*
1.8
-21%
Revenue– in billions of euros –
Q3 2017 Q3 2018
40.7* 40.2
-1%
EBIT– in billions of euros –
Q3 2017 Q3 2018
3.4*
2.5
-27%
Board of Management and Supervisory Board of Daimler AG
approve new divisional structure of the Group
Daimler Financial Services is set to become a partner and
investor in used-vehicle platform heycar
* adjusted based on new IFRS 15 standards including cost of hedging (IFRS 9)
** electricity consumption combined: 22.2 kWh/100 km; CO2 emissions combined: 0 g/km, preliminary figures (for further information see page 13)
Presentation of Mercedes-Benz eActros and eCitaro, FUSO
eCanter, E-FUSO Vision One, Thomas Built Buses Jouley at the IAA
World premiere of the new, fully-electric EQC**

Daimler AG
Support of the German federal government’s concept for
cleaner air
Q3 and January-September 2018 Results / October 25, 2018 / Page 4
Mercedes-Benz offers an exchange premium for diesel vehicles up to €10,000 in 14 priority regions in Germany
The trade-in program will be supplemented by attractive financing and leasing offers
The package of measures builds on the existing plan to strengthen the future of the Diesel engine that has been in effect since July 2017
The measures further improve air quality while ensuring that car drivers retain their individual mobility
Daimler will also participate in a federal government’s hardware retrofit program of which the exact specifications are still to be clarified

Daimler AG
High level of net liquidity
Q3 and January-September 2018 Results / October 25, 2018 / Page 5
Free cash flow industrial business
January-September 2018: minus €0.1 billion
Net industrial
liquidity
12/31/2017
Earnings and
other cash flow
impact
Working capital
impact
Other(mainly FX effects)
Net industrial
liquidity
9/30/2018
-3.1
13.5+0.9
16.6
+3.0
+0.0
M&A effects
-3.9
Dividend payment
Daimler AG
- in billions of euros -
Daimler AG
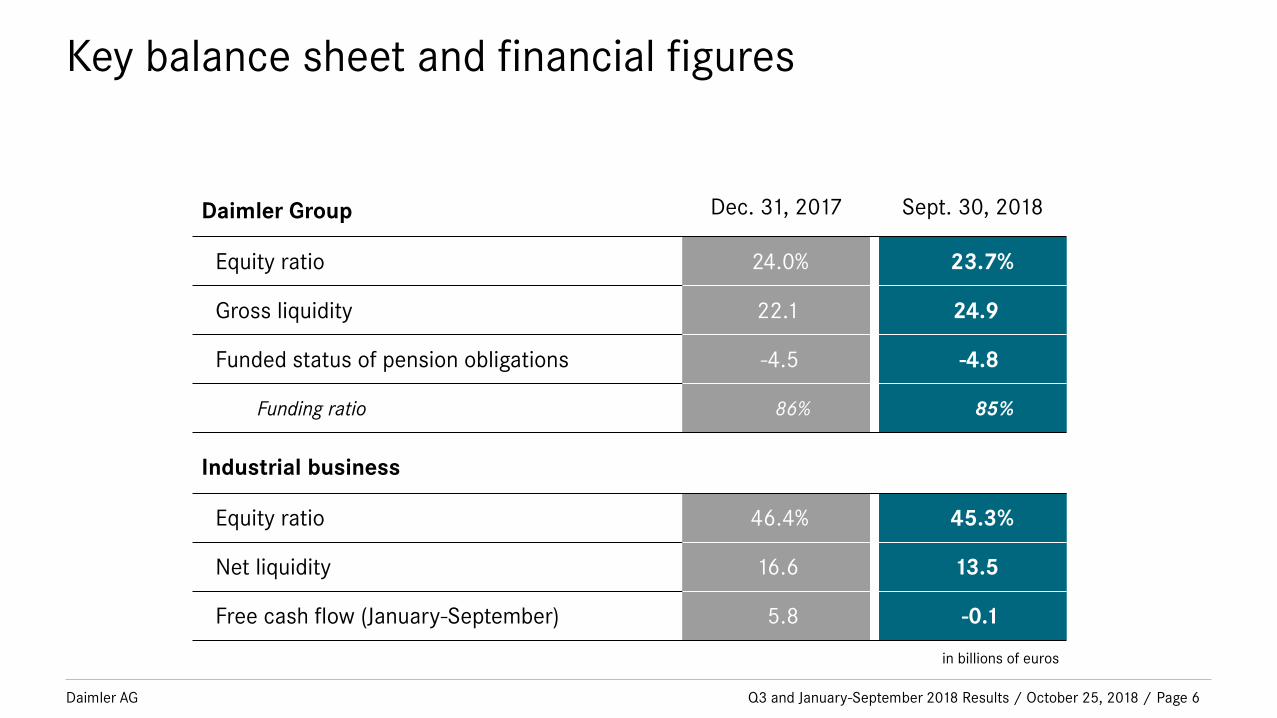
Key balance sheet and financial figures
Q3 and January-September 2018 Results / October 25, 2018 / Page 6
Daimler Group Dec. 31, 2017 Sept. 30, 2018
Equity ratio 24.0% 23.7%
Gross liquidity 22.1 24.9
Funded status of pension obligations -4.5 -4.8
Funding ratio 86% 85%
Industrial business
Equity ratio 46.4% 45.3%
Net liquidity 16.6 13.5
Free cash flow (January-September) 5.8 -0.1
in billions of euros

Daimler AG
Financial flexibility over a 12-month period
Q3 and January-September 2018 Results / October 25, 2018 / Page 7
The financial flexibility provides support to mitigate risk and volatility
through a balanced mix of funding instruments and clear principles
Daimler follows a financial management to safeguard our A-rating
and thus our attractive refinancing conditions
Available or short-term accessible liquidity is higher than the total
maturities over the next 12 months
A high financial flexibility is a key support to our A-Rating
The current liquidity position reflects the volatile market
environment, the currently required high investments for our future
business model and the required financial flexibility for our businessAvailable oraccessible
liquidity
55.2
47.1
Maturitiesover next
12 months
Other
Bank loans
Bonds
Accountdeposits
Commercialpaper
- in billions of euros -
Creditfacility
LiquidityFinancialServices
Liquidityindustrialbusiness
ABSpotential

Daimler AG
Units sales by division
Q3 and January-September 2018 Results / October 25, 2018 / Page 8
Q3 2017 Q3 2018 % change
Daimler Group 824.1 794.7 -4
of which
Mercedes-Benz Cars 597.3 559.5 -6
Daimler Trucks 126.6 136.1 +8
Mercedes-Benz Vans 93.1 91.4 -2
Daimler Buses 7.2 7.7 +7
in thousands of units

Daimler AG
Revenue by division
Q3 and January-September 2018 Results / October 25, 2018 / Page 9
Q3 2017* Q3 2018 % change
Daimler Group 40.7 40.2 -1
of which
Mercedes-Benz Cars 23.4 21.7 -7
Daimler Trucks 9.2 10.0 +9
Mercedes-Benz Vans 3.1 3.0 -2
Daimler Buses 1.0 1.1 +3
Daimler Financial Services 5.8 6.3 +7
Contract volume of Daimler Financial Services** 139.9 148.8 +6
in billions of euros
* adjusted based on new IFRS 15 standards including cost of hedging (IFRS 9)
** figures as of December 31, 2017 and September 30, 2018

Daimler AG
Revenue by region
Q3 and January-September 2018 Results / October 25, 2018 / Page 10
Q3 2017* Q3 2018 % change
Daimler Group 40.7 40.2 -1
of which
Europe 16.7 16.2 -3
of which Germany 5.8 5.9 +2
NAFTA 11.5 11.7 +2
of which United States 9.9 10.1 +2
Asia 9.9 9.7 -2
of which China** 4.6 4.7 +3
Other markets 2.6 2.6 +1
in billions of euros* adjusted based on new IFRS 15 standards including cost of hedging (IFRS 9)
** excluding revenue of not fully consolidated companies

Daimler AG
EBIT by division
Q3 and January-September 2018 Results / October 25, 2018 / Page 11
Q3 2017* Q3 2018
- EBIT in millions of euros; RoS/RoE in % - EBIT RoS/RoE** EBIT RoS/RoE**
Daimler Group 3,409 8.3 2,488 6.2
of which
Mercedes-Benz Cars 2,105 9.0 1,372 6.3
Daimler Trucks 614 6.7 850 8.5
Mercedes-Benz Vans 214 6.9 -93 -3.1
Daimler Buses 32 3.1 30 2.8
Daimler Financial Services 508 18.5 392 12.5
Reconciliation -64 – -63 –
* adjusted based on new IFRS 15 standards including cost of hedging (IFRS 9)
** Return on sales for automotive business, return on equity for Daimler Financial Services; Daimler Group excluding Daimler Financial Services

Daimler AG
Group EBIT in Q3 2018
Q3 and January-September 2018 Results / October 25, 2018 / Page 12
- in millions of euros -
-4302,488
+1
3,409*
-274
-810
• Cars -942• Trucks +149• Vans -27• Buses +10
• Cars -237• Trucks -31• Vans -6• Buses 0 • Cars -191
• Trucks +49• Vans -275• Buses -13
+708
Actual
Q3 2017
Volume/
Structure/
Net pricing
Foreign
exchange
rates
Other cost
changes
Actual
Q3 2018
ReconciliationFinancial
Services
-116
Disclosed
items
* adjusted based on new IFRS 15 standards including cost of hedging (IFRS 9)
** in Q3 2017
• Cars:RemeasurementAston Martin +185
Specific vehicle recall** +230
Voluntary service activities** +223
• Trucks:Fixed costoptimization** +70

Daimler AG
Mercedes-Benz Cars: product highlightsWorld premiere of the new fully-electric EQC*
Q3 and January-September 2018 Results / October 25, 2018 / Page 13
* electricity consumption combined: 22.2 kWh/100 km; CO2 emissions combined: 0 g/km, preliminary figures (figures on electricity consumption and CO2 emissions are preliminary
and calculated by Technical Service. Figures on range are likewise preliminary. EC type approval and conformity certification with official figures are not yet available. The official
figures may vary from those stated.)

Daimler AG
Mercedes-Benz Cars: product highlightsPresentation of the Mercedes-Benz A-Class Sedan
Q3 and January-September 2018 Results / October 25, 2018 / Page 14

Daimler AG
Mercedes-Benz Cars: product highlights
Q3 and January-September 2018 Results / October 25, 2018 / Page 15
Presentation of the new Mercedes-AMG A 35 4MATIC*
* combined fuel consumption: 7.4-7.3 l/100 km; combined CO2 emissions: 169-167 g/km

Daimler AG
Mercedes-Benz Cars: product highlightsWorld premiere of the new Mercedes-Benz B-Class
Q3 and January-September 2018 Results / October 25, 2018 / Page 16

Daimler AG
Mercedes-Benz Cars: product highlights
Q3 and January-September 2018 Results / October 25, 2018 / Page 17
The new Mercedes-AMG C 63 family is available to order*
* combined fuel consumption: 10.4-9.9 l/100 km; combined CO2 emissions: 236-227 g/km

Daimler AG
Mercedes-Benz Cars: product highlightsSales launch of the new Mercedes-AMG GT 4-door Coupé
Q3 and January-September 2018 Results / October 25, 2018 / Page 18

Daimler AG
Mercedes-Benz Cars: product highlightsPresentation of the new Mercedes-Benz GLE
Q3 and January-September 2018 Results / October 25, 2018 / Page 19

Daimler AG
Daimler Trucks: product highlights
Q3 and January-September 2018 Results / October 25, 2018 / Page 20
World premiere of the new Mercedes-Benz Actros with Active Drive Assist
and MirrorCam

Daimler AG
Daimler Trucks: product highlights
Q3 and January-September 2018 Results / October 25, 2018 / Page 21
Start of practical trials for the all-electric heavy-duty eActros truck

Daimler AG
Daimler Trucks: product highlights
Q3 and January-September 2018 Results / October 25, 2018 / Page 22
The all-electric FUSO eCanter and the E-FUSO Vision One were presented
at the IAA in Hanover

Daimler AG
Mercedes-Benz Vans: product highlightsPresentation of the Concept Sprinter F-CELL
Q3 and January-September 2018 Results / October 25, 2018 / Page 23

Daimler AG
Mercedes-Benz Vans: product highlightsThe new Sprinter for the North American market will be produced in South Carolina
Q3 and January-September 2018 Results / October 25, 2018 / Page 24

Daimler AG
Mercedes-Benz Vans: product highlightsPresentation of the Vision URBANETIC mobility concept
Q3 and January-September 2018 Results / October 25, 2018 / Page 25

Daimler AG
Daimler Buses: product highlights
Q3 and January-September 2018 Results / October 25, 2018 / Page 26
The new Mercedes-Benz Tourismo won the IBC competition 2018 and the
Mercedes Benz Citaro hybrid is “Bus of the Year 2019”

Daimler AG
Daimler Buses: product highlights
Q3 and January-September 2018 Results / October 25, 2018 / Page 27
World premiere of the all-electric Mercedes-Benz eCitaro
Daimler AG
Daimler Financial Services: product highlightscar2go opened its tenth North American location in Chicago
Q3 and January-September 2018 Results / October 25, 2018 / Page 28

Daimler AG
Daimler Financial Services: highlights Mobility ServicesOngoing business expansion
Q3 and January-September 2018 Results / October 25, 2018 / Page 29
Customers in millions
Cities
Combined
change*
+64%
+63%
3.4
25
5.7
19**
YTD 09/18
Interactions in millions
+60% 18.4 20.4
* car2go, moovel and Ride-Hailing Group (incl. mytaxi, Beat since 02/17, Clever Taxi since 06/17 and Chauffeur Privé since 03/18) combined, 09/18 (YTD) vs. 09/17 (YTD)
** Number of cities with ticketing capability of public transit
16.9
>110
87.9
Ride-Hailing Group

Daimler AG
Contents
Q3 and January-September 2018 Results / October 25, 2018 / Page 30
Results for Q3 2018
Outlook for 2018
Development at the divisions

Daimler AG
Mercedes-Benz Cars and Vans: continued product offensive
Q3 and January-September 2018 Results / October 25, 2018 / Page 31
2018 2019
X-Class Sprinter eVito
GLC F-CELLG-Class (upgraded) GLE GLSGLC & GLC Coupe (upgraded)
S-Class Coupe & Cabriolet (upgraded)
AMG 4-door Coupe
Mercedes-MaybachS-Class Pullman (upgraded)
CLS
C-Class Sedan, Wagon, Coupe, Cabriolet (upgraded)
A-ClassA-Class Sedan &
Sedan (long wheelbase) B-Class CLA 4-door Coupe CLA Shooting Brake
smart (upgraded)
C-Class Sedan (long wheelbase, upgraded)
V-Class eSprinter
8th Compact CarEQC

Daimler AG
Assumptions for automotive markets in 2018
Q3 and January-September 2018 Results / October 25, 2018 / Page 32
* including light-duty trucks
Car markets
Global
Europe
Medium- and
heavy-duty truck
markets
NAFTA region
EU30
Japan*
Brazil
EU30
Bus marketsEU30
Brazil
USA
Van markets
Indonesia*
China
USA
around +2%
significant growth
slight growth
slight growth
slight decrease
significant growth from low level
slight growth
slight growth
significant growth
slight growth
around the prior-year level
positive development
slight growth

Daimler AG
2018 sales outlook
Q3 and January-September 2018 Results / October 25, 2018 / Page 33
Mercedes-Benz Cars
Daimler Trucks
Mercedes-Benz Vans
Daimler Buses
Slightly higher unit sales
Further growth particularly in China
Strong momentum from the wide range of attractive and innovative vehicles
Significantly higher unit sales
Significant growth in NAFTA region, Brazil, Indonesia and India; slight growth in Japan
Slight decrease in EU30 region
Significantly higher unit sales
Significant growth in EU30 region, China and the United States
Additional momentum from new X-Class and new Sprinter
Significantly higher unit salesMaintain market leadership in core marketsSignificant sales increase in EU30 region and further growth in Latin America
Unit sales around the prior-year levelSupported by wide range of attractive and innovative vehiclesFurther growth in China
Significantly higher unit salesSignificant growth in NAFTA region, Brazil, Indonesia and IndiaSlight growth in EU30 region; unit sales around the prior-year level in Japan
Significantly higher unit sales Slight growth in EU30 region, significant growth in China and the United StatesGrowth momentum from new X-Class and new Sprinter

Daimler AG
2018 outlook for EBIT
Q3 and January-September 2018 Results / October 25, 2018 / Page 34
Significantly below the prior-year level
Significantly below the prior-year level
Significantly below the prior-year level
Significantly above the prior-year level
In the prior-year magnitude*
We expect Group EBIT for FY 2018 to be significantly below the prior-
year level based on the following expectations for divisional EBIT:
Mercedes-Benz Cars
Daimler Trucks
Mercedes-Benz Vans
Daimler Buses
Daimler Financial Services
* subject to the completion of the mobility services transaction of Daimler and BMW Group in 2018

Daimler AG
Contents
Q3 and January-September 2018 Results / October 25, 2018 / Page 35
Results for Q3 2018
Outlook for 2018
Development at the divisions

Daimler AG Q3 and January-September 2018 Results / October 25, 2018 / Page 36
Mercedes-Benz Cars
Unit sales – in thousands of units –
Q3 2017 Q3 2018
Revenue– in billions of euros –
EBIT– in millions of euros –
597560
Q3 2017 Q3 2018
23.4*21.7
Q3 2017 Q3 2018
2,105*
1,372
-6% -7% -35%
* adjusted based on new IFRS 15 standards including cost of hedging (IFRS 9)

Daimler AG
Mercedes-Benz Cars: EBIT
Q3 and January-September 2018 Results / October 25, 2018 / Page 37
- in millions of euros -
* adjusted based on new IFRS 15 standards including cost of hedging (IFRS 9)
** Return on sales
EBIT
Q3 2017
EBIT
Q3 2018
2,105*
1,372
- 733
9.0%**
6.3%**
Remeasurement of the investment in Aston Martin
Expenses for a specific vehicle recall in Q3 2017
Expenses for voluntary service activities in connection with a comprehensive plan for diesel engines in Q3 2017
Lower unit sales
Temporarily weaker net pricing
Foreign exchange rates
Higher expenses for new technologies and future products
Governmental proceedings and measures relating to diesel vehicles
Risk provision relating to the previously used refrigerant R134a

Daimler AG Q3 and January-September 2018 Results / October 25, 2018 / Page 38
Mercedes-Benz Cars: sales decrease due to delivery delays
and model changes of A- and C-Class- in thousands of units -
Q3 2017
597560
Q3 2018
102
111
99
17
4
105
127
99
18
6 smart
E-Class
C-Class
A-/B-Class
S-Class
Sports Cars31
30
SUVs211
195

Daimler AG Q3 and January-September 2018 Results / October 25, 2018 / Page 39
Mercedes-Benz Cars: globally balanced sales structure with
strong development especially in China- in thousands of units -
Q3 2017
597560
Q3 2018
170
76
72
151
153
82
83
170
Rest of world
Germany
United States
China
Europeexcl. Germany
10991

Daimler AG Q3 and January-September 2018 Results / October 25, 2018 / Page 40
Mercedes-Benz Cars in China: continued strong sales growth
with higher share of locally produced vehicles- in thousands of units -
239
293
400
488516
locally produced
imported
2018
YTD 09
201520142013 2016
123
116
147
146
150
250
171
317
146
371
619
2017
196
423

Daimler AG Q3 and January-September 2018 Results / October 25, 2018 / Page 41
Daimler Trucks
Unit sales – in thousands of units –
Q3 2017 Q3 2018
Revenue– in billions of euros –
EBIT– in millions of euros –
127136
Q3 2017 Q3 2018
9.2*10.0
Q3 2017 Q3 2018
614*
850
+38%+8% +9%
* adjusted based on new IFRS 15 standards including cost of hedging (IFRS 9)

Daimler AG
Daimler Trucks: EBIT
Q3 and January-September 2018 Results / October 25, 2018 / Page 42
- in millions of euros -
EBIT
Q3 2017
EBIT
Q3 2018
614*
850
+ 236
6.7%**
8.5%**Higher unit sales especially in the NAFTA region
Efficiency enhancements
Expenses for fixed cost optimization in Q3 2017
Higher expenses for raw material
Higher costs, mainly related to supply chain
constraints
* adjusted based on new IFRS 15 standards including cost of hedging (IFRS 9)
** Return on sales

Daimler AG Q3 and January-September 2018 Results / October 25, 2018 / Page 43
Daimler Trucks: sales increase by 8% mainly driven by NAFTA
region- in thousands of units -
* European Union, Switzerland and Norway
Q3 2017
127136
Q3 2018
22
53
10
42
21
45
8
40
Rest of world
Latin America
NAFTA region
EU30*
Asia
13
9

Daimler AG Q3 and January-September 2018 Results / October 25, 2018 / Page 44
Daimler Trucks: significant increase in incoming orders
mainly driven by NAFTA region
* European Union, Switzerland and Norway
- in thousands of units -
Q3 2017
117
129
Q3 2018
18
51
9
40
19
35
8
43
Rest of world
Latin America
NAFTA region
EU30*
Asia
12
11

Daimler AG Q3 and January-September 2018 Results / October 25, 2018 / Page 45
Mercedes-Benz Vans
Unit sales – in thousands of units –
Q3 2017 Q3 2018
Revenue– in billions of euros –
EBIT– in millions of euros –
93.1 91.4
Q3 2017 Q3 2018
3.1* 3.0
Q3 2017 Q3 2018
214*
-93
-2% -2%
* adjusted based on new IFRS 15 standards including cost of hedging (IFRS 9)

Daimler AG
Mercedes-Benz Vans: EBIT
Q3 and January-September 2018 Results / October 25, 2018 / Page 46
- in millions of euros -
EBIT
Q3 2017
EBIT
Q3 2018
214*
-93
- 307
6.9%**
-3.1%**
Lower unit sales caused by delivery delays
Governmental proceedings and measures relating
to diesel vehicles
Higher expenses for new technologies and future products
Impacts from the Sprinter model change
* adjusted based on new IFRS 15 standards including cost of hedging (IFRS 9)
** Return on sales

Daimler AG Q3 and January-September 2018 Results / October 25, 2018 / Page 47
Mercedes-Benz Vans: sales decrease by 2% mainly due to
temporary delivery delays- in thousands of units -
Q3 2017
93.1 91.4
Q3 2018
5.7
13.3
20.7
49.3
6.2
14.6
26.0
46.2
Vito
V-Class
Citan
Sprinter
X-Class2.5

Daimler AG Q3 and January-September 2018 Results / October 25, 2018 / Page 48
Daimler Buses
Unit sales – in thousands of units –
Q3 2017 Q3 2018
Revenue– in billions of euros –
EBIT– in millions of euros –
7.27.7
Q3 2017 Q3 2018
1.0* 1.1
Q3 2017 Q3 2018
32*30
+7% +3% -6%
* adjusted based on new IFRS 15 standards including cost of hedging (IFRS 9)

Daimler AG
Daimler Buses: EBIT
Q3 and January-September 2018 Results / October 25, 2018 / Page 49
- in millions of euros -
EBIT
Q3 2017
EBIT
Q3 2018
32* 30
- 2
3.1%**2.8%**
Efficiency enhancements
Product mix
Inflation-related cost increases
* adjusted based on new IFRS 15 standards including cost of hedging (IFRS 9)
** Return on sales

Daimler AG Q3 and January-September 2018 Results / October 25, 2018 / Page 50
Daimler Buses: higher unit sales in Brazil and India
- in thousands of units -
Q3 2017
7.27.7
Q3 2018
2.1
0.9
2.3
1.2
1.9
0.8
2.1
1.6
Rest of world
Brazil
Mexico
EU30*
Latin America(excl. Brazil and Mexico)
0.81.3
* European Union, Switzerland and Norway

Daimler AG Q3 and January-September 2018 Results / October 25, 2018 / Page 51
Daimler Financial Services
New business – in billions of euros –
Q3 2017 Q3 2018
Contract volume– in billions of euros –
EBIT– in millions of euros –
17.4 16.6
12/31/2017 9/30/2018
139.9148.8
Q3 2017 Q3 2018
508
392
-5% +6% -23%

Daimler AG
Daimler Financial Services: EBIT
Q3 and January-September 2018 Results / October 25, 2018 / Page 52
- in millions of euros -
* Return on equity
EBIT
Q3 2017
EBIT
Q3 2018
508
392
- 116
18.5%*
12.5%*Higher contract volume
Higher interest-rate level
Cost of risk situation in Turkey

Daimler AG Q3 and January-September 2018 Results / October 25, 2018 / Page 53
Daimler Financial Services: further increase in contract
volume to 148.8 billion euros- in billions of euros -
12/31/2017
139.9148.8
9/30/2018
25.6
37.2
53.6
32.4
24.1
35.6
50.7
29.4
Americas
Europe (excl. Germany)
Germany
Africa & Asia-Pacific

Daimler AG Q3 and January-September 2018 Results / October 25, 2018 / Page 54
Daimler Financial Services: net credit losses* at low level
due to disciplined risk approach
* as a percentage of portfolio, subject to credit risk
0.69% 0.68%
0.50%
0.61%
0.36%
0.51%
0.89%0.83%
0.43%
0.34% 0.37%0.31%
0.24%0.31%
0.26%0.20%
2003 2004 2005 2006 2007 2008 2009 2010 2011 2012 2013 2014 2018
YTD
2015 2016 2017

Daimler AG
Disclaimer
Q3 and January-September 2018 Results / October 25, 2018 / Page 55
This document contains forward-looking statements that reflect our current views about future events. The words “anticipate,” “assume,” “believe,”
“estimate,” “expect,” “intend,” “may,” ”can,” “could,” “plan,” “project,” “should” and similar expressions are used to identify forward-looking statements.
These statements are subject to many risks and uncertainties, including an adverse development of global economic conditions, in particular a decline of
demand in our most important markets; a deterioration of our refinancing possibilities on the credit and financial markets; events of force majeure
including natural disasters, acts of terrorism, political unrest, armed conflicts, industrial accidents and their effects on our sales, purchasing, production
or financial services activities; changes in currency exchange rates and tariff regulations; a shift in consumer preferences towards smaller, lower-margin
vehicles; a possible lack of acceptance of our products or services which limits our ability to achieve prices and adequately utilize our production
capacities; price increases for fuel or raw materials; disruption of production due to shortages of materials, labor strikes or supplier insolvencies; a
decline in resale prices of used vehicles; the effective implementation of cost-reduction and efficiency-optimization measures; the business outlook for
companies in which we hold a significant equity interest; the successful implementation of strategic cooperations and joint ventures; changes in laws,
regulations and government policies, particularly those relating to vehicle emissions, fuel economy and safety; the resolution of pending government
investigations or of investigations requested by governments and the conclusion of pending or threatened future legal proceedings; and other risks and
uncertainties, some of which we describe under the heading “Risk and Opportunity Report” in the current Annual Report. If any of these risks and
uncertainties materializes or if the assumptions underlying any of our forward-looking statements prove to be incorrect, the actual results may be
materially different from those we express or imply by such statements. We do not intend or assume any obligation to update these forward-looking
statements since they are based solely on the circumstances at the date of publication.


