30
August 5, 2021 Heiwa Corporation Results for the 1st Quarter of Fiscal Year Ending March 31, 2022 Securities Code : 6412
August 5, 2021Heiwa Corporation
Results for the 1st Quarter of Fiscal Year Ending March 31, 2022
Securities Code : 6412
Copyright Heiwa Corporation 2021
Contents
2
【Market Environment】・Pachinko and Pachislot Machine Business・Golf Business
【Pachinko and Pachislot Machine Business】・Regulations on Pachinko and Pachislot Machines・Number of Machines Sold
【Golf Business】・Trends of Golf Course Users and Revenue per Customer 1・Trends of Golf Course Users and Revenue per Customer 2・Golf Course Portfolio
【Consolidated Results】・Financial Performance Trend・Key Financial Indicators
■ Overview ・・・ 3
■ Results for the 1st Quarter of FY ending March 31, 2022 ・・・ 4
■ Full-year Plan for FY ending March 31, 2022 ・・・13
Supplementary Information
Copyright Heiwa Corporation 2021
Overview
3
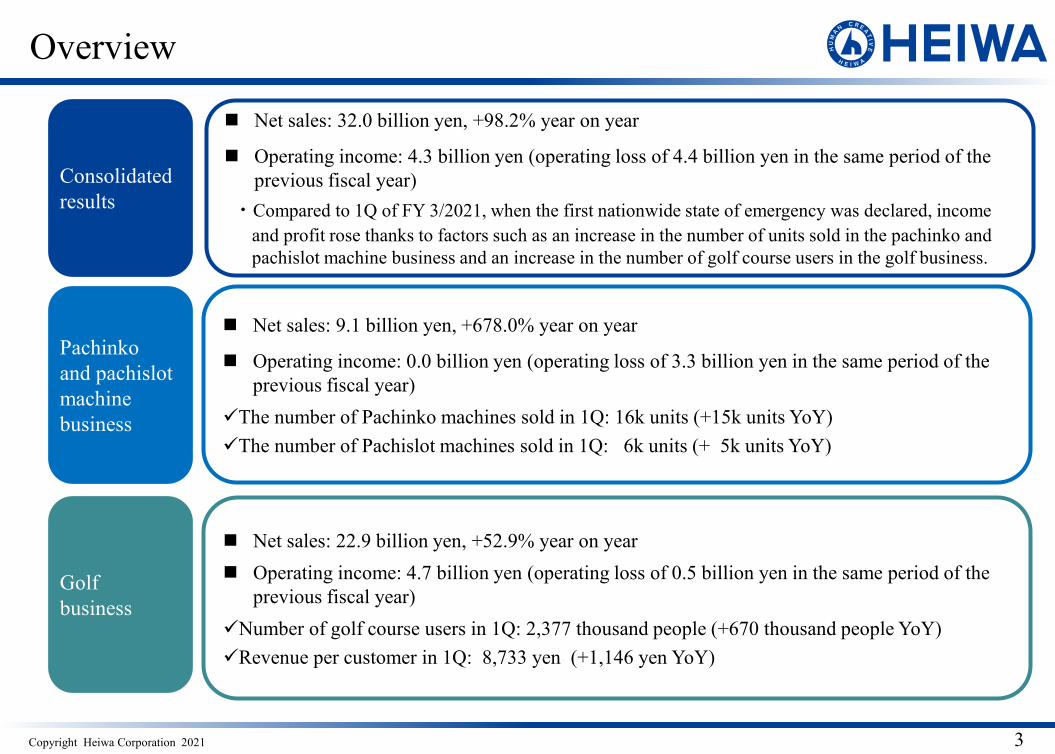
Net sales: 32.0 billion yen, +98.2% year on year
Operating income: 4.3 billion yen (operating loss of 4.4 billion yen in the same period of the previous fiscal year)
・Compared to 1Q of FY 3/2021, when the first nationwide state of emergency was declared, income and profit rose thanks to factors such as an increase in the number of units sold in the pachinko and pachislot machine business and an increase in the number of golf course users in the golf business.
Net sales: 9.1 billion yen, +678.0% year on year
Operating income: 0.0 billion yen (operating loss of 3.3 billion yen in the same period of the previous fiscal year)
The number of Pachinko machines sold in 1Q: 16k units (+15k units YoY)The number of Pachislot machines sold in 1Q: 6k units (+ 5k units YoY)
Net sales: 22.9 billion yen, +52.9% year on year Operating income: 4.7 billion yen (operating loss of 0.5 billion yen in the same period of the
previous fiscal year)Number of golf course users in 1Q: 2,377 thousand people (+670 thousand people YoY)Revenue per customer in 1Q: 8,733 yen (+1,146 yen YoY)
Consolidatedresults
Pachinko and pachislot machine business
Golf business
Results for the 1st Quarter ofFY ending March 31, 2022
Copyright Heiwa Corporation 2021 5
1st Quarter Results
15,001
22,934
637
2,683
479
6,378
16,173
32,051
0
5,000
10,000
15,000
20,000
25,000
30,000
35,000
FY 3/21 1Q FY 3/22 1Q
-4,415
Consolidated Statements of Income (Results)
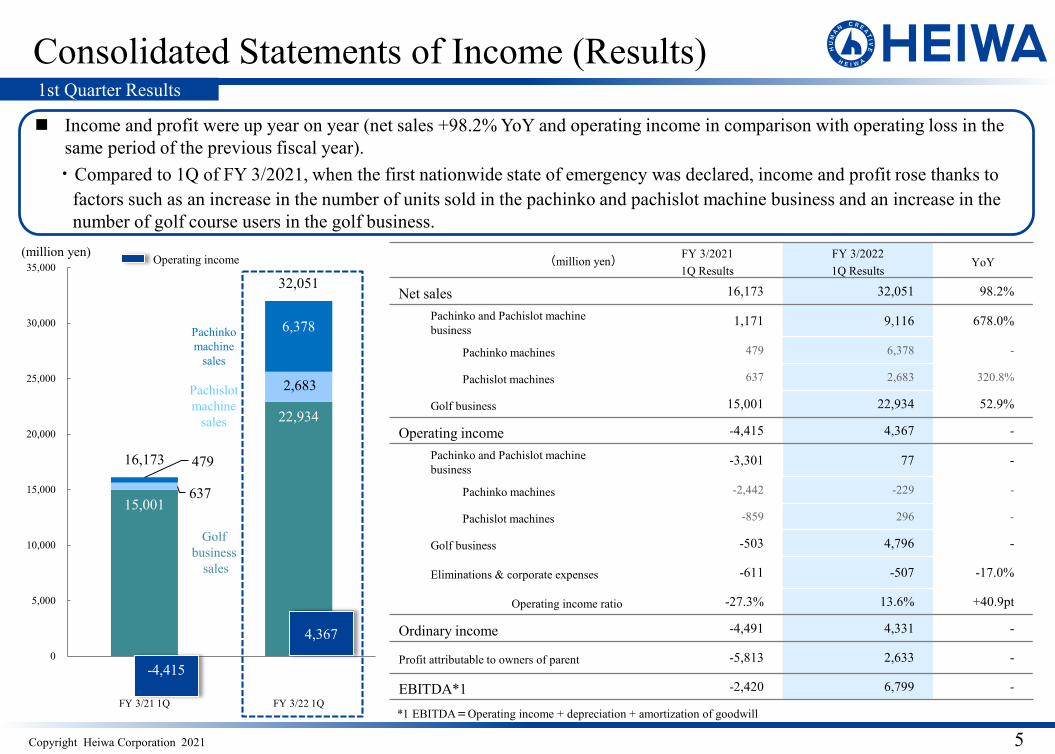
Income and profit were up year on year (net sales +98.2% YoY and operating income in comparison with operating loss in the same period of the previous fiscal year).・Compared to 1Q of FY 3/2021, when the first nationwide state of emergency was declared, income and profit rose thanks to
factors such as an increase in the number of units sold in the pachinko and pachislot machine business and an increase in the number of golf course users in the golf business.
Pachinko machine
sales
Pachislot machine
sales
Golf business
sales
Operating income(million yen)
*1 EBITDA=Operating income + depreciation + amortization of goodwill
(million yen) FY 3/20211Q Results
FY 3/20221Q Results
YoY
Net sales 16,173 32,051 98.2%
Pachinko and Pachislot machine business
1,171 9,116 678.0%
Pachinko machines 479 6,378 -
Pachislot machines 637 2,683 320.8%
Golf business 15,001 22,934 52.9%
Operating income -4,415 4,367 -
Pachinko and Pachislot machine business
-3,301 77 -
Pachinko machines -2,442 -229 -
Pachislot machines -859 296 -
Golf business -503 4,796 -
Eliminations & corporate expenses -611 -507 -17.0%
Operating income ratio -27.3% 13.6% +40.9pt
Ordinary income -4,491 4,331 -
Profit attributable to owners of parent -5,813 2,633 -
EBITDA*1 -2,420 6,799 -
4,367
Copyright Heiwa Corporation 2021 6
3,948 3,639
179 508
1,395 1,361
5,522 5,509
0
1,000
2,000
3,000
4,000
5,000
6,000
FY3/21 1Q FY3/22 1Q
SGA Expenses / Depreciation & Amortization / Capital Investment (Results)
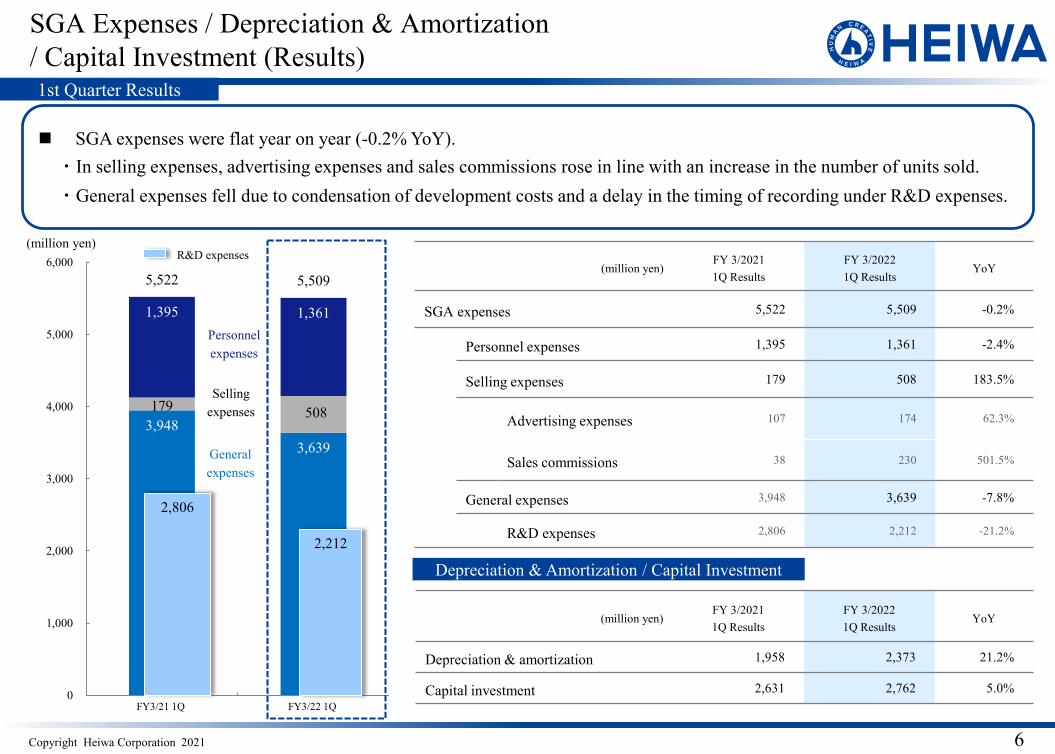
SGA expenses were flat year on year (-0.2% YoY).・In selling expenses, advertising expenses and sales commissions rose in line with an increase in the number of units sold.・General expenses fell due to condensation of development costs and a delay in the timing of recording under R&D expenses.
Personnelexpenses
Generalexpenses
Selling expenses
(million yen)
Depreciation & Amortization / Capital Investment
2,806
R&D expenses(million yen)
FY 3/20211Q Results
FY 3/20221Q Results
YoY
SGA expenses 5,522 5,509 -0.2%
Personnel expenses 1,395 1,361 -2.4%
Selling expenses 179 508 183.5%
Advertising expenses 107 174 62.3%
Sales commissions 38 230 501.5%
General expenses 3,948 3,639 -7.8%
R&D expenses 2,806 2,212 -21.2%
(million yen)FY 3/20211Q Results
FY 3/20221Q Results
YoY
Depreciation & amortization 1,958 2,373 21.2%
Capital investment 2,631 2,762 5.0%
2,212
1st Quarter Results
Copyright Heiwa Corporation 2021 7
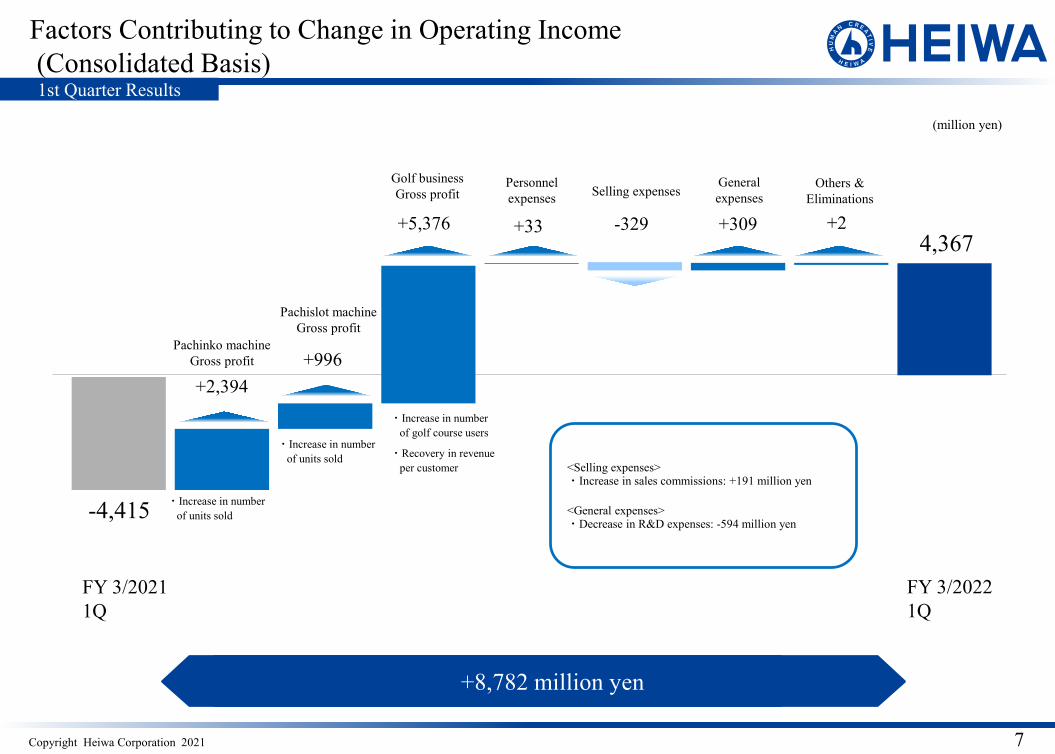
Factors Contributing to Change in Operating Income(Consolidated Basis)
FY 3/2021 1Q
FY 3/2022 1Q
Pachinko machineGross profit
Pachislot machineGross profit
Golf businessGross profit
Personnel expenses Selling expenses
(million yen)
General expenses
+8,782 million yen
Others & Eliminations
・Increase in number of golf course users
・Recovery in revenue per customer
・Increase in number of units sold
<Selling expenses>・Increase in sales commissions: +191 million yen
<General expenses>・Decrease in R&D expenses: -594 million yen
・Increase in number of units sold-4,415
+2,394+996
+5,376 +33 -329 +309 +24,367
1st Quarter Results
Copyright Heiwa Corporation 2021 8
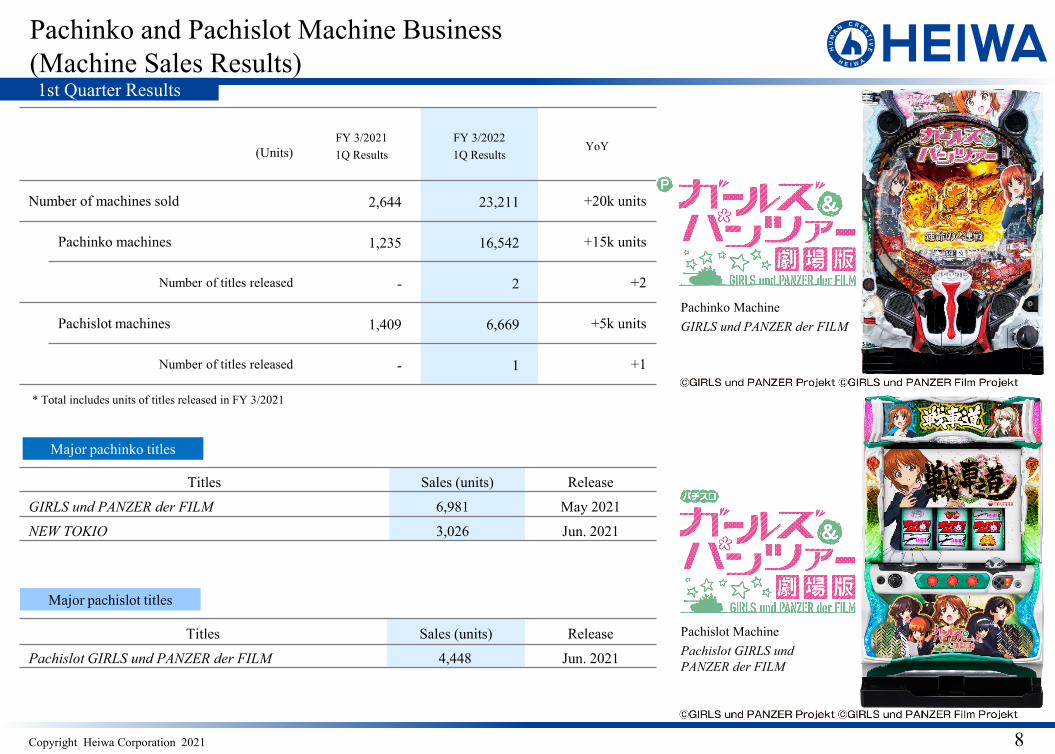
Pachinko and Pachislot Machine Business (Machine Sales Results)
Titles Sales (units) Release
GIRLS und PANZER der FILM 6,981 May 2021
NEW TOKIO 3,026 Jun. 2021
Titles Sales (units) Release
Pachislot GIRLS und PANZER der FILM 4,448 Jun. 2021
Major pachinko titles
Major pachislot titles
(Units)FY 3/20211Q Results
FY 3/20221Q Results
YoY
Number of machines sold 2,644 23,211 +20k units
Pachinko machines 1,235 16,542 +15k units
Number of titles released - 2 +2
Pachislot machines 1,409 6,669 +5k units
Number of titles released - 1 +1
Pachislot MachinePachislot GIRLS und PANZER der FILM
Pachinko MachineGIRLS und PANZER der FILM
* Total includes units of titles released in FY 3/2021
1st Quarter Results
Copyright Heiwa Corporation 2021
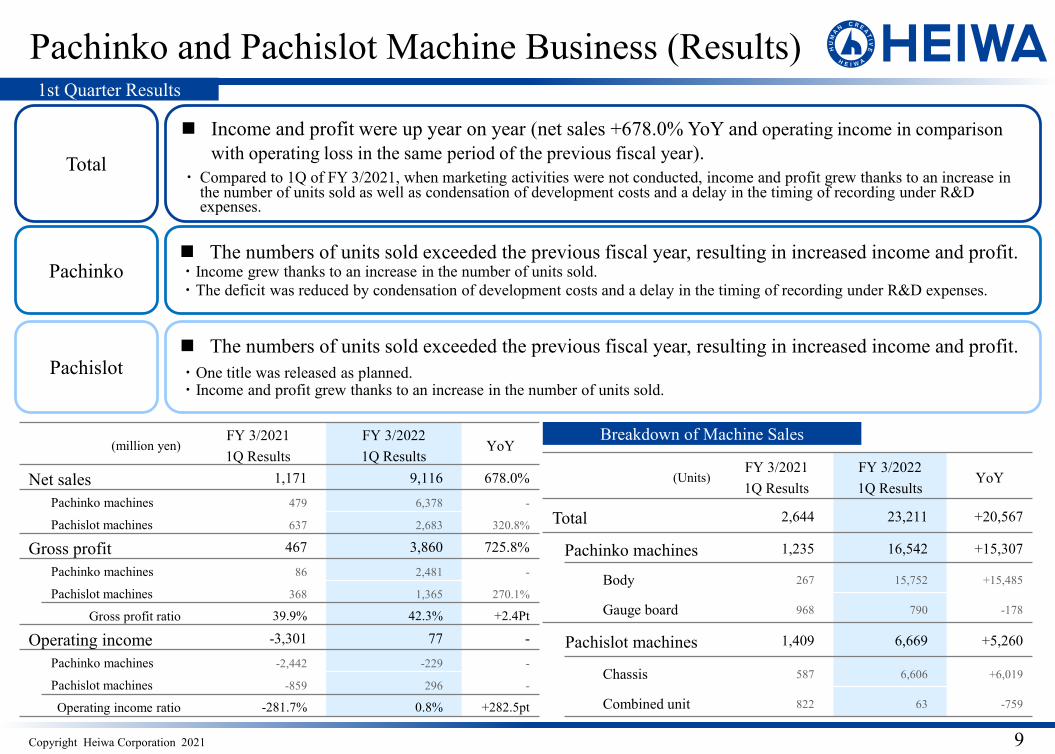
The numbers of units sold exceeded the previous fiscal year, resulting in increased income and profit.・One title was released as planned.・Income and profit grew thanks to an increase in the number of units sold.
9
Pachinko and Pachislot Machine Business (Results)
(million yen)FY 3/20211Q Results
FY 3/20221Q Results
YoY
Net sales 1,171 9,116 678.0%Pachinko machines 479 6,378 -
Pachislot machines 637 2,683 320.8%
Gross profit 467 3,860 725.8%Pachinko machines 86 2,481 -
Pachislot machines 368 1,365 270.1%
Gross profit ratio 39.9% 42.3% +2.4Pt
Operating income -3,301 77 -Pachinko machines -2,442 -229 -
Pachislot machines -859 296 -
Operating income ratio -281.7% 0.8% +282.5pt
(Units)FY 3/20211Q Results
FY 3/20221Q Results
YoY
Total 2,644 23,211 +20,567
Pachinko machines 1,235 16,542 +15,307
Body 267 15,752 +15,485
Gauge board 968 790 -178
Pachislot machines 1,409 6,669 +5,260
Chassis 587 6,606 +6,019
Combined unit 822 63 -759
The numbers of units sold exceeded the previous fiscal year, resulting in increased income and profit.・Income grew thanks to an increase in the number of units sold.・The deficit was reduced by condensation of development costs and a delay in the timing of recording under R&D expenses.
Pachinko
Pachislot
Total
Income and profit were up year on year (net sales +678.0% YoY and operating income in comparison with operating loss in the same period of the previous fiscal year).
・Compared to 1Q of FY 3/2021, when marketing activities were not conducted, income and profit grew thanks to an increase in the number of units sold as well as condensation of development costs and a delay in the timing of recording under R&D expenses.
Breakdown of Machine Sales
1st Quarter Results
Copyright Heiwa Corporation 2021
6,291 5,736 6,242
280 151
220 415
390 405
2,041
1,092 1,632
378
216
232
9,406
7,587 8,733
0
2,000
4,000
6,000
8,000
10,000
FY 3/20 1Q FY 3/21 1Q FY 3/22 1Q
Green Fee + Cart Fee Caddy Fee Proshop F&B Others
10
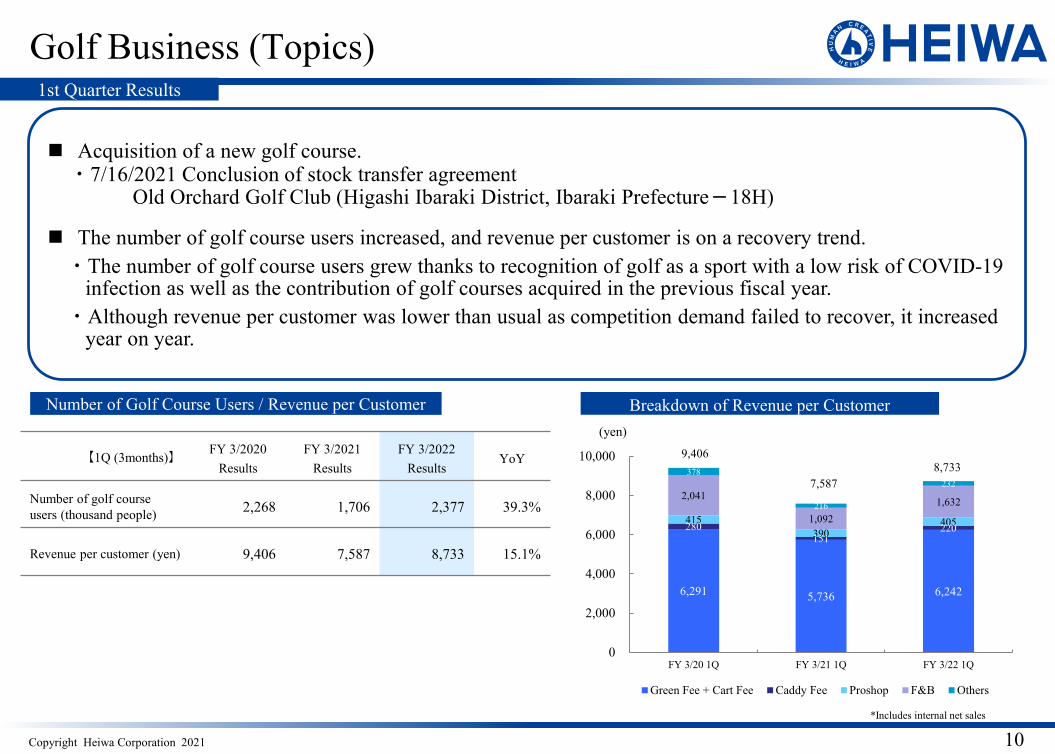
Acquisition of a new golf course.・7/16/2021 Conclusion of stock transfer agreement
Old Orchard Golf Club (Higashi Ibaraki District, Ibaraki Prefecture-18H)
The number of golf course users increased, and revenue per customer is on a recovery trend.・The number of golf course users grew thanks to recognition of golf as a sport with a low risk of COVID-19
infection as well as the contribution of golf courses acquired in the previous fiscal year.・Although revenue per customer was lower than usual as competition demand failed to recover, it increased
year on year.
Breakdown of Revenue per CustomerNumber of Golf Course Users / Revenue per Customer
*Includes internal net sales
【1Q (3months)】 FY 3/2020Results
FY 3/2021Results
FY 3/2022 Results
YoY
Number of golf course users (thousand people) 2,268 1,706 2,377 39.3%
Revenue per customer (yen) 9,406 7,587 8,733 15.1%
Golf Business (Topics)
(yen)
1st Quarter Results
Copyright Heiwa Corporation 2021 11
Golf Business (Results)
(million yen)FY 3/20201Q Results
FY 3/20211Q Results
FY 3/20221Q Results
YoY
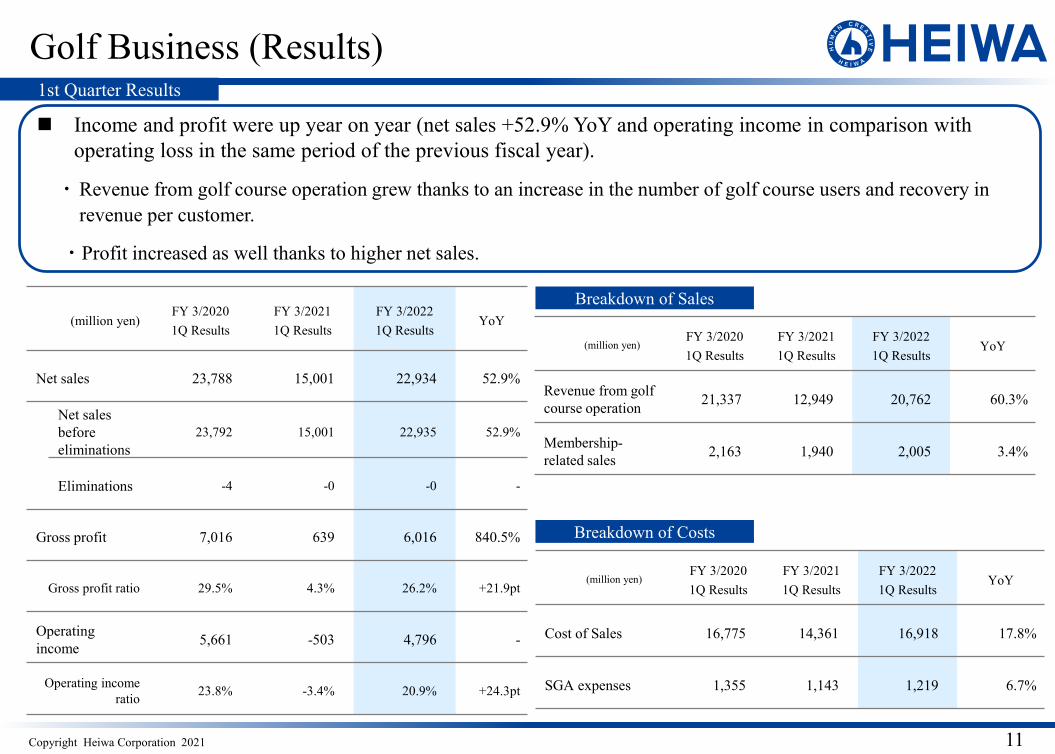
Net sales 23,788 15,001 22,934 52.9%
Net salesbefore eliminations
23,792 15,001 22,935 52.9%
Eliminations -4 -0 -0 -
Gross profit 7,016 639 6,016 840.5%
Gross profit ratio 29.5% 4.3% 26.2% +21.9pt
Operating income 5,661 -503 4,796 -
Operating income ratio 23.8% -3.4% 20.9% +24.3pt
Income and profit were up year on year (net sales +52.9% YoY and operating income in comparison with operating loss in the same period of the previous fiscal year).
・Revenue from golf course operation grew thanks to an increase in the number of golf course users and recovery in revenue per customer.
・Profit increased as well thanks to higher net sales.
(million yen)FY 3/20201Q Results
FY 3/20211Q Results
FY 3/20221Q Results
YoY
Revenue from golf course operation 21,337 12,949 20,762 60.3%
Membership-related sales 2,163 1,940 2,005 3.4%
Breakdown of Sales
Breakdown of Costs
(million yen)FY 3/20201Q Results
FY 3/20211Q Results
FY 3/20221Q Results
YoY
Cost of Sales 16,775 14,361 16,918 17.8%
SGA expenses 1,355 1,143 1,219 6.7%
1st Quarter Results
Copyright Heiwa Corporation 2021 12
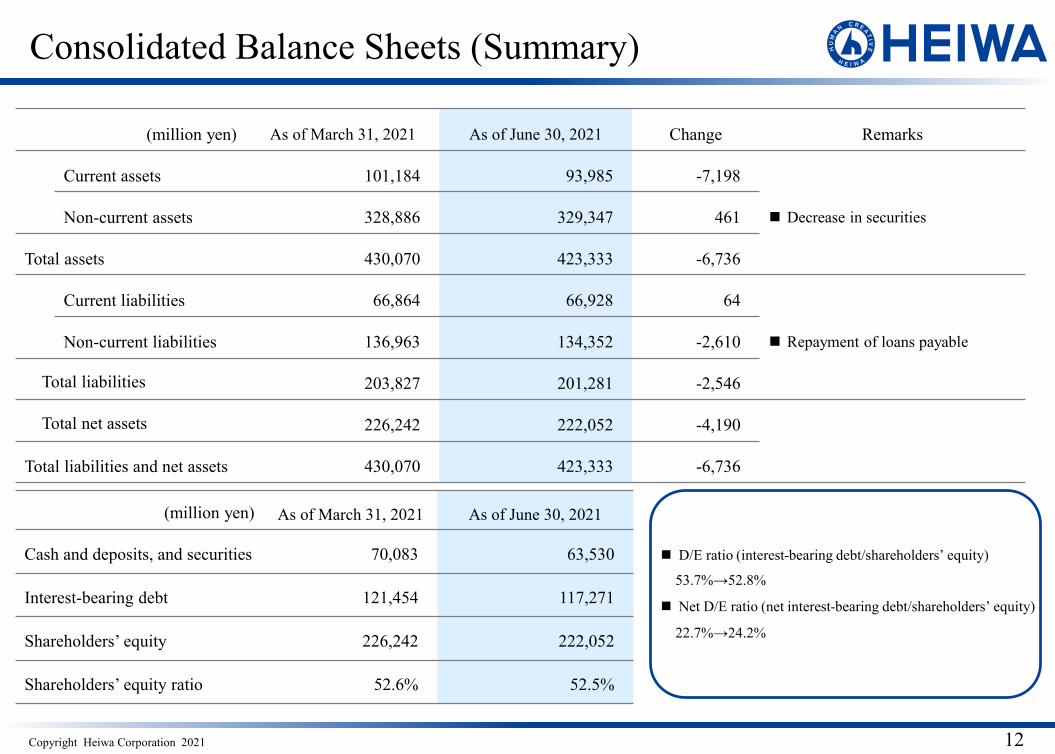
Consolidated Balance Sheets (Summary)
(million yen) As of March 31, 2021 As of June 30, 2021 Change Remarks
Current assets 101,184 93,985 -7,198
Decrease in securitiesNon-current assets 328,886 329,347 461
Total assets 430,070 423,333 -6,736
Current liabilities 66,864 66,928 64
Repayment of loans payableNon-current liabilities 136,963 134,352 -2,610
Total liabilities 203,827 201,281 -2,546
Total net assets 226,242 222,052 -4,190
Total liabilities and net assets 430,070 423,333 -6,736
(million yen) As of March 31, 2021 As of June 30, 2021
Cash and deposits, and securities 70,083 63,530
Interest-bearing debt 121,454 117,271
Shareholders’ equity 226,242 222,052
Shareholders’ equity ratio 52.6% 52.5%
D/E ratio (interest-bearing debt/shareholders’ equity)
53.7%→52.8%
Net D/E ratio (net interest-bearing debt/shareholders’ equity)
22.7%→24.2%
Full-year Plan for FY ending March 31, 2022
Copyright Heiwa Corporation 2021 14
74,452
85,300 12,344
21,900 20,625
43,200
107,744
150,700
0
20,000
40,000
60,000
80,000
100,000
120,000
140,000
160,000
FY 3/21 Results FY 3/22 Plan5,311
Consolidated Statements of Income (Plan)変更なし
Pachinko Machine
sales
Pachislot Machine
sales
Golf Business
sales
Operating income
(million yen)
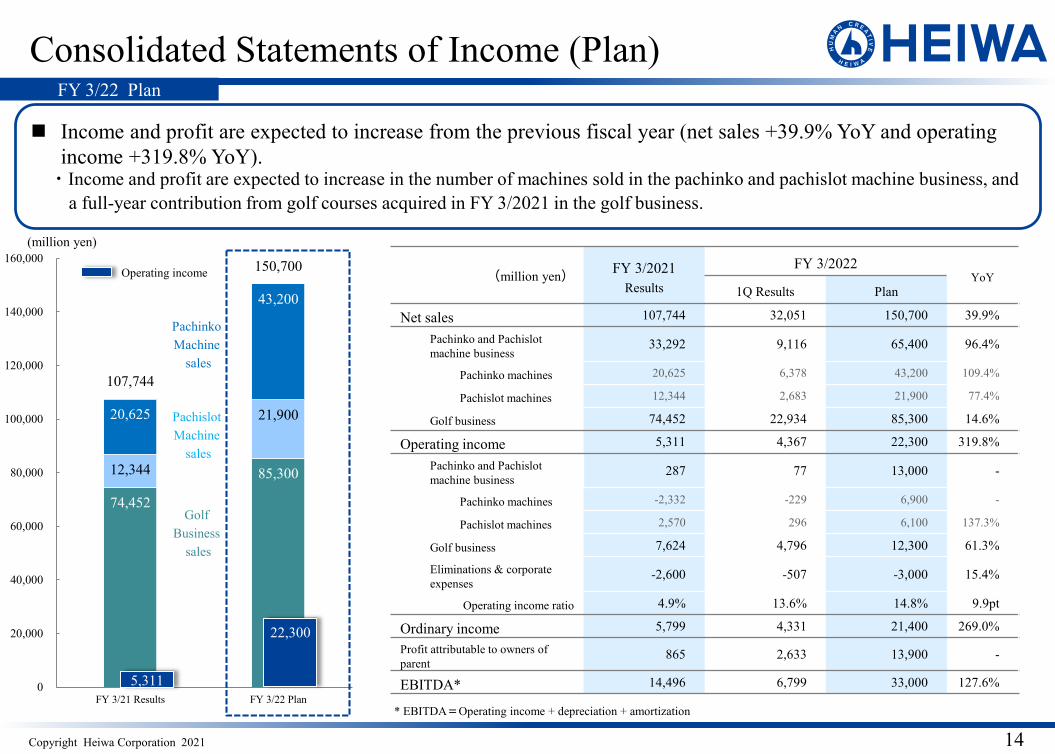
Income and profit are expected to increase from the previous fiscal year (net sales +39.9% YoY and operating income +319.8% YoY).・Income and profit are expected to increase in the number of machines sold in the pachinko and pachislot machine business, and
a full-year contribution from golf courses acquired in FY 3/2021 in the golf business.
* EBITDA=Operating income + depreciation + amortization
22,300
FY 3/22 Plan
(million yen) FY 3/2021Results
FY 3/2022YoY
1Q Results Plan
Net sales 107,744 32,051 150,700 39.9%
Pachinko and Pachislot machine business
33,292 9,116 65,400 96.4%
Pachinko machines 20,625 6,378 43,200 109.4%
Pachislot machines 12,344 2,683 21,900 77.4%
Golf business 74,452 22,934 85,300 14.6%
Operating income 5,311 4,367 22,300 319.8%
Pachinko and Pachislot machine business
287 77 13,000 -
Pachinko machines -2,332 -229 6,900 -
Pachislot machines 2,570 296 6,100 137.3%
Golf business 7,624 4,796 12,300 61.3%
Eliminations & corporate expenses
-2,600 -507 -3,000 15.4%
Operating income ratio 4.9% 13.6% 14.8% 9.9pt
Ordinary income 5,799 4,331 21,400 269.0%
Profit attributable to owners of parent
865 2,633 13,900 -
EBITDA* 14,496 6,799 33,000 127.6%
Copyright Heiwa Corporation 2021 15
15,103 15,800
2,942
4,900
5,676
5,800 23,723
26,500
0
5,000
10,000
15,000
20,000
25,000
30,000
FY 3/21 Results FY 3/22 Plan
SGA Expenses / Depreciation & Amortization / Capital Investment (Plan)
Personnelexpenses
Generalexpenses
Selling expenses
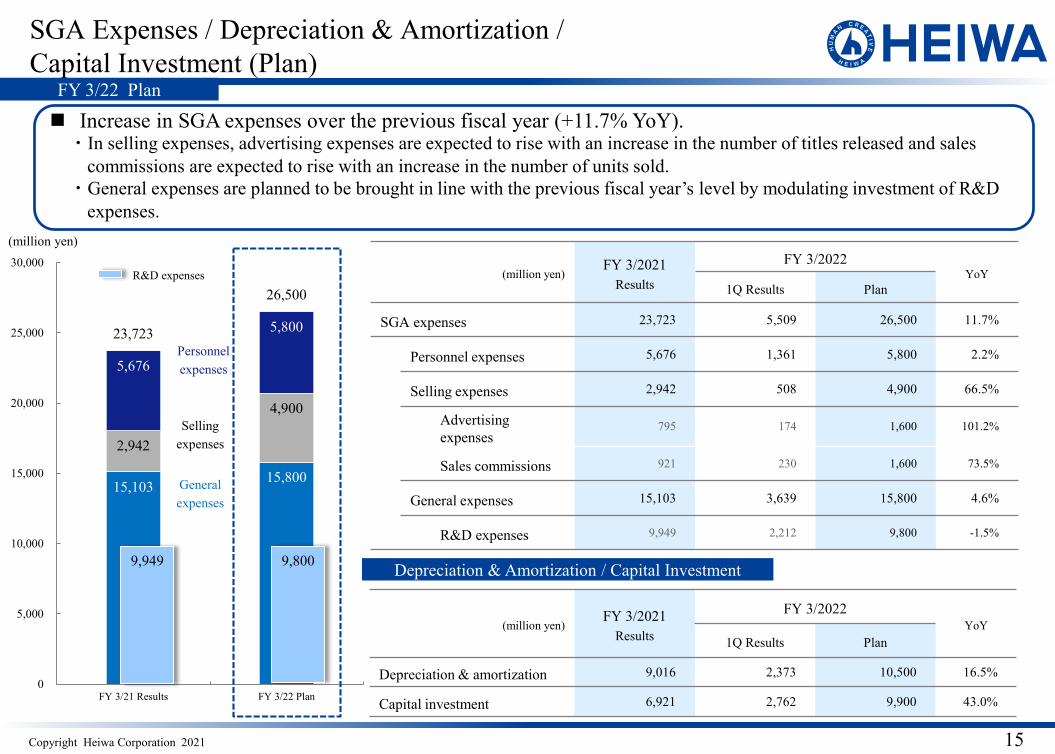
Increase in SGA expenses over the previous fiscal year (+11.7% YoY).・In selling expenses, advertising expenses are expected to rise with an increase in the number of titles released and sales
commissions are expected to rise with an increase in the number of units sold.・General expenses are planned to be brought in line with the previous fiscal year’s level by modulating investment of R&D
expenses.(million yen)
Depreciation & Amortization / Capital Investment9,949 9,800
R&D expenses
FY 3/22 Plan
(million yen)FY 3/2021
Results
FY 3/2022YoY
1Q Results Plan
SGA expenses 23,723 5,509 26,500 11.7%
Personnel expenses 5,676 1,361 5,800 2.2%
Selling expenses 2,942 508 4,900 66.5%
Advertising expenses
795 174 1,600 101.2%
Sales commissions 921 230 1,600 73.5%
General expenses 15,103 3,639 15,800 4.6%
R&D expenses 9,949 2,212 9,800 -1.5%
(million yen)FY 3/2021
Results
FY 3/2022YoY
1Q Results Plan
Depreciation & amortization 9,016 2,373 10,500 16.5%
Capital investment 6,921 2,762 9,900 43.0%
Copyright Heiwa Corporation 2021 16
Pachinko and Pachislot Machine Business(Machine Sales Plan)
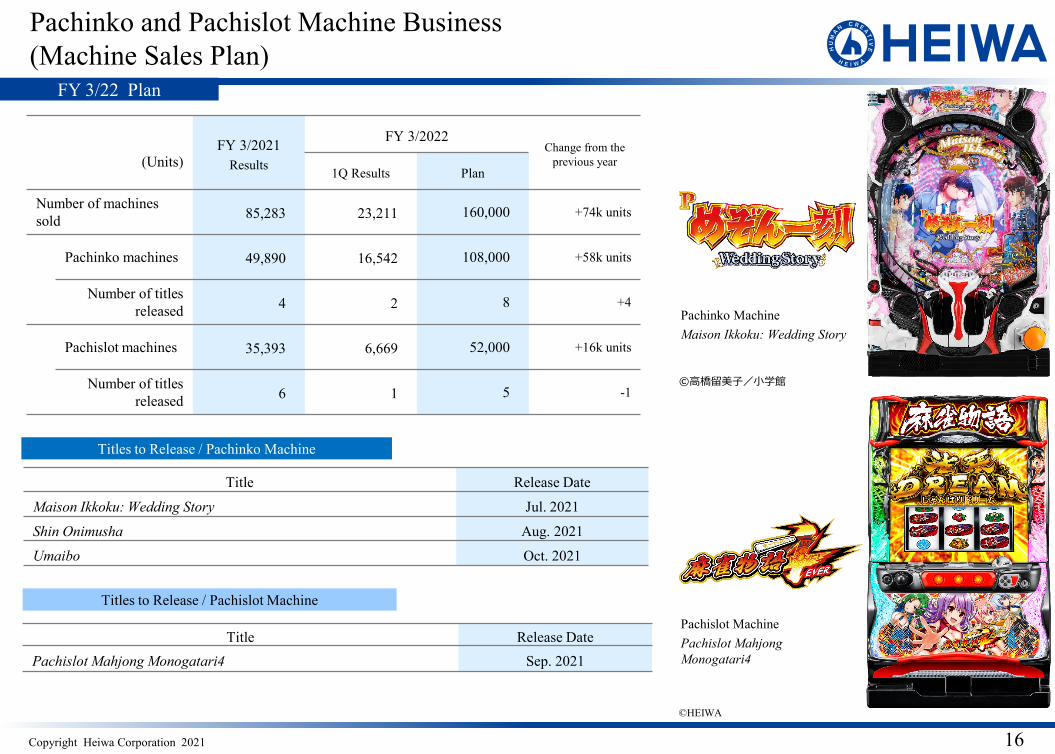
Titles to Release / Pachinko Machine
Titles to Release / Pachislot Machine
Title Release Date
Maison Ikkoku: Wedding Story Jul. 2021
Shin Onimusha Aug. 2021
Umaibo Oct. 2021
Title Release DatePachislot Mahjong Monogatari4 Sep. 2021
Pachinko MachineMaison Ikkoku: Wedding Story
Pachislot MachinePachislot Mahjong Monogatari4
FY 3/22 Plan
(Units)FY 3/2021
Results
FY 3/2022Change from the
previous year1Q Results Plan
Number of machines sold 85,283 23,211 160,000 +74k units
Pachinko machines 49,890 16,542 108,000 +58k units
Number of titles released 4 2 8 +4
Pachislot machines 35,393 6,669 52,000 +16k units
Number of titles released 6 1 5 -1
©HEIWA
©高橋留美子/小学館
Copyright Heiwa Corporation 2021
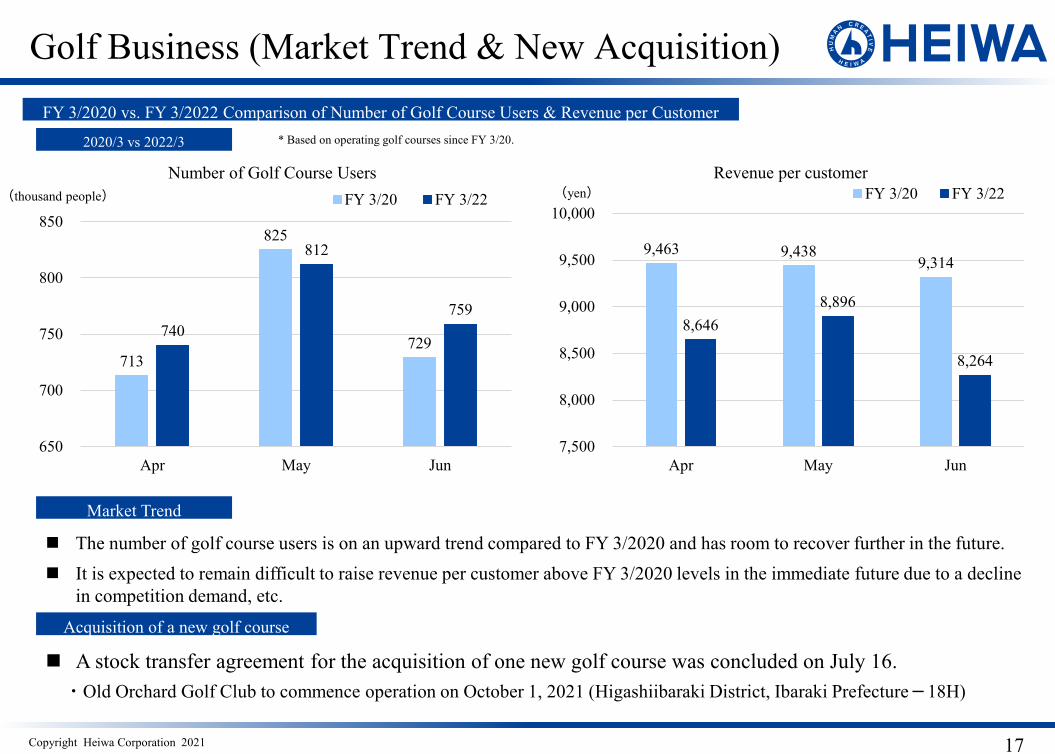
The number of golf course users is on an upward trend compared to FY 3/2020 and has room to recover further in the future. It is expected to remain difficult to raise revenue per customer above FY 3/2020 levels in the immediate future due to a decline
in competition demand, etc.
Golf Business (Market Trend & New Acquisition)
17
Market Trend
2020/3 vs 2022/3
FY 3/2020 vs. FY 3/2022 Comparison of Number of Golf Course Users & Revenue per Customer
Acquisition of a new golf course
A stock transfer agreement for the acquisition of one new golf course was concluded on July 16.・Old Orchard Golf Club to commence operation on October 1, 2021 (Higashiibaraki District, Ibaraki Prefecture-18H)
713
825
729 740
812
759
650
700
750
800
850
Apr May Jun
Number of Golf Course UsersFY 3/20 FY 3/22
9,463 9,438 9,314
8,646 8,896
8,264
7,500
8,000
8,500
9,000
9,500
10,000
Apr May Jun
Revenue per customerFY 3/20 FY 3/22(thousand people) (yen)
* Based on operating golf courses since FY 3/20.
Supplementary Information
【Market Environment】・Pachinko and Pachislot Machine Business・Golf Business
【Pachinko and Pachislot Machine Business】・Regulations on Pachinko and Pachislot Machines・Number of Machines Sold
【Golf Business】・Trends of Golf Course Users and Revenue per Customer 1・Trends of Golf Course Users and Revenue per Customer 2・Golf Course Portfolio
【Consolidated Results】・Financial Performance Trend・Key Financial Indicators
Copyright Heiwa Corporation 2021 19
Market Environment (Pachinko and Pachislot Machine Business) 1
25.48 25.67 25.00 24.50
23.22 22.70 21.40
20.70 20.00
0.00
5.00
10.00
15.00
20.00
25.00
30.00
11 12 13 14 15 16 17 18 19
Market Size
Market Size Player Population and Average Annual Spending(trillion yen)
(CY)
(million people) (thousand yen)
(CY)
12.6
11.1
9.7
11.5 10.7
9.4 9.0 9.5
8.9
93.797.1
73.2
85.2
99.8
88.985.1 81.8
103.4
0
20
40
60
80
100
120
0.0
5.0
10.0
15.0
20.0
11 12 13 14 15 16 17 18 19
Player Population Average Annual Spending
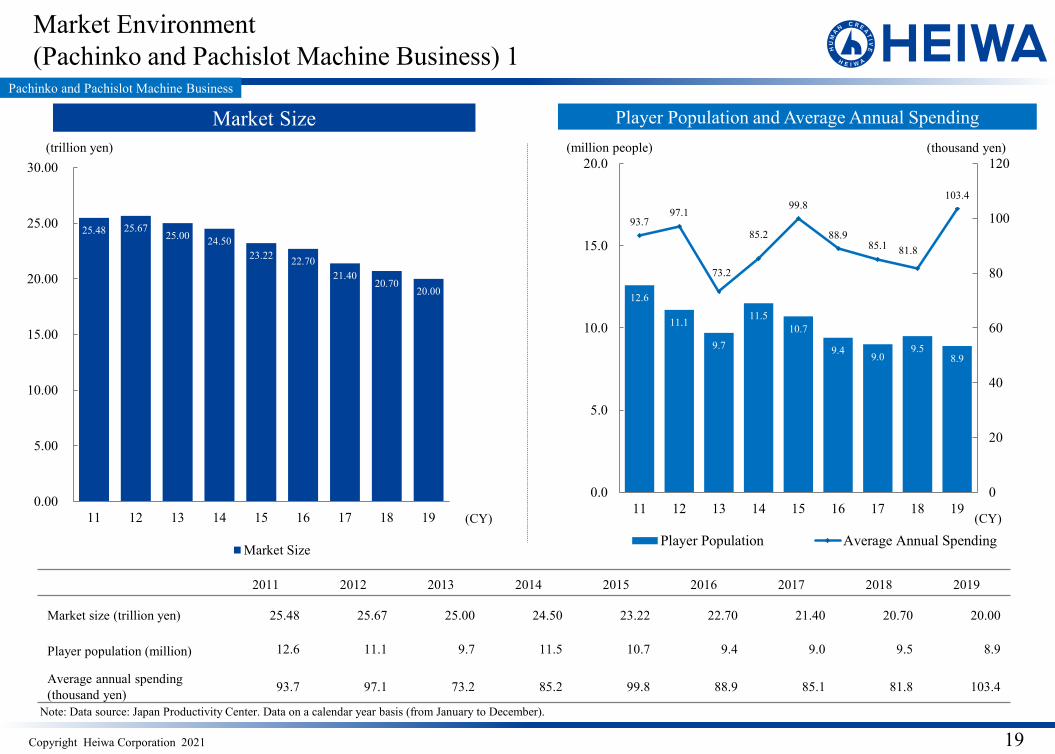
2011 2012 2013 2014 2015 2016 2017 2018 2019
Market size (trillion yen) 25.48 25.67 25.00 24.50 23.22 22.70 21.40 20.70 20.00
Player population (million) 12.6 11.1 9.7 11.5 10.7 9.4 9.0 9.5 8.9
Average annual spending (thousand yen) 93.7 97.1 73.2 85.2 99.8 88.9 85.1 81.8 103.4
Pachinko and Pachislot Machine Business
Note: Data source: Japan Productivity Center. Data on a calendar year basis (from January to December).
Copyright Heiwa Corporation 2021 20
Market Environment (Pachinko and Pachislot Machine Business) 2
387 395 405 411 418 427 435 443 448
11,893 11,627 11,310
10,986 10,596
10,060 9,639
9,035 7,500
0
100
200
300
400
500
600
700
800
0
2,000
4,000
6,000
8,000
10,000
12,000
13 14 15 16 17 18 19 20 21forecast
Number of machines installed per parlor Number of parlors
3.00 2.95 2.91 2.83 2.74 2.63 2.55 2.43 2.07
1.60 1.64 1.66 1.69 1.68 1.66 1.63 1.57
1.28
4.61 4.59 4.57 4.52 4.43 4.30 4.19 4.00
3.36
0.00
1.00
2.00
3.00
4.00
5.00
6.00
13 14 15 16 17 18 19 20 21forecast
Pachinko machines Pachislot machines
Number of Pachinko Parlors / Number of Machines Installed per Parlor
Pachinko Machine Installations /Pachislot Machine Installations
(parlors) (units) (million units)
(CY)(CY)
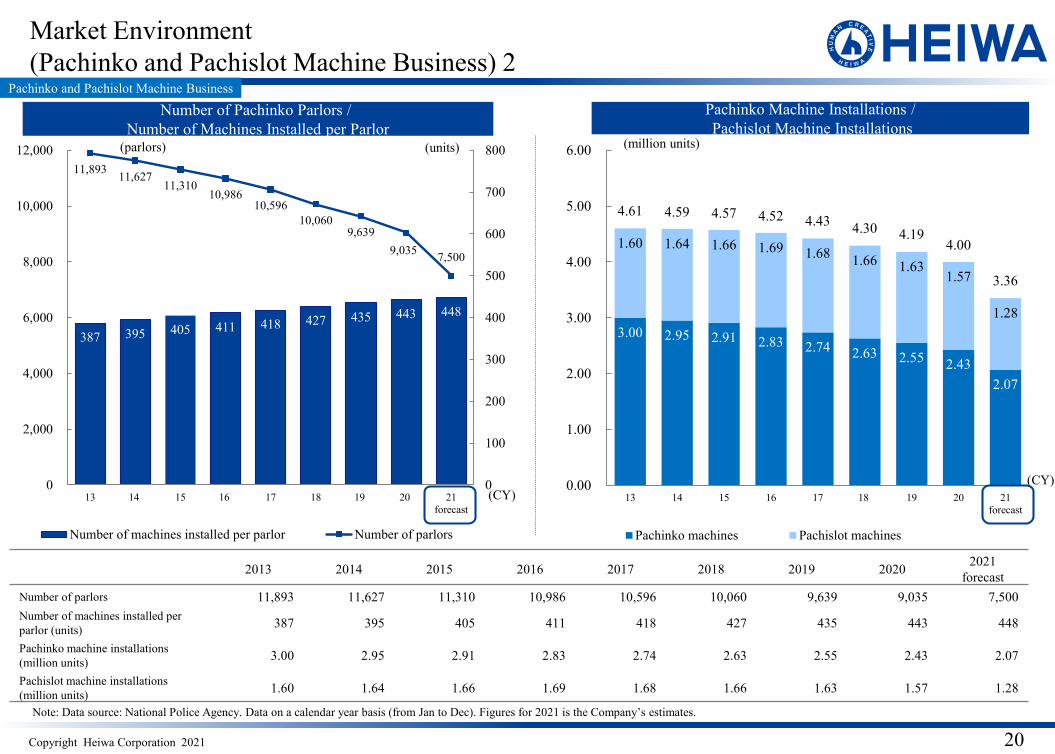
2013 2014 2015 2016 2017 2018 2019 2020 2021forecast
Number of parlors 11,893 11,627 11,310 10,986 10,596 10,060 9,639 9,035 7,500Number of machines installed per parlor (units) 387 395 405 411 418 427 435 443 448
Pachinko machine installations (million units) 3.00 2.95 2.91 2.83 2.74 2.63 2.55 2.43 2.07
Pachislot machine installations(million units) 1.60 1.64 1.66 1.69 1.68 1.66 1.63 1.57 1.28
Pachinko and Pachislot Machine Business
Note: Data source: National Police Agency. Data on a calendar year basis (from Jan to Dec). Figures for 2021 is the Company’s estimates.
Copyright Heiwa Corporation 2021 21
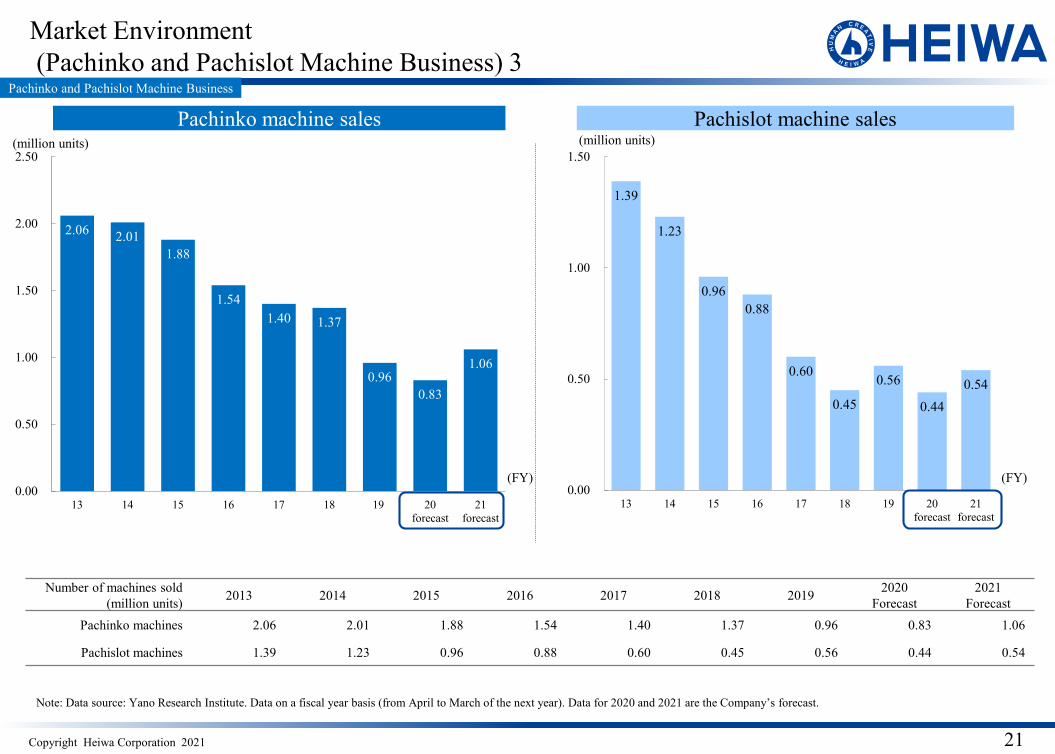
Market Environment(Pachinko and Pachislot Machine Business) 3
2.06 2.01 1.88
1.54 1.40 1.37
0.96 0.83
1.06
0.00
0.50
1.00
1.50
2.00
2.50
13 14 15 16 17 18 19 20forecast
21forecast
1.39
1.23
0.96 0.88
0.60
0.45
0.56
0.44 0.54
0.00
0.50
1.00
1.50
13 14 15 16 17 18 19 20forecast
21forecast
Note: Data source: Yano Research Institute. Data on a fiscal year basis (from April to March of the next year). Data for 2020 and 2021 are the Company’s forecast.
(million units) (million units)
(FY) (FY)
Number of machines sold(million units) 2013 2014 2015 2016 2017 2018 2019 2020
Forecast2021
ForecastPachinko machines 2.06 2.01 1.88 1.54 1.40 1.37 0.96 0.83 1.06
Pachislot machines 1.39 1.23 0.96 0.88 0.60 0.45 0.56 0.44 0.54
Pachinko machine sales Pachislot machine salesPachinko and Pachislot Machine Business
Copyright Heiwa Corporation 2021 22
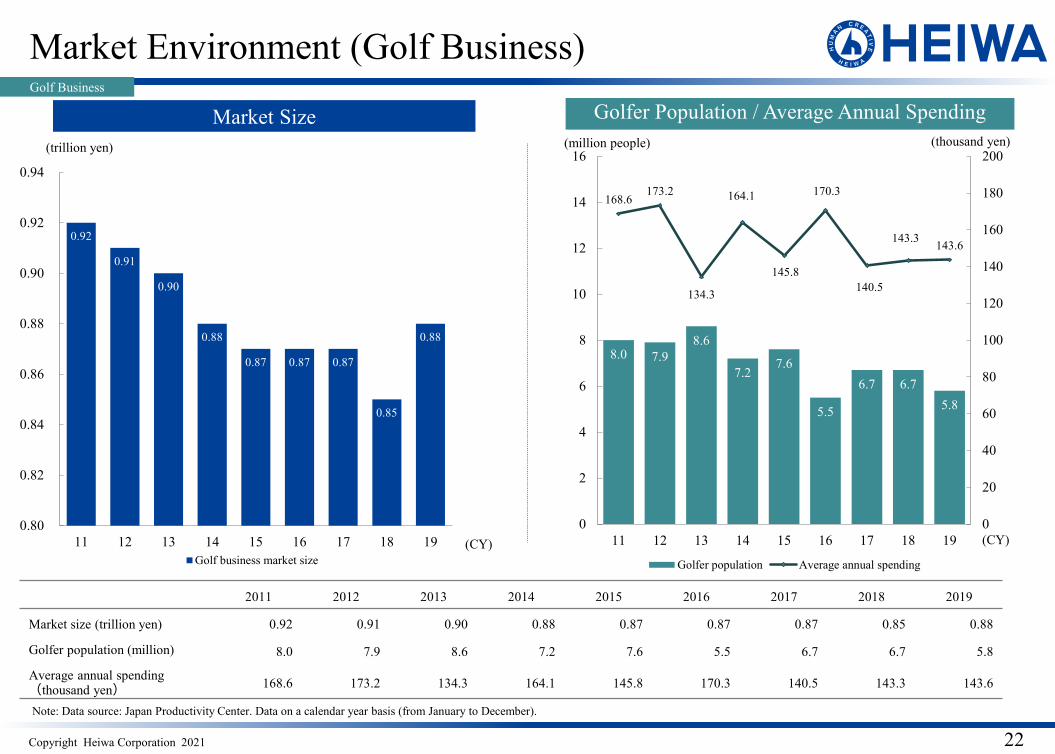
Market Environment (Golf Business)
0.92
0.91
0.90
0.88
0.87 0.87 0.87
0.85
0.88
0.80
0.82
0.84
0.86
0.88
0.90
0.92
0.94
11 12 13 14 15 16 17 18 19Golf business market size
8.0 7.9 8.6
7.2 7.6
5.5
6.7 6.7 5.8
168.6 173.2
134.3
164.1
145.8
170.3
140.5
143.3 143.6
0
20
40
60
80
100
120
140
160
180
200
0
2
4
6
8
10
12
14
16
11 12 13 14 15 16 17 18 19
Golfer population Average annual spending
(CY)
(trillion yen) (million people) (thousand yen)
Note: Data source: Japan Productivity Center. Data on a calendar year basis (from January to December).
2011 2012 2013 2014 2015 2016 2017 2018 2019
Market size (trillion yen) 0.92 0.91 0.90 0.88 0.87 0.87 0.87 0.85 0.88
Golfer population (million) 8.0 7.9 8.6 7.2 7.6 5.5 6.7 6.7 5.8
Average annual spending(thousand yen) 168.6 173.2 134.3 164.1 145.8 170.3 140.5 143.3 143.6
Market Size Golfer Population / Average Annual Spending
(CY)
Golf Business
Copyright Heiwa Corporation 2021
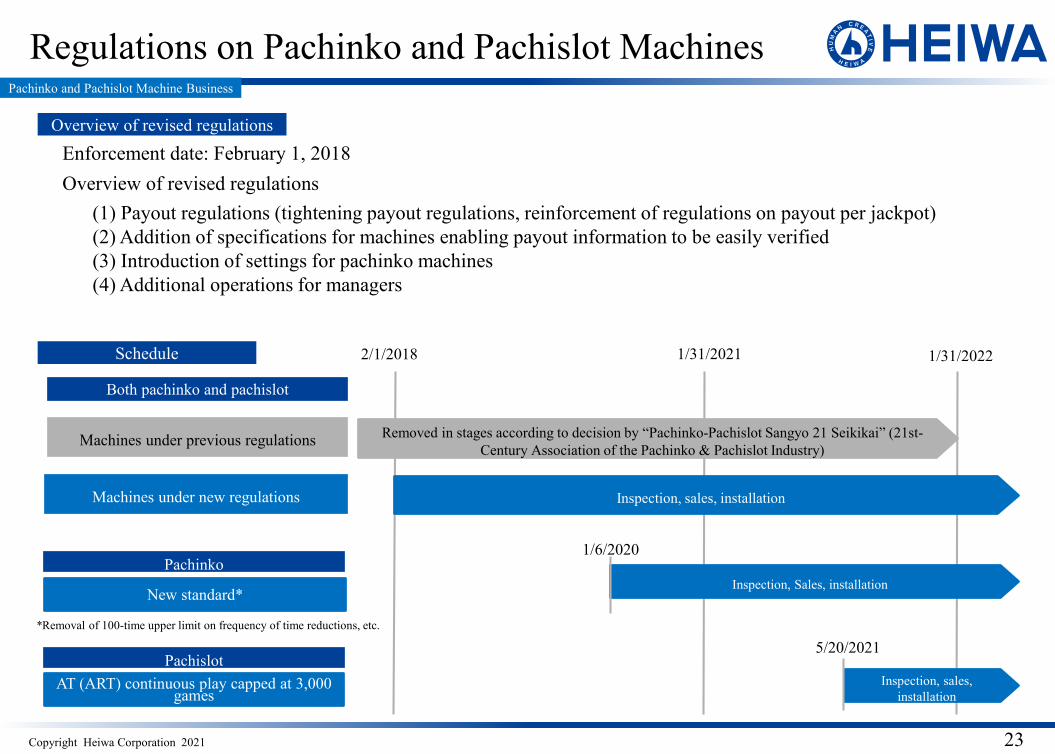
(1) Payout regulations (tightening payout regulations, reinforcement of regulations on payout per jackpot) (2) Addition of specifications for machines enabling payout information to be easily verified(3) Introduction of settings for pachinko machines(4) Additional operations for managers
Regulations on Pachinko and Pachislot Machines
23
Pachinko and Pachislot Machine Business
Overview of revised regulations
Enforcement date: February 1, 2018Overview of revised regulations
2/1/2018
Both pachinko and pachislot
1/31/2021
Machines under new regulations Inspection, sales, installation
Schedule
AT (ART) continuous play capped at 3,000 games
Inspection, sales, installation
5/20/2021Pachislot
New standard*
PachinkoInspection, Sales, installation
1/6/2020
*Removal of 100-time upper limit on frequency of time reductions, etc.
Machines under previous regulations Removed in stages according to decision by “Pachinko-Pachislot Sangyo 21 Seikikai” (21st-Century Association of the Pachinko & Pachislot Industry)
1/31/2022
Copyright Heiwa Corporation 2021
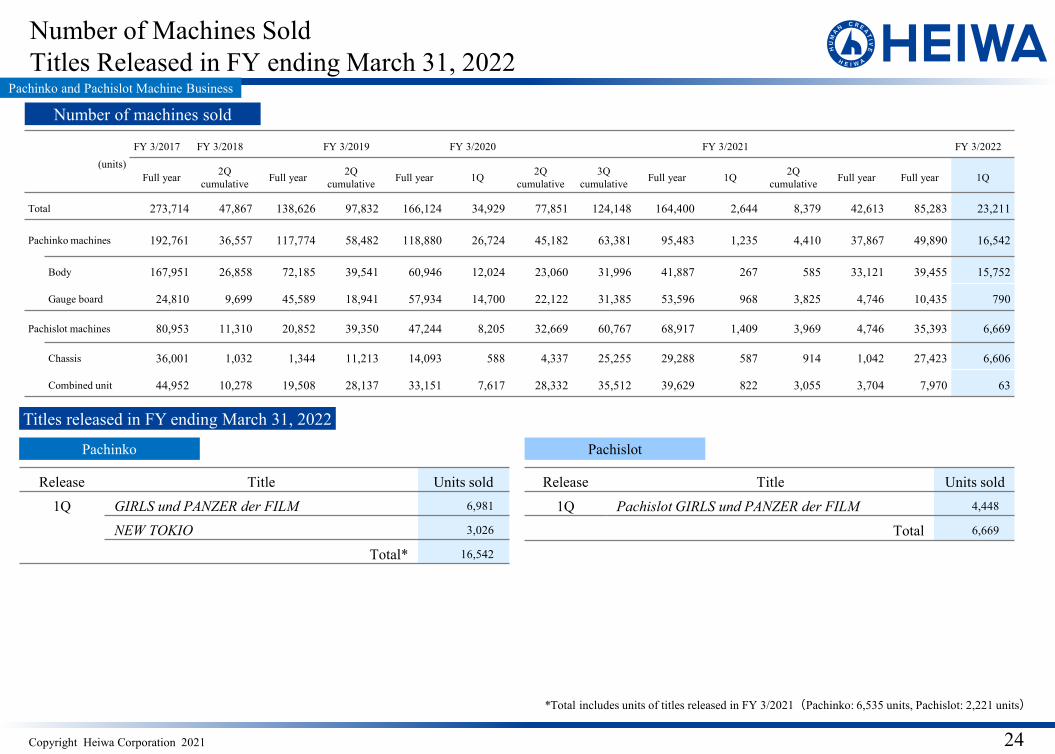
Number of Machines SoldTitles Released in FY ending March 31, 2022
24
(units)FY 3/2017 FY 3/2018 FY 3/2019 FY 3/2020 FY 3/2021 FY 3/2022
Full year 2Q cumulative Full year 2Q
cumulative Full year 1Q 2Q cumulative
3Q cumulative Full year 1Q 2Q
cumulative Full year Full year 1Q
Total 273,714 47,867 138,626 97,832 166,124 34,929 77,851 124,148 164,400 2,644 8,379 42,613 85,283 23,211
Pachinko machines 192,761 36,557 117,774 58,482 118,880 26,724 45,182 63,381 95,483 1,235 4,410 37,867 49,890 16,542
Body 167,951 26,858 72,185 39,541 60,946 12,024 23,060 31,996 41,887 267 585 33,121 39,455 15,752
Gauge board 24,810 9,699 45,589 18,941 57,934 14,700 22,122 31,385 53,596 968 3,825 4,746 10,435 790
Pachislot machines 80,953 11,310 20,852 39,350 47,244 8,205 32,669 60,767 68,917 1,409 3,969 4,746 35,393 6,669
Chassis 36,001 1,032 1,344 11,213 14,093 588 4,337 25,255 29,288 587 914 1,042 27,423 6,606
Combined unit 44,952 10,278 19,508 28,137 33,151 7,617 28,332 35,512 39,629 822 3,055 3,704 7,970 63
Number of machines sold
Titles released in FY ending March 31, 2022
Pachinko
Release Title Units sold1Q GIRLS und PANZER der FILM 6,981
NEW TOKIO 3,026
Total* 16,542
Pachislot
Release Title Units sold1Q Pachislot GIRLS und PANZER der FILM 4,448
Total 6,669
*Total includes units of titles released in FY 3/2021(Pachinko: 6,535 units, Pachislot: 2,221 units)
Pachinko and Pachislot Machine Business
Copyright Heiwa Corporation 2021
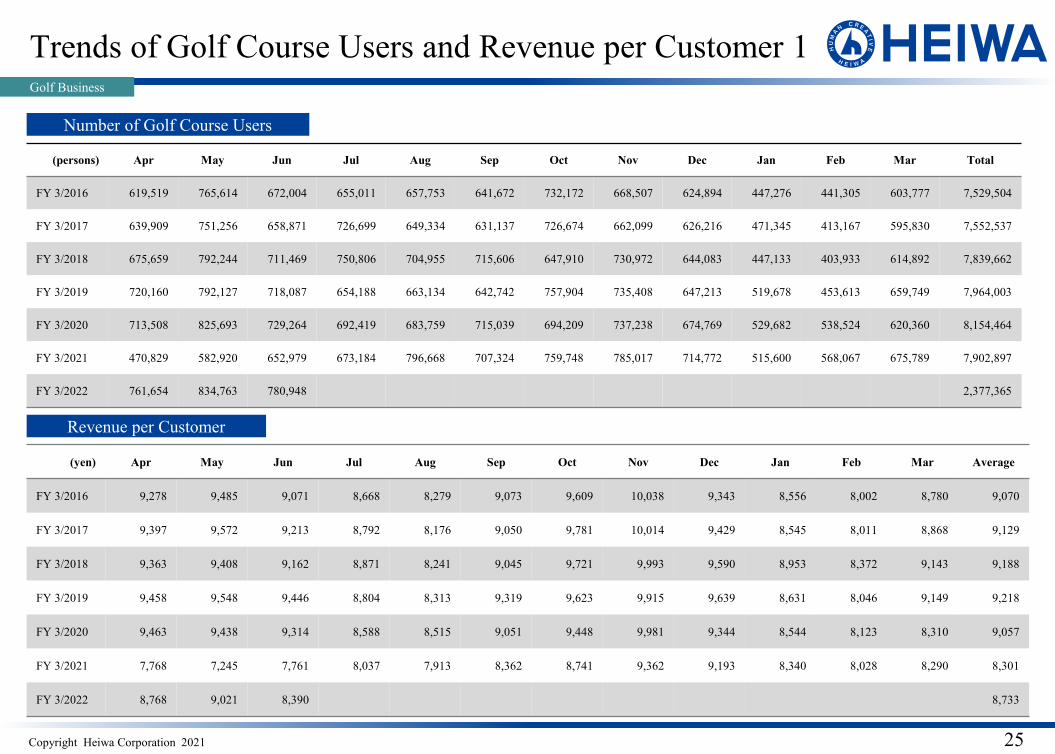
Trends of Golf Course Users and Revenue per Customer 1
25
(persons) Apr May Jun Jul Aug Sep Oct Nov Dec Jan Feb Mar Total
FY 3/2016 619,519 765,614 672,004 655,011 657,753 641,672 732,172 668,507 624,894 447,276 441,305 603,777 7,529,504
FY 3/2017 639,909 751,256 658,871 726,699 649,334 631,137 726,674 662,099 626,216 471,345 413,167 595,830 7,552,537
FY 3/2018 675,659 792,244 711,469 750,806 704,955 715,606 647,910 730,972 644,083 447,133 403,933 614,892 7,839,662
FY 3/2019 720,160 792,127 718,087 654,188 663,134 642,742 757,904 735,408 647,213 519,678 453,613 659,749 7,964,003
FY 3/2020 713,508 825,693 729,264 692,419 683,759 715,039 694,209 737,238 674,769 529,682 538,524 620,360 8,154,464
FY 3/2021 470,829 582,920 652,979 673,184 796,668 707,324 759,748 785,017 714,772 515,600 568,067 675,789 7,902,897
FY 3/2022 761,654 834,763 780,948 2,377,365
(yen) Apr May Jun Jul Aug Sep Oct Nov Dec Jan Feb Mar Average
FY 3/2016 9,278 9,485 9,071 8,668 8,279 9,073 9,609 10,038 9,343 8,556 8,002 8,780 9,070
FY 3/2017 9,397 9,572 9,213 8,792 8,176 9,050 9,781 10,014 9,429 8,545 8,011 8,868 9,129
FY 3/2018 9,363 9,408 9,162 8,871 8,241 9,045 9,721 9,993 9,590 8,953 8,372 9,143 9,188
FY 3/2019 9,458 9,548 9,446 8,804 8,313 9,319 9,623 9,915 9,639 8,631 8,046 9,149 9,218
FY 3/2020 9,463 9,438 9,314 8,588 8,515 9,051 9,448 9,981 9,344 8,544 8,123 8,310 9,057
FY 3/2021 7,768 7,245 7,761 8,037 7,913 8,362 8,741 9,362 9,193 8,340 8,028 8,290 8,301
FY 3/2022 8,768 9,021 8,390 8,733
Number of Golf Course Users
Revenue per Customer
Golf Business
Copyright Heiwa Corporation 2021
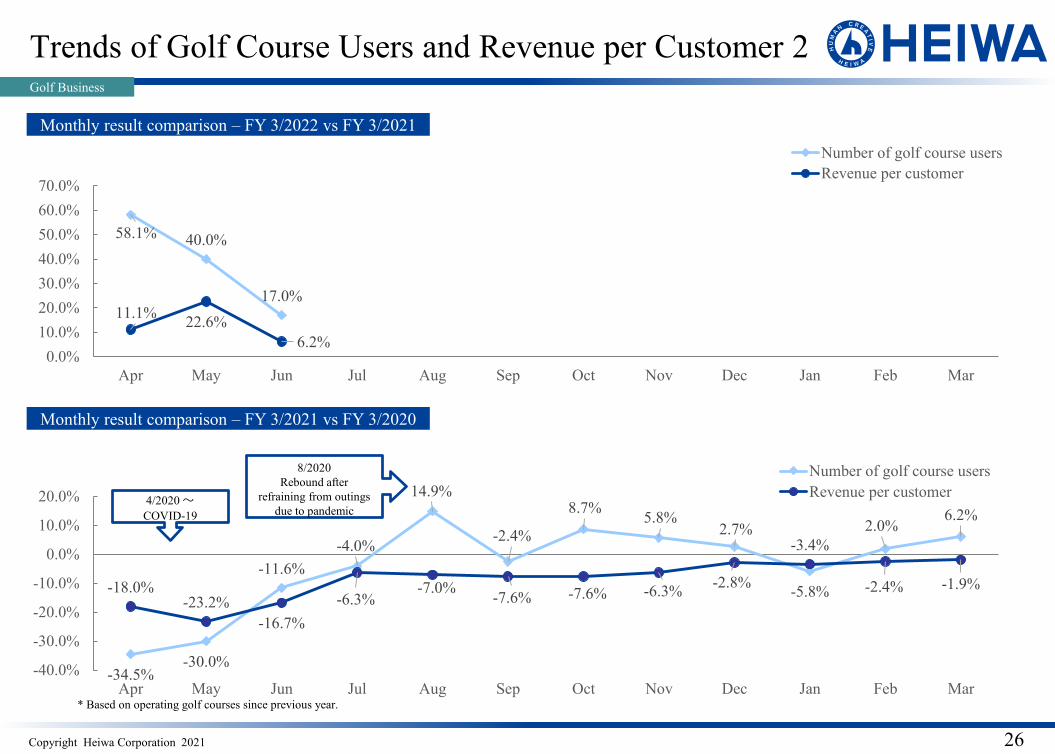
58.1% 40.0%
17.0%11.1% 22.6%
6.2%0.0%
10.0%20.0%30.0%40.0%50.0%60.0%70.0%
Apr May Jun Jul Aug Sep Oct Nov Dec Jan Feb Mar
Number of golf course usersRevenue per customer
-34.5%-30.0%
-11.6%-4.0%
14.9%
-2.4%
8.7% 5.8%2.7%
-5.8%
2.0%6.2%
-18.0%-23.2%
-16.7%-6.3%
-7.0% -7.6% -7.6% -6.3% -2.8%
-3.4%
-2.4% -1.9%
-40.0%
-30.0%
-20.0%
-10.0%
0.0%
10.0%
20.0%
Apr May Jun Jul Aug Sep Oct Nov Dec Jan Feb Mar
Number of golf course usersRevenue per customer
Trends of Golf Course Users and Revenue per Customer 2
26
Monthly result comparison – FY 3/2022 vs FY 3/2021
* Based on operating golf courses since previous year.
Golf Business
Monthly result comparison – FY 3/2021 vs FY 3/2020
8/2020Rebound after
refraining from outings due to pandemic
4/2020~COVID-19
Copyright Heiwa Corporation 2021
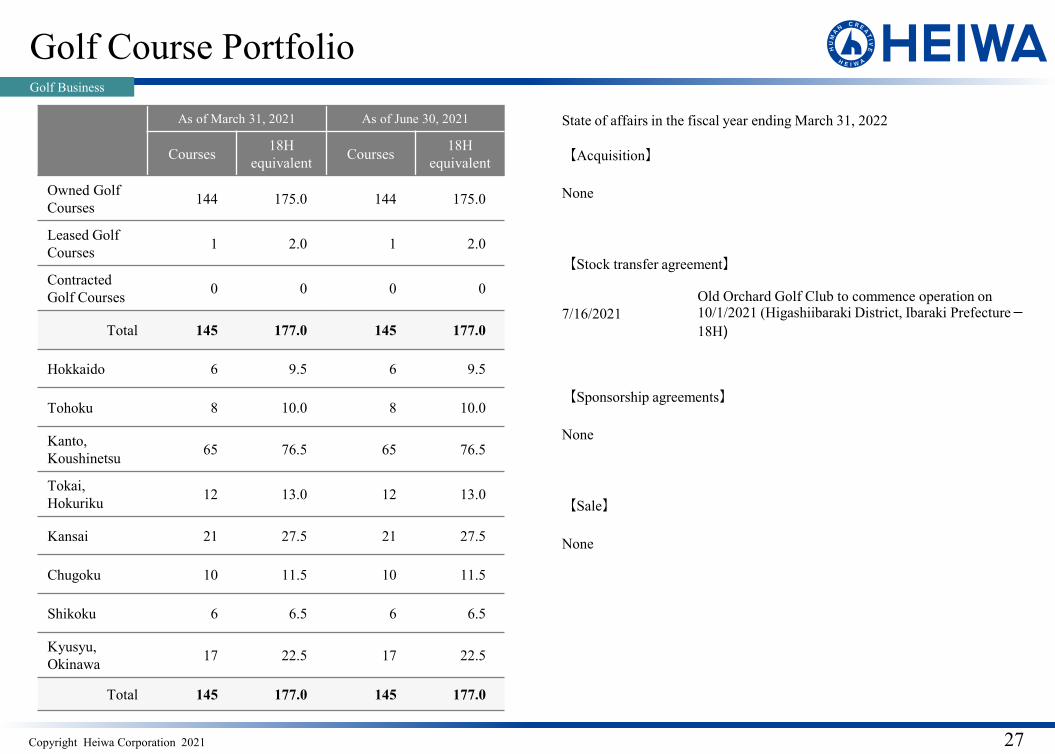
Golf Course Portfolio
27
As of March 31, 2021 As of June 30, 2021
Courses 18H equivalent Courses 18H
equivalent
Owned Golf Courses 144 175.0 144 175.0
Leased Golf Courses 1 2.0 1 2.0
Contracted Golf Courses 0 0 0 0
Total 145 177.0 145 177.0
Hokkaido 6 9.5 6 9.5
Tohoku 8 10.0 8 10.0
Kanto, Koushinetsu 65 76.5 65 76.5
Tokai, Hokuriku 12 13.0 12 13.0
Kansai 21 27.5 21 27.5
Chugoku 10 11.5 10 11.5
Shikoku 6 6.5 6 6.5
Kyusyu, Okinawa 17 22.5 17 22.5
Total 145 177.0 145 177.0
State of affairs in the fiscal year ending March 31, 2022
【Acquisition】
None
【Stock transfer agreement】
7/16/2021Old Orchard Golf Club to commence operation on10/1/2021 (Higashiibaraki District, Ibaraki Prefecture-18H)
【Sponsorship agreements】
None
【Sale】
None
Golf Business
Copyright Heiwa Corporation 2021
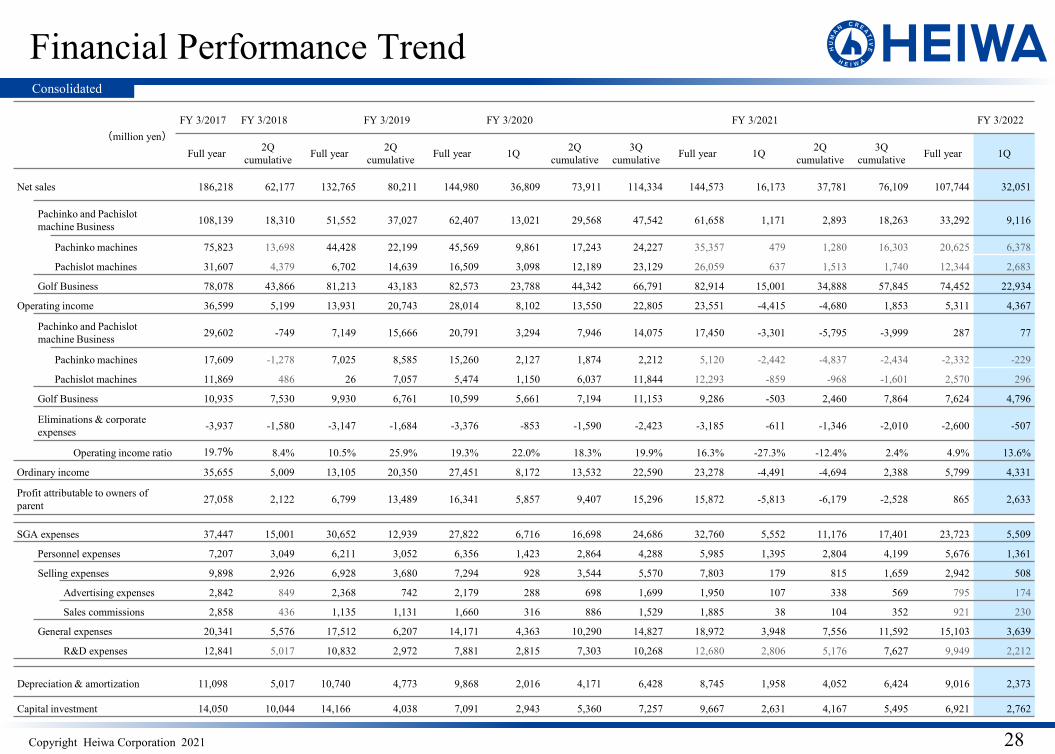
Financial Performance Trend
28
(million yen)FY 3/2017 FY 3/2018 FY 3/2019 FY 3/2020 FY 3/2021 FY 3/2022
Full year 2Q cumulative Full year 2Q
cumulative Full year 1Q 2Q cumulative
3Q cumulative Full year 1Q 2Q
cumulative3Q
cumulative Full year 1Q
Net sales 186,218 62,177 132,765 80,211 144,980 36,809 73,911 114,334 144,573 16,173 37,781 76,109 107,744 32,051
Pachinko and Pachislot machine Business 108,139 18,310 51,552 37,027 62,407 13,021 29,568 47,542 61,658 1,171 2,893 18,263 33,292 9,116
Pachinko machines 75,823 13,698 44,428 22,199 45,569 9,861 17,243 24,227 35,357 479 1,280 16,303 20,625 6,378
Pachislot machines 31,607 4,379 6,702 14,639 16,509 3,098 12,189 23,129 26,059 637 1,513 1,740 12,344 2,683
Golf Business 78,078 43,866 81,213 43,183 82,573 23,788 44,342 66,791 82,914 15,001 34,888 57,845 74,452 22,934
Operating income 36,599 5,199 13,931 20,743 28,014 8,102 13,550 22,805 23,551 -4,415 -4,680 1,853 5,311 4,367
Pachinko and Pachislot machine Business 29,602 -749 7,149 15,666 20,791 3,294 7,946 14,075 17,450 -3,301 -5,795 -3,999 287 77
Pachinko machines 17,609 -1,278 7,025 8,585 15,260 2,127 1,874 2,212 5,120 -2,442 -4,837 -2,434 -2,332 -229
Pachislot machines 11,869 486 26 7,057 5,474 1,150 6,037 11,844 12,293 -859 -968 -1,601 2,570 296
Golf Business 10,935 7,530 9,930 6,761 10,599 5,661 7,194 11,153 9,286 -503 2,460 7,864 7,624 4,796
Eliminations & corporate expenses -3,937 -1,580 -3,147 -1,684 -3,376 -853 -1,590 -2,423 -3,185 -611 -1,346 -2,010 -2,600 -507
Operating income ratio 19.7% 8.4% 10.5% 25.9% 19.3% 22.0% 18.3% 19.9% 16.3% -27.3% -12.4% 2.4% 4.9% 13.6%
Ordinary income 35,655 5,009 13,105 20,350 27,451 8,172 13,532 22,590 23,278 -4,491 -4,694 2,388 5,799 4,331
Profit attributable to owners of parent 27,058 2,122 6,799 13,489 16,341 5,857 9,407 15,296 15,872 -5,813 -6,179 -2,528 865 2,633
SGA expenses 37,447 15,001 30,652 12,939 27,822 6,716 16,698 24,686 32,760 5,552 11,176 17,401 23,723 5,509
Personnel expenses 7,207 3,049 6,211 3,052 6,356 1,423 2,864 4,288 5,985 1,395 2,804 4,199 5,676 1,361
Selling expenses 9,898 2,926 6,928 3,680 7,294 928 3,544 5,570 7,803 179 815 1,659 2,942 508
Advertising expenses 2,842 849 2,368 742 2,179 288 698 1,699 1,950 107 338 569 795 174
Sales commissions 2,858 436 1,135 1,131 1,660 316 886 1,529 1,885 38 104 352 921 230
General expenses 20,341 5,576 17,512 6,207 14,171 4,363 10,290 14,827 18,972 3,948 7,556 11,592 15,103 3,639
R&D expenses 12,841 5,017 10,832 2,972 7,881 2,815 7,303 10,268 12,680 2,806 5,176 7,627 9,949 2,212
Depreciation & amortization 11,098 5,017 10,740 4,773 9,868 2,016 4,171 6,428 8,745 1,958 4,052 6,424 9,016 2,373
Capital investment 14,050 10,044 14,166 4,038 7,091 2,943 5,360 7,257 9,667 2,631 4,167 5,495 6,921 2,762
Consolidated
Copyright Heiwa Corporation 2021
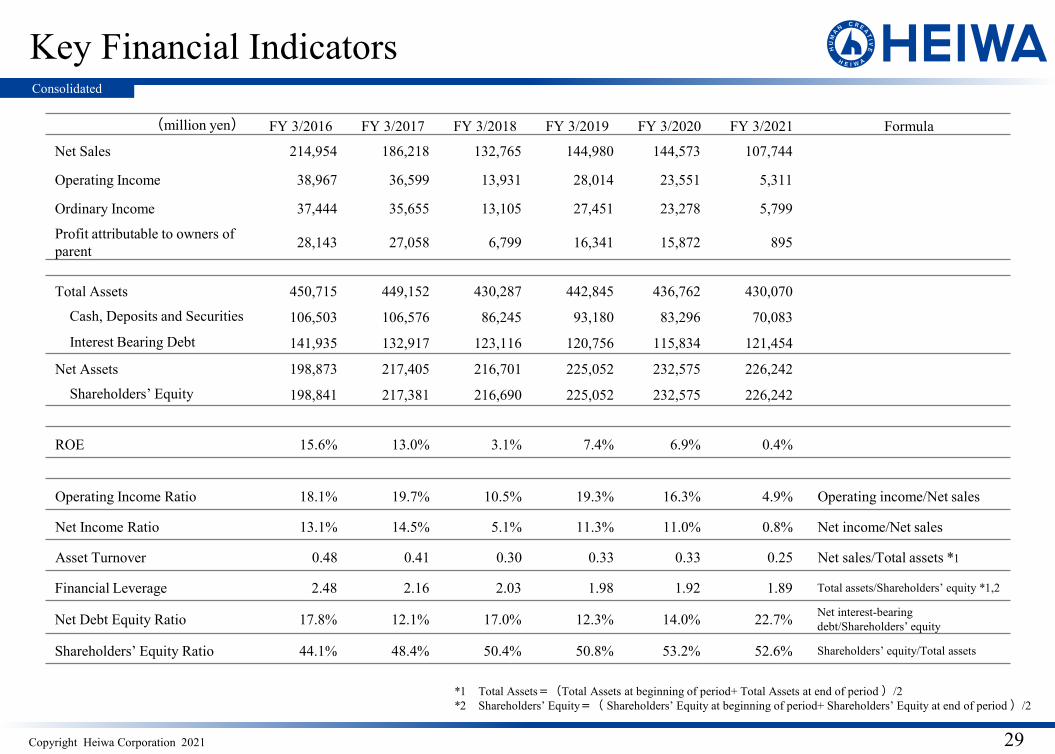
Key Financial Indicators
29
Consolidated
(million yen) FY 3/2016 FY 3/2017 FY 3/2018 FY 3/2019 FY 3/2020 FY 3/2021 Formula
Net Sales 214,954 186,218 132,765 144,980 144,573 107,744
Operating Income 38,967 36,599 13,931 28,014 23,551 5,311
Ordinary Income 37,444 35,655 13,105 27,451 23,278 5,799
Profit attributable to owners of parent 28,143 27,058 6,799 16,341 15,872 895
Total Assets 450,715 449,152 430,287 442,845 436,762 430,070
Cash, Deposits and Securities 106,503 106,576 86,245 93,180 83,296 70,083
Interest Bearing Debt 141,935 132,917 123,116 120,756 115,834 121,454
Net Assets 198,873 217,405 216,701 225,052 232,575 226,242
Shareholders’ Equity 198,841 217,381 216,690 225,052 232,575 226,242
ROE 15.6% 13.0% 3.1% 7.4% 6.9% 0.4%
Operating Income Ratio 18.1% 19.7% 10.5% 19.3% 16.3% 4.9% Operating income/Net sales
Net Income Ratio 13.1% 14.5% 5.1% 11.3% 11.0% 0.8% Net income/Net sales
Asset Turnover 0.48 0.41 0.30 0.33 0.33 0.25 Net sales/Total assets *1
Financial Leverage 2.48 2.16 2.03 1.98 1.92 1.89 Total assets/Shareholders’ equity *1,2
Net Debt Equity Ratio 17.8% 12.1% 17.0% 12.3% 14.0% 22.7% Net interest-bearing debt/Shareholders’ equity
Shareholders’ Equity Ratio 44.1% 48.4% 50.4% 50.8% 53.2% 52.6% Shareholders’ equity/Total assets
*1 Total Assets=(Total Assets at beginning of period+ Total Assets at end of period )/2*2 Shareholders’ Equity=( Shareholders’ Equity at beginning of period+ Shareholders’ Equity at end of period )/2
Copyright Heiwa Corporation 2021 30
Contact / Disclaimer
Management Planning Group, Heiwa CorporationTEL: +81-3-3839-0701Website: https://www.heiwanet.co.jp
1. These materials are not for the purpose of soliciting investment.2. These materials contain statements about the future, such as plans, outlooks, targets, and
forecast figures; however said statements are based on judgements and assumptions that are based on information that is currently available, and do not account for latent risks and uncertainties. Therefore, please be aware that actual future results may differ greatly from the aforementioned statements about the future due to the future business environment, economic conditions, financial market conditions, and a number of other factors.
3. The Company will not update these materials, even if the future outlook is revised.
Contact
Disclaimer


