27
Peter Birtles, Managing Director David Burns, Chief Financial Officer 21st August 2015 Results for the 52 weeks to 27 June 2015
Peter Birtles, Managing Director David Burns, Chief Financial Officer
21st August 2015
Results for the 52 weeks to 27 June 2015

2014/15 Financial Results 2015/16 Outlook Group Strategy
2
Contents

3 Group Highlights
• Normalised NPAT of $106.3m. After adjusting for one-off costs relating to restructuring and discontinued businesses, a NPAT attributable to members of $81.1 million – Refer Segment Note
• 7.1% increase in Group sales to $2.24 billion
• 3.2% increase in Supercheap Auto EBITDA to $119.4 million
• 10.8% increase in Rebel and Amart Sports EBITDA to $93.2 million
• Positive like for like sales in the Leisure Retailing division in the second half
• Earnings per share from continuing operations of 49.4 cents
• Dividend maintained at 40.0 cents per share, no change year on year
• $90 million invested in future growth in new and refurbished stores and the development of multi-channel business capabilities
• Costs of $12.8 million associated with the restructuring of the Ray’s Outdoors and Workout World businesses and $16.2 million loss associated with the discontinued FCO business
• Group Total Segment Sales up by 7.1%
• Normalised NPAT down by 5.3%
• NPAT attributable to members down by 25.2%
• Operating Cash flow up by 8.9%
Sales LFL % 14/15 13/14 12/13 11/12 10/11
SCA 2.2% 2.4% 5.0% 3.9% 4.8%
Leisure* (0.6%) (0.8%) 2.9% 6.5% 4.6%
Sports^ 6.6% 2.6% 8.0% 5.8% -
* BCF only until 11/12, BCF and Ray’s onwards ^ Sports represents Rebel and Amart only

4 Performance Trends
• * Historical EPS adjusted to take into account the bonus element in the 2011 entitlement offer • Jun 15 continuing operations only; June 14 not adjusted for discontinued operations
• Post Tax ROC adjustment due to capital calculation reclassification • Jun-15 continuing operations only; June 14 not adjusted for discontinued operations
625 715 829 938 1,092
1,654
2,020 2,112 2,239
Jun 07 Jun 08 Jun 09 Jun 10 Jun 11 Jun 12 Jun 13 Jun 14 Jun 15
Reported Sales ($m)
19.5 22.6
28.1 32.1
40.9 46.4
52.3 55.1
49.4
Jun 07 Jun 08 Jun 09 Jun 10 Jun 11 Jun 12 Jun 13 Jun 14 Jun 15
Reported EPS (c)*
38.1 45.7 55.1 65.8
87.5
140.7
172.3 182.6
170.2
Jun 07 Jun 08 Jun 09 Jun 10 Jun 11 Jun 12 Jun 13 Jun 14 Jun 15
Reported Total Segment EBIT ($m)
13.9 14.1 15.4
16.8 17.3 15.9
12.6 11.3 10.6
Jun 07 Jun 08 Jun 09 Jun 10 Jun 11 Jun 12 Jun 13 Jun 14 Jun 15
Reported Post Tax ROC (%)
5 Group Results
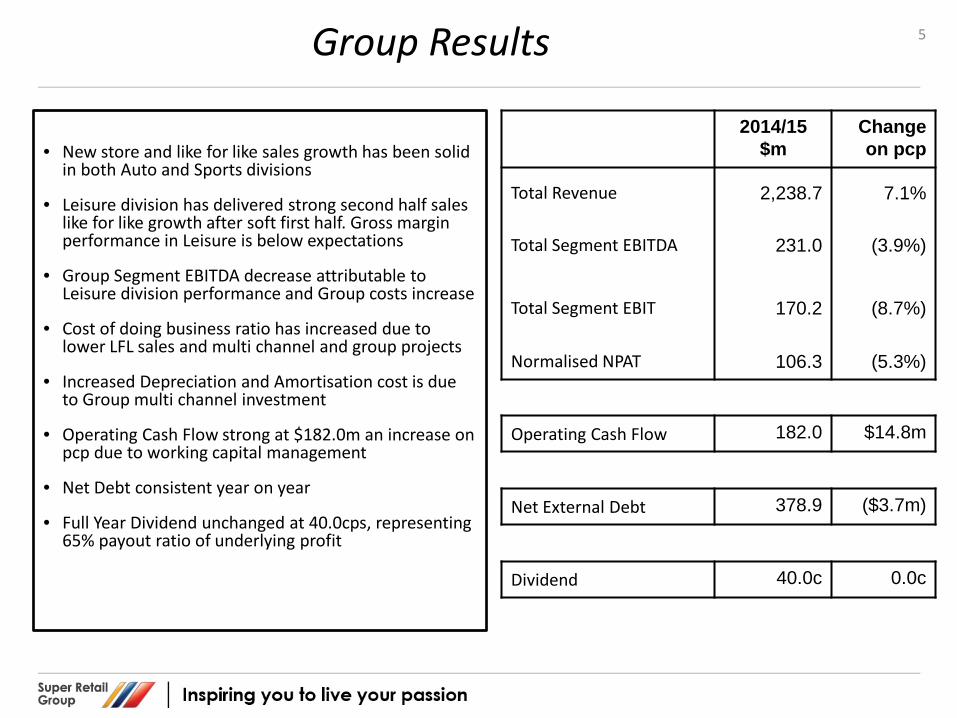
• New store and like for like sales growth has been solid
in both Auto and Sports divisions
• Leisure division has delivered strong second half sales like for like growth after soft first half. Gross margin performance in Leisure is below expectations
• Group Segment EBITDA decrease attributable to Leisure division performance and Group costs increase
• Cost of doing business ratio has increased due to lower LFL sales and multi channel and group projects
• Increased Depreciation and Amortisation cost is due to Group multi channel investment
• Operating Cash Flow strong at $182.0m an increase on pcp due to working capital management
• Net Debt consistent year on year
• Full Year Dividend unchanged at 40.0cps, representing 65% payout ratio of underlying profit
2014/15 $m
Change on pcp
Total Revenue 2,238.7 7.1%
Total Segment EBITDA 231.0 (3.9%)
Total Segment EBIT 170.2 (8.7%)
Normalised NPAT 106.3 (5.3%)
Operating Cash Flow 182.0 $14.8m
Net External Debt 378.9 ($3.7m)
Dividend 40.0c 0.0c
6 Segment Results 2014/15 2013/14
$m Sales Segment EBIT
Sales Segment EBIT
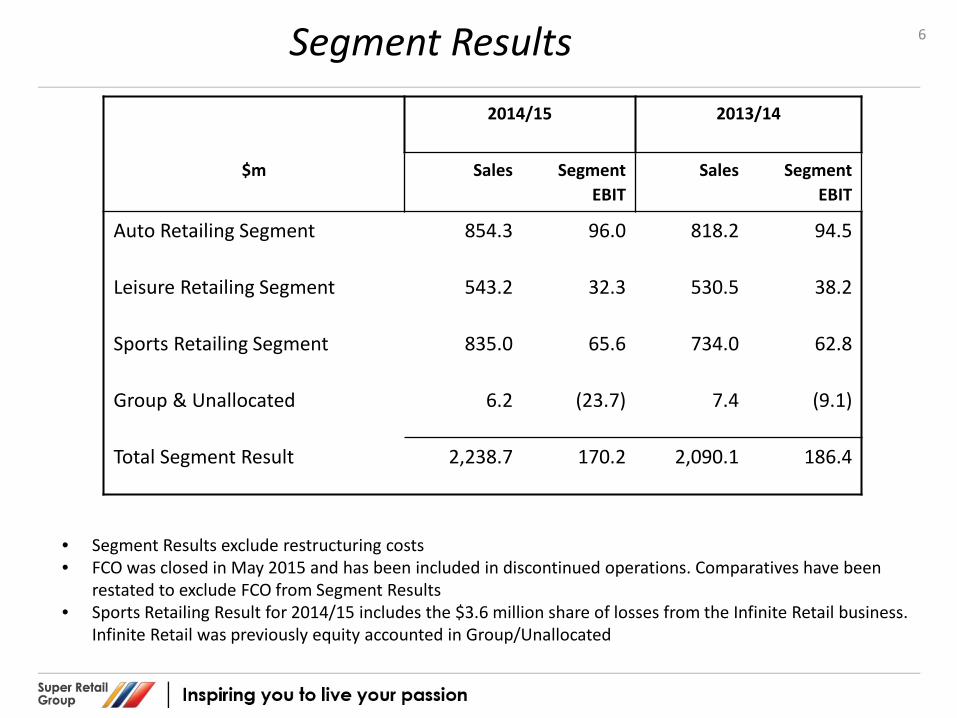
Auto Retailing Segment 854.3 96.0 818.2 94.5
Leisure Retailing Segment 543.2 32.3 530.5 38.2
Sports Retailing Segment 835.0 65.6 734.0 62.8
Group & Unallocated 6.2 (23.7) 7.4 (9.1)
Total Segment Result 2,238.7 170.2 2,090.1 186.4
• Segment Results exclude restructuring costs • FCO was closed in May 2015 and has been included in discontinued operations. Comparatives have been
restated to exclude FCO from Segment Results • Sports Retailing Result for 2014/15 includes the $3.6 million share of losses from the Infinite Retail business.
Infinite Retail was previously equity accounted in Group/Unallocated

7 Auto Retailing
• Divisional result includes Supercheap Auto and Auto Trade Direct (not material at this stage)
• Strong sales growth from 9 new stores and like for like sales growth momentum of 2.2% on pcp
• Sales growth was delivered in all categories with the exception of Tools
• Sales growth was achieved in New Zealand and all Australian states except Queensland
• Sales growth attributable to average transaction value growth
• Gross margin improvement driven by pricing and promotional management, trading terms, overseas sourcing, own brand development and product quality
• Cost of doing business increased due to cost of new store openings partially offset by efficiencies in marketing and general cost saving initiatives
• 9 new stores, 29 stores refurbished including 2 as Superstores – 300 stores at June 2015
2014/15
$m
change on pcp
Sales 854.3 4.4%
LFL Sales growth 2.2%
Gross margin % 44.7% 0.2%
Segment EBITDA 119.4 3.2%
EBITDA margin 14.0% -0.1%
Segment EBIT 96.0 1.6%
Segment EBIT margin 11.2% -0.3%

8 Leisure Retailing
• Like for like sales results in the second half has seen a recovery of positive sales momentum in BCF after negative growth in half one
• Ray’s has experienced strong like for like sales growth in the second half due to the inventory clearance program to reposition the business
• Gross margin compression reflects the impact of BCF competitive pricing initiative and the dilutive impact of the Ray’s inventory clearance program
• Strong cost control has partially mitigated the impact of negative sales growth
• Depreciation and amortisation costs attributable to store rollout and investment in Group programs have materially impacted EBIT margin
• Key focus for Ray’s has been the clearance program to reposition the business for future growth. Three pilot stores are in development for opening in second quarter of 2015/16
• 3 new BCF stores were opened during the period. Four Ray’s stores were closed during the period to bring total stores to 117 BCF and 53 Ray’s
• Ray’s restructuring costs are not included in the segment result
2014/15
$m
change on pcp*
Sales 543.2 2.4%
LFL Sales growth -0.6%
Gross margin % 44.2% -1.0%
Segment EBITDA 48.8 -6.3%
EBITDA margin 9.0% -0.8%
Segment EBIT 32.3 -15.4%
Segment EBIT margin
5.9% -1.3%
* Change in pcp referencing BCF and Ray’s only

9 Sports Retailing
• Sales growth in Rebel and Amart Sports has been
strong with robust like for like growth supported by new store sales
• Lower gross margin reflects strong growth in lower margin categories (e.g. fitness technology), promotional activity and first half clearance of excess inventory
• Strong operating cost controls have supported an increase in EBITDA and EBIT margin
• Aged stock maintained below 5%
• Six new Amart Sports stores were opened in the period and two Rebel stores and two Amart stores were closed. Seven stores were refurbished. Total store numbers at June 2015 are 90 Rebel, 1 RebelFit and 56 Amart Sports stores
• A restructure of Workout World to integrate it into Rebel commenced in May 2015 with the closure of 5 stores this year and a further 5 stores in the new financial year. Restructure costs have not been included in the segment result
• Infinite Retail (formerly VBM Retail) is 50.05% owned by the Group since July 2014 and is consolidated into the Sports Segment Result net of non controlling interest. Costs and adjustments recognised on integrating the business have resulted in a share of loss of $3.6m
2014/15
$m
change on pcp
Rebel and Amart
Sales 783.6 8.6%
LFL Sales growth 6.6%
Gross margin % 44.9% -1.0%
EBITDA 93.2 10.8%
EBITDA margin 11.9% 0.2%
EBIT 73.8 11.5%
EBIT margin 9.4% 0.2%
Workout World and Infinite Retail
EBIT -8.2
Segment EBIT 65.6 4.5%

10 Group & Unallocated
2014/15
$m
change on pcp
Sales 6.2 -16.2%
$m
Gross Margin (12.7) (6.4)
EBITDA (23.0) (14.9)
EBIT (23.7) (14.6)
Comprising:
Corporate costs (5.5) 0.3
Multi-Channel & Un-utilised storage
(12.4) (2.6)
Group projects & other (5.8) (1.4)
Net tax and Revenue Adjustment
0.0 (10.9)
• Group and Unallocated includes SRG Commercial, consolidated investment in Oceania Bicycles, Fixed Price Car Service and Group costs not allocated to segments
• Unallocated Group costs include public company activities, un-utilised DC space, costs relating to the Group development initiatives and project related costs
• Development Programs include: • Supply Chain projects to deliver multi user
distribution centres in Sydney and Brisbane • Inventory planning and management system • Information systems transformation • Change management • Ray’s Outdoors strategic review
• The Group have invested in a number of small businesses that are in early development phase. These businesses are focused on digital opportunities and included in project results
• The prior comparative period included a net tax and revenue benefit that is not repeated in the current year

11 Group Cash Flow
• Strong underlying operating cash flow performance has funded investment in new stores and multi-channel development program
• New and refurbished store investment of $53.0m is fully funded out of operating cash flows. Store refurbishment returns continue to be strong
• Investment in new and refurbished store capex is split:
$20.5m in Auto $5.8m in Leisure $12.5m in Sports
• Investment in other capital projects relates to: • DC network expansion (Brendale Qld) • Inventory management capability (JDA) • General IT projects.
• The completion of the Brendale distribution centre mobilisation represents the peak capital and operating cost expenditures associated with the supply chain program
Jun 15
$m
Jun 14
$m
Operating cash flow
(pre store set up investment)
196.2 186.9
Store set up investment (14.2) (19.7)
Business acquisition 0.0 0.0
Operating cash flow 182.0 167.2
Investing activities:
Store fitout (38.8) (45.6)
Other Capex (33.1) (65.0)
Business acquisition 0.0 (4.4)
Loans to related party 0.0 (3.7)
Financing activities:
Dividends & interest (100.5) (105.6)
Ext Debt (repay)/proceeds (20.6) 58.7
Net Cash flow (11.0) 1.6

12 Group Balance Sheet
• SCA average inventory per store is 2% higher than
pcp due to the impact of increased imported product and falling AUD offset by inventory improvement initiatives
• Leisure average inventory per store is 4% higher than pcp due to the impact of AUD currency, direct to store conversion to distribution centre program temporarily increasing inventory offset by inventory improvement initiatives
• Sports inventory per store was unchanged to pcp. Increases in private and exclusive brand ranges have higher inventory levels which have been offset by inventory improvement initiatives. The initiatives have delivered good stock health with aged inventory remaining below 5%.
• Trade Creditor performance is consistent with the prior comparative period
• Increase in Plant & Equipment primarily relates to ongoing capital expenditure in new and refurbished stores and the Brendale DC
• Net debt is slightly favourable to pcp
Jun 15
$m
Jun 14
$m
Inventory
- Auto Retailing
- Leisure Retailing
- Sports Retailing
- Group & Unallocated
183.3
153.8
161.8
6.7
173.7
159.8
151.2
5.4
Total 505.6 490.1
Trade and other payables (268.6) (271.4)
Net inventory investment 237.0 218.7
Property, Plant and Equipment & Computer Software
311.2 302.5
Net External Debt 378.9 382.6

13 Returns & Capital Ratios
2015
2014
EPS – Continuing operations 49.4c 57.0c
EPS – Total 41.2c 55.1c
Fixed charge cover
(continuing operations)
1.84x
1.97x
Average Net Debt $435m $420m
2015
2014
Net debt : capital
- Headline
- Adjusted^
33.1%
68.4%
33.5%
66.9%
Reported Annualised post tax ROC
10.6% 11.3%
• EPS ratio decline is consistent with profit performance
• The Group undertook a modification of its debt facility in the year. The facility limit has been increased to $635m and extended a further 12 months
• Average Net Debt levels are slightly above prior comparative period. The Group continues to operate within banking covenants
• Return on Capital remains below targeted level, but remains above the WACC
• Effective AUD/USD rate for the period was 0.86, down from 0.91 in pcp. The 2015/16 AUD/USD hedge rate circa 0.79
• Effective tax rate for the period was 29.3% - full year 2015/16 rate expected to be 30%
• ^Adjusted capital includes leases capitalised into debt at 6x annual charge

14
Segment Note 2014/15 For the period ended 27 June 2015
Auto $m
Leisure. $m.
Sports. $m.
Total. continuing. operations.
$m.
Inter-segment. eliminations/.
unallocated. $m
Consolidated. $m.
Segment Revenue and Other Income External segment revenue 854.3 543.2 835.0 2,232.5 8.2 2,240.7 Inter segment sales - - - - (2.0) (2.0) Other income 0.7 - 0.9 1.6 0.9 2.5 Total segment revenue and other income 855.0 543.2 835.9 2,234.1 7.1 2,241.2 Segment EBITDA(1) 119.4 48.8 85.8 (6) 254.0 (23.0) 231.0 Segment depreciation and amortisation(2) (23.4) (16.5) (20.2) (60.1) (0.7) (60.8) Segment EBIT result 96.0 32.3 65.6 193.9 (23.7) 170.2 Net finance costs(3) (21.6) Total segment NPBT 148.6 Segment income tax expense(4) (42.3) Normalised NPAT 106.3 Other items not included in the total segment NPAT(5) (9.0) Loss from discontinuing operations (16.2) Profit for the period attributable to:
Owners of Super Retail Group Limited Non-controlling interests
81.1 (4.2)
Profit for the period 76.9
(1)Adjusted for business restructuring costs for continuing operations and discontinuing operations (2014: nil). (2)Adjusted for expenses pertaining to discontinued operations of $5.9 million (2014: nil) and business restructuring costs for continuing operations of $0.4m (2014: nil). (3)Adjusted for non-controlling interest (NCI) interest of $0.3 million (2014: nil). (4)Segment income tax expense of $42.3 million excludes $3.8 million relating to the tax effect of business restructuring costs with a value of $12.8 million, refer to Annual
Report note 4(b)(i) Business restructuring (2014: nil). (5)Includes $12.8 million of business restructuring costs, the related income tax effect of $3.8 million (2014: nil). (6) Sports Retailing EBITDA of $85.8 million consists of $93.2 million from Rebel and Amart and a combined loss of $7.4 million for Workout World and Infinite Retail.

15
Segment Note 2013/14 For the period ended 28 June 2014
Auto $m
Leisure. $m.
Sports. $m.
Total. continuing. operations.
$m.
Inter-segment. eliminations/.
unallocated. $m
Consolidated. $m.
Segment Revenue and Other Income External segment revenue 818.2 530.5 734.0 2,082.7 8.5 2,091.2 Inter segment sales - - - - (1.1) (1.1) Other income 1.5 - 0.6 2.1 9.5 11.6 Total segment revenue and other income 819.7 530.5 734.6 2,084.8 16.9 2,101.7 Segment EBITDA(1) 115.7 52.1 80.6 248.4 (8.1) 240.3 Segment depreciation and amortisation(2) (21.2) (13.9) (17.8) (52.9) (1.0) (53.9) Segment EBIT result 94.5 38.2 62.8 195.5 (9.1) 186.4 Net finance costs(3) (24.0) Total segment NPBT 162.4 Segment income tax expense(4) (50.2) Normalised NPAT 112.2 Other items not included in the total segment NPAT(5) - Loss from discontinuing operations (3.8) Profit for the period attributable to:
Owners of Super Retail Group Limited Non-controlling interests
108.4 -
Profit for the period 108.4 (1)Adjusted for business restructuring costs for continuing operations and discontinuing operations (2014: nil). (2)Adjusted for expenses pertaining to discontinued operations of $5.9 million (2014: nil) and business restructuring costs for continuing operations of $0.4m (2014: nil). (3)Adjusted for non-controlling interest (NCI) interest of $0.3 million (2014: nil). (4)Segment income tax expense of $42.3 million excludes $3.8 million relating to the tax effect of business restructuring costs with a value of $12.8 million, refer to Annual
Report note 4(b)(i) Business restructuring (2014: nil). (5)Includes $12.8 million of business restructuring costs, the related income tax effect of $3.8 million (2014: nil).

2014/15 Financial Results 2015/16 Outlook Group Strategy
16
Contents

17
Looking Forward Auto Retailing • LFL sales growth in the first 7 weeks of 15/16 circa 2.5% • Gross margin tracking up on PCP in the first 7 weeks • SCA store development: plan to open 15 new stores, 65 refurbishments, extensions and relocations
Leisure Retailing • LFL sales growth in the first 7 weeks of 15/16 circa 10%, reflecting strong performance in BCF and the clearance
program in Ray’s Outdoors • Gross margin tracking below PCP in the first 7 weeks reflecting BCF competitive pricing and Ray’s clearance
program • Plan to open 5 new BCF stores and complete 20 BCF refurbishments • Ray’s transformation on track with 5 initial pilot stores (3 existing and 2 new) scheduled for September and
October
Sports Retailing • LFL Rebel and Amart Sports sales growth in the first 7 weeks of 15/16 circa 4.5% • Gross margin tracking up on PCP in the first 7 weeks • Plan to open 8 new stores, close 3 stores and refurbish 12 stores across the Rebel and Amart Sports businesses • Workout World and Infinite Retail targeting to be broadly break even
Group • Supply chain development costs expected to be circa $10m • Other development projects expected to be circa $2m • Other Group Costs expected to be circa $7m • Planned full year capital expenditure circa $100m to support new stores, refurbishment programs and digital
investment
2015/16 – Is a 53 week year • Impact on sales – additional circa $40m • Impact on EBIT – insignificant • Impact on Net Debt – increase of $70m

2014/15 Financial Results 2015/16 Outlook Group Strategy
18
Contents

Our Purpose
Our Goals
INSPIRING YOU TO LIVE YOUR PASSION
TO PROVIDE SOLUTIONS AND ENGAGING EXPERIENCES THAT ENABLE OUR CUSTOMERS TO MAKE THE MOST OF THEIR LEISURE TIME
To be one of the 5 largest Australasian
retail companies
To achieve the highest Team Member
engagement across the retail industry
To achieve higher customer engagement
ratings than our competitors
To provide returns to our shareholders
that exceed the ASX 200 by 5%
19
Our Vision
Our Values
PASSION OPENNESS INTEGRITY CARE DISCIPLINE
To deliver compound annual growth in EPS of
greater than 15%
To grow return on capital to greater than 15%
Our Financial Targets
Our Strategic Roadmap

Our Strategic Programs
20
Understanding our
Customers
Engaging and inspiring our Customers
Developing Innovative
and Relevant Solutions
Building Leading
Private & Exclusive Brands
Engaging and developing our Team
Optimising our Supply
Chain
Business Agility
Digital Capability
Data Management
IS Transformation
Sports Systems - Supero Ray’s Transformation
Auto
Our Strategic Pillars
Strengthening Our
Foundation
Our Delivery
Inventory Management
Leisure Sports Commercial

Auto Retailing – Key Strategic Initiatives
NETWORK EXPANSION (350 STORES)
LFL SALES GROWTH (> 3% PA)
EBIT MARGIN (12%)
PRE TAX ROC (> 40%)
(5 year goal)
21
Understanding our Customers
• SCA club + membership now at over 1.3 million - 1.1 million active • Understanding and meeting needs of 2 new customer types ‘Alex’ and
‘Kathy’ representing a significant market opportunity • Use of customer analytics to drive marketing and ranging
Engaging and Inspiring our Customers
• Rollout of store of the future at 50 stores per annum • Further development of on line offer and content • Development of services in store and out of store • Continued move from traditional media to direct marketing • Auto Trade Direct being more closely integrated with Supercheap Auto
Innovative and Relevant Solutions
• Maintaining 25% of range being refreshed each year • JDA planning and replenishment system benefits realisation • Targeting inventory turns of 3x
Leading Private and Exclusive Brands
• Targeting up to 50% of the range being private and exclusive brands • Continued move to category specific private brands

Leisure Retailing – Key Strategic Initiatives
NETWORK EXPANSION (220 STORES)
LFL SALES GROWTH (> 3% PA)
EBIT MARGIN (11%)
PRE TAX ROC (> 30%)
(5 year goal)
22
Understanding our Customers
• BCF / Rays club membership now at 3.0 million - 1.4 million active • Developing Rays Outdoors offer to meet the needs of the target customer
groups – the ‘Traditionalist’, the ‘Socialiser’, the ‘Progressive’ • Use of customer analytics to drive marketing and ranging
Engaging and Inspiring our Customers
• Ray’s restructure pilot new concepts and rollout through whole network • BCF new store formats –20 stores refurbished in FY 16 • Further development of on line offer and content • Continued move from traditional media to direct marketing
Innovative and Relevant Solutions
• Maintaining 25% of range being refreshed each year • Development of camping, travel, caravanning and apparel ranges • Leveraging JDA planning and replenishment system • Targeting inventory turns of 3x
Leading Private and Exclusive Brands
• Targeting up to 30% of the range being private and exclusive brands • Continued move to category specific private brands rather than generic
house brands

Sports Retailing – Key Strategic Initiatives
NETWORK EXPANSION (250 STORES)
LFL SALES GROWTH (> 4% PA)
EBIT MARGIN (11%)
PRE TAX ROC (> 21%)
(5 year goal)
23
Understanding our Customers
• Rebel / Amart club membership now at 2.6 million – 1.4 million active • Use of customer analytics to drive marketing and ranging
Engaging and Inspiring our Customers
• Amart store rollout and Rebel store refurbishments • Testing new formats – ‘Rebel ‘ high street format and Amart Sports local • Rebranding Workout World and integrating with Rebel • Further development of on line offer and content – targeting 10% of sales • Continued move from traditional media to direct marketing
Innovative and Relevant Solutions
• Development of athletic footwear, football, training apparel, supporter wear, cycling and fitness
• Implementation of assortment planning system • Targeting inventory turns of 3x
Leading Private and Exclusive Brands
• Targeting up to 25% of the range being private and exclusive brands • Focus on private brands in equipment and fitness and exclusive brands in
footwear and apparel

Commercial
B2B INTERFACE
SALES TARGET $50M +
PRE TAX ROC (> 21%)
(5 year goal)
24
Wholesale
• Opportunities across all Group categories • Centred around Group’s private label products
Insurance
• $15m opportunity • Providing gift cards or replacement products to major insurers to assist in
claims settlement
Petrol and Convenience
• $100m accessible market • Targeting 25% market share • Ramp up of BP pilot
Rewards and Incentives
• Providing gift card solutions for corporates developing reward and incentive programs
• Benefits in results of brand issuing the gift cards
Digital models
• Fixed Price Car Service • Camping services

Supply Chain and Inventory Management (3 year goal)
Inventory Management
• Bedding down of JDA systems in Auto and Leisure and implementation of JDA into Sports
• Clear, time-phased inventory reduction targets as part of enhanced sales & operational planning process
• Improvement targets:- Leisure 30%; Auto 10%; Sports 5%
Optimising our Supply Chain
• Optimising multi-user DC network – productivity and utilisation
• Freight optimisation – network, primary and secondary freight
• Direct to store conversion to DC replenishment
• International store ready
• Supply methods including integrated offshore logistics hubs
• Enhanced management systems for inventory and supply chain to provide greater visibility of cost and performance
• Development of multi channel fulfilment capability
• Sports migration from 3PL (Third Party Logistics)
25
SUPPLY CHAIN COSTS REDUCED BY 1% OF SALES
STOCK TURNS OF >3 ACROSS
THE GROUP
IN STOCK LEVELS >
96.5%

Engaging and Developing our Team (5 year goal)
26
Engaging and Developing our Team
• Cultural Paradigm shifts – Customer Centricity, Collaboration, Change Leadership
• Attraction: Group wide opportunities, remuneration structures, social media, cultural
• Engagement: Engagement survey actions, reward and recognition, communication
• Safety: Active leadership, risk management, reporting, education, wellbeing program
• Capability and Succession: learning and development programs, performance management and succession planning systems, learning management system
• Diversity: recruitment, flexibility, internal development
RETENTION> 75%
ENGAGEMENT>70%
SUCCESSION> 70%
SAFETY 30% pa
DIVERSITY > 40%
ATTRACTION < 4 weeks

Delivering our Financial Targets
Opportunities
• Growing store numbers to over 800 • Delivering LFL growth of 3% to 4% • Eliminate Group transformation costs • Deliver $20m saving in supply chain costs • Grow private brand to hit divisional targets • Reposition Ray’s • Amart Sports scale and profitability in new markets • Workout World integration into Rebel • Group costs efficiencies targeting $10m • Achieve $75m to $100m working capital savings • Range management and sourcing initiatives • Effective change management
Challenges
• Lower domestic growth • Consumer confidence • Weakening Australian dollar • Competitive intensity • Investment in in-store customer experience • Investment in digital capability
27
To deliver compound annual growth in EPS of
greater than 15%
To grow return on capital to greater than 15%


