29
November 1, 2013 IR Meeting (FY2014/3 2Q) West Japan Railway Company Results for the first half ended September 30, 2013 and Future Initiatives

November 1, 2013
IR Meeting (FY2014/3 2Q)
West Japan Railway Company
Results for the first half ended September 30, 2013
and Future Initiatives

1
Ⅰ. Results for the first half
and forecasts for FY2014/3
2
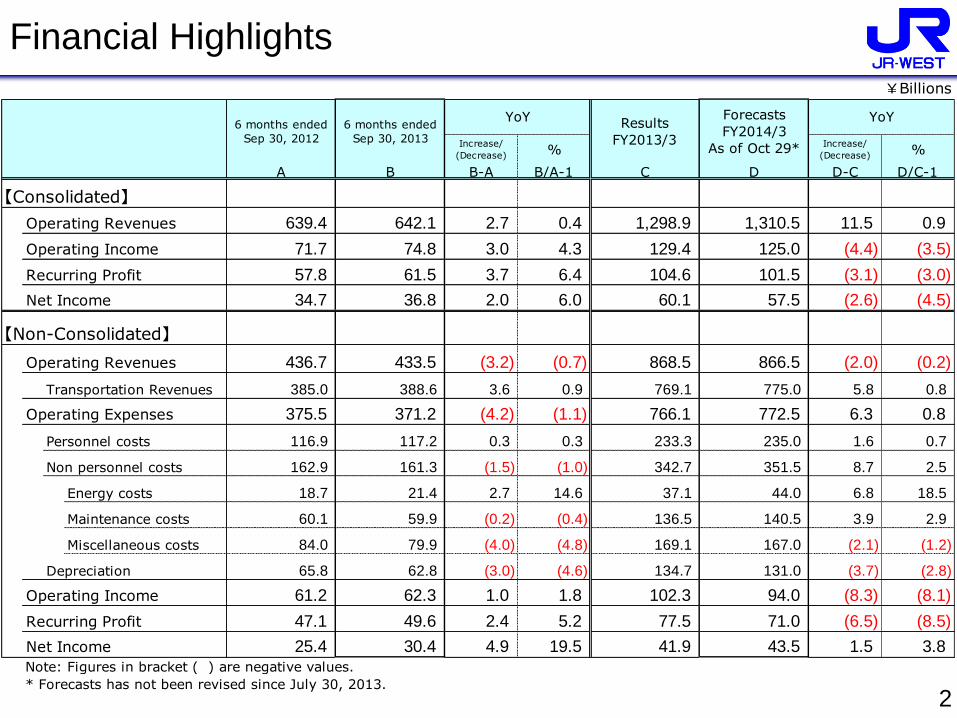
Financial Highlights
¥Billions
Increase/
(Decrease) %Increase/
(Decrease) %
A B B-A B/A-1 C D D-C D/C-1
639.4 642.1 2.7 0.4 1,298.9 1,310.5 11.5 0.9
71.7 74.8 3.0 4.3 129.4 125.0 (4.4) (3.5)
57.8 61.5 3.7 6.4 104.6 101.5 (3.1) (3.0)
34.7 36.8 2.0 6.0 60.1 57.5 (2.6) (4.5)
436.7 433.5 (3.2) (0.7) 868.5 866.5 (2.0) (0.2)
385.0 388.6 3.6 0.9 769.1 775.0 5.8 0.8
375.5 371.2 (4.2) (1.1) 766.1 772.5 6.3 0.8
116.9 117.2 0.3 0.3 233.3 235.0 1.6 0.7
162.9 161.3 (1.5) (1.0) 342.7 351.5 8.7 2.5
Energy costs 18.7 21.4 2.7 14.6 37.1 44.0 6.8 18.5
Maintenance costs 60.1 59.9 (0.2) (0.4) 136.5 140.5 3.9 2.9
Miscellaneous costs 84.0 79.9 (4.0) (4.8) 169.1 167.0 (2.1) (1.2)
65.8 62.8 (3.0) (4.6) 134.7 131.0 (3.7) (2.8)
61.2 62.3 1.0 1.8 102.3 94.0 (8.3) (8.1)
47.1 49.6 2.4 5.2 77.5 71.0 (6.5) (8.5)
25.4 30.4 4.9 19.5 41.9 43.5 1.5 3.8Note: Figures in bracket ( ) are negative values.
* Forecasts has not been revised since July 30, 2013.
6 months ended
Sep 30, 2012
6 months ended
Sep 30, 2013
YoY Results
FY2013/3
Forecasts
FY2014/3
As of Oct 29*
YoY
【Consolidated】
Operating Revenues
Operating Income
Recurring Profit
Net Income
【Non-Consolidated】
Operating Income
Recurring Profit
Net Income
Operating Revenues
Transportation Revenues
Operating Expenses
Personnel costs
Non personnel costs
Depreciation

3
Non-Consolidated Financial Results and Forecasts
¥Billions
Increase/
(Decrease) %Increase/
(Decrease) %
A B B-A B/A-1 C D D-C D/C-1
Operating Revenues 436.7 433.5 (3.2) (0.7) 868.5 866.5 (2.0) (0.2)
Transportation revenues 385.0 388.6 3.6 0.9 769.1 775.0 5.8 0.8
Other 51.7 44.9 (6.8) (13.2) 99.3 91.5 (7.8) (7.9)
Operating Expenses 375.5 371.2 (4.2) (1.1) 766.1 772.5 6.3 0.8
Personnel costs 116.9 117.2 0.3 0.3 233.3 235.0 1.6 0.7
Non personnel costs 162.9 161.3 (1.5) (1.0) 342.7 351.5 8.7 2.5
Energy costs 18.7 21.4 2.7 14.6 37.1 44.0 6.8 18.5
Maintenance costs 60.1 59.9 (0.2) (0.4) 136.5 140.5 3.9 2.9
Miscellaneous costs 84.0 79.9 (4.0) (4.8) 169.1 167.0 (2.1) (1.2)
Rental payments, etc. 11.9 11.8 (0.0) (0.3) 23.4 23.5 0.0 0.0
Taxes 17.9 17.9 (0.0) (0.1) 31.7 31.5 (0.2) (0.8)
Depreciation 65.8 62.8 (3.0) (4.6) 134.7 131.0 (3.7) (2.8)
Operating Income 61.2 62.3 1.0 1.8 102.3 94.0 (8.3) (8.1)
(14.0) (12.6) 1.3 (9.8) (24.7) (23.0) 1.7 (7.1)
Non-operating revenues 1.4 1.5 0.0 - 6.4 6.2 (0.2) -
Non-operating expenses 15.5 14.2 (1.2) - 31.1 29.2 (1.9) -
Recurring Profit 47.1 49.6 2.4 5.2 77.5 71.0 (6.5) (8.5)
2.8 (0.3) (3.2) - 0.1 - (0.1) -
Extraordinary profit 23.2 3.0 (20.2) - 39.9 - - -
Extraordinary loss 20.4 3.3 (17.0) - 39.7 - - -
Net Income 25.4 30.4 4.9 19.5 41.9 43.5 1.5 3.8
Note: Figures in bracket ( ) are negative values.
* Forecasts has not been revised since July 30, 2013.
Forecasts
FY2014/3
As of Oct 29*
YoY
Non-operating revenues
and expenses
Extraordinary profit
and loss, net
6 months ended
Sep 30, 2012
6 months ended
Sep 30, 2013
YoYResults
FY2013/3

4
Major Factors of Increase/Decrease in Transportation Revenues
¥Billions
Amount % Amount
Fundamentals 1.0% 1.7
Special factors
Three consecutive hollidays (Sep.) 0.6
Inbound demand 0.4
Competitive factors,etc. (0.7)
etc.
Fundamentals 0.8% 1.1
Special factors
Three consecutive hollidays (Sep.) 0.1
Opening of Grand Front Osaka 0.4
Fundamentals (0.6%) (0.3)
Special factors
Three consecutive hollidays (Sep.) 0.1
etc.
207.4 1.2 0.6
388.6 3.6 0.9
Note: Revenues from luggage transportation are omitted due to the small amount.
Figures in bracket() are negative values.
Total
Shinkansen 181.1
Conventional lines
Other
lines 59.9
Major factors
2.3 1.3
Results for 6 months ended Sep 30, 2013
YoY
Increase/(Decrease)Transportation
revenues
(0.3) (0.6)
Kansai Urban
Area
(Kyoto-Osaka-
Kobe Area)
147.5 1.6 1.1

5
Transportation Revenues and Passenger-Kilometers
Transportation Revenues Passenger-Kilometers
¥Billions Millions of passenger-kilometers
3.6 3.2 200 229
0.9% 1.6% 0.7% 1.6%
2.3 2.0 126 128
1.3% 2.2% 1.5% 2.9%
0.0 0.0 4 4
1.5% 2.4% 1.1% 2.4%
2.2 2.0 122 123
1.3% 2.2% 1.5% 2.9%
1.2 1.1 73 101
0.6% 1.1% 0.4% 1.1%
0.2 0.2 (3) 16
0.4% 0.6% (0.0%) 0.3%
1.0 0.9 77 85
0.8% 1.3% 1.0% 2.2%
1.6 1.2 66 84
1.1% 1.8% 0.5% 1.2%
0.2 0.1 1 15
0.4% 0.7% 0.0% 0.3%
1.4 1.0 64 68
1.6% 2.4% 1.3% 2.7%
(0.3) (0.1) 7 17
(0.6%) (0.5%) 0.2% 0.7%
0.0 0.0 (4) 0
0.1% 0.3% (0.2%) 0.1%
(0.4) (0.1) 12 16
(0.9%) (0.7%) 0.5% 1.3%
Note: Figures in bracket ( ) are negative values.
1,291 1,308
2,394 2,411
1,102 1,103
7,195 7,279
4,643 4,659
2,551 2,620
9,590 9,691
5,746 5,762
3,843 3,928
4,456 4,584
185 190
4,270 4,394
3 months (2Q)
(7/1~9/30)
FY2013/3 FY2014/3 YoY
14,046 14,275
31.6 31.5
6.8 6.8
24.8 24.6
197.2 200.4
92.3 94.4
44.6 45.7
74.4
28.5 28.7
Results for 6 months ended Sep 30
(4/1~9/30)
FY2013/3 FY2014/3 YoY
3 months (2Q)
(7/1~9/30)
FY2013/3 FY2014/3 YoY
Commuter
Passes
Non-Commuter
Passes
Results for 6 months ended Sep 30
(4/1~9/30)
FY2013/3 FY2014/3 YoY
Total
Shinkansen
Commuter
Passes
Non-Commuter
Passes
Conventional Lines
2,380
88.3
60.3Other Lines
2,27213.8
46.046.4 2,368
13.8
Commuter
Passes
Non-Commuter
Passes
Kansai Urban Area(Kyoto-Osaka-Kobe Area)
145.8
57.5
Non-Commuter
Passes
Commuter
Passes
89.7
59.9
178.8
388.6
4.6
5,013
4.6
8,595
385.0
135.8
73.1
181.1
2.2 2.3
90.0 92.0
104.8 106.0
176.4
206.1 207.4
174.2
35.3 35.5
69.5 70.4134.7
71.3 71.6
2,277
11,760
5,077
8,219
7,458
4,645
14,565
9,487
4,653
27,741
376
27,941
8,722
380
19,219
8,341
57.8
14,499
9,486
19,145
11,763
7,381
147.5

6
Transportation Revenue Forecasts
¥Billions
Increase/
(Decrease) %
A B B-A B/A-1
357.0 362.7 5.7 1.6
291.4 292.3 0.9 0.3
120.6 119.8 (0.7) (0.6)
412.0 412.2 0.1 0.0
769.1 775.0 5.8 0.8
Note: Revenues from luggage transportation are omitted due to the small amount.
Figures in bracket ( ) are negative values.
* Forecasts has not been revised since July 30, 2013.
Conventional lines
Transportation revenues
Results
FY2013/3
Forecasts
FY2014/3
As of Oct 29*
YoY
Shinkansen
Kansai Urban Area
(Kyoto-Osaka-Kobe Area)
Other lines

7
Major Factors of Increase/Decrease in Operating Expenses
(Non-consolidated) ¥Billions
Increase/
(Decrease) %
Note: Figures in bracket ( ) are negative values.
Total 371.2
(3.0)
(4.2)
(4.6)
(1.1)
Item
Results for 6 months ended Sep 30, 2013
YoYMajor factors
Depreciation and
amortization62.8 ・Progress of depreciation and amortization
Personnel costs 117.2・Increase in the rate of health insurance and
employees' pension insurance +0.6, etc.
Energy costs 21.4 ・Increase in electricity charges and fuel price +2.6, etc.
0.3
2.7
0.3
14.6
Maintenance
costs59.9
・Decrease in retirement costs of fixed assets (1.2)
・Decrease in removal costs, excluding contributions
from third parties (0.8)
・Difference in progress of maintenance work, etc.
Miscellaneous
costs79.9
・Decrease in payments for other JR companies (6.2)
・Increase in electricity charges and fuel price +0.4
・Increase in system related costs +0.2, etc.
(0.2)
(4.0)
(0.4)
(4.8)
Rental Payments,
etc11.8
Taxes 17.9
(0.0)
(0.0)
(0.3)
(0.1)
8
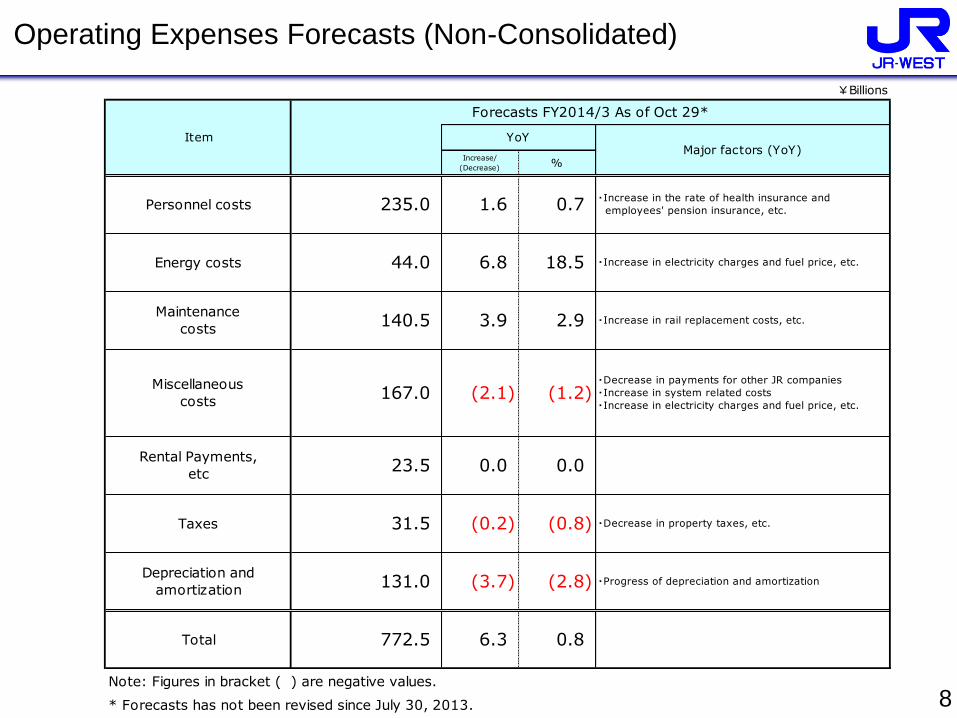
Operating Expenses Forecasts (Non-Consolidated)
¥Billions
Increase/
(Decrease)%
Note: Figures in bracket ( ) are negative values.
* Forecasts has not been revised since July 30, 2013.
Total 772.5 6.3 0.8
Taxes 31.5 (0.2) (0.8) ・Decrease in property taxes, etc.
Depreciation and
amortization131.0 (3.7) (2.8) ・Progress of depreciation and amortization
Miscellaneous
costs167.0 (2.1) (1.2)
・Decrease in payments for other JR companies
・Increase in system related costs
・Increase in electricity charges and fuel price, etc.
Rental Payments,
etc23.5 0.0 0.0
Energy costs 44.0 6.8 18.5 ・Increase in electricity charges and fuel price, etc.
Maintenance
costs140.5 3.9 2.9 ・Increase in rail replacement costs, etc.
Item
Forecasts FY2014/3 As of Oct 29*
YoYMajor factors (YoY)
Personnel costs 235.0 1.6 0.7・Increase in the rate of health insurance and
employees' pension insurance, etc.

9
Consolidated Financial Results and Forecasts
¥Billions
Increase/
(Decrease) %Increase/
(Decrease) %
A B B-A B/A-1 C D D-C D/C-1
Operating Revenues 639.4 642.1 2.7 0.4 1,298.9 1,310.5 11.5 0.9
Operating Expenses 567.6 567.3 (0.3) (0.1) 1,169.4 1,185.5 16.0 1.4
Operating Income 71.7 74.8 3.0 4.3 129.4 125.0 (4.4) (3.5)
(13.9) (13.2) 0.6 (4.8) (24.8) (23.5) 1.3 (5.3)
Non-operating revenues 1.8 1.5 (0.2) - 6.8 6.7 (0.1) -
Non-operating expenses 15.7 14.8 (0.9) - 31.6 30.2 (1.4) -
Recurring Profit 57.8 61.5 3.7 6.4 104.6 101.5 (3.1) (3.0)
(1.1) (0.5) 0.5 - (4.9) (3.0) 1.9 -
Extraordinary profit 23.8 3.3 (20.4) - 41.5 - - -
Extraordinary loss 24.9 3.9 (21.0) - 46.5 - - -
Net Income 34.7 36.8 2.0 6.0 60.1 57.5 (2.6) (4.5)
Comprehensive Income 25.9 38.3 12.4 47.9 55.0 - - - Note: Figures in bracket ( ) are negative values.
* Forecasts has not been revised since July 30, 2013.
Forecasts
FY2014/3
As of Oct 29*
YoY
Non-operating revenues and
expenses
Extraordinary profit and loss,
net
6 months ended
Sep 30, 2012
6 months ended
Sep 30, 2013
YoY Results
FY2013/3

10
Consolidated Financial Results and Forecasts (Segment Information)
¥Billions
Increase/
(Decrease) %Increase/
(Decrease) %
A B B-A B/A-1 C D D-C D/C-1
Operating Revenues*2 639.4 642.1 2.7 0.4 1,298.9 1,310.5 11.5 0.9
Transportation 424.9 422.3 (2.6) (0.6) 844.9 844.0 (0.9) (0.1)
Retail 115.2 116.8 1.5 1.4 234.6 236.4 1.7 0.7
Sales of goods and food services 66.9 68.2 1.2 1.8 134.4 131.6 (2.8) (2.1)
Department Stores 45.2 43.8 (1.3) (3.1) 93.5 96.0 2.4 2.7
Real estate 43.7 42.8 (0.9) (2.2) 90.9 103.8 12.8 14.2
Shopping center 27.1 27.3 0.2 0.9 55.0 52.7 (2.3) (4.3)
15.8 14.6 (1.2) (7.7) 34.2 49.4 15.1 44.0
【2.2】 【0.9】 【6.9】 【21.8】
Other businesses 55.4 60.2 4.7 8.6 128.4 126.3 (2.1) (1.6)
Hotel 15.9 16.2 0.3 1.9 33.0 33.1 0.0 0.2
Nippon Travel Agency 17.2 18.3 1.1 6.6 38.8 38.5 (0.3) (1.0)
Operating Income*3 71.7 74.8 3.0 4.3 129.4 125.0 (4.4) (3.5)
Transportation 55.0 57.1 2.1 3.9 90.1 82.7 (7.4) (8.2)
Retail (0.6) 2.0 2.6 - (0.4) 3.1 3.5 -
Sales of goods and food services 2.3 2.4 0.1 7.4 3.3 - - -
Department stores (3.1) (0.6) 2.5 - (4.0) - - -
Real estate 14.1 12.2 (1.9) (13.8) 28.0 27.7 (0.3) (1.1)
Shopping center 4.5 4.3 (0.2) (4.8) 8.7 - - -
Real estate lease and sale 3.9 3.3 (0.6) (15.3) 8.1 - - -
Other businesses 2.4 2.5 0.0 3.3 12.3 11.9 (0.4) (3.7)
Hotel 0.7 0.9 0.1 21.4 2.3 - - -
Nippon Travel Agency (0.2) (0.2) (0.0) - 0.7 - - - Note: Figures in bracket ( ) are negative values.
*1 Forecasts has not been revised since July 30, 2013.
*2 Operating revenues are the revenues from third parties ( = customers). The breakdowns of operating revenues by each segment are the sums of revenues of major subsidiaries.
*3 The breakdowns of operating income by each segment are the sums of incomes of major subsidiaries before eliminating internal transactions.
*4 Figures in bracket 【 】 are the sales of condominiums. (Included in Real estate lease and sale)
YoY
Real estate lease and sale*4
6 months ended
Sep 30, 2012
6 months ended
Sep 30, 2013
YoY Results
FY2013/3
Forecasts
FY2014/3
As of Oct 29*1
11
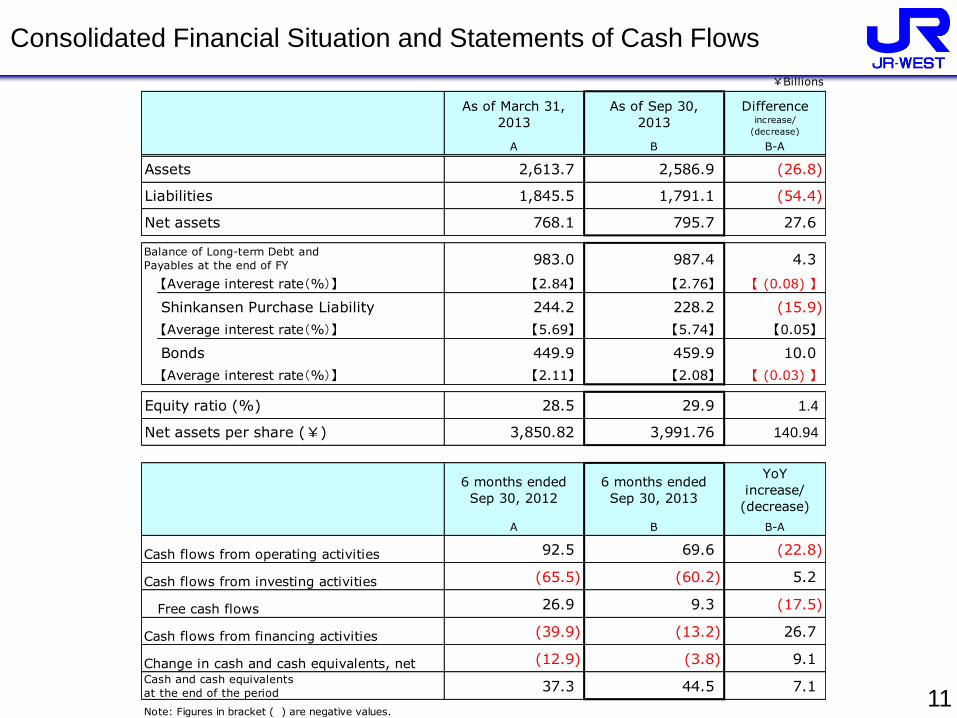
Consolidated Financial Situation and Statements of Cash Flows
¥Billions
As of March 31,
2013
As of Sep 30,
2013
Differenceincrease/
(decrease)
A B B-A
Assets 2,613.7 2,586.9 (26.8)
Liabilities 1,845.5 1,791.1 (54.4)
Net assets 768.1 795.7 27.6
983.0 987.4 4.3
【Average interest rate(%)】 【2.84】 【2.76】 【 (0.08) 】
Shinkansen Purchase Liability 244.2 228.2 (15.9)
【Average interest rate(%)】 【5.69】 【5.74】 【0.05】
Bonds 449.9 459.9 10.0
【Average interest rate(%)】 【2.11】 【2.08】 【 (0.03) 】
Equity ratio (%) 28.5 29.9 1.4
Net assets per share (¥) 3,850.82 3,991.76 140.94
A B B-A
Cash flows from operating activities 92.5 69.6 (22.8)
Cash flows from investing activities (65.5) (60.2) 5.2
Free cash flows 26.9 9.3 (17.5)
Cash flows from financing activities (39.9) (13.2) 26.7
Change in cash and cash equivalents, net (12.9) (3.8) 9.1
37.3 44.5 7.1
Note: Figures in bracket ( ) are negative values.
Balance of Long-term Debt and
Payables at the end of FY
6 months ended
Sep 30, 2012
6 months ended
Sep 30, 2013
YoY
increase/
(decrease)
Cash and cash equivalents
at the end of the period

12
Other Data
Persons, ¥Billions
ROA (%, Consolidated)
ROE (%, Consolidated)
EBITDA(Consolidated)*1
Depreciation (Consolidated)
Consolidated Non-Consolidated Consolidated Non-Consolidated Consolidated Non-Consolidated Consolidated Non-Consolidated
45,642 26,971 46,127 27,370 45,326 26,889 - -
(15.3) (14.6) (13.8) (13.1) (30.0) (28.9) (28.1) (27.0)
0.2 0.7 0.3 0.9 0.3 1.3 0.4 1.3
15.5 15.4 14.1 14.0 30.4 30.3 28.5 28.3
Note: Figures in bracket ( ) are negative values.
*1 EBITDA = Operating Income + Depreciation
*2 Forecasts has not been revised since July 30, 2013.
Financial Expenses, net
Interest and dividend income
Interest expenses
6 months ended
Sep 30, 2012
6 months ended
Sep 30, 2013
Results
FY2013/3
Forecasts
FY2014/3
As of Oct 29*2
No. of employees at the end of period
Dividends per share (¥) 55 55 110 110
Capital Expenditures
(Non-consolidated, own fund)37.6 37.3 124.8 165.0
Safety-related capital expenditures 19.4 24.0 72.7 89.0
78.9 75.0 160.8 156.0
Capital Expenditures
(Consolidated, own fund)49.9 46.2 152.9 192.0
4.9 4.9 8.3 7.5
150.7 149.8 290.3 281.0
6 months ended
Sep 30, 2012
6 months ended
Sep 30, 2013
Results
FY2013/3
Forecasts
FY2014/3
As of Oct 29*2
2.8 2.9 4.9 4.7

13
Redemption Plan of Shinkansen Purchase Liability
27.725.7
23.3
17.9
13.9
0.0 0.0 0.0 0.0 0.0
11.812.6
13.4
14.3
15.2
0.0 0.0 0.0 0.0 0.0
0.60.6
0.6
0.7
0.7
0.8 0.9 0.9 1.0 1.00.0
10.0
20.0
30.0
40.0
50.0
FY 3/2013
Result
FY 3/2014
Forecast
FY 3/2015
Forecast
FY 3/2016
Forecast
FY 3/2017
Forecast
FY 3/2018
Forecast
FY 3/2019
Forecast
FY 3/2020
Forecast
FY 3/2021
Forecast
FY 3/2022
Forecast
¥Billions
No.3
No.2
No.1
【As of Sep 30, 2013】
Balance
(¥Billions)Floating
/Fixed rate(%)
No.1 71.6 Floating 4.12 25.5 <until Mar. 2017>
No.2 49.3 Fixed 6.35 25.5 <until Mar. 2017>
No.3 107.2 Fixed 6.55 60 <until Sep. 2051>
Subtotal 228.2 Average 5.74
Interest rate(As of Sep 30, 2013) Term
(years)Payment recipient
Shinakansen
Purchase
Liability
Japan Railway
Construction,
Transport and
Technology Agency

14
Ⅱ. Future initiatives

15
Medium-Term Management Plan 2017, ―Our Future Direction—The Ideal Form for JR-West‖
In addition to clarifying direction going forward,
to realize this direction, we viewed the coming
five-years as a ―period for contributing to the
establishment of a foundation for decisive management‖
and established priority strategies accordingly.
2013-2017
The “Form of the New JR-West
Group” for the next era.
Three Basic Strategies
+ Four Business Strategies
• Enhance technological capabilities
• Improve communications
• Understand and utilize the human factor
• Improve front-line capabilities
• Recruit and nurture employees and enhance their motivation
• Foster Group unity
• Cooperate with customers and society
• Compliance
• Disclosure
We will fulfill Our Mission.
The JR-West Group will focus on ―safety‖ and ―customer satisfaction,‖ as
well as on the ―technology‖ that supports safety and customer
satisfaction. In this way, we will fulfill our mission of continued operation
of railway services as social infrastructure.
As we work to fulfill our mission, we will strive to contribute to the creation
of a safe, comfortable society.
+ We will become
a “company that coexists with communities.”
We will contribute to the invigoration of communities by increasing the
quality of railway operations, expanding the scale of non-railway
operations, and promoting the creation of new businesses. To that end,
we will deepen exchange and cooperation with members of communities,
and the entire JR-West Group will work together to develop operations
that are aligned with the characteristics of specific areas.
The JR-West Group will strive to contribute to the invigoration of the West
Japan area through its business activities, and to that end we will strive to
be a corporate group that excels in safety management and earns the trust
of customers, communities, and society.
Management Vision
Our Future Direction
- The Ideal Form for JR-West Priority Strategies
Foundation Building
Responsibilities as a Member of Society
• Crisis management
• Global environment
Safety: Safety Think-and-Act Plan 2017
Customer satisfaction: Customer-based management
Technologies: Continuous innovation
Shinkansen: ―Enhance‖
Kansai Urban Area: ―Improve‖
Other West Japan Area: ―Invigorate‖
Business Development: ―Develop‖
Current
Situation Future

16
Results for the first half and forecasts for FY2014/3
Trend of consolidated operating income
Consolidated Financial Results and Forecasts
129.4
125.0
109.7
FY12/3Result FY13/3 Result FY14/3 Forecast
Revenues of parent company +6.3
-Transportation +10.3
- Other (4.0)
Expenses of
parent company +6.7
Operating income of subsidiaries +6.6
+19.6 (4.4)
Revenues of parent
company (2.0)
-Transportation +5.8
- Other (7.8)Expenses of
parent company (6.3)
Operating income of
subsidiaries +3.8
Electricity charges and
fuel price, etc. (8.0)
(¥ Billions)
*Figures in bracket () are negative values
¥Billions
Amount % Amount %
Operating Revenues 642.1 2.7 0.4 1,310.5 11.5 0.9
Operaing Expenses 567.3 (0.3) (0.1) 1,185.5 16.0 1.4
Operating Income 74.8 3.0 4.3 125.0 (4.4) (3.5)
Recurring Profit 61.5 3.7 6.4 101.5 (3.1) (3.0)
Net Income 36.8 2.0 6.0 57.5 (2.6) (4.5)
FY2014/3 ForecastsFirst Half of FY2014/3 Results
YOY
Increase/(Decrease)YOY
Increase/(Decrease)

¥Billions
17
[Initiatives going forward]
i. Promote measures to sustain sound facilities and services into the future, enhance ability to respond to natural disasters
ii. Increase market share by heightening competitiveness
• Improve convenience of train timetable
• Enlarge the member of convenient online reservation service
• Enhance safety and comfort
• Expand the product range
iii. Create seniors’ and Inbound demand
iv. Entrench and expand benefits of direct service with Kyushu Shinkansen
FY2010/3
Drastic economic
downturn
Mar. 2011
・ Start of direct service with Kyushu Shinkansen
・ Start of e5489 reservation service
・ The Great East Japan Earthquake
Mar. 2012
・Timetable revision
- Increase in frequency for direct
service with Kyusyu Shinkansen
・ The entry of LCC into the market
(Kansai – Fukuoka, Nagasaki, etc.)
Black italic characters: Change in external environment
Mar. 2009
Increase in frequency of ―Nozomi‖ N700 Series
Aug. 2009
Introduction
of EX-IC
Shinkansen—Enhance 1. Sanyo Shinkansen
Enhance profitability of Sanyo Shinkansen Line further as pillar of operations going forward
FY2014/3
・Expansion of arrival /departure slots of Haneda Airport (~Fukuoka +6 etc. Mar. 31~)
・Expansion of slots for low-noise jets at Itami Airport (~Fukuoka+3, ~Kagoshima +1, Mar. 31~)
・SFJ launched (Kansai– Fukuoka route (+4, Oct. 1~)
・Increased flights (ANA Haneda – Hiroshima) (+1, Oct. 27~)
Mar. 2013
・Timetable revision
- Increase in frequency of ―Nozomi‖
- Shortening of the travel time of
―Nozomi‖ and ―Sakura‖
[FY2014/3 First half results]
¥181.1 billion (YoY;+1.3%)

18
Increase market share by heightening competitiveness
Create new demand of Seniors’ and Inbound
○Improve convenience of train timetable (Timetable revision in Mar. 2013)
・Increase frequency of ―Nozomi‖ (Okayama/Hiroshima – Tokyo), Increase in ―Nozomi‖ stops at Tokuyama Station,
Newly set 1 round trip of ―Sakura‖ (Hiroshima – Kagoshima-chuo)
・ Shorten the travel time of nearly half of ―Nozomi‖ and ―Sakura‖ (Shin-Osaka – Hakata)
○Enlarge the member of the convenient online reservation service
・Hold campaigns to promote the use of ―e5489‖ and ―EX‖ reservation service
○Enhance safety and comfort
・Sequentially introduce N700A (Dec. 2013~), Modificate 16 sets of N700 Series(Oct. 2013~)
・Modify 500 Series ―Kodama‖ to have 4 seats per row in reserved seating areas (8 sets, Planned completion in Jan. 2014)
・Expand area in which mobile phones can be used: Shin-Osaka - Shin-Iwakuni (within FY2014/3) (Currently Shin-Osaka - Mihara)
○Expand the product range (Pricing strategy)
・‖Super Haya-Toku‖ ticket (Apr. 2013: Shin-Osaka – Hakata, Jul. 2013: Shin-Osaka – Kumamoto/Kagoshima)
Extend the term until the end of FY2014/3
・ ‖Super Haya-Toku‖ ticket (Dec. 2013: Shin-Osaka – Nagasaki) Newly start the sales
○Stimulate seniors’ travel demand ・Expand use of ―Nori Nori‖ discount ticket on weekends and holidays, Hold ―Remember Kyushu‖ Campaign
○Create inbound demand
・Promote sales of convenient discount tickets for foreign travelers
・Develop West Japan tourism routes in cooperation with local authorities, communities, and JR-West Group
・Improve system to accept foreign customers
- Begin providing free public Wi-Fi at major stations
- Expand multilingual telephone translation services throughout the company
N700A 500 Series ―Kodama‖
4 seats per row
Shinkansen—Enhance 2. Sanyo Shinkansen

Shinkansen—Enhance 3. Hokuriku Shinkansen
(Overview of Hokuriku Shinkansen Line)
*1 Line usage fees are determined at a level (fixed amount) that does not exceed the earnings received and which balances JR-West’s revenues and expenses over the 30-year period after beginning operations.
We have not included the increase in revenues and line usage fees in this medium-term management plan because at the present juncture we have not determined the timetables and fare structures that form the basis of their calculation, making objective and rational calculation difficult.
*2 Travel time: This is based on a comparison with the fastest train service to Tokyo using conventional lines as of March 2012 and assumes an average Shinkansen speed of 190km/h.
(Hokuriku Shinkansen Line Route Map)
○ Service types and train names ・Tokyo - Kanazawa, The fastest operation: ―Kagayaki‖ ・Toyama - Kanazawa, Shuttle operation: ―Tsurugi‖
・Tokyo - Kanazawa, Stopping at most stations: ―Hakutaka‖
・Tokyo - Nagano, Corresponding to existing Nagano Shinkansen service: ―Asama‖
○ Promote Usage 1. Increase travel between Hokuriku and Tokyo metropolitan area
・Develop tourism routes in cooperation with communities and travel companies,
Conduct Hokuriku Destination Campaign (Oct. – Dec. 2015)
・Introduce highly convenient online reservation service
2. Maintain and increase travel between Hokuriku and Kansai
3. Develop Hokuriku route for travel between Kansai /Hokuriku and Nagano/Niigata
JR-West’s
service area
Beginning of
operations
Travel time ※2
Construction
contractor
Rolling
stock
Nagano - Kanazawa
(approx. 230km)
Kanazawa - Tsuruga
(approx. 130km)
Joetsu (provisional name)
- Kanazawa (approx. 170km)
End of FY2015
(plan)
Japan Railway Construction, Transport and Technology Agency (JRTT)
(JR-West will operate commercial services,
paying a usage fee to JRTT that does not exceed the earnings received.)
Kanazawa–Tokyo: 2h 36m (−71m)
Toyama–Tokyo: 2h 17m (−54m)
Introduction of 10 trains planned
(12 railcars per train)
Kanazawa –Tsuruga
(Approx. 130km)
End of FY2026 (plan) (construction commencement
authorized on June 29, 2012)
Undecided
Will advance practical application of gauge change trains to heighten convenience for passengers when changing between conventional lines and the Shinkansen at Tsuruga Station
※1 Sanyo Shinkansen
Shin Osaka
Tsuruga
Kanazawa Toyama
Niigata
Joetsu
Myoko
End of FY 2015
(plan)
End of FY
2026
(plan)
Takasaki
Omiya
Tokyo
Tohoku Shinkansen
Joetsu Shinkansen
Tokaido Shinkansen
Nagano
19

20
[Initiatives going forward]
i. Make Kansai urban area appealing
• Create convenient railway belts that people want to reside
• Advance urban tourism
• Build more convenient railway network
ii. Increase quality of transportation • Pursue safe, reliable transport service
May 2011
Opening of Osaka
Station City
Oct. 2012
・Opening of Eki Marché Osaka
・Hankyu Department Store’s remodeling
that increased floor space
Apr. 2013
Opening of Grand
Frond Osaka
Mar. 2013
Start of nationwide reciprocal
use of transport IC card
(Seamless railway network)
Mar. 2011
・Timetable revision
- Increase in frequency of direct rapid
service through Osaka Station
- Operation of all special rapid service
trains by 12 cars on weekends
Kansai Urban Area—Improve 1
¥Billions
FY2010/3
Drastic economic
downturn
Black italic characters:
Change in external environment
Encourage usage by increasing value of railway belts in Kansai urban area
[FY2014/3 First half results]
¥147.5 billion (YoY; +1.1%)
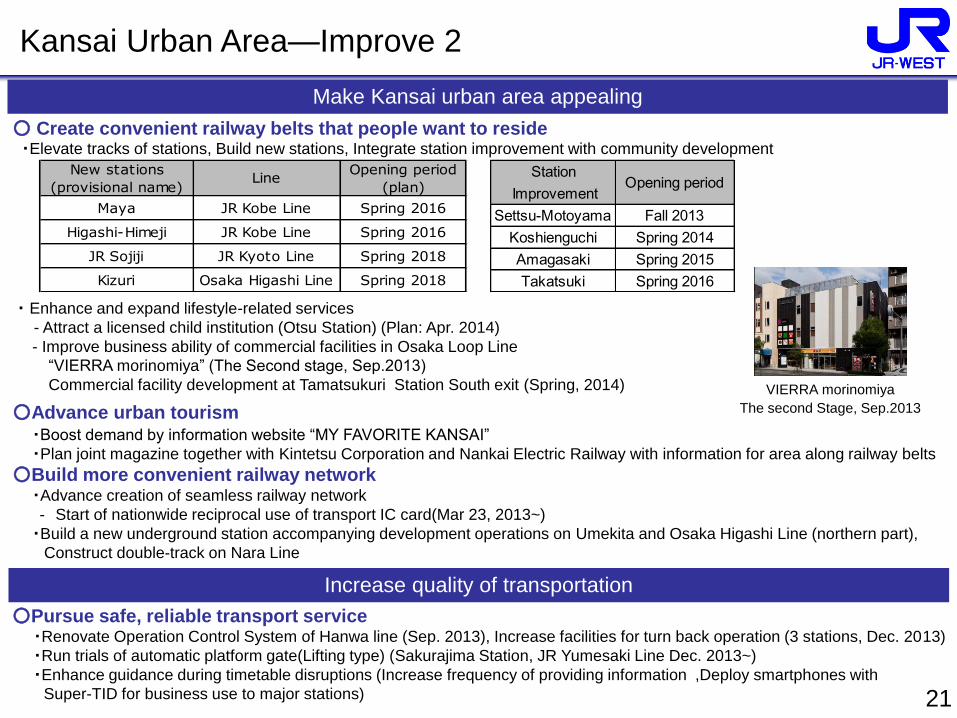
○ Create convenient railway belts that people want to reside ・Elevate tracks of stations, Build new stations, Integrate station improvement with community development
・ Enhance and expand lifestyle-related services
- Attract a licensed child institution (Otsu Station) (Plan: Apr. 2014)
- Improve business ability of commercial facilities in Osaka Loop Line
―VIERRA morinomiya‖ (The Second stage, Sep.2013)
Commercial facility development at Tamatsukuri Station South exit (Spring, 2014)
○Advance urban tourism ・Boost demand by information website ―MY FAVORITE KANSAI‖
・Plan joint magazine together with Kintetsu Corporation and Nankai Electric Railway with information for area along railway belts
○Build more convenient railway network ・Advance creation of seamless railway network
- Start of nationwide reciprocal use of transport IC card(Mar 23, 2013~)
・Build a new underground station accompanying development operations on Umekita and Osaka Higashi Line (northern part),
Construct double-track on Nara Line
VIERRA morinomiya
The second Stage, Sep.2013
○Pursue safe, reliable transport service ・Renovate Operation Control System of Hanwa line (Sep. 2013), Increase facilities for turn back operation (3 stations, Dec. 2013)
・Run trials of automatic platform gate(Lifting type) (Sakurajima Station, JR Yumesaki Line Dec. 2013~)
・Enhance guidance during timetable disruptions (Increase frequency of providing information ,Deploy smartphones with
Super-TID for business use to major stations)
Make Kansai urban area appealing
Increase quality of transportation
21
Kansai Urban Area—Improve 2
New stations
(provisional name)Line
Opening period
(plan)
Maya JR Kobe Line Spring 2016
Higashi-Himeji JR Kobe Line Spring 2016
JR Sojiji JR Kyoto Line Spring 2018
Kizuri Osaka Higashi Line Spring 2018
Station
ImprovementOpening period
Settsu-Motoyama Fall 2013
Koshienguchi Spring 2014
Amagasaki Spring 2015
Takatsuki Spring 2016

Retail Real Estate
Other Businesses (¥ Billions)
Business Development—Develop 1
*Operating revenues are the revenues from the third parties(=costumers)
Establish earnings foundations for JR-West Group aimed at long-term sustainable growth as population declines in earnest
[Initiatives going forward]
i. Expand lifestyle – related services businesses
• Strengthen and expand existing businesses (sales of goods and food services, shopping center businesses)
• Implement aggressive development in new regions (Business hotels, Real estate sale and lease businesses)
ii. Use Group’s management resources optimally
• Promote terminal station development
• Fundamentally reevaluate North Gate Building of Osaka Station City
iii. Develop and pioneer new business formats and fields
iv. Consider business expansion with an eye to the global market
(¥ Billions)
22
[FY2014/3 First half results] Operating revenues ¥116.8 billion (YoY: ¥+1.5 billion) Operating income ¥2.0 billion (YoY: ¥+2.6 billion)
[FY2014/3 First half results] Operating revenues ¥60.2 billion (YoY: ¥+4.7 billion) Operating income ¥2.5 billion (YoY: ¥+0.0billion)
[FY2014/3 First half results] Operating revenues ¥42.8 billion (YoY: ¥-0.9 billion) Operating income ¥12.2 billion (YoY: ¥-1.9 billion)
(¥ Billions)

(単位:億円) (単位:億円) (単位:億円)
○Fundamentally reevaluate North Gate Building of Osaka Station City
・Renovate stores taking advantage of strengths of department stores and shopping centers : Formulate basic plan within FY2014/3
・ Opening period: Spring 2015 (plan)
・ Outlook for profitability
- West Japan Railway Isetan Limited: Profitable in FY2016/3
- JR Osaka Mitsukoshi Isetan, nonconsolidated: Profitable rapidly
○Renovate stores inside stations accompanying station improvement ・Tennoji Station Concourse (Nov. 2012)
・Tottori Station Concourse (Mar. 2013)
・Sannomiya Station Concourse (Spring 2014)
○Implement aggressive development in new regions
(regions other than those alongside tracks and those in our service area)
・Business Hotel ―Via-inn Nagoya‖ (Jul. 2013)
(The14th hotel as the hotel chain, 4 hotels in the Tokyo Metropolitan Area, 1 hotel in Tokai Area)
Sales of goods and food services
Department Store
23
Via-inn Nagoya
○Initiatives to enhance customer drawing power ・Strengthen initiatives targeting holders of JR West’s cards
・Hold effective events ・Further improve pedestrian flow
Other retail businesses
○Promote development through a merger of two consolidated subsidiaries in the San-in area ・Inaugurate West Japan Railway Sanin Development Company
(Merge formerly Japan Railway Service Net Yonago Company and formerly Japan Railway San-in Station Development Co., Ltd.)
・Renovate a shopping center ―Shamine Tottori‖ at Tottori Station (Spring 2014)
Entrée Marché
at Sannomiya Station
Business Development—Develop 2. Retail

(単位:億円)
(単位:億円)
(単位:億円) (単位:億円)
24
○Implement aggressive development in new regions
・ Sales of condominiums in Saitama City (Handover, Mar. 2014)
・ ―Fukuoka Tenjin NK Building‖
(CANDEO HOTELS plan to move in) (Fall 2014)
・ Commercial facility development in Northern Kyoto (FY2015/3)
○Enter business projects near major stations
・ Land acquisition in front of Tsukaguchi Station(Amagasaki City)
(Station Building, Sales of condominiums)
○Use assets such as lands optimally
・ ―JR Higashimaizuru Station NK Building‖ (Aug. 2013)
・ ―JR Fukuchiyama Station the 3rd NK Building‖ (Sep. 2013)
・ Invitation of a college to former company housing sites
in Suita city (Spring 2014)
・ Development of former company housing sites
in Okayama City(Spring 2014)
○Advance new development
・ ―piole HIMEJI‖ (Apr. 2013)
・ ―ripie‖ at Shimonoseki Station, Fukuyama Station South exit development
○Rennovate commercial facilities at large scale
・ ―PLiCO ROKKOMICHI‖, ―MEDIO Shinosaka (a part)‖ (Winter 2013)
・ Sequential renewal of fashion zone “Porta‖ and ―The CUBE‖ at Kyoto Station, ―Tennoji Mio Plaza-kan‖ (Spring 2014)
(単位:億円) Real estate lease and sale
○Advance sales of condominiums
・Revenue Forecasts (FY2015/3): ¥21.8 billion
Shopping Center
―ripie‖ at Shimonoseki Station Fukuyama Station
South exit development
Business Development—Develop 3. Real Estate
Name Location Handover Houses
J.GRAN GARDEN KITAHANADA Kita, Sakai Oct. 2013 38
J.GRAN SHIN NAGATA Nagata, Kobe Dec. 2013 122
J.GRAN ABENO FUMINOSATO Abeno, Osaka Nov. 2013 113
WELLiTH MAIKO* Tarumi, Kobe Feb. 2014 145
J.GRAN FRESIA KUSATSUNISHIOJI* Kusasu, Shiga Feb. 2014 58
J.GRAN ABENO FUMINOSATO RESIDENCE Abeno, Osaka Mar. 2014 24
J.GRAN SENRICHUOH Toyonaka, Osaka Mar. 2014 140
URAWA TOKIWA THE RESIDENCE* Urawa, Saitama Mar. 2014 295
J.GRAN L KUSATSU Kusasu, Shiga Mar. 2014 47
J.GRAN TAKATSUKI KOSOBECHO Takatsuki, Osaka Mar. 2014 49
MAYA CITY NADA EXCEED* Nada, Kobe Aug. 2014 130
Sum 1,161
*Joint projects with other companies

○Strengthen website sales, business travel
management (BTM) service and inbound tourist
services, etc.
○Expand sales of package tours using JR and
tours to Europe
(単位:億円) (単位:億円)
25
○Strengthen promotional campaigns targeting
the establishment of repeat customers
○ Enhance sales initiatives to acquire new
customers (Tokyo metropolitan area, Asia)
○Set up Business Promotion Group in Business Development Headquarters
・Act as point of contact for external communication regarding new business
projects and promote business development within Group
○Day service facility specializing in rehabilitation “POSSIBLE” ・Open at Hiroshima (Jun. 2013) , Open at Mihara (Aug. 2013)
○Car sharing “Rail and Car Sharing” ・Open at major 10 stations (Apr. 2013): Hiroshima/Okayama(Oct. 2013) (Target 100 sites)
○Photovoltaic power generation business (Asa area in Yamaguchi prefecture, Start operation in winter 2014)
Hotel business Travel Agency (Nippon Travel Agency)
Develop and pioneer new business formats and business fields
POSSIBLE Mihara
Business Development—Develop 4. Other businesses
<trend of operation ratio in hotels> <Sales trend (Jan.- Sep. 2013)>
Photovoltaic power generation
(¥Billions) (%)
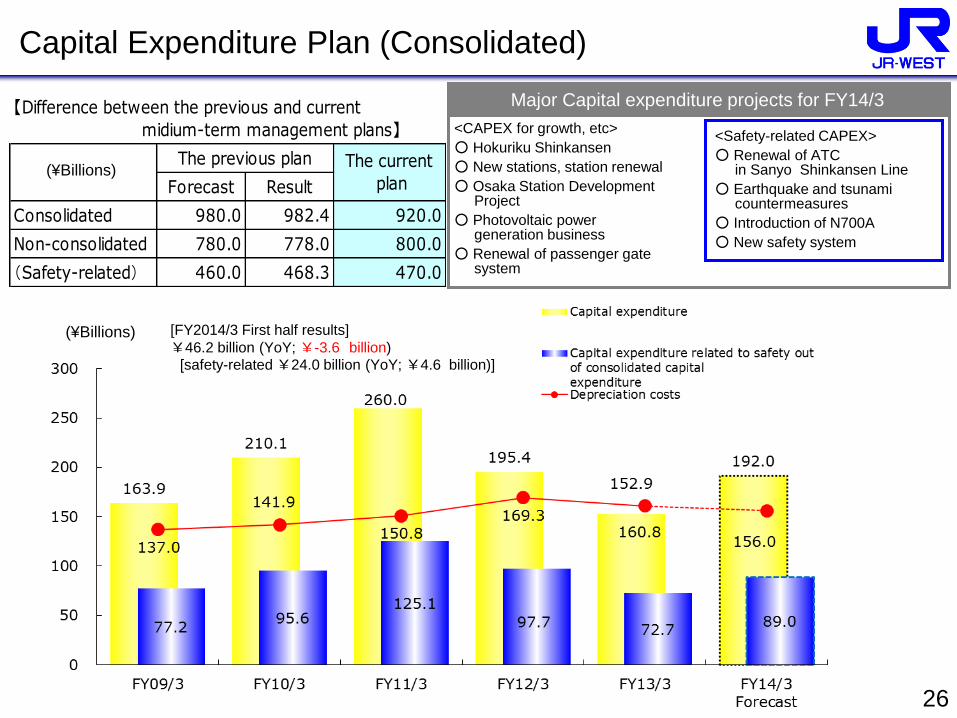
Major Capital expenditure projects for FY14/3
<CAPEX for growth, etc>
○ Hokuriku Shinkansen
○ New stations, station renewal
○ Osaka Station Development Project
○ Photovoltaic power generation business
○ Renewal of passenger gate system
<Safety-related CAPEX>
○ Renewal of ATC in Sanyo Shinkansen Line
○ Earthquake and tsunami countermeasures
○ Introduction of N700A
○ New safety system
Capital Expenditure Plan (Consolidated)
Forecast Result
Consolidated 980.0 982.4 920.0
Non-consolidated 780.0 778.0 800.0
(Safety-related) 460.0 468.3 470.0
The previous planBillion Yen
The current
plan
【Difference between the previous and current
midium-term management plans】
26
(¥Billions) [FY2014/3 First half results]
¥46.2 billion (YoY; ¥-3.6 billion)
[safety-related ¥24.0 billion (YoY; ¥4.6 billion)]
(¥Billions)

27 ○ Cancellation of Treasury Stock: Number of shares 4,521,600 Date of cancellation Nov. 15, 2013
Balance of long-term debt and payables, and
Shareholders’ equity ratio (consolidated) Cash flows forecast (consolidated)
Finance and Cash Flows, and Returns to Shareholders
Returns to Shareholders
○ Continue providing returns to shareholders based on consideration of total shareholders’ equity, reflecting our emphasis on providing stable shareholder returns over the long term.
○ Specifically, aim for a rate of total distribution on net assets* of around 3% for FY2018, in light of the usage situation following the commencement of operations to Kanazawa on the Hokuriku Shinkansen Line and progress toward achievement of the targets set out in Medium-Term Management Plan 2017 * Rate of total distribution on net assets (%) = (total dividends + acquisitions of treasury stock) ÷ consolidated net assets × 100
→ Plan to pay a full-year dividend of ¥110 per share
(¥Billions)
(¥Billions)

This presentation contains forward-looking statements that are based on JR-West’s current expectations,
assumptions, estimates and projections about its business, industry, and capital markets around the world.
These forward-looking statements are subject to various risks and uncertainties. Generally, these forward-looking
statements can be identified by the use of forward-looking terminology such as ―may‖, ―will‖, ―expect‖, ―anticipate‖,
―plan‖ or similar words. These statements discuss future expectations, identify strategies, contain projections of
results of operations or of JR-West’s financial condition, or state other forward-looking information.
Known or unknown risks, uncertainties and other factors could cause the actual results to differ materially from
those contained in any forward-looking statements. JR-West cannot promise that the expectations expressed in
these forward-looking statements will turn out to be correct. JR-West’s actual results could be materially different
from and worse than expectations.
Important risks and factors that could cause actual results to be materially different from expectations include, but
are not limited to:
・expenses, liability, loss of revenue or adverse publicity associated with property or casualty losses;
・economic downturn, deflation and population decreases;
・adverse changes in laws, regulations and government policies in Japan;
・service improvements, price reductions and other strategies undertaken by competitors such as passenger
railway and airlines companies;
・infectious disease outbreak and epidemic;
・earthquake and other natural disaster risks; and
・failure of computer telecommunications systems disrupting railway or other operations
All forward-looking statements in this release are made as of November 2013 based on information available to
JR-West as of November 2013 and JR-West does not undertake to update or revise any of its forward-looking
statements or reflect future events or circumstances.
Compensation for damages caused by the accident on Fukuchiyama Line happened on April 25, 2005 is NOT
considered in this presentation.
Cautionary Statement Regarding Forward-looking Statements


