0 (Appendix) Results for the First Quarter of the Fiscal Year Ending May 31, 2019 FY2018 (June 1, 2018 - May 31, 2019) Three months ended August 31, 2018 Pasona Group Inc. First Section TSE (2168) October 5, 2018 www.pasonagroup.co.jp/english ※Units in billions of yen have been rounded to the nearest first decimal place. Units in millions of yen have been rounded down.
Transcript
0
(Appendix)
Results for the First Quarterof the Fiscal Year Ending May 31, 2019
FY2018 (June 1, 2018 - May 31, 2019)
Three months ended August 31, 2018
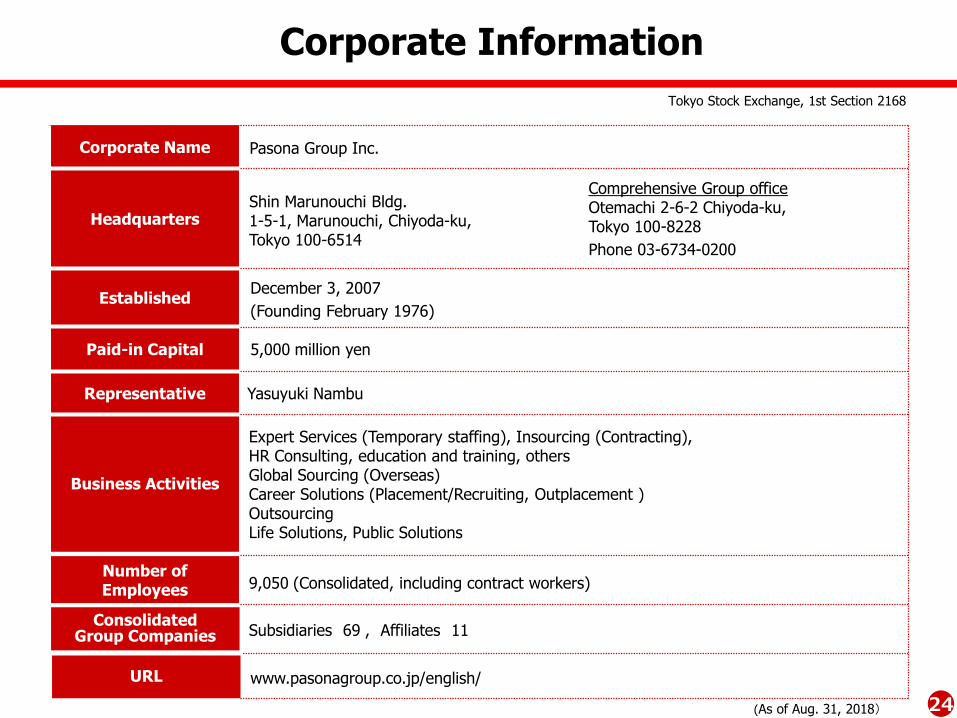
Pasona Group Inc.
First Section TSE (2168)
October 5, 2018www.pasonagroup.co.jp/english
※Units in billions of yen have been rounded to the nearest first decimal place. Units in millions of yen have been rounded down.
11
1.03
1.4572.5
83.0
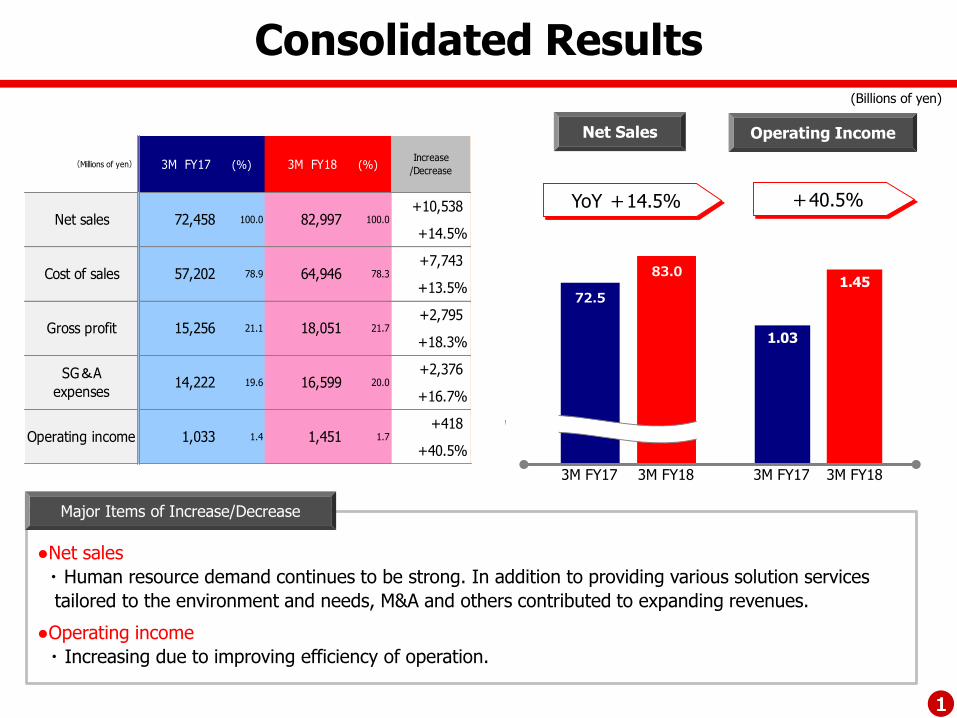
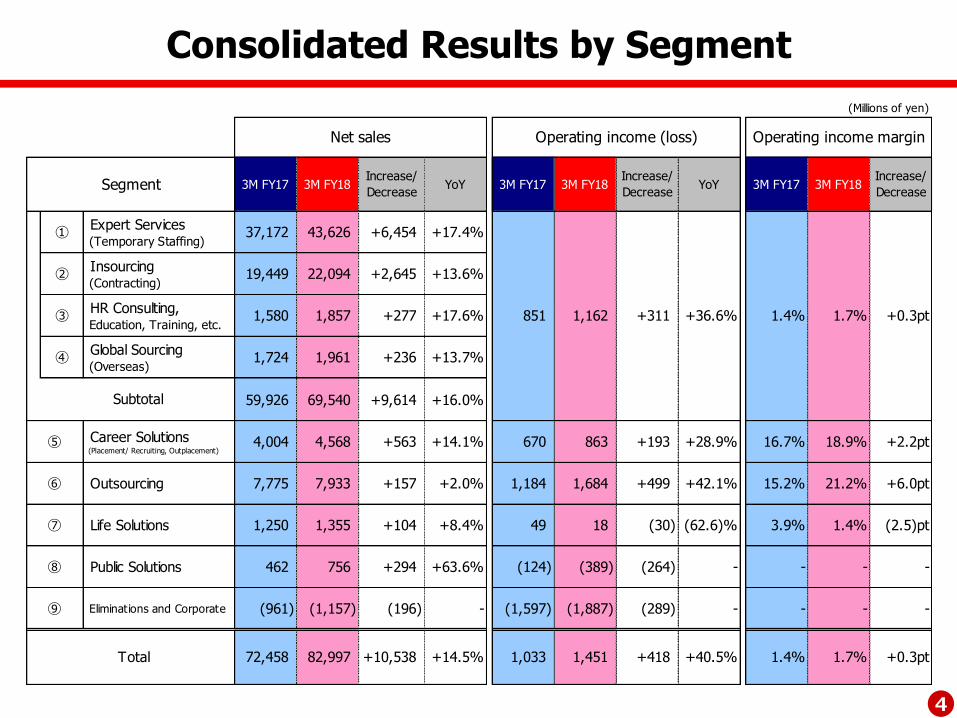
Consolidated Results
●Net sales
・ Human resource demand continues to be strong. In addition to providing various solution services
tailored to the environment and needs, M&A and others contributed to expanding revenues.
●Operating income
・ Increasing due to improving efficiency of operation.
YoY +14.5% +40.5%
3M FY17 3M FY18
Net Sales Operating Income
3M FY17 3M FY18
(Billions of yen)
(Millions of yen) 3M FY17 (%) 3M FY18 (%)Increase
/Decrease
+10,538
+14.5%
+7,743
+13.5%
+2,795
+18.3%
+2,376
+16.7%
+418
+40.5%Operating income
15,256 21.1 18,051 21.7
SG&A
expenses
1,033 1.4 1,451 1.7
14,222 19.6 16,599 20.0
57,202 78.9 64,946 78.3
Gross profit
72,458 100.0 82,997 100.0
Cost of sales
Net sales
Major Items of Increase/Decrease
22
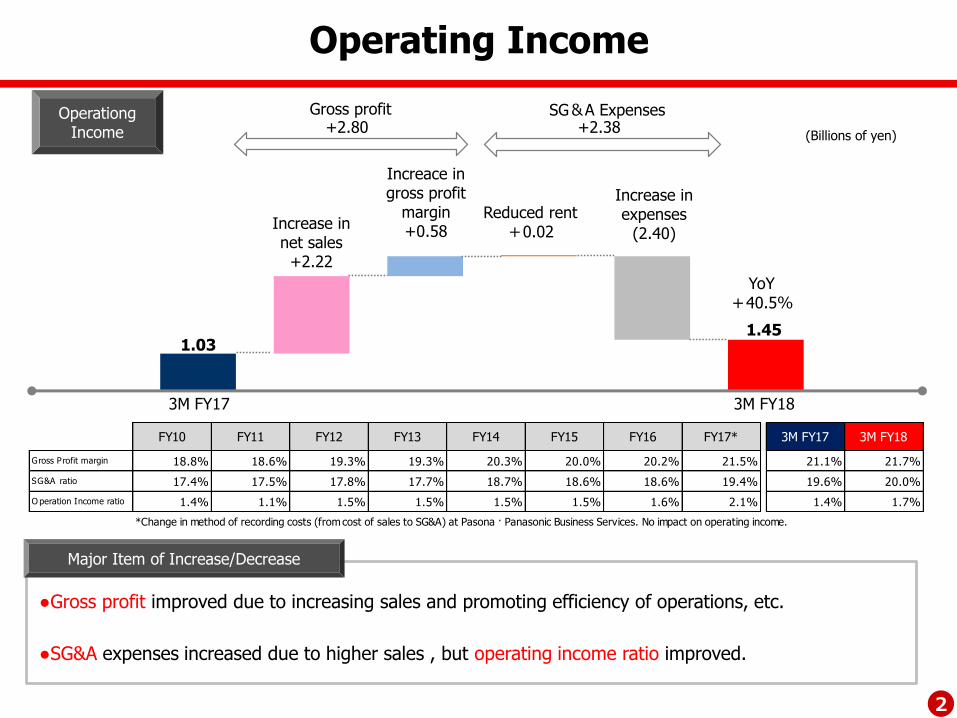
OperationgIncome
Increase in net sales+2.22
Reduced rent+0.02
Increace ingross profit
margin+0.58
1.03
Increase in expenses
(2.40)
YoY+40.5%
+2.80 +2.38
1.45
3M FY17 3M FY18
Operating Income
Gross profit SG&A Expenses
(Billions of yen)
Major Item of Increase/Decrease
●Gross profit improved due to increasing sales and promoting efficiency of operations, etc.
●SG&A expenses increased due to higher sales , but operating income ratio improved.
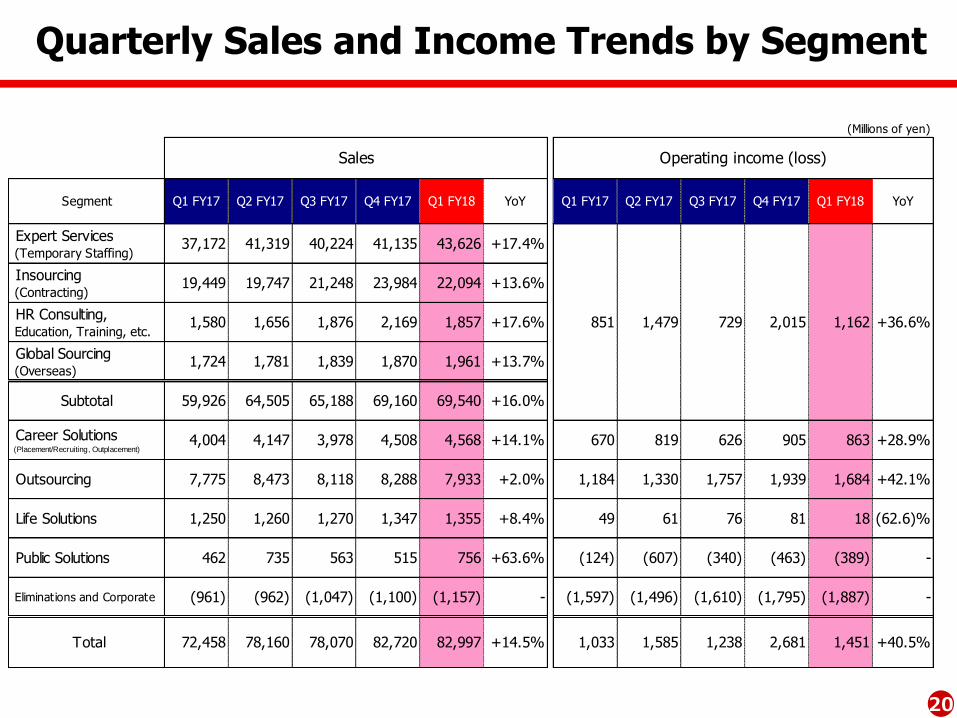
Operating income marginNet sales Operating income (loss)
Segment
⑤
851 1.4% 1.7% +0.3pt
Subtotal
1,162 +311 +36.6%
⑥
⑦
⑨
⑧
Total
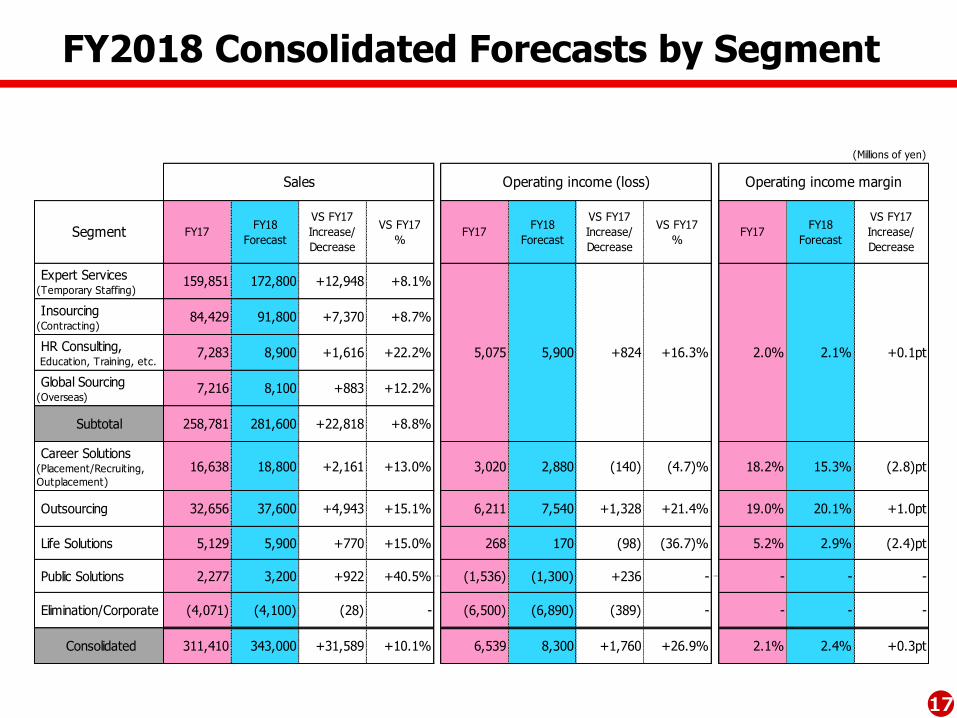
Consolidated Results by Segment
55
(Billions of yen)
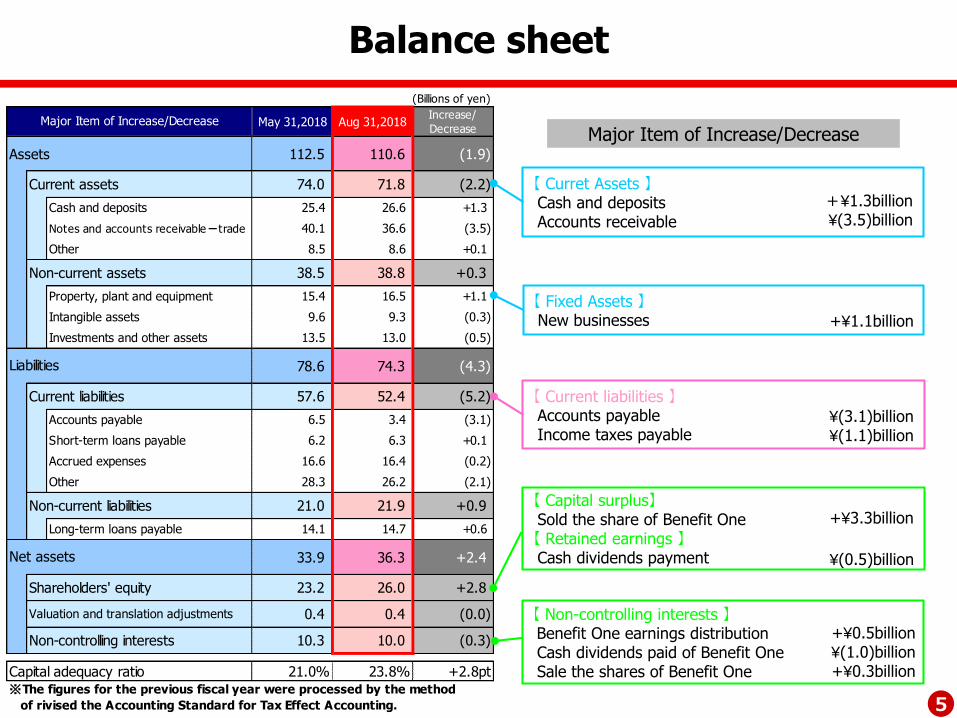
May 31,2018 Aug 31,2018Increase/
Decrease
Assets 112.5 110.6 (1.9)
Current assets 74.0 71.8 (2.2)
Cash and deposits 25.4 26.6 +1.3
Notes and accounts receivable-trade 40.1 36.6 (3.5)
Other 8.5 8.6 +0.1
Non-current assets 38.5 38.8 +0.3
Property, plant and equipment 15.4 16.5 +1.1
Intangible assets 9.6 9.3 (0.3)
Investments and other assets 13.5 13.0 (0.5)
78.6 74.3 (4.3)
Current liabilities 57.6 52.4 (5.2)
Accounts payable 6.5 3.4 (3.1)
Short-term loans payable 6.2 6.3 +0.1
Accrued expenses 16.6 16.4 (0.2)
Other 28.3 26.2 (2.1)
Non-current liabilities 21.0 21.9 +0.9
Long-term loans payable 14.1 14.7 +0.6
33.9 36.3 +2.4
Shareholders' equity 23.2 26.0 +2.8
Valuation and translation adjustments 0.4 0.4 (0.0)
Non-controlling interests 10.3 10.0 (0.3)
Capital adequacy ratio 21.0% 23.8% +2.8pt※The figures for the previous fiscal year were processed by the method
of rivised the Accounting Standard for Tax Effect Accounting.
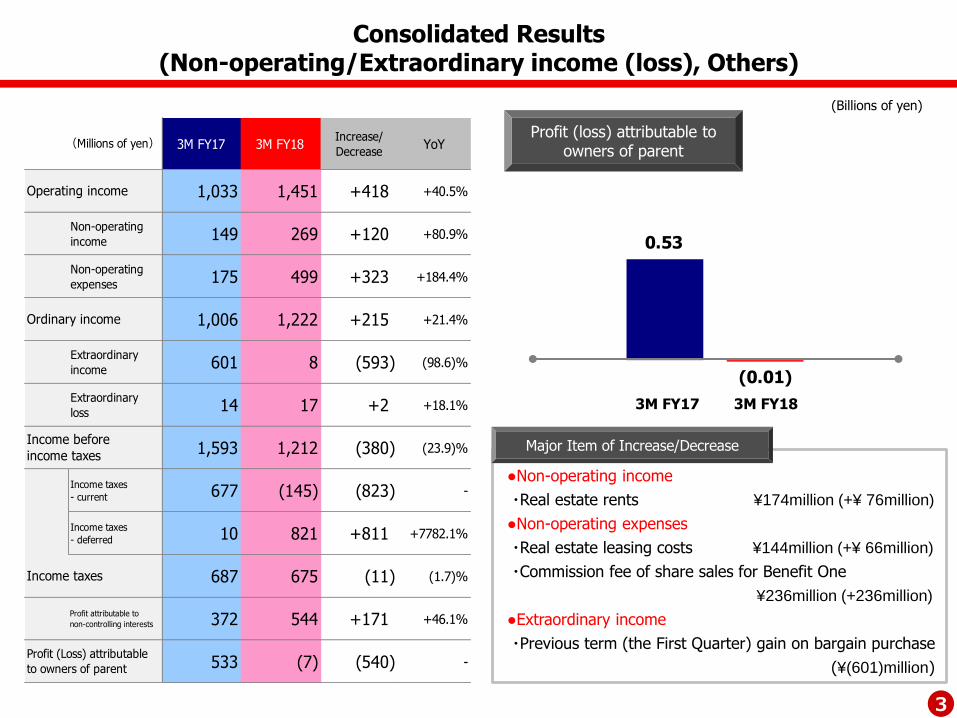
Major Item of Increase/Decrease
Liabilities
Net assets
Balance sheet
【 Curret Assets 】Cash and depositsAccounts receivable
【 Capital surplus】Sold the share of Benefit One【 Retained earnings 】Cash dividends payment
【 Non-controlling interests 】Benefit One earnings distributionCash dividends paid of Benefit OneSale the shares of Benefit One
¥(0.5)billion
+¥0.5billion¥(1.0)billion+¥0.3billion
【 Current liabilities 】Accounts payable Income taxes payable
¥(3.1)billion¥(1.1)billion
【 Fixed Assets 】New businesses +¥1.1billion
Major Item of Increase/Decrease
+¥1.3billion¥(3.5)billion
+¥3.3billion
6
Segment information
※ Units in billions of yen have been rounded to the nearest first decimal place. Units in millions of yen have been rounded down.6
77
36.435.1 34.3
36.937.2
41.340.2 41.1
43.6
37.2
43.6
YoY+17.4%
YoY
+17.4%
1Q 2Q 3Q 4Q
FY16 FY17 FY18 FY16 FY17 17/5 FY16 FY17 17/5
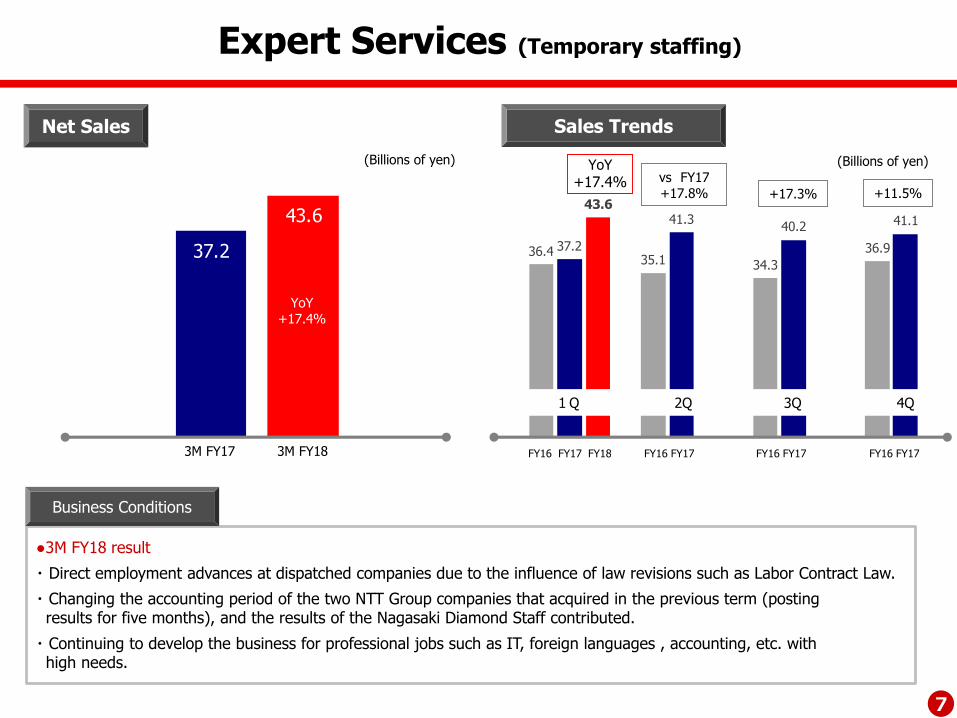
Expert Services (Temporary staffing)
Net Sales Sales Trends
FY16 FY173M FY17 3M FY18
●3M FY18 result
・ Direct employment advances at dispatched companies due to the influence of law revisions such as Labor Contract Law.
・ Changing the accounting period of the two NTT Group companies that acquired in the previous term (posting results for five months), and the results of the Nagasaki Diamond Staff contributed.
・ Continuing to develop the business for professional jobs such as IT, foreign languages , accounting, etc. with high needs.
(Billions of yen) (Billions of yen)
vs FY17+17.8% +17.3% +11.5%
Business Conditions
88
39.544.0
73.477.1
84.491.8
59.9 65.6
99.6 107.0
117.1
129.4
Insourcing Outsourcing
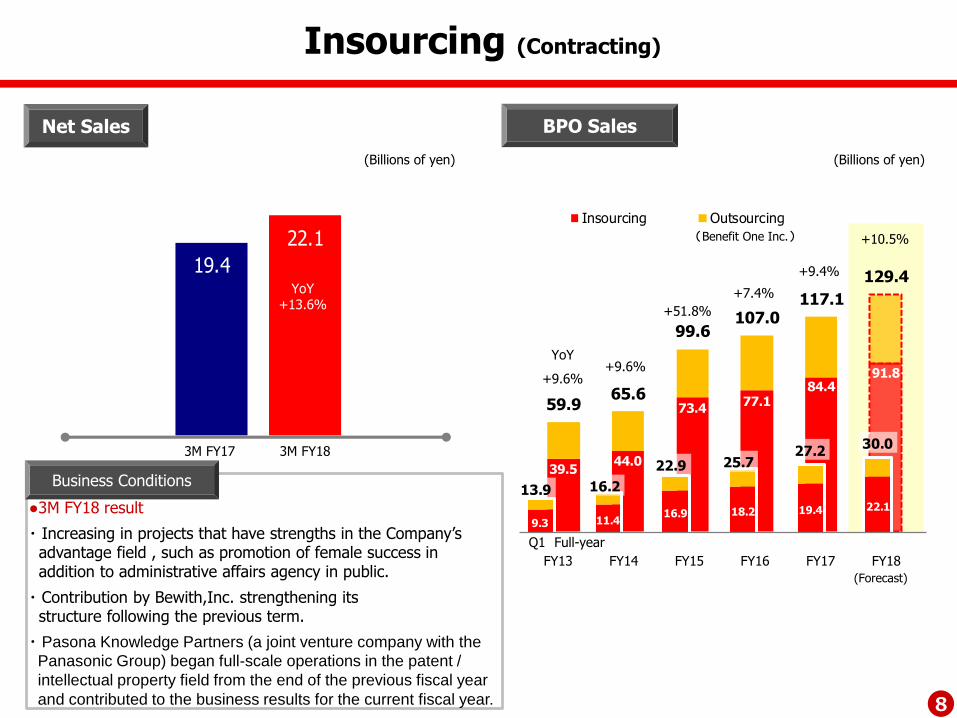
19.4
22.1
YoY
+9.6%+9.6%
+51.8%
+7.4%YoY+13.6%
BPO Sales
Insourcing (Contracting)
(Benefit One Inc.)
(Billions of yen)
9.3 11.416.9 18.2 19.4 22.1
13.9 16.2
22.9 25.727.2
30.0
FY14 FY15 FY16 FY17 FY18FY13
Q1 Full-year
(Forecast)
Net Sales
●3M FY18 result
・ Increasing in projects that have strengths in the Company’s advantage field , such as promotion of female success in addition to administrative affairs agency in public.
・ Contribution by Bewith,Inc. strengthening its structure following the previous term.
・ Pasona Knowledge Partners (a joint venture company with the
Panasonic Group) began full-scale operations in the patent /
intellectual property field from the end of the previous fiscal year
and contributed to the business results for the current fiscal year.
(Billions of yen)
+9.4%
+10.5%
3M FY17 3M FY18
Business Conditions
99
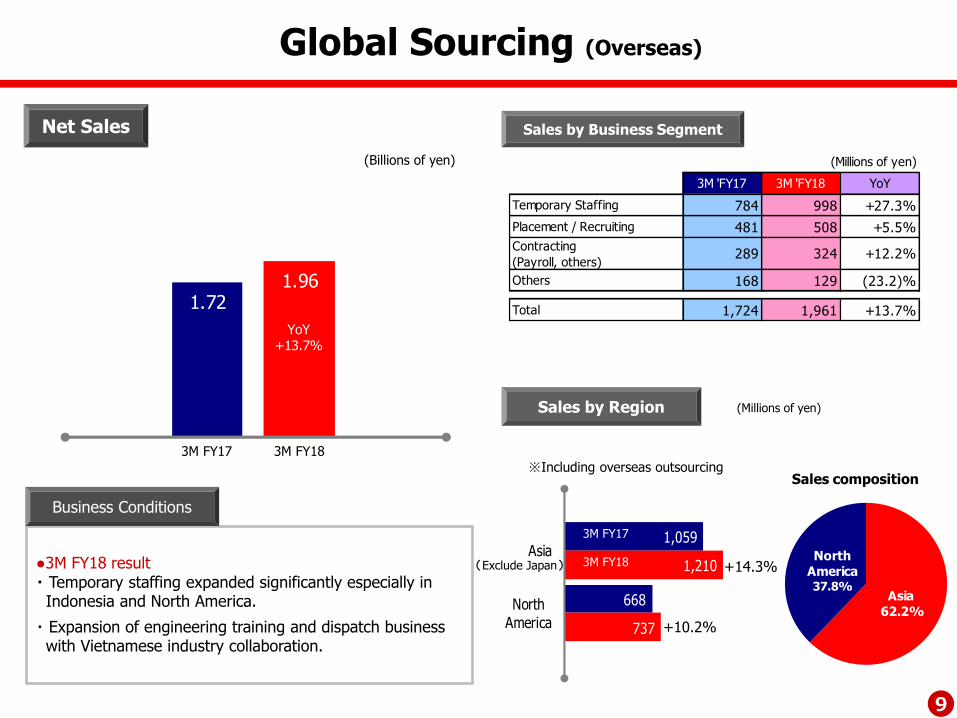
Asia62.2%
North America 37.8%
1,059
668
1,210
737
Asia
NorthAmerica
1.721.96
YoY+13.7%
+14.3%
3M FY17
3M FY18
※Including overseas outsourcing
Global Sourcing (Overseas)
Sales by Business Segment
Sales by Region (Millions of yen)
(Exclude Japan)
Sales composition
(Millions of yen)
3M 'FY17 3M 'FY18 YoY
Temporary Staffing 784 998 +27.3%
Placement / Recruiting 481 508 +5.5%
Contracting
(Payroll, others)289 324 +12.2%
Others 168 129 (23.2)%
Total 1,724 1,961 +13.7%
Net Sales
Business Conditions
●3M FY18 result・ Temporary staffing expanded significantly especially in Indonesia and North America.
・ Expansion of engineering training and dispatch business with Vietnamese industry collaboration.
+10.2%
(Billions of yen)
3M FY17 3M FY18
1010
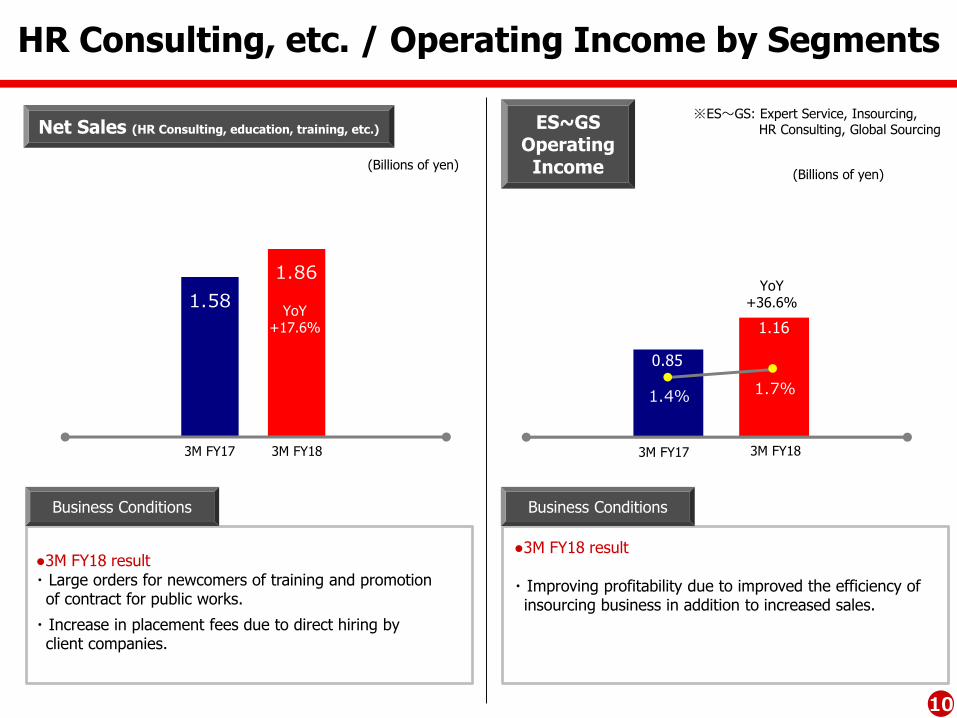
0.85
1.16
1.4% 1.7%
-0.8%
0.2%
1.2%
2.2%
3.2%
4.2%
5.2%
0
0.2
0.4
0.6
0.8
1
1.2
1.4
1.6
1.8
1.58
1.86
HR Consulting, etc. / Operating Income by Segments
YoY+17.6%
YoY+36.6%
ES~GS Operating
Income
Net Sales (HR Consulting, education, training, etc.)
(Billions of yen)(Billions of yen)
※ES~GS: Expert Service, Insourcing, HR Consulting, Global Sourcing
3M FY17 3M FY18
Business Conditions Business Conditions
●3M FY18 result・ Large orders for newcomers of training and promotion of contract for public works.
・ Increase in placement fees due to direct hiring by client companies.
●3M FY18 result
・ Improving profitability due to improved the efficiency of insourcing business in addition to increased sales.
3M FY17 3M FY18
1111
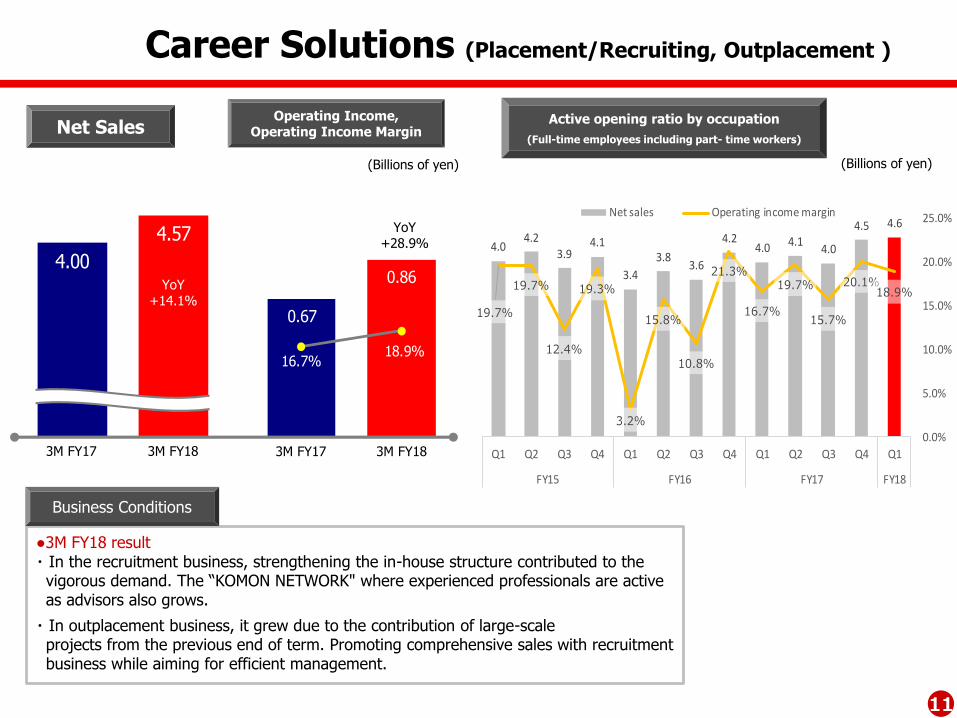
0.67
0.86
16.7%18.9%
4.0%
9.0%
14.0%
19.0%
24.0%
29.0%
0.00
0.10
0.20
0.30
0.40
0.50
0.60
0.70
0.80
0.904.00
4.57
YoY+14.1%
YoY+28.9%
Career Solutions (Placement/Recruiting, Outplacement )
Net SalesOperating Income,
Operating Income MarginActive opening ratio by occupation
(Full-time employees including part- time workers)
(Billions of yen)(Billions of yen)
4.04.2
3.94.1
3.4
3.83.6
4.24.0 4.1
4.0
4.5 4.6
19.7%
19.7%
12.4%
19.3%
3.2%
15.8%
10.8%
21.3%
16.7%
19.7%
15.7%
20.1%18.9%
0.0%
5.0%
10.0%
15.0%
20.0%
25.0%
Q1 Q2 Q3 Q4 Q1 Q2 Q3 Q4 Q1 Q2 Q3 Q4 Q1
FY15 FY16 FY17 FY18
Net sales Operating income margin
●3M FY18 result・ In the recruitment business, strengthening the in-house structure contributed to the vigorous demand. The “KOMON NETWORK" where experienced professionals are activeas advisors also grows.
・ In outplacement business, it grew due to the contribution of large-scaleprojects from the previous end of term. Promoting comprehensive sales with recruitment business while aiming for efficient management.
FY10 FY11 FY12 FY13 FY14 FY15 FY16 FY17 As of Apr.302019
(Forecast)
Personal
CRM
Employee fringe benefit
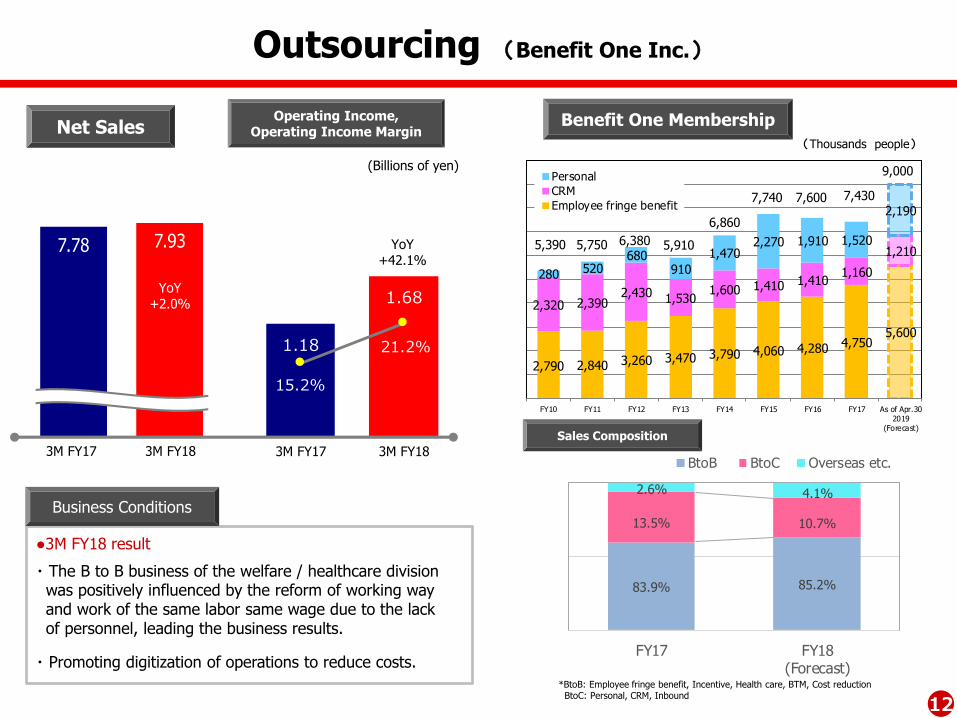
1.18
1.68
15.2%
21.2%
4.0%
9.0%
14.0%
19.0%
24.0%
29.0%
0.00
0.20
0.40
0.60
0.80
1.00
1.20
1.40
1.60
1.80
7.78 7.93
YoY+2.0%
YoY+42.1%
(Billions of yen)
Benefit One Membership
(Thousands people)
Sales Composition
Outsourcing (Benefit One Inc.)
*BtoB: Employee fringe benefit, Incentive, Health care, BTM, Cost reductionBtoC: Personal, CRM, Inbound
Business Conditions
●3M FY18 result
・ The B to B business of the welfare / healthcare division was positively influenced by the reform of working way and work of the same labor same wage due to the lack of personnel, leading the business results.
・ Promoting digitization of operations to reduce costs.
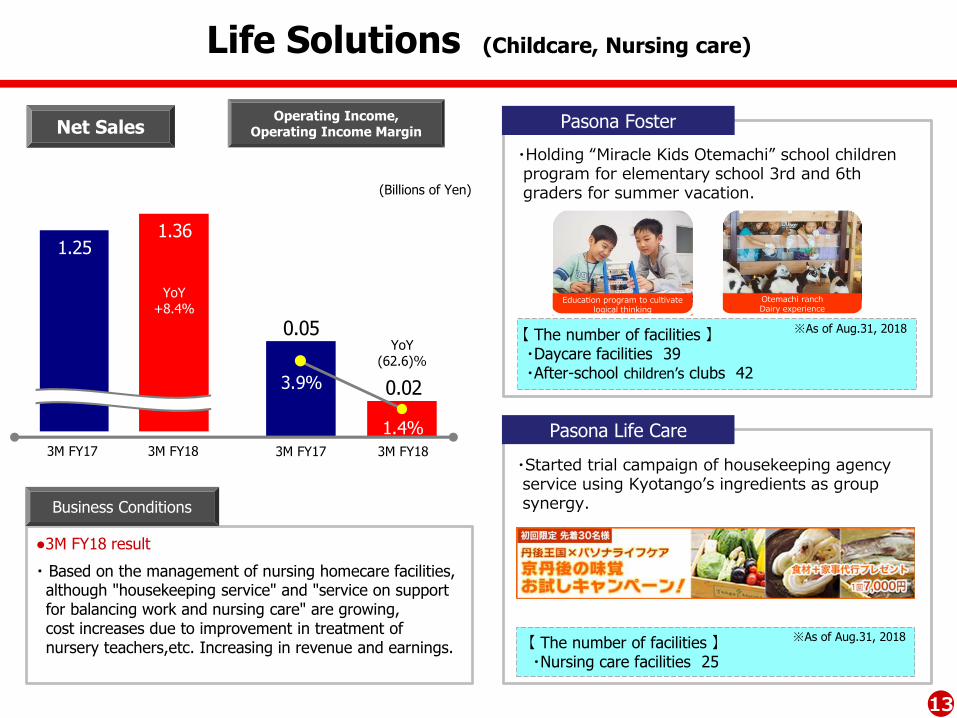
・Holding “Miracle Kids Otemachi” school children program for elementary school 3rd and 6th graders for summer vacation.
・Started trial campaign of housekeeping agency service using Kyotango’s ingredients as group synergy.
Education program to cultivate logical thinking
Otemachi ranchDairy experience
【 The number of facilities 】・Daycare facilities 39・After-school children’s clubs 42
※As of Aug.31, 2018
※As of Aug.31, 2018【 The number of facilities 】・Nursing care facilities 25
Pasona Life Care
Pasona Foster
●3M FY18 result
・ Based on the management of nursing homecare facilities, although "housekeeping service" and "service on support for balancing work and nursing care" are growing, cost increases due to improvement in treatment of nursery teachers,etc. Increasing in revenue and earnings.
3M FY17 3M FY18 3M FY17 3M FY18
Business Conditions
1414
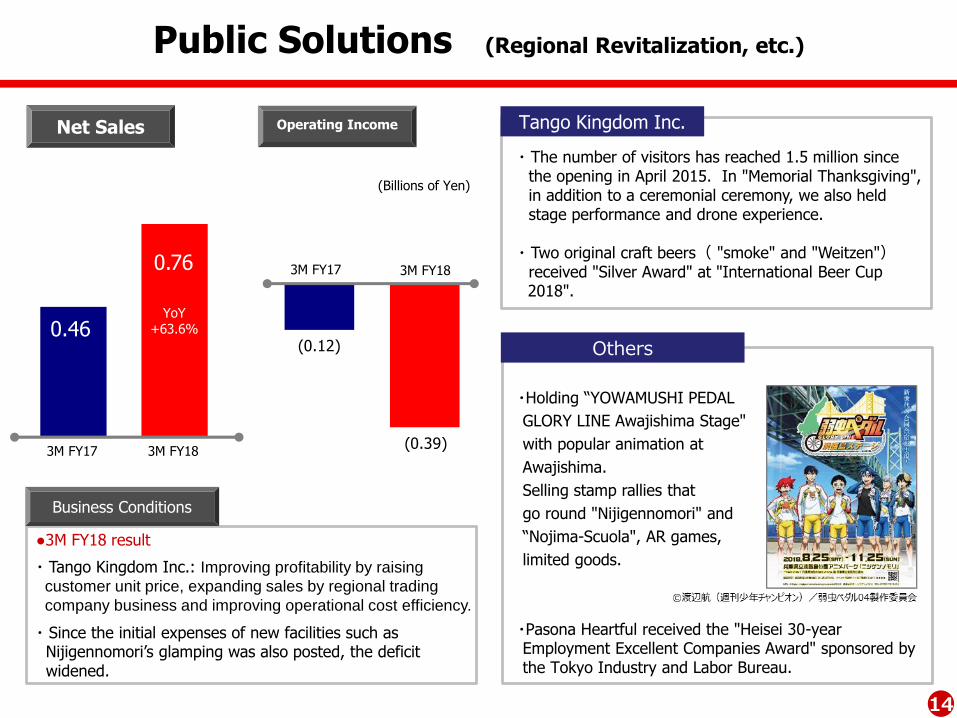
(0.12)
(0.39)
0.46
0.76
YoY+63.6%
Public Solutions (Regional Revitalization, etc.)
Operating Income
(Billions of Yen)
3M FY17 3M FY18
3M FY17 3M FY18
Net Sales Tango Kingdom Inc.
Others
・Holding “YOWAMUSHI PEDAL
GLORY LINE Awajishima Stage"
with popular animation at
Awajishima.
Selling stamp rallies that
go round "Nijigennomori" and
“Nojima-Scuola", AR games,
limited goods.
・Pasona Heartful received the "Heisei 30-year Employment Excellent Companies Award" sponsored by the Tokyo Industry and Labor Bureau.
●3M FY18 result
・ Tango Kingdom Inc.: Improving profitability by raising
customer unit price, expanding sales by regional trading
company business and improving operational cost efficiency.
・ Since the initial expenses of new facilities such as Nijigennomori’s glamping was also posted, the deficit widened.
・ The number of visitors has reached 1.5 million since the opening in April 2015. In "Memorial Thanksgiving", in addition to a ceremonial ceremony, we also held stage performance and drone experience.
・ Two original craft beers( "smoke" and "Weitzen")received "Silver Award" at "International Beer Cup 2018".
Business Conditions
1515
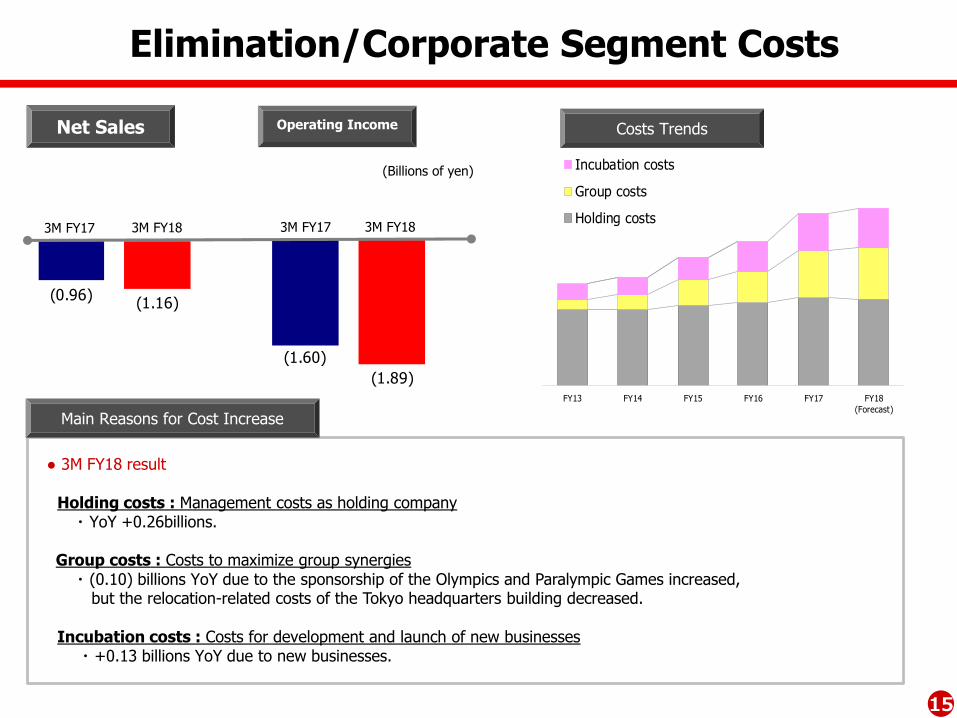
(1.60)
(1.89)
(0.96)(1.16)
FY13 FY14 FY15 FY16 FY17 FY18
(Forecast)
Incubation costs
Group costs
Holding costs
Elimination/Corporate Segment Costs
(Billions of yen)
Main Reasons for Cost Increase
Costs Trends
● 3M FY18 result
Holding costs : Management costs as holding company ・ YoY +0.26billions.
Group costs : Costs to maximize group synergies・ (0.10) billions YoY due to the sponsorship of the Olympics and Paralympic Games increased,
but the relocation-related costs of the Tokyo headquarters building decreased.
Incubation costs : Costs for development and launch of new businesses・ +0.13 billions YoY due to new businesses.
Operating IncomeNet Sales
3M FY17 3M FY173M FY18 3M FY18
1616
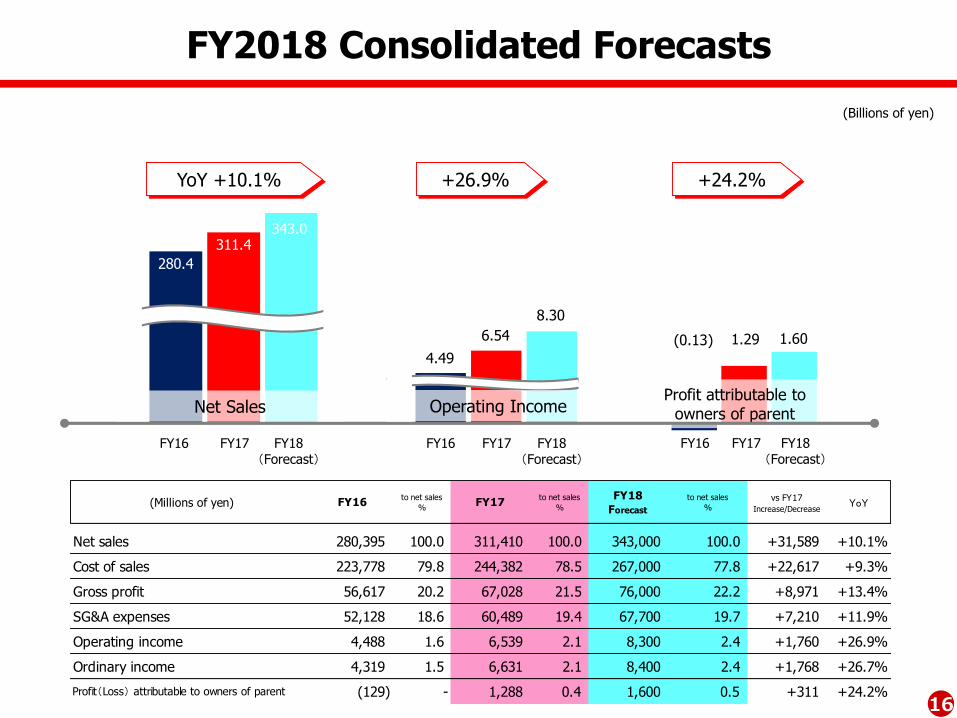
4.49
6.54
8.30
(0.13) 1.29 1.60
280.4
311.4343.0
Profit attributable to owners of parent
(Billions of yen)
FY16 FY18(Forecast)
FY17
FY2018 Consolidated Forecasts
FY16 FY18(Forecast)
FY17FY16 FY18(Forecast)
FY17
Net Sales
YoY +10.1% +26.9%
(Millions of yen) FY16to net sales
%FY17
to net sales
%
FY18
Forecast
to net sales
%vs FY17
Increase/DecreaseYoY
Net sales 280,395 100.0 311,410 100.0 343,000 100.0 +31,589 +10.1%
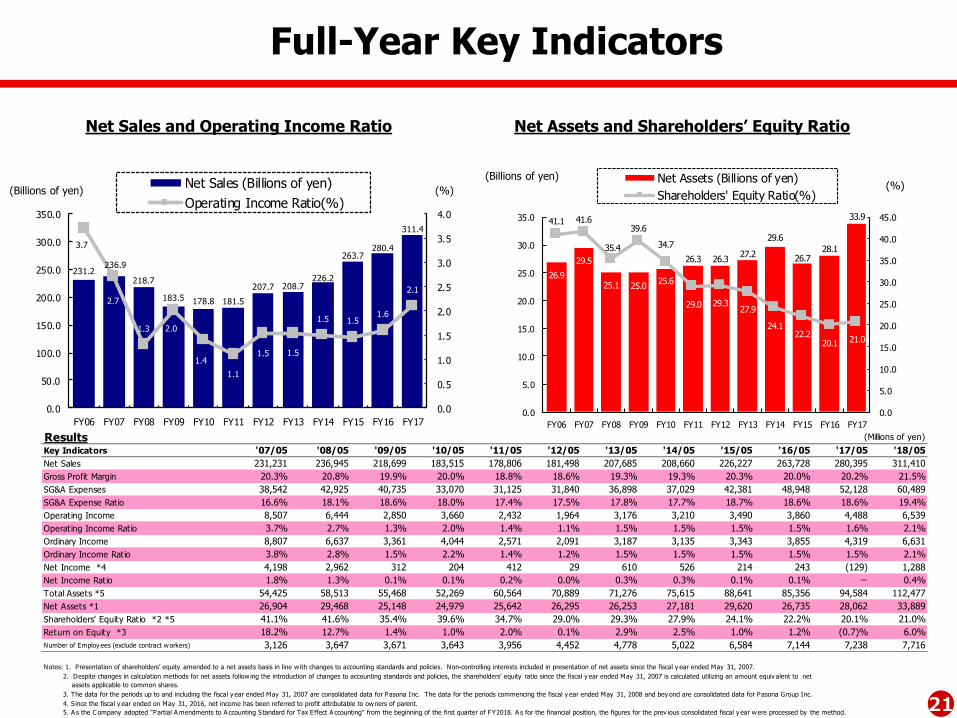
Number of Employ ees (exclude contract workers) 3,126 3,647 3,671 3,643 3,956 4,452 4,778 5,022 6,584 7,144 7,238 7,716
Notes: 1. Presentation of shareholders’ equity amended to a net assets basis in line w ith changes to accounting standards and policies. Non-controlling interests included in presentation of net assets since the fiscal y ear ended May 31, 2007.
2. Despite changes in calculation methods for net assets follow ing the introduction of changes to accounting standards and policies, the shareholders’ equity ratio since the fiscal y ear ended May 31, 2007 is calculated utilizing an amount equiv alent to net
assets applicable to common shares.
3. The data for the periods up to and including the fiscal y ear ended May 31, 2007 are consolidated data for Pasona Inc. The data for the periods commencing the fiscal y ear ended May 31, 2008 and bey ond are consolidated data for Pasona Group Inc.
4. S ince the fiscal y ear ended on May 31, 2016, net income has been referred to profit attributable to owners of parent.
5. A s the C ompany adopted "Partial A mendments to A ccounting Standard for Tax Effect A ccounting” from the beginning of the first quarter of FY2018. A s for the financial position, the figures for the prev ious consolidated fiscal y ear were processed by the method.
22
Financial
companies
2,905,400
(6.97%)
Securities
companies
639,423
(1.53%)
Other
corporations
5,086,997
(12.20%)
Foreign
corporations and
other foreign
investors
10,007,458
(24.01%)
Individuals
and others
20,952,242
(50.26%)
Treasury
stock
2,098,780
(5.03%)
Financial companies 29 (0.28%)
Securities companies35 (0.33%)
Other corporations 117 (1.11%)
Foreign corporations and other foreign
investors 174 (1.65%)
Individuals and others 10,173
(96.62%)
Treasury stock 1 (0.01%)
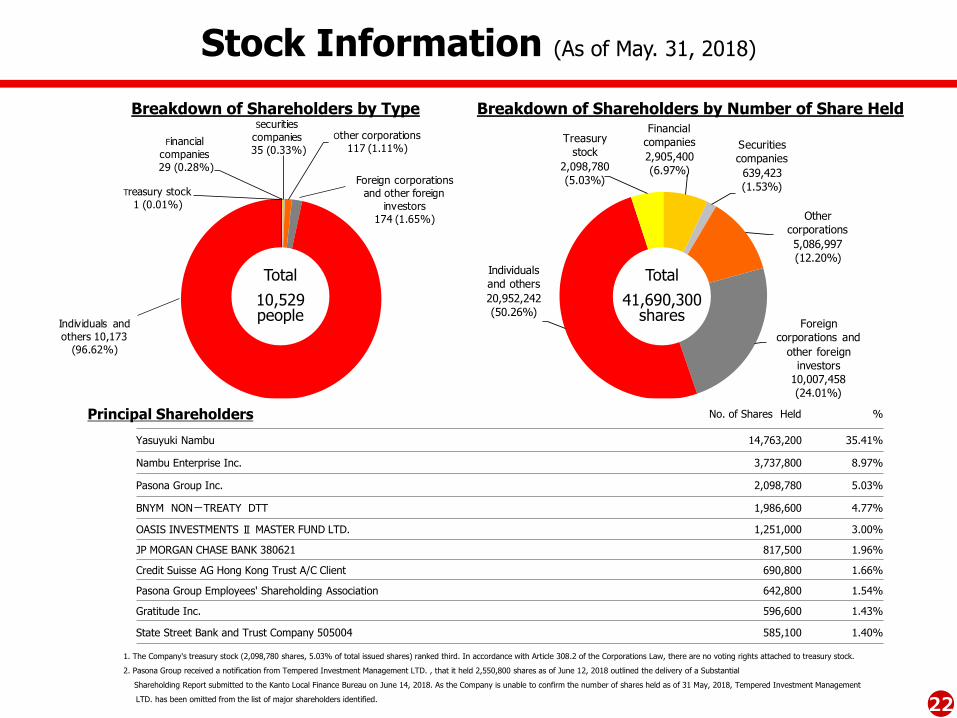
Stock Information (As of May. 31, 2018)
Breakdown of Shareholders by Type Breakdown of Shareholders by Number of Share Held
1. The Company's treasury stock (2,098,780 shares, 5.03% of total issued shares) ranked third. In accordance with Article 308.2 of the Corporations Law, there are no voting rights attached to treasury stock.
2. Pasona Group received a notification from Tempered Investment Management LTD. , that it held 2,550,800 shares as of June 12, 2018 outlined the delivery of a Substantial
Shareholding Report submitted to the Kanto Local Finance Bureau on June 14, 2018. As the Company is unable to confirm the number of shares held as of 31 May, 2018, Tempered Investment Management
LTD. has been omitted from the list of major shareholders identified.
Total
10,529people
Total
41,690,300shares
Principal Shareholders No. of Shares Held %
Yasuyuki Nambu 14,763,200 35.41%
Nambu Enterprise Inc. 3,737,800 8.97%
Pasona Group Inc. 2,098,780 5.03%
BNYM NON-TREATY DTT 1,986,600 4.77%
OASIS INVESTMENTS Ⅱ MASTER FUND LTD. 1,251,000 3.00%
JP MORGAN CHASE BANK 380621 817,500 1.96%
Credit Suisse AG Hong Kong Trust A/C Client 690,800 1.66%
Pasona Group Employees' Shareholding Association 642,800 1.54%
Gratitude Inc. 596,600 1.43%
State Street Bank and Trust Company 505004 585,100 1.40%
23
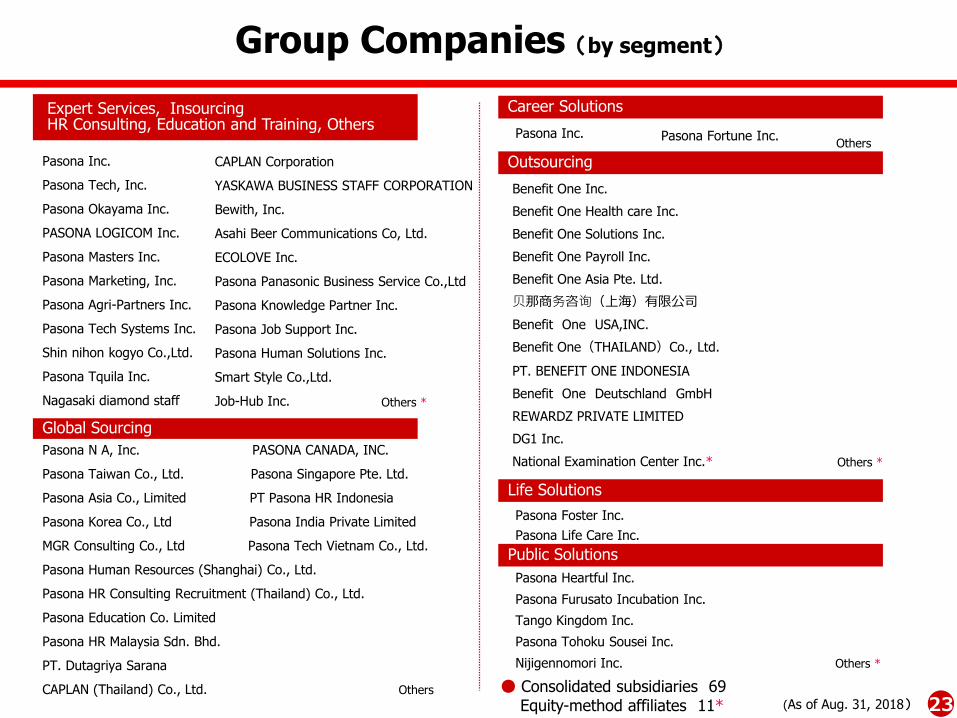
Expert Services, Insourcing HR Consulting, Education and Training, Others