43
Results for the Fiscal Year Ended March 2016 May 19, 2016

Results for the Fiscal Year Ended March 2016
May 19, 2016

Copyright © 2016 JAPAN POST BANK CO., LTD. All Rights Reserved.
Table of Contents
1
Super Regional & Super Global
1. Overview of FY2016/3 Results・ Summary of Financial Results・ Overview of FY2016/3 Results・ Condensed Balance Sheet (1)・ Condensed Balance Sheet (2)・ Management Indicators・ ALM/Investment Strategy to Generate Stable Income and Excess Return (BP)・ ALM/Investment Strategy to Generate Stable Income and Excess Return (SP)・ Investment Strategy ~Net Gains and Losses by Portfolio~・ Investment Strategy ~Net Unrealized Gains/Losses on
Available-for-Sale Securities etc.~・ Marketing Strategy ~Increase in Fees and Commissions (1)~・ Marketing Strategy ~Increase in Fees and Commissions (2)~・ Marketing Strategy ~Trends in Pension and Salary Account Users~・ Development of Robust Management System ~Cost Reductions~
Note: In these presentation materials, all figures have been rounded down to the nearest trillion or billion yen amount except where noted.
Accordingly, the total of each account may not be equal to the combined total of individual items.
2. FY2017/3 Earnings Forecasts and Dividend Policy・ FY2017/3 Earnings Forecasts・ Dividend Policy
3. Initiatives Related to Management Issues・ Impact of Negative Interest Rates・ Investment Strategy ~Further Strengthening of Investment Organization~・ Investment Strategy ~Reinforcement of Risk Management Framework~・ Marketing Strategy ~ Initial Launch of JP Asset Management Products~
Appendix

Copyright © 2016 JAPAN POST BANK CO., LTD. All Rights Reserved.
Super Regional & Super Global
2
● Super Global1. Sophistication of investment strategy as one of the largest institutional investors in Japan
-Pursuit of higher returns from market-
Dynamic acceleration of international diversified allocation of
investments
Commencement of alternative investments
2. Reinforcement of risk management in relation to risk taking
Refined sensitivity required for varied and diverse risk taking→
Innovate and reform the Investment Division to
realize:
→ Following the near completion of system development, the fiscal year ending March 2017
will be the year of execution
Development of ALM and
risk management framework

Copyright © 2016 JAPAN POST BANK CO., LTD. All Rights Reserved.
Super Regional & Super Global
3
● Super Regional -A challenge going forward-
・ Assumptions:
Achievement of mid-term business plan Cooperation with post offices (the Bank’s actual business base)
Leveraging of strengths, namely, nationwide network and staff
【Near-term priorities】
Special focus on sales of investment trusts that are suitable for the Bank
-Trend from savings toward investment, development of products for customers without investment experience-
【Direction of new medium- to long-term stage】
→ “Seed sowing/cultivation” during period of mid-term business plan
1 Pursuit of alliance strategy without taboos (by sector, by region, by business type, development of low-cost operation)
2 Cultivation and cooperation in new business sectors aimed at co-existence with existing financial institutions

Copyright © 2016 JAPAN POST BANK CO., LTD. All Rights Reserved. 4
1.Overview of FY2016/3 Results

Copyright © 2016 JAPAN POST BANK CO., LTD. All Rights Reserved.
FY2016/3 Net ordinary income result
¥481.9bn
(¥200.0bn)
¥140.0bn
Increase in SP
revenues
FY2017/3 Net ordinary income
result¥420.0bn
(¥193.3bn)
¥1.8bn
¥52.2bn
¥51.6bn
Cost reduction
Summary of Financial Results
5
FY2015/3 Net ordinary income result
¥569.4bn
Unrealized Gains (Losses) on Financial Assets (Mar 31, 2015)Held-to-maturity securities ¥2,268.3bn
Available-for-sale securities(after taking into account of gains (losses) from hedge accounting) ¥4,681.5bn
Held-to-maturity Securities ¥2,208.3bn
Available-for-sale Securities(after taking into account of gains (losses) from hedge accounting) ¥4,186.4bn
Unrealized Gains (Losses) on Financial Assets (Mar 31, 2016)
Decrease in BPrevenues, etc.
Increase in net fees &
commissions
Additional reduction of compulsory
expenses
Strategic expenses in
growth areas
Expansion of growth areas such as sales of
investment trusts
Improvement of business
base
Cost reduction
Increase in SP
revenues
FY2016/3 Net ordinary income result
¥481.9bn
Positive factor
Negative factor
Decrease in BPrevenues, etc.
Positive factor
Negative factor
FY2016/3 was a milestone year on the back of our IPO. FY2017/3 will be a year to improve business base. FY2018/3 will be the finishing year of the mid-term business plan and FY2019/3 will be a year of cultivating new opportunities. To realize our plan, the Bank views the rest of the mid-term business plan period as a seed sowing time.
<Estimated Changes in Net Ordinary Income from FY16/3 to FY17/3><Changes in Net Ordinary Income from FY15/3 to FY16/3>(illustration) (illustration)
Increase in net fees &
commissions

Copyright © 2016 JAPAN POST BANK CO., LTD. All Rights Reserved.
Overview of FY2016/3 Results
6
Performance in FY2016/3
(¥bn)
※1 Excludes non-recurring losses.
Decreased, reflecting historically low interest ratesIncreased steadily
Mainly reflecting the lowered deposit insurancerate
FY2016/3 Results
FY2016/3Forecasts Progress rate
Net ordinary income 481.9 460.0 104.7
Net income 325.0 320.0 101.5
(¥bn, %)
FY2016/3 Difference FY2015/3
Gross operating profit 1,452.0 (182.6) 1,634.7
Net interest income 1,361.0 (179.7) 1,540.7
Net fees and commissions 91.1 +1.8 89.2
Net other operating income (loss) (0.1) (4.8) 4.7
Gains (losses) on foreign exchanges (1.4) (10.7) 9.3
Gains (losses) on bonds 1.8 +6.4 (4.5)
General and administrativeexpenses※1 1,066.1 (48.5) 1,114.7
Provision for general reserve- - -
for possible loan losses
Net operating profit 385.8 (134.1) 519.9
Non-recurring gains (losses) 96.1 +46.6 49.4
Gains (losses) on money held in trust 93.8 +50.7 43.1
Net ordinary income 481.9 (87.4) 569.4
Net income 325.0 (44.3) 369.4

Copyright © 2016 JAPAN POST BANK CO., LTD. All Rights Reserved.
Condensed Balance Sheet (1)
7
(¥tn)
Increase in BOJ deposits balance
Shift from JGBs to foreign securities
March 31, 2016 Difference March 31, 2015Cash and due from banks, call loans, and receivables under securities borrowing transactions
54.7 +11.1 43.6
JGBs 82.2 (24.5) 106.7
Japanese local government bonds 5.8 +0.3 5.5
Corporate bonds 10.5 (0.4) 10.9
Foreign securities 45.3 +12.5 32.8
Loans 2.5 (0.2) 2.7
Money held in trust 3.5 +0.0 3.4
Other assets 2.0 (0.0) 2.0
Total assets 207.0 (1.1) 208.1
Deposits 177.8 +0.1 177.7
Other liabilities 17.6 (1.1) 18.8
Liabilities 195.5 (1.0) 196.5
Net assets 11.5 (0.1) 11.6

Copyright © 2016 JAPAN POST BANK CO., LTD. All Rights Reserved.
Condensed Balance Sheet (2)
8
March 31, 2016 Difference March 31, 2015
Capital stock 3,500.0 - 3,500.0
Capital surplus 4,296.2 - 4,296.2
Retained earnings 2,108.9 +140.3 1,968.6
Treasury stock (1,299.9) - (1,299.9)
Total shareholders’ equity 8,605.2 +140.3 8,464.9
Total valuation and translation adjustments 2,902.8 (262.4) 3,165.3
Total net assets 11,508.1 (122.0) 11,630.2
Breakdown of net assets
Decreased due to total valuation and translation adjustments
Difference between dividends paid of ¥184.7bn and net income of ¥325.0bn
(¥bn)

Copyright © 2016 JAPAN POST BANK CO., LTD. All Rights Reserved.
Management Indicators
9
March 31, 2016 Difference (% pt) March 31, 2015
Capital adequacy ratio (Domestic standards) 26.38% (12.04) 38.42%
Total capital 8,499.3 8,274.0
Total risk weighted assets 32,218.5 21,533.4
Loss-to-capital ratio 7.03% (2.27) 9.31%
Amount of lossJapanese yen
US dollars
598.0178.8366.2
770.5200.6506.7
Capital 8,499.3 8,274.0
Leverage ratio (trial basis)1 4.10% +0.13 3.97%
Core capital 8,499.3 8,274.0
Total assets 207,056.0 208,179.3
ROE 2.80% (0.39) 3.20%
Net income 325.0 369.4Average of the beginning and ending
balances of net assets 11,569.1 11,542.9
1 Core Capital/Total assets (as reported on B/S)
Increased despite the decrease in G&A expenses due to YoY decrease in gross operatingprofit
Reflects the redemption and replacementof high-yield assets invested in the past to lower yield assets
Declined mainly due to increase in foreign credit investment
Yield on interest-earning assets 0.86% (0.09) 0.95%
Net interest margin 0.66% (0.09) 0.76%
Yield on interest-earning assets 0.86% 0.95%
Interest rate on interest-bearing liabilities 0.19% 0.18%
OHR 73.42% +5.23 68.19%
General and administrative expenses 1,066.1 1,114.7
Gross operating profit 1,452.0 1,634.7
(¥bn)

Copyright © 2016 JAPAN POST BANK CO., LTD. All Rights Reserved.
Portfolio Management Policy
Base Portfolio ¥136tn [(¥13tn) vs FY2015/3 end](Liability-driven portfolio)
Purpose: The foundation of our ALM
Funding: Stable liabilities (over 90% are retail, small-sized deposits)
Strategy: Main source of income – spread between long and short-term interest rates; aim for carry profitsProvides internal funding to the Satellite Portfolio
ALM/Investment Strategy to Generate Stable Income and Excess Return (BP)
Base Portfolio: Manages interest rate/liquidity risk, secures basic return mainly from JGBs. Stable funding enables held-to-maturity investment. JGB balance decreased, reflecting historically low interest rates.
10
1. Short term assets include cash and due from banks, call loans, receivables under securities borrowingtransactions (excl. those in trust), T-bills, short-term corporate bonds, etc.
10
(management accounting basis, figures are rounded to the trillion)
(Reference 1) BP and SP Shares of Portfolio (Reference 2) Domestic Implied Forward Rates (Present compared to December 31, 2014)
Note: Percentages are rounded.
▲ 0.3%▲ 0.2%▲ 0.1%
0.0%0.1%0.2%0.3%0.4%0.5%0.6%0.7%0.8%
14/12 15/3 15/6 15/9 15/12 16/3 16/6 16/9 16/12 17/3 17/6 17/9 17/12 18/3
10-year IFR (Dec 31, 2014)
2-year rate (actual)
10-year rate (actual)
10-year IFR (Jan 31, 2016)
2-year IFR (Dec 31, 2014)
2-year IFR (Jan 31, 2016)
91 86 85 84 81 76 69
9 14 15 16 19 24 31
0%10%20%30%40%50%60%70%80%90%
100%
3/31
/10
3/31
/11
3/31
/12
3/31
/13
3/31
/14
3/31
/15
3/31
/16
SP
BP
Mar 31, 2016 Difference Mar 31, 2015
Short-term assets1 48 +12 35
Bonds held to maturity-JGBs, Government
guaranteed bonds52 (14) 66
Available for sale securities-JGBs 36 (11) 47
Loans 1 (0) 2
(¥tn)
10/3 11/3 12/3 13/3 14/3 15/3 16/3
(0.1%)(0.2%)(0.3%)
(Yr/Mth)

Copyright © 2016 JAPAN POST BANK CO., LTD. All Rights Reserved.
0102030405060708090
100110
13/3 13/9 14/3 14/9 15/3 15/9 16/3
Basis cost (USD/JPY 5 years)
UST repo (3 months)
(bp)
Basis cost (USD/JPY 1 month)
(Yr/Mth)
0.4%0.8%1.2%1.6%2.0%2.4%2.8%3.2%3.6%4.0%4.4%
13/3 13/9 14/3 14/9 15/3 15/9 16/3
5-year UST
BB rating
A rating
BBB rating
(Yr/Mth)
0
10
20
30
40
50
60
70
07 07 08 09 10 11 12 13 14 15
(¥tn)
(As of Oct 1) (Mar. 31 of each FY)
¥4tn
¥48tn
¥62tnSP balance increased by ¥13tn year on year
Portfolio Management Policy
Satellite Portfolio ¥62tn [+13tn vs FY2015/3 end](Excess-return portfolio)
Purpose: Pursue excess return
Funding: Mainly internal funding from the Base Portfolio(Transfer price based on market interest rates)
Strategy: Promote global asset allocation while assessing market and economic conditionsAim to achieve excess return including capital gainsCreate a “hedge position” by adding assets with negativecorrelation against domestic bonds
ALM/Investment Strategy to Generate Stable Income and Excess Return (SP)
Satellite Portfolio: Seek excess return by taking credit/market risk through global asset. Solid capital allows over-the-cycle investment. Further progress in global asset allocation and increase in foreign securities.
11
1. Corporate bonds, etc., foreign securities include monetary claims bought.2. JGBs contained in money held in trust are included in the Base Portfolio.
11
(management accounting basis, figures are rounded to the trillion)
(Reference 1) SP Balance (Reference 2) US Credit Spread (Reference 3) Currency Hedging Cost
Mar 31, 2016 Difference Mar 31, 2015
Available-for-sale securities-Japanese local government
bonds-Corporate bonds, etc.1-Foreign securities1
[incl. Investment trusts]
67
45[26]
+1+1
+13[+12]
56
33[14]
Bonds held to maturity-Japanese local government
bonds, etc.0 (0) 1
Money held in trust2 (Stocks) 2 +0 2
Loans 1 +0 1
(¥tn)

Copyright © 2016 JAPAN POST BANK CO., LTD. All Rights Reserved.
FY2010/3 FY2011/3 FY2012/3 FY2013/3 FY2014/3 FY2015/3 FY2016/3
Average balance
Net gains (losses)
Average balance
Net gains (losses)
Average balance
Net gains (losses)
Average balance
Net gains (losses)
Average balance
Net gains (losses)
Average balance
Net gains (losses)
Average balance
Net gains (losses)
Total Portfolio(BP + SP) 189.5 488.8 184.2 519.7 184.2 573.4 187.4 592.1 190.5 573.1 194.2 559.9 196.5 480.4
Base Portfolio(BP) 173.9 446.3 162.8 444.4 157.4 438.7 158.0 342.1 156.7 289.7 151.7 94.7 141.7 (35.6)
BP Customer-based Funding, sales
- (6.6) - (65.8) - (57.6) - (60.2) - (120.3) - (222.4) - (250.4)
BP Investment Side, etc. - 452.9 - 510.3 - 496.4 - 402.3 - 410.0 - 317.2 - 214.7
Satellite Portfolio(SP) 15.6 42.5 21.4 75.2 26.7 134.6 29.3 249.9 33.7 283.4 42.4 465.1 54.8 516.0
Investment Strategy~ Net Gains and Losses by Portfolio ~
12
Notes: Average balance of the respective portfolios are calculated as the average of the beginning and ending balances in the fiscal yearNet gains and losses on each portfolio are calculated based on the formula below. The aggregate total gains and losses from both portfolios are largely consistent with our ordinary income:Net gains/losses = Net interest income, etc. (Interest income - Interest expenses + Other operating income - Other operating expenses + Gains on money held in trust - Losses on moneyheld in trust + Gains on sales of stock ,etc. - Losses on sales of stock, etc. - Write off on stock, etc.) + Net fees and commission income (Fees and commission income - Fees andcommission expenses) - Expenses (equivalent to general and administrative expenses in our statement of income)
( Average balance: ¥tn, Net gains (losses): ¥bn, figures are rounded )
Net Gains and Losses (Including Fees and Expenses, Management Accounting Basis)
Decrease
Increase

Copyright © 2016 JAPAN POST BANK CO., LTD. All Rights Reserved.
(591.4)35.3
(974.4)
(605.3)
1,170.8 883.8
5,076.5
3,872.4
▲ 20,000
▲ 10,000
0
10,000
20,000
30,000
40,000
50,000
60,000
70,000
2015/1/1 2016/1/1
(¥bn)
Money held in trust classified as available-for-sale(mainly Japanese
stocks)Application of fair
value hedged accounting
Available-for-sale securities (excl. unlisted stocks)
Derivatives under hedge accounting (deferred hedge
accounting)
Approx. ¥4.1tn
Approx. ¥4.6tn
7,000
6,000
5,000
4,000
3,000
2,000
1,000
0
(1,000)
(2,000)March 31, 2015
1.6
1.8
2.0
2.2
2.4
2.6
(0.2)
0.0
0.2
0.4
0.6
0.8
15/4 15/5 15/6 15/7 15/8 15/9 15/10 15/11 15/12 16/1 16/2 16/3
(%)(%) Interest Rates
(Yr/Mth)
10-yr UST (RHS)
10-yr JGB (LHS)
Investment Strategy ~ Net Unrealized Gains/Losses on Available-for-Sale Securities etc. ~
13
In response to falling share prices and widening overseas spreads, net unrealized gains have decreased but are still at a high level.
Notes:1 Securities shown above include “securities,” negotiable certificates of deposit, which is recorded under “cash and due from banks” and “monetary claims bought.”
2 No impairment losses were recognized on available-for-sale securities for FY2016/3 and FY2015/3.3 Impairment losses on money held in trust, which is classified as available-for-sale, for FY2016/3 and FY2015/3
amounted to ¥1.5 billion and ¥0.5 billion, respectively.
<Net Unrealized Gains/Losses onAvailable-for-Sale Securities etc.>
(Reference) Various Market Indicators
1,1001,2001,3001,4001,5001,6001,7001,800
15/4 15/5 15/6 15/7 15/8 15/9 15/10 15/11 15/12 16/1 16/2 16/3
(pt) TOPIX
(Yr/Mth)
1.2
1.4
1.6
1.8
2.0
2.2
15/4 15/5 15/6 15/7 15/8 15/9 15/10 15/11 15/12 16/1 16/2 16/3
(%)
(Yr/Mth)
US Credit Spreads
March 31, 2016
Copyright © 2016 JAPAN POST BANK CO., LTD. All Rights Reserved.
Marketing Strategy ~Increase in Fees and Commissions (1)~
14
Enhancement of Consulting Marketing Investment Trust Sales
Net Balance of Investment TrustsVariable Annuities Business
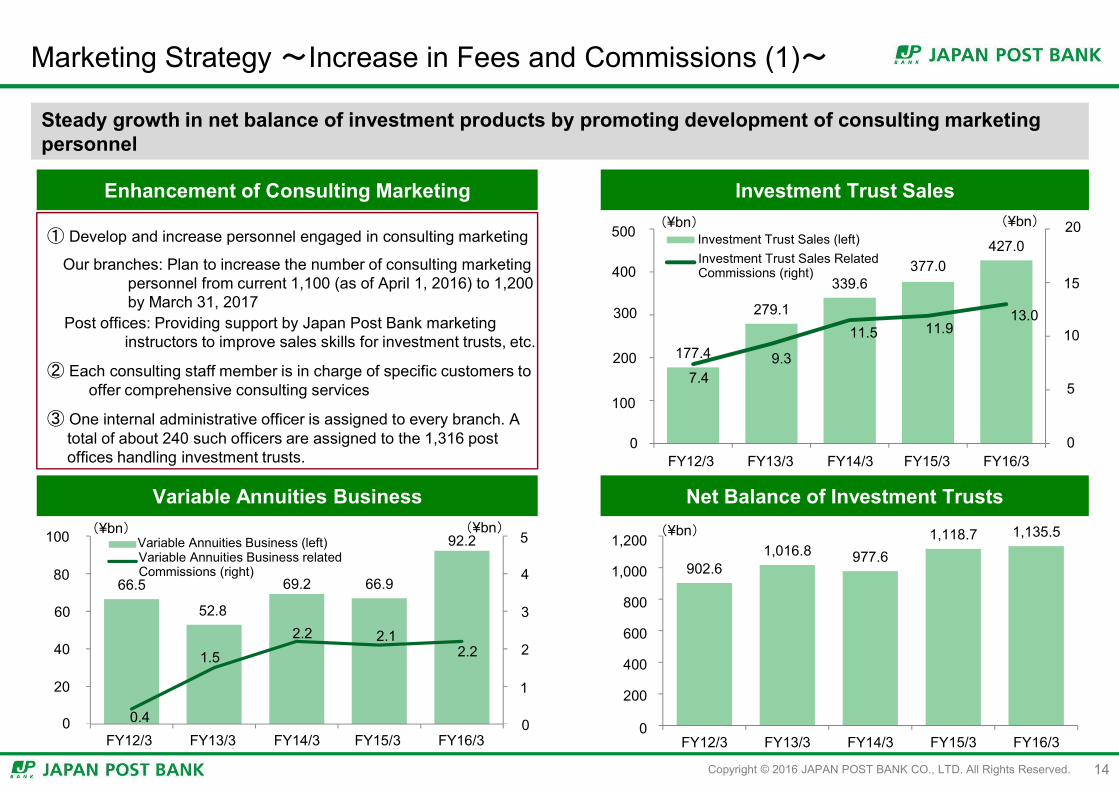
① Develop and increase personnel engaged in consulting marketing
Our branches: Plan to increase the number of consulting marketing personnel from current 1,100 (as of April 1, 2016) to 1,200 by March 31, 2017
Post offices: Providing support by Japan Post Bank marketinginstructors to improve sales skills for investment trusts, etc.
② Each consulting staff member is in charge of specific customers tooffer comprehensive consulting services
③ One internal administrative officer is assigned to every branch. A total of about 240 such officers are assigned to the 1,316 post offices handling investment trusts.
902.61,016.8 977.6
1,118.7 1,135.5
0
2,000
4,000
6,000
8,000
10,000
12,000
FY12/3 FY13/3 FY14/3 FY15/3 FY16/3
(¥bn)1,200
1,000
800
600
400
200
0
177.4
279.1
339.6 377.0
427.0
7.4 9.3
11.5 11.9 13.0
0
50
100
150
200
0
1,000
2,000
3,000
4,000
5,000
12/3期 13/3期 14/3期 15/3期 16/3期
(¥bn)(¥bn)投資信託販売金額(左軸)
投資信託関連手数料(右軸)
FY12/3 FY13/3 FY14/3 FY15/3 FY16/3
66.5
52.8
69.2 66.9
92.2
0.4
1.5
2.2 2.1 2.2
0
10
20
30
40
50
0
200
400
600
800
1,000
12/3期 13/3期 14/3期 15/3期 16/3期
(¥bn)(¥bn)変額年金保険販売金額(左軸)
変額年金保険関連手数料(右軸)
FY12/3 FY13/3 FY14/3 FY15/3 FY16/3
Steady growth in net balance of investment products by promoting development of consulting marketing personnel
Investment Trust Sales (left)Investment Trust Sales Related Commissions (right)
Variable Annuities Business (left)Variable Annuities Business related Commissions (right)
500
400
300
200
100
20
15
10
5
5
4
3
2
1
0
100
80
60
40
20
0
0

Copyright © 2016 JAPAN POST BANK CO., LTD. All Rights Reserved.
Marketing Strategy ~ Increase in Fees and Commissions (2)~
15
① Expand ATM network at conveniently accessible locations, grow alliances with regional financial institutions.② Promote the Bank to become the house bank of our customers by using the characteristics of our network and strengthen fee businesses such as sales of investment products and credit cards
ATM Business Strategy Results for Net Fees and Commissions(¥bn)
(1) Strategic installation of out-of-branch ATMsa. Installed approx. 500 ATMs in FamilyMart convenience stores mainly
in metropolitan areas in FY2015/3Number of usage cases has increased steadily since installationHigh usage rate by customers of other banks contributed to theBank’s revenues
b. Will continue to install ATMs in highly convenient locations, includinginstallation of small ATMs in narrow places
c. Aim to expand fee and commission revenues by installing andexpanding small ATMs in convenience stores, etc.※Apr 2016 Reached basic agreement with FamilyMart(increase installation of ATMs at FamilyMart nationwide)Jan 2017~Plan to progressively install small ATMs
(2) Business partnerships with regional financial institutionsa. Make efforts to have Japan Post Bank’s ATM network
broadly available for customers of regional financialinstitutions
b. Establish the Financial Institutions Business Department(April 2016)
(Reference)Number of regional banks whose account holderscan use Japan Post Bank’s ATMs free of charge duringbusiness hours:
9 banks (2014/3) ⇒ 11 banks (2016/3)
FY2016/3 FY2015/3 DifferenceNet fees and commissions 91.1 89.2 +1.8
Exchange and settlementtransactions 59.2 59.7 (0.4)
Zengin net fee 8.4 7.3 +1.0ATM related commissions 7.5 6.0 +1.5Investment trust relatedcommissions 13.0 11.9 +1.1New businesses related commissions 7.2 6.9 +0.3
Credit cards 3.9 3.8 +0.1
Variable Annuities 2.2 2.1 +0.0Consumer loans 1.0 0.9 +0.1
JGBs related commissions 2.5 3.2 (0.6)
Other 1.3 1.2 +0.0
Other: Aiming to start new types of transactions such as banking settlements using Fintech

Copyright © 2016 JAPAN POST BANK CO., LTD. All Rights Reserved.
Marketing Strategy~Trends in Pension and Salary Account Users~
Pension accounts are increasing moderately, salary accounts are increasing steadily every year and Japan Post Bank’s share is expanding.
16
(million)
Number of pension account users Number of salary account users
※ReferenceNumber of actual beneficiaries of public pensions without duplication: 39.91 million (end of
FY2015/3)
(Source) Ministry of Health, Labour and Welfare Pension Bureau “Fiscal 2014 Welfare Pension Insurance and National Pension Review of Operations"
Approx. 5 million people
※ReferenceSum total of number of salary earners at private-sector businesses (as of December 31,
2014) and national government employees and local government employees, etc. (end of FY2015/3): approx. 60.52 million (Source) Calculated by JP Bank based on National Tax Agency “2014 Statistical Survey of Actual Status for Salary in the Private Sector” and Cabinet Secretariat “International Comparison of Number of Employees in Public Sector per 1,000 Population (Data)”
950
960
970
980
990
1,000
13/3期 14/3期 15/3期 16/3期0 400
430
460
490
520
550
13/3期 14/3期 15/3期 16/3期0
FY13/3 FY14/3 FY15/3 FY16/3
Approx. 10 million people
13/3 14/3 15/3 16/3
10.0
9.9
9.8
9.7
9.6
5.5
5.2
4.9
4.6
4.3
(million)
13/3 14/3 15/3 16/3

Copyright © 2016 JAPAN POST BANK CO., LTD. All Rights Reserved.
Development of Robust Management System ~Cost Reductions~
17
Among general and administrative expenses, non-personnel expenses declined ¥52.2bn year on year to ¥865.1bn, mainly due to the lowered
deposit insurance rate.
While we project an increase in strategic expenses for growth areas (including sophistication of investment, development and introduction of small ATMs,
and reinforcement of investment trust sales) and in compulsory expenses, we will continue companywide efforts to enhance efficiency and keep total
expenses at the level of FY2016/3, in light of the severe business environment.(¥bn)
1,173.9
1,110.7 1,095.0
1,113.6
1,064.0 1,065.0
9,500
10,000
10,500
11,000
11,500
12,000(¥bn)
1,200
1,150
1,100
1,050
1,000
0FY12/3 FY13/3 FY14/3 FY15/3 FY16/3 FY17/3
(forecast)
0
Strategic cost: approx. ¥4bnIncrease in enterprise taxes: approx. ¥5bn
FY17/3(plan) FY16/3 Difference FY2015/3
Personnel expenses 127.0 123.2 +1.1 122.0
Non-personnel expenses 859.0 865.1 (52.2) 917.4
Commissions on bankagency services, etc.paid to JAPAN POST Co.,Ltd.
602.0 609.4 +6.9 602.4
Deposit insurancepremiums paid to JAPANPOST HOLDINGS Co.,Ltd.
8.0 9.8 (9.1) 18.9
Deposit insuranceexpenses paid to DepositInsurance Corporation ofJapan
66.0 64.4 (39.2) 103.6
Taxes and due 79.0 75.5 +1.4 74.1
Total 1,065.0 1,064.0 (49.6) 1,113.6

Copyright © 2016 JAPAN POST BANK CO., LTD. All Rights Reserved. 18
2. FY2017/3 Earnings Forecasts and Dividend Policy

Copyright © 2016 JAPAN POST BANK CO., LTD. All Rights Reserved. 19
For FY2017/3, the Bank forecasts net ordinary income of ¥420 billion and net income of ¥300 billion. Amid the severe business environment of ultra-low interest rates, while income from the Base Portfolio (BP) will decrease,
we will increase income from the Satellite Portfolio (SP) and secure stable profits.
FY2017/3(Forecast)
FY2016/3(Actual)
Net ordinary income 420.0 481.9
Net income 300.0 325.0
(¥bn) Actual and Estimated Net Interest Income, etc. Notes 1, 2, 3, 4
Notes:1. The Base Portfolio aims to secure stable income mainly from JGBs while managing interest rate and liquidity
risk. In contrast, the Satellite Portfolio aims to secure income mainly by taking credit and market risk, and specifically invests in corporate bonds, foreign securities and stocks (money held in trust), etc.
2. Net interest income, etc. = Interest income - Interest expenses + Other operating income - Other operating expenses + Gains on money held in trust - Losses on money held in trust + Gains on sales of stock ,etc. –Losses on sales of stock, etc. - Write off on stock, etc.
3. Figures in parentheses show fiscal year-end balances.4. Figures for net interest income, etc. are in billion yen units; those for balances are in trillion yen units.
We assume domestic and foreign interest rates will trend in line with implied forward rates as of Jan 31, 2016.
Assumed exchange rates: US$1=¥115, €1=¥125.
¥1,110bn[¥149tn] ¥930bn
[¥136tn] ¥730bn
¥470bn[¥48tn] ¥520bn
[¥61tn]¥660bn
2015.3期(実績) 2016.3期(実績) 2017.3期(計画)
SP
BP
¥1,580bn
¥1,450bn¥1,390bn
FY2015/3 (actual) FY2016/3 (actual) FY2017/3 (forecast)
Assumptions in Earnings Forecasts
FY2017/3 Earnings Forecasts
FY2017/3 Earnings Forecasts

Copyright © 2016 JAPAN POST BANK CO., LTD. All Rights Reserved.
Dividend Policy
20
Proactive and stable shareholder return
【Dividend policy (through FY2018/3 end】
(1) Dividend payout ratio: approximately 50% or moreHowever, 25% or more is targeted for FY2016/3(Taking into account the period between the date of listing and the dividend record date will be less than six months)
(2) Aim to pay a stable per-share dividend(3) Also aim to consider additional shareholder return while taking into account
developments on regulations, earnings growth and accumulation of retainedearnings, etc.
(Reference 1) Capital Adequacy Ratio (Mar 31, 2015) (Reference 2) Leverage Ratio (trial basis, Mar 31, 2015)
¥25 ¥25
¥25
¥0
¥10
¥20
¥30
¥40
¥50
¥60
FY2016/3 (actual) FY2017/3 (forecast)
Interim dividendYear-end dividend
¥25
¥50
<Dividend per share (actual, forecast)>
26.38%
12.71% 14.58% 12.75%
0%
10%
20%
30%
40%
50%
ゆうちょ BTMU SMBC みずほJapan Post Bank
Mizuho
4.10 %4.79 % 4.61 %
3.98 %
0%
2%
4%
6%
ゆうちょ MUFG SMFG みずほFGJapan Post Bank
Mizuho FG
Source: Corporate disclosure materialsNote: Japan Post Bank figures are announced on a non-consolidated business result
basis and the capital adequacy ratio is based on domestic standard (calculatedbased on notification regarding capital adequacy requirements) . Meanwhile,other banks release consolidated bank business results and their Tier 1 ratios arebased on uniform international standard.
Source: Corporate disclosure materials Note 1: Consolidated group basisNote 2: Regarding definition of leverage ratio by Basel Committee on Banking Supervision,
final adjustment is not completed.The Bank’s leverage ratio (trial basis) = Core capital/Total assets (as reported on B/S)

Copyright © 2016 JAPAN POST BANK CO., LTD. All Rights Reserved. 21
3. Initiatives Related to Management Issues

Copyright © 2016 JAPAN POST BANK CO., LTD. All Rights Reserved.
Impact of Negative Interest Rates
Policy-rate applied balance× 20bp (10bp→-10bp)
Macro add-on applied balance× 10bp (10bp→0)
Direct impact
Condensed Balance Sheet (March 31, 2016)
Total assets ¥207.0tn
Cash and due from banks,call loans, and receivablesunder securities borrowing
transactions¥54.7tn
JGBs¥82.2tn
Transfer deposits¥13.8tn
Net assets ¥11.5tn
Other liabilities¥17.6tn
Foreign securities¥45.3tn
Japanese local government bonds ¥5.8tn
Corporate bonds¥10.5tn
Ordinary deposits, etc.
¥49.5tn
Time deposits¥11.4tn
TEIGAKU deposits, etc.
¥102.4tn
Deposits ¥177.8tn
Other assets ¥2.0tn
Loans ¥2.5tnMoney held in trust ¥3.5tn
22
・Interest rate reduction: 0.03%→0.001%
Fixed-term deposits
・ Interest rate reduction: Time deposits (1 year ): 0.035%→0.01%
TEIGAKU deposits (3 years or more): 0.04%→0.01%
※ Note that from FY17/03 onward, deposits from about ten years ago with relatively high interest rates will reach maturity
Ordinary deposits
・FY2017/3: estimated securities redemption of about ¥21tn(Reference: FY2016/3 redemption was
about ¥24tn)
① Reinvestment in domestic bonds (including JGBs)
② Hedged investment in foreign securities
Examples of indirect impact

Copyright © 2016 JAPAN POST BANK CO., LTD. All Rights Reserved.
Investment Strategy ~Further Strengthening of Investment Organization~
① Active recruitment of investment professionals to explore new investment areas and further strengthen our organization by realizing synergies and collaboration with existing Investment Division members
② Establishment of new departments as below in line with the shift to a product oriented organizational framework specializing in various asset classes
23
Rates and FX Investment Department
Global Credit Investment Department
Equity Investment Department
Private Equity Investment Department
Real Estate Investment Department
Interest rates
Foreignexchange
Credit Stocks PE
Infrastructure projects
Real estate
Stable carry profits
contribution
+
Tactical risk positioning
Stable carry profits
contribution
+
Globally diversified investment
Globally diversified investment
+
Entry into new investment fields
Product oriented Organizational Framework Specializing in Various Asset Classes
Entry into new investment fields
+
Long-term profit contribution
Global Fund Investment Department
Treasury Department Establishment of solid foreign currency procurement system
Optimization of management costs and performance of trust management strategy
Cross-cuttingm
anagement for all
asset classes
Others

Copyright © 2016 JAPAN POST BANK CO., LTD. All Rights Reserved.
Natural Resources and Energy rated “A and over”
0.6%
BBB5.28%
A and over92.16%
BB, B and under2.56%Natural Resources and
Energy rated “BBB”0.6% Natural Resources and
Energy rated“BB, B and under”
0.3%
24
Current organization
Established Risk Management Division to strengthen the risk control system associated with investment diversificationAssigned full-time executive officer in charge of Risk Management Division to reinforce governance
Investment Strategy ~Reinforcement of Risk Management Framework~
Former organization
ALM Committee, Risk Management Committee
Corporate Administration
DivisionCorporate Planning
Department
ALMPlanning
Office
Etc.
Executive officer in charge
Executive officer in charge
ALM Committee, Risk Management Committee
Risk Management
DivisionRisk
Management Department
Credit Department
Research Department
Executive officer in charge
Corporate Administration
DivisionCorporate Planning
Department
ALMPlanning
Office
Risk Management Department
Credit Department
Etc.
Research Department
Development of risk management system(1) Enhance risk management system to correspond to the sophistication of alternative
investments, etc..(2) Research trends and develop organization in response to domestic and overseas
financial regulation reinforcements
Sophistication of credit assessment system(1) Reinforcement of creditworthiness evaluation and monitoring systems(2) Strengthening of credit assessment systems associated with sophistication of
investments
Notes: 1 Data in the above chart includes sovereign, financial institution, and industrial corporation bonds, loans and stocks. Rating categories are based on the Bank’sinternal ratings
2 Exposures are the accumulation of investment balances (managementaccounting and book value basis)
Mar 31, 2016¥194tn 1
<Exposures classified by ratings>

Copyright © 2016 JAPAN POST BANK CO., LTD. All Rights Reserved.
Marketing Strategy ~ Initial Launch of JP Asset Management Products~
Product Name Overview Purchase Commission (incl. tax)
Asset Management Costs (incl. tax)(Holding Costs) <Annual>
JP 4 Assets Balanced Fund
(Stable option/Stable Growth option/Growth option)
【Nickname: Yu Balance】
The Fund aims to secure stable earnings and
medium- to long-term growth of trust assets by
making diversified investments in domestic and
foreign stocks and bonds, through investment in
investment funds that will essentially target
investment in stocks and bonds in Japan and
other developed countries.
【Over-the-counter, by phone】1.08%
【Internet】Zero
0.4968%
[Actual trust remuneration]
Stable option: approx. 0.64584%Stable growth option: approx. 0.64908%Growth option: approx. 0.65232%
<Overview of investment trusts that the Bank has started handling>
25
<Sales of JP Investment Trusts(weekly)>
0.00.51.01.52.02.53.03.54.0
1週目 2週目 3週目 4週目 5週目 6週目 7週目 8週目 9週目 10週目 11週目 12週目
(¥bn)
Week1 Week2 Week3 Week4 Week5 Week6 Week7 Week8 Week9 Week10 Week11 Week12
① Started handling investment trust products established and managed by JP Asset Management Co., Ltd. for the first time on February 22, 2016The products are designed also for customers without investment experience
② Plan to expand customer base by recommending our “core products”, including new products of JP Asset Management Co., Ltd. to customers without investment experience
• First day sales of JP 4 Balanced Fund were approx. ¥1.3bn.
• Subsequent sales also showed solid performance.
(Reference)FY16/3 Investment trust sales: ¥427bn
Weekly average sales: ¥8.2bn0

Copyright © 2016 JAPAN POST BANK CO., LTD. All Rights Reserved.
Customers experienced in
investmentProducts of other asset management companies
Customers without investment experience
Main target
Diversification of basic assets
Domestic bonds
Overseas bonds
Overseas REITs
Domestic stocks Others
Balanced
Diversified investment in several basic assets
Diversification w
ithin basic assets
Overseas stocks
Others
Investment in a single basic asset
Government bonds
Others
Developed countries/High rated
Emerging nations/credit
Passive
Active
Developed countries
Emerging nations
Passive
Active
Passive
Active
Others
Recommended products for both experienced & unexperienced customers in investment
Products of other asset management companies
JP 4 Basic Assets Balanced Fund
Domestic REITs
26
Marketing Strategy ~ Initial Launch of JP Asset Management Products~

Copyright © 2016 JAPAN POST BANK CO., LTD. All Rights Reserved. 27
Appendix

Copyright © 2016 JAPAN POST BANK CO., LTD. All Rights Reserved.
Privatization and Listing Scheme of Japan Post Group
28
The Postal Service Privatization Act: the shares of Japan Post Holdings and the Two Financial Subsidiaries must be disposed withinthe earliest possible timeframe
Announcement by Japan Post Holdings: aim to list Japan Post Holdings, Japan Post Bank, and Japan Post Insurance concurrentlyJapan Post Holdings initially plans to incrementally dispose of its holdings in the Two Financial Subsidiaries until its ownership of each is reduced to around 50%
Shareholding requirements/sale policy pursuant to the Postal Service Privatization Act
The Japanese government must reduce its equity interest in Japan Post Holdings within the earliest possible timeframe. However, it shall maintain an equity interest that exceeds one-third
Japan Post must be wholly-owned by Japan Post Holdings
Japan Post Holdings is required to dispose of its entire interest in the Two Financial Subsidiaries (Japan Post Bank and Japan Post Insurance) within the earliest possible timeframe in light of the condition of their businesses, and having regard to the impact on the ability of Japan Post Holdings and Japan Post Co. to fulfill their obligations to provide access to universal services
Japan Post Holdings: Announcement on Dec. 26, 2014
(Concurrent initial public offerings)
Japan Post Holdings aims to conduct initial public offerings of the Two Financial Subsidiaries concurrently with the initial public offering of Japan Post Holdings
(Reduction of Japan Post Holdings’ equity interests in the Two Financial Subsidiaries)
In light of increasing management flexibility of the Two Financial Subsidiaries, Japan Post Holdings initially plans to incrementally dispose of its holdings in the Two Financial Subsidiaries until its ownership of each is reduced to around 50%, while maintaining the group’s unity and comprehensive strength
[Related Insurance C
ompany]
Obligation to provide universal services
Japanese Government
Japan Post Holdings
Japan Post
Post office+
Postal service
business
Japan Post Bank
Japan Post
Insurance
Must ownmore than 1/3 stake
Obligated to hold100% stake
Postal counter operations
Banking counter operations
Insurance counter
operations
[Related Bank]
Payment of Commissions
Copyright © 2016 JAPAN POST BANK CO., LTD. All Rights Reserved.
“Retail Financial Institution that Caters to All Segments of Society” and “One of the Largest Institutional Investors in Japan”
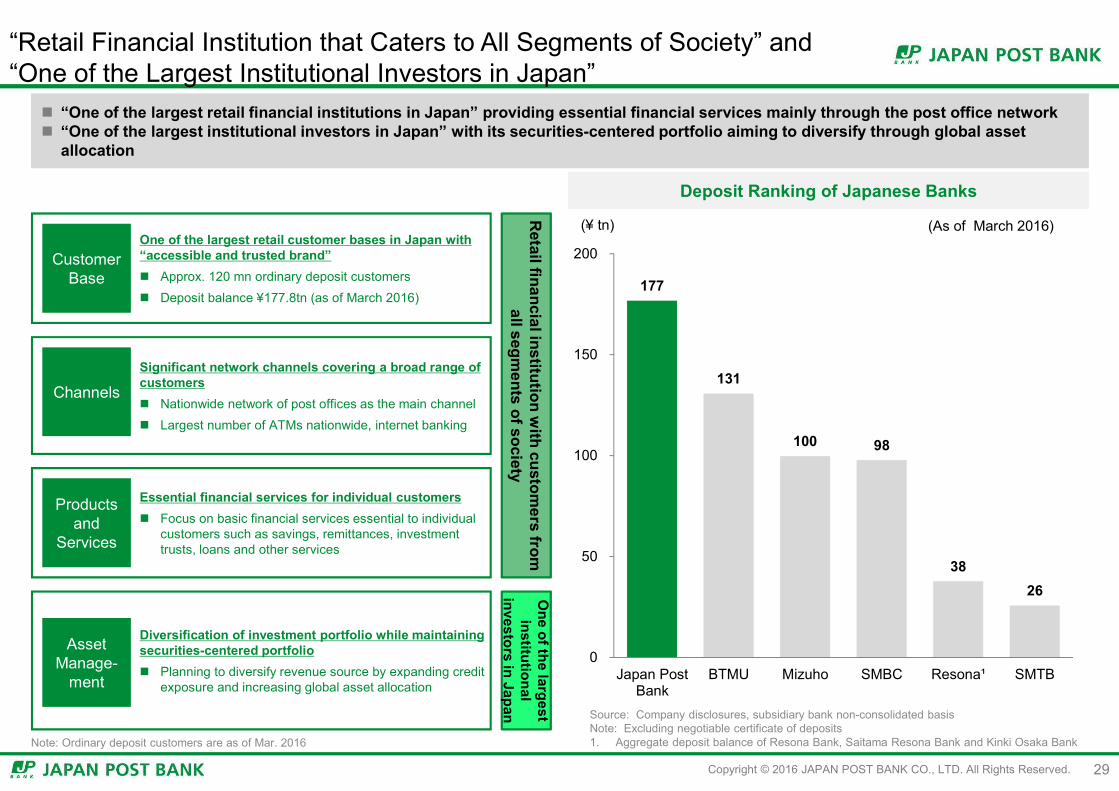
“One of the largest retail financial institutions in Japan” providing essential financial services mainly through the post office network “One of the largest institutional investors in Japan” with its securities-centered portfolio aiming to diversify through global asset
allocation
Deposit Ranking of Japanese Banks
29
Note: Ordinary deposit customers are as of Mar. 2016
(As of March 2015)
Source: Company disclosures, subsidiary bank non-consolidated basisNote: Excluding negotiable certificate of deposits1. Aggregate deposit balance of Resona Bank, Saitama Resona Bank and Kinki Osaka Bank
1
One of the largest retail customer bases in Japan with “accessible and trusted brand” Approx. 120 mn ordinary deposit customers Deposit balance ¥177.8tn (as of March 2016)
Customer Base
Retail financial institution w
ith customers from
all segm
ents of society
Significant network channels covering a broad range of customers Nationwide network of post offices as the main channel Largest number of ATMs nationwide, internet banking
Channels
Essential financial services for individual customers Focus on basic financial services essential to individual
customers such as savings, remittances, investment trusts, loans and other services
Productsand
Services
Diversification of investment portfolio while maintaining securities-centered portfolio Planning to diversify revenue source by expanding credit
exposure and increasing global asset allocation
Asset Manage-
ment
One of the largest
institutional investors in Japan
177
131
100 98
38 26
Japan PostBank
BTMU Mizuho SMBC Resona¹ SMTB0
50
100
150
200
(¥ tn) (As of March 2016)

Copyright © 2016 JAPAN POST BANK CO., LTD. All Rights Reserved.
Strategic & Financial Highlights
4. Investment Strategyhaving Secured Stable Profits 2. Retail Marketing Capability through the
Largest Network among Japanese Banks
3. Solid Capital Base
5. Growth Strategy and Compelling/Stable Shareholder Return
1. Maintained Stable Profitunder Economic Volatility
Condensed Balance Sheet (As of March 2016)
Total Assets ¥207.0 tn
Cash and due from banks, call loans, and receivables under
securities borrowing transactions¥54.7 tn
JGBs¥82.2 tn
Transfer deposits¥13.8 tn
Net assets ¥11.5 tn
Other liabilities¥17.6 tn
Foreign securities¥45.3 tn
Japanese local government bonds ¥5.8 tn
Corporate bonds ¥10.5 tn
Ordinary deposits, etc.
¥49.5 tn
Time deposits¥11.4 tn
TEIGAKU deposits, etc.
¥102.4 tn
Deposits ¥177.8 tn
Other assets ¥2.0tn
Loans ¥2.5tnMoney held in trust ¥3.5tn
30
Copyright © 2016 JAPAN POST BANK CO., LTD. All Rights Reserved.
(800)
(600)
(400)
(200)
0
200
400
600
800
08/3 09/3 10/3 11/3 12/3 13/3 14/3 15/3 16/3
(¥ bn)
(FY)
Japan Post Bank BTMUSMBC MizuhoMajor Regional Banks
Stable Profits through Retail Funding and Market Investment
31
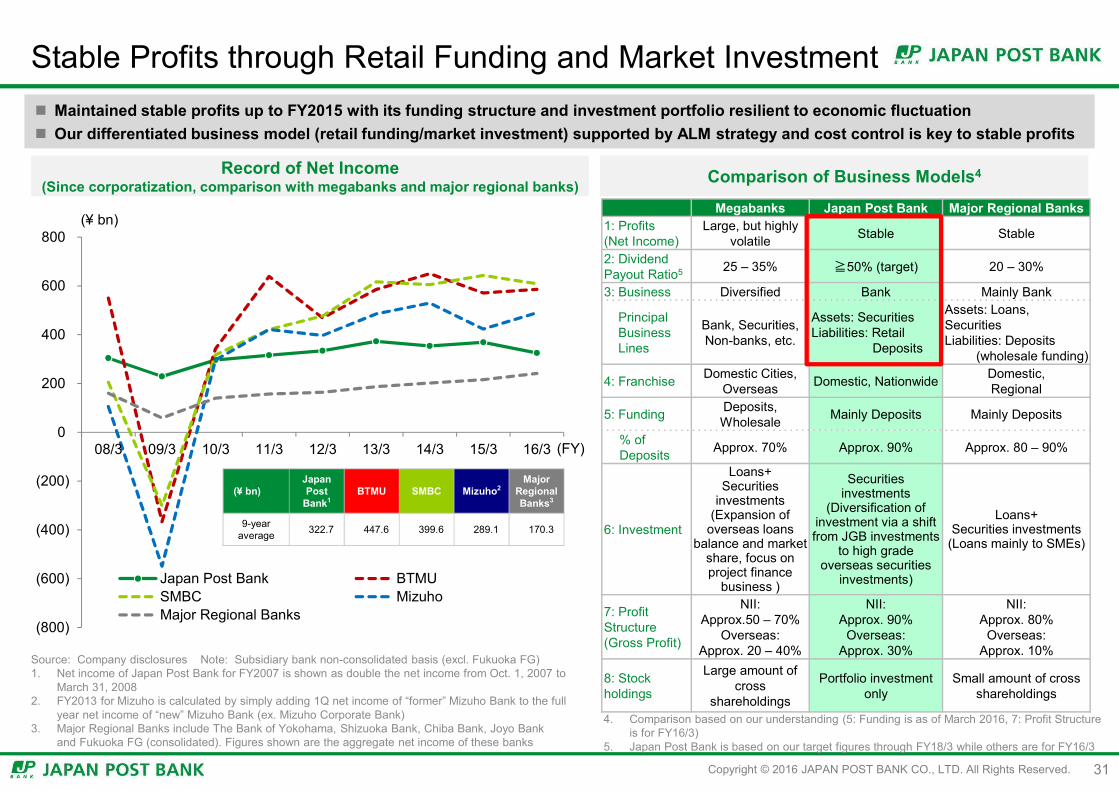
Maintained stable profits up to FY2015 with its funding structure and investment portfolio resilient to economic fluctuation Our differentiated business model (retail funding/market investment) supported by ALM strategy and cost control is key to stable profits
Record of Net Income(Since corporatization, comparison with megabanks and major regional banks) Comparison of Business Models4
(¥ bn)JapanPost
Bank1BTMU SMBC Mizuho2
Major Regional Banks3
9-year average 322.7 447.6 399.6 289.1 170.3
Megabanks Japan Post Bank Major Regional Banks1: Profits(Net Income)
Large, but highly volatile Stable Stable
2: Dividend Payout Ratio5 25 – 35% ≧50% (target) 20 – 30%
3: Business Diversified Bank Mainly Bank
PrincipalBusinessLines
Bank, Securities, Non-banks, etc.
Assets: SecuritiesLiabilities: Retail
Deposits
Assets: Loans, SecuritiesLiabilities: Deposits
(wholesale funding)
4: Franchise Domestic Cities,Overseas Domestic, Nationwide Domestic,
Regional
5: Funding Deposits, Wholesale Mainly Deposits Mainly Deposits
% of Deposits Approx. 70% Approx. 90% Approx. 80 – 90%
6: Investment
Loans+ Securities
investments(Expansion of
overseas loans balance and market
share, focus on project finance
business )
Securities investments
(Diversification of investment via a shift from JGB investments
to high grade overseas securities
investments)
Loans+ Securities investments
(Loans mainly to SMEs)
7: Profit Structure(Gross Profit)
NII: Approx.50 – 70%
Overseas: Approx. 20 – 40%
NII: Approx. 90%
Overseas: Approx. 30%
NII: Approx. 80%
Overseas: Approx. 10%
8: Stock holdings
Large amount of cross
shareholdings
Portfolio investment only
Small amount of cross shareholdings
4. Comparison based on our understanding (5: Funding is as of March 2016, 7: Profit Structure is for FY16/3)
5. Japan Post Bank is based on our target figures through FY18/3 while others are for FY16/3
Source: Company disclosures Note: Subsidiary bank non-consolidated basis (excl. Fukuoka FG)1. Net income of Japan Post Bank for FY2007 is shown as double the net income from Oct. 1, 2007 to
March 31, 20082. FY2013 for Mizuho is calculated by simply adding 1Q net income of “former” Mizuho Bank to the full
year net income of “new” Mizuho Bank (ex. Mizuho Corporate Bank)3. Major Regional Banks include The Bank of Yokohama, Shizuoka Bank, Chiba Bank, Joyo Bank
and Fukuoka FG (consolidated). Figures shown are the aggregate net income of these banks

Copyright © 2016 JAPAN POST BANK CO., LTD. All Rights Reserved.
Post
Offices
23,911
24,145
13,601
759 983 462
8,303
Japan PostBank
NationwideBank Total²
BTMU SMBC Mizuho (Reference)JA³
92%
36% 31% 28%
0%
20%
40%
60%
80%
100%
JapanPostBank
BTMU SMBC Mizuho
Stable/Low-cost Funding through Significant Network and Customer Base
Over 90% of our funding is retail deposits – relatively stable and low-cost funding structure compared to market-based funding Post offices, Japan’s largest physical network that covers every municipality in Japan, is our main channel. We hold a retail deposit
market share of approx. 20%
Breakdown of Funding Sources Domestic Branch Network
32
Japan Post Bank
Branches234
Estimated Share of Japan Post BankJapanese Household Deposits
Deposits at other banks
Japan Post Bank
approx. 20%4
(As of December 2015)
Source: Company disclosuresNote: Subsidiary bank non-consolidated basis1. Funding from financial markets includes negotiable certificates of deposit, call money,
payables under repurchase agreements, payables under securities lending transactions, commercial paper, borrowings, bonds, etc.
Source: Company disclosures, Japanese Bankers Association, JA Bank website2. Nationwide bank total: domestic head office/branches and sub branches of 116 banks
(excluding Japan Post Bank). Independent ATMs located outside of branches are not included in sub-branches , as of March, 2015
3. Total of Japan Agricultural Cooperative and the Prefectural Credit Federations of Agricultural Cooperatives locations with exchange operations, as of March31, 2014
4. Retail deposits of Japan Post Bank as of December 31, 2015 / household deposits (from “Flow of Funds Accounts” released by Bank of Japan) as of December 31, 2015
(Branches/Offices, as of September 2015)
Domestic Retail
Deposits
Deposits other than domestic retail
Funding from financial markets1Limited reliance on funding from financial markets
(As of March 2016)

Copyright © 2016 JAPAN POST BANK CO., LTD. All Rights Reserved.
JGBs, etc.188.0%
Japanese local government bonds
3.6%
ForeignSecurities
0.1%
Loans1.8%
Due frombanks, etc.2
2.9%Money heldin trust, etc.3
0.2%
Corporatebonds3.1%
JGBs40.1%
Japanese local government
bonds 2.8%
Loans1.2%
ForeignSecurities
22.1%
Due from banks,etc.2
26.6%Money heldin trust, etc.3
1.7%
Corporatebonds5.1%
1.19%1.14%
1.09% 1.11% 1.10%1.02%
0.93% 0.95%0.86%
0.37%0.33%
0.24%0.20% 0.19% 0.19% 0.19% 0.18% 0.19%
0.82% 0.80%0.84%
0.91% 0.91%0.82%
0.73% 0.76%0.66%
(0.05%)0
200
400
600
800
1000
1200
1400
1600
1800
(0.2%)
0.0%
0.2%
0.4%
0.6%
0.8%
1.0%
1.2%
1.4%
1.6%
08/3 09/3 10/3 11/3 12/3 13/3 14/3 15/3 16/3(FY)
Net Interest Margin①-②
② Interest rate on interest-bearing liabilities
10 year JGByield
① Yield on Interest-earning assets
(net interest income, ¥ bn)
Secured Stable Yield Under Historically Low Interest Rate Environment
Diversified revenue source and risks by taking credit exposure through foreign securities, etc. and global asset allocation Realized relatively stable net interest margin despite historically low-level interest rate environment after corporatization
Change in Investment Portfolio Historical Spread etc.4
Upon Corporatization(October 1, 2007)
Breakdow
n of Investment Portfolio
Current FY(March 31, 2016)
88.0%
0.1%ForeignSecurities
JGBs1 40.1%
22.1%
1. JGBs include deposits to the Fiscal Loan Fund which were postal savings funds deposited with the Ministry of Finance Japan. All deposits to the Fiscal Loan Fund were redeemed through November, 2010.
2. Due from banks, etc. includes negotiable certificates of deposits, BOJ deposits, monetary claims bought, call loans and receivables under securities borrowing transactions.
3. Money held in trust, etc. includes equity securities of affiliated companies, etc.
Source: JGB interest rate information - Ministry of Finance Japan4. Historical spread is calculated by excluding the average balance and corresponding interest of
money held in trust.5. Net interest income for FY2007 is shown as double the net interest income from Oct. 1, 2007
to March 31, 2008.
Net Interest Income5 (Right)
(spread, yield)
33

Copyright © 2016 JAPAN POST BANK CO., LTD. All Rights Reserved.
Portfolio Management Policy Summary of Assets Summary of Funding
Base Portfolio (BP): ¥136 tn(Liability-driven portfolio)
Purpose: The foundation of our ALM
Funding: Stable liabilities (over 90% are retail, small-sizeddeposits)
Strategy: Main source of income – spread between long- and short-term interest rates; aim for carry profitsProvides internal funding to the Satellite Portfolio
Satellite Portfolio (SP): ¥62 tn(Excess-return portfolio)
Purpose: Pursue excess return
Funding: Mainly Internal funding from the Base Portfolio(Transfer price set based on market interest rates)
Strategy: Assessing the market and economic conditions, Promotes global asset allocation, aim to achieve excess return including capital gainsCreate a “hedge position” by adding assets with negativecorrelation against domestic bonds
ALM/Investment Strategy to Generate Stable Income and Excess Return
Base Portfolio: manages interest rate/liquidity risk, basic return mainly from JGBs. Stable funding enables held-to-maturity investment Satellite Portfolio: takes credit/market risk by global asset allocation for excess return. Solid capital allows over-the-cycle investment
34
1. Short term assets include cash and due from banks, call loans, receivables under securities borrowing transactions (excl. those in trust), T-bills, short-term corporate bonds, etc.2. Corporate bonds, etc. and foreign securities includes monetary claims bought.3. JGBs contained in “money held in trust” are included in the Base Portfolio.4. Market-based funding includes call money, payables under repurchase agreements, payables under securities lending transactions.
(As of March 2016, illustrative breakdown based on management accounting, figures are rounded to the trillion)
Market-based funding4
¥14 tn
Net assets¥12 tn
Base Portfolio
(Investment)
Internal Funding toSatellite Portfolio
InternalFunding
TP
Satellite Portfolio(Investm
ent)
* TEIGAKU Deposits: 10-year-maturity time deposits with option to withdraw after 6 months;semi-annual compound interest; interest rate step-up every 6 months during the first 3 years
Short term assets1
guaranteed bonds
Bonds held to maturity-JGBs, Government
guaranteed bonds
Loans
Available for sale securities- JGBs
Available for sale securities- Japanese local
government bonds- Corporate bonds etc.2
- Foreign securities2
(incl. Investment trusts ¥26 tn)
Money held in trust3
(Stocks)
Loans
Base Portfolio
government bonds etc.
Bonds held to maturity- Japanese local
government bonds etc.
Custom
er-based Funding
*
¥48 tn
¥52 tn
¥36 tn
¥1 tn
¥6 tn
¥7 tn¥45 tn
¥0 tn
¥2 tn
¥1 tn
Liquid Deposits etc.
¥64 tn
Fixed-term Deposits
TEIGAKUDeposits
¥114 tn(¥102 tn)

Copyright © 2016 JAPAN POST BANK CO., LTD. All Rights Reserved.
0
500
1,000
1,500
2,000
2,500
0
100
200
300
400
500
09/3 10/3 11/3 12/3 13/3 14/3 15/3 16/3
Cumulative total of new mortgages (as intermediary) (left)Cumulative sales total for variable annuities (left)Number of issued credit cards (right)
Strengthening Fee Businesses
Aim to enhance new fee business, such as investment trust sales Investment products for individuals (investment trusts, variable annuities) to grow AUM based on “consulting marketing”
Net Fees and Commissions1,2 Compared to Japan’s Major Banks (FY15/3) Evolution of New Retail Businesses
35
(¥ bn) (thousand)
(FY)57.5126.1
89.7 71.231.7
387.3
260.2 312.2
0
100
200
300
400
500
600
Japan Post Bank BTMU SMBC Mizuho
Other feesRemittances and transfers fees
Source: Company disclosures1. Fees and Commissions income - Fees and Commissions expenses.2. Subsidiary bank non-consolidated basis.
(¥ bn)
Copyright © 2016 JAPAN POST BANK CO., LTD. All Rights Reserved.
1,266.2 1,221.0 1,209.9 1,173.9
1,110.7 1,095.0 1,113.6 1,064.0
0
200
400
600
800
1,000
1,200
1,400
09/3 10/3 11/3 12/3 13/3 14/3 15/3 16/3
137.5
121.7
102.894.3 96.8
0
20
40
60
80
100
120
140
160
11/3 12/3 13/3 14/3 15/3
Expense Control through IT Expense Reduction
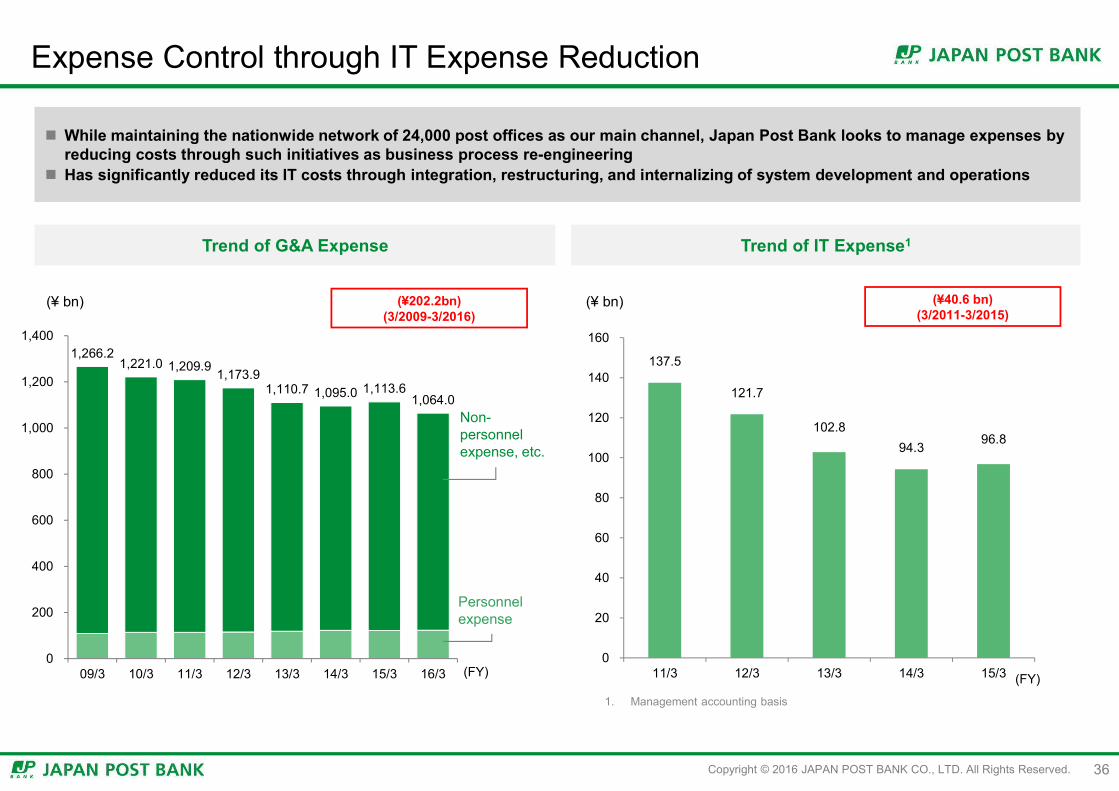
While maintaining the nationwide network of 24,000 post offices as our main channel, Japan Post Bank looks to manage expenses byreducing costs through such initiatives as business process re-engineering
Has significantly reduced its IT costs through integration, restructuring, and internalizing of system development and operations
Trend of G&A Expense Trend of IT Expense1
36
1. Management accounting basis
(FY)
(¥ bn)
Personnelexpense
Non-personnel expense, etc.
(¥202.2bn)(3/2009-3/2016)
(¥40.6 bn)(3/2011-3/2015)
(FY)
(¥ bn)

Copyright © 2016 JAPAN POST BANK CO., LTD. All Rights Reserved.
632.5 631.9 619.0 609.5 607.2 602.4 609.4
0
200
400
600
800
10/3 11/3 12/3 13/3 14/3 15/3 16/3
(¥ bn)
(FY)
Commissions are based on operating cost of Japan Post Bank branches and operational volume, etc. of post offices to arrive at an amount reflecting the cost of agency services.
Banking Counter Component1
Deposit Component
Remittance Component
Financial Product Sales Component
Commissions to Japan Post Co., Ltd.
Commissions we pay to Japan Post are in compliance with arm's length rules(Based on the operating cost of our branches and operational volume, etc. of post offices + incentive component)
Fee structure incentivizes both Japan Post Bank and Japan Post to increase efficiency
Commission StructureCommissions Paid to Japan Post
37
1. Cost to maintain post offices (allocated to Japan Post Bank based on management accounting of Japan Post) within “cost of agency services” as mentioned in the left column of the table
Payable based on marketing targets and service quality Incentive component
The breakdown of commissions for FY2015 (¥609.4 bn):banking counter services component of ¥255.8 bn, deposit componentof ¥209.4 bn, remittance component of ¥97.8 bn, financial product salescomponent of ¥2.5 bn and incentive component of ¥43.8 bn

Copyright © 2016 JAPAN POST BANK CO., LTD. All Rights Reserved.
Management System Adopted Committee system as corporate governance. External directors comprise a majority of the Board membership who effectively
oversee the Bank’s operations The Executive Officers, who are selected by the Board of Directors, conduct business operations efficiently in a timely manner
38
Management Transparency,Effective oversight by External Directors
Advanced corporate governance based on Nomination Committee, etc.
8 out of 12 Directors are external Diverse array of experience and expertise
→ Ability to convey voices of a variety ofstakeholders
Management Supervision Business Management and Operational Execution
Com
pany with C
omm
ittees
Audit
Authority to conduct business operations delegated from Board of DirectorsSpeedy and efficient decision makingBusiness operations focused on customers and the market Internal control through Executive
Committee and Special Committees, etc. Audit by an independent Audit Division
Solely responsible for decision making; independent operations・ Important matters:
Prior approval⇒Prior consultation Oversight by directors Regulatory supervision pursuant to
the Banking Act Ensure appropriateness of intra-
group transactions
Independence fromParent Company
Shared services (salary administration, system networks, etc.)
“Organic Integration” of Japan Post Bank (Expertise) and Japan Post (client base) (unified marketing, back office consolidation)
Synergies fromGroup Collaboration
Pursue economy of scale, leverage on brand strength
Shareholders’ Meeting
Audit Committee
Board of Directors
Nomination Committee
Compensation Committee
Audit Committee Office
President & RepresentativeExecutive Officer Internal Audit Division
Executive Committee
Internal Control Committee
Compliance Division
Corporate Administration Division
Corporate Service Division
Investment Division
Marketing Division
Regional Headquarters, Branches
Compliance Committee
Risk Management Committee
ALM Committee
CSR Committee
Disclosure Committee
Supervision / Audit
Risk Management Division

Copyright © 2016 JAPAN POST BANK CO., LTD. All Rights Reserved. 39
Corporate Governance System
Adopted Committee system as corporate governance. External directors comprise a majority of the Board membership who effectively oversee the Bank’s operations
− Advanced corporate governance based on Nomination Committee, etc.− 8 out of 12 Directors are external(Nomination Committee: 2 of 3 / Audit Committee: 5 of 5 / Compensation Committee: 2 of 3)
Independence from the parent company− Solely responsible for decision making; independent operations− Oversight by directors− Dismissals of our President and Managing Executive Officer from the President and CEO
of Japan Post Holdings and dismissal of our Management Executive Officer(s) from the Management Executive Officer(s) of Japan Post
− To the extent we believe it is necessary, we invite Representative Executive Officers of Japan Post Holdings to attend meetings of our executive committee
− Regulatory supervision pursuant to the Banking Act− Ensure appropriateness of intragroup transactions
Corporate governance basic policy was published on November 13※We comply with most principals of Japan’s Corporate Governance Code and explain principals on such items as notices
to general shareholder meetings.

Copyright © 2016 JAPAN POST BANK CO., LTD. All Rights Reserved.
Overview of Regulations Surrounding Japan Post Bank
40
In addition to banking regulations, we are subject to additional regulations pursuant to the Postal Service Privatization Act
Summary of Regulations
Universal Service Obligation(Imposed on Japan Post
Holdings and Japan Post)
Obligation to provide basic banking services (acceptances and withdrawals of ordinary, TEIGAKU and time deposits, and remittance, etc.) through the post office network
Japan Post Co. has Bank Counter Services Agreement, etc. with Japan Post Bank, etc.
Share-holding
Japan Post Holdings ⇒Japan Post Bank
Japan Post Holdings must aim to dispose all of their shares within the earliest possible timeframe while considering the management situation of both financial services companies, and the impact on the fulfillment of obligations to provide universal services
Regulations on
Japan Post Bank
Regulations under the Banking Act Same regulation is imposed as a “Bank” under the Banking Act
【Additional Regulations】Restrictions on Scope of Business
Current Approval from the Ministers in charge (consultation with the Postal Privatization Committee)
No additional regulations imposed1 after “Specified
Date”2
After Japan Post Holdings disposes of 50% or more
Notification to the Ministers in charge(Obligation to care for fair competition + notice to Postal Privatization Committee + Supervision)
【Additional】Restrictions on theMaximum Amount of Deposit
Maximum amount of deposits (¥13 mn) are stipulated by the enforcement order of the Privatization Act
New Business requiring approvals
(Example)
Bi-lateral loans to corporations Loans to individuals
Establishment/acquisition of subsidiaries with certain businesses
Merger, transfer of business, etc.
1. Our banking license is subject to the following conditions: (1) obtain approval from the Prime Minister in order to conduct new types of businesses, (2) continue outsourcing our business operations to an authorized banking agent, in order to maintain a sound, appropriate and stable foundation of our business. (Condition (2) is effective until the Specified Date)
2. “Specified Date” means the earlier of the following:(1) The date when Japan Post Holdings disposes of all its interest in Japan Post Bank(2) The date when Japan Post Holdings disposes of 50% or more of its interest in Japan Post Bank and both the Prime Minister and the Minister of Internal
Affairs and Communications decide to acknowledge lifting of additional regulations will not negatively affect fair competition with other financial institutions, etc. nor provision of appropriate services to customers

Copyright © 2016 JAPAN POST BANK CO., LTD. All Rights Reserved.
FY2011/3 FY2012/3 FY2013/3 FY2014/3 FY2015/3 FY2016/3
Gross operating profit 1,718.9 1,670.0 1,624.3 1,568.7 1,634.7 1,452.0
Net interest income1 1,686.4 1,677.3 1,532.1 1,470.2 1,540.7 1,361.0
Net fees and commissions 87.9 88.4 88.1 92.6 89.2 91.1
General and administrative expenses2 (1,210.1) (1,174.5) (1,111.5) (1,096.0) (1,114.7) (1,066.1)
Provision for general reserve for possible loan losses (0.3) - - - - -
Net operating profit 508.3 495.4 512.8 472.6 519.9 385.8
Non-recurring gains (losses) 18.1 80.7 80.7 92.4 49.4 96.1
Net ordinary income 526.5 576.2 593.5 565.0 569.4 481.9
Extraordinary income (losses) (1.3) (2.4) (1.9) (0.6) 1.5 (1.1)
Net income 316.3 334.8 373.9 354.6 369.4 325.0
Total net assets 9,093.6 9,818.1 10,997.5 11,464.5 11,630.2 11,508.1
Total assets 193,443.3 195,819.8 199,840.6 202,512.8 208,179.3 207,056.0
Capital adequacy ratio3
(domestic standard) 74.82% 68.39% 66.04% 56.81% 38.42% 26.38%
Number of employees 12,351 12,796 12,922 12,963 12,889 12,905
Average number of temporary employees 6,173 6,006 5,818 5,699 5,523 5,223
Performance Since FY2011/3
1. Net interest income is calculated by deducting interest expenses (excluding the expenses related to money held in trust) from interest income2. General and administrative expenses exclude non-recurring losses3. New domestic standards (Basel III) have been applied from FY2013 (year ended March 31, 2014)
* Figures less than ¥100mn are rounded down
(¥bn)
41

Copyright © 2016 JAPAN POST BANK CO., LTD. All Rights Reserved. 42
<Disclaimer>The forward-looking statements, including the forecasts and targets ofJapan Post Bank Co., Ltd. (the “Bank”), in these materials are based oninformation currently available and assumptions that the Bank has deemed to bereasonable. Actual business results may differ materially from thosedescribed in these materials due to a variety of factors including changesin interest rates and exchange rates, general market and economicconditions and other factors.


![Consolidated Financial Results for the Fiscal Year Ended ...Note: Comprehensive income Fiscal year ended March 31, 2019: ¥1,761 million [24.3%] Fiscal year ended March 31, 2018: ¥1,417](https://static.documents.pub/doc/80x56/5fe4d06806b4775830253106/consolidated-financial-results-for-the-fiscal-year-ended-note-comprehensive.jpg)


