46
Results for the year to 31 March 2017 18 May 2017

Results for the year
to 31 March 2017
18 May 2017
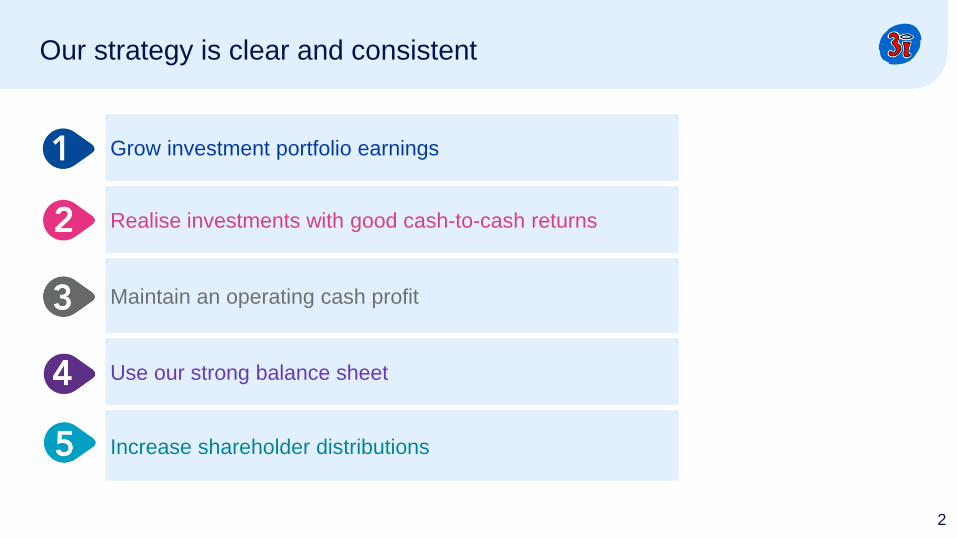
Our strategy is clear and consistent
2
Grow investment portfolio earnings
Realise investments with good cash-to-cash returns
Maintain an operating cash profit
Use our strong balance sheet
Increase shareholder distributions

Good progress against all KPIsYear to 31 March 2017
1 Operating cash profit redefined in the financial year to be cash portfolio and fee income less cash expenses (previously cash portfolio and fee income less accrued expenses).
Total return on equity
36%
NAV per share
604p
Total dividend
per share
26.5p
Operating cash profit1
£33m
Cash invested
£478m
Realisation proceeds
£982m
Advised 3iN on six
new investments
£479m
Operating cash income
£59m
Group Private Equity Infrastructure
3

Our post-restructuring track record continues to improve
4
Year to31 Mar 20171
Year to31 Mar 2016
Year to31 Mar 2015
Year to 31 Mar 2014
Year to 31 Mar 2013
Year to 31 Mar 2012
Total return% over opening net asset value
£1,592m36%
£824m22%
£659m20%
£478m16%
£373m 14%
£(656)m(20)%
Dividend per share (base/additional) 16.0p/10.5p 8.1p/13.9p 8.1p/11.9p 8.1/11.9p 8.1p 8.1p
Diluted NAV per share 604p 463p 396p 348p 311p 279p
Operating expenses £117m £134m £131m £136m £170m £180m
Gross investment return £1,755m £1,069m £805m £665m £598m £(429)m
3i portfolio value £5,675m £4,497m £3,877m £3,565m £3,295m £3,204m
Net cash/(debt) £419m £165m £49m £(160)m £(335)m £(464)m
1 As reported. Prior year figures not restated to reflect the sale of Debt Management.
3i is now performing as it should, with careful investment and active asset
management generating strong returns

Private equity marketDry powder continues to grow; market environment supports valuations
5Source: 2017 Preqin Global Private Equity and Venture Capital Report
496 630837 743
9041,106 1,200
1,382 1,512 1,552 1,635 1,617385
525
632678
671
615593
558
672 687752 869
Dec-05 Dec-06 Dec-07 Dec-08 Dec-09 Dec-10 Dec-11 Dec-12 Dec-13 Dec-14 Dec-15 Jun-16
Unrealised value ($bn) Dry powder ($bn)
Global private equity assets under management ($bn)
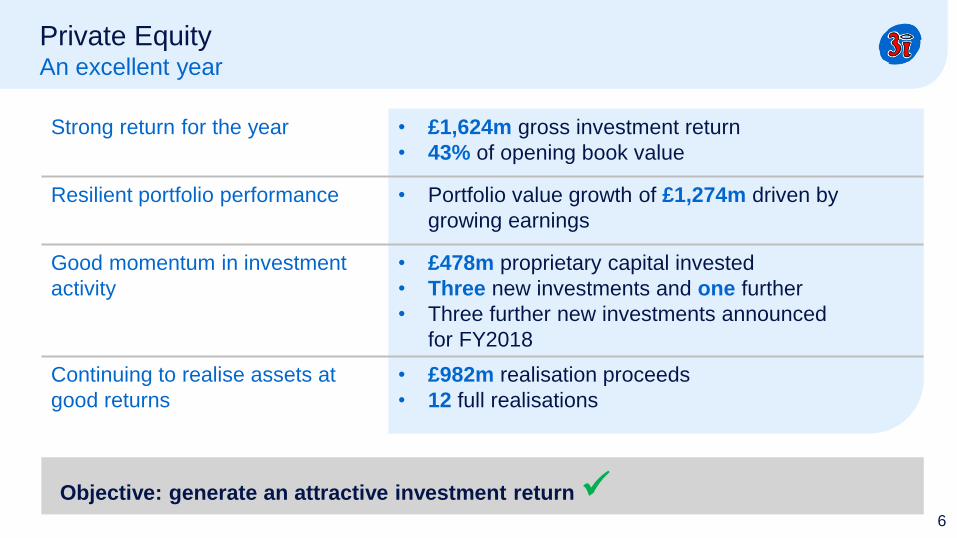
Private EquityAn excellent year
Strong return for the year • £1,624m gross investment return
• 43% of opening book value
Resilient portfolio performance • Portfolio value growth of £1,274m driven by
growing earnings
Good momentum in investment
activity
• £478m proprietary capital invested
• Three new investments and one further
• Three further new investments announced
for FY2018
Continuing to realise assets at
good returns
• £982m realisation proceeds
• 12 full realisations
6
Objective: generate an attractive investment return
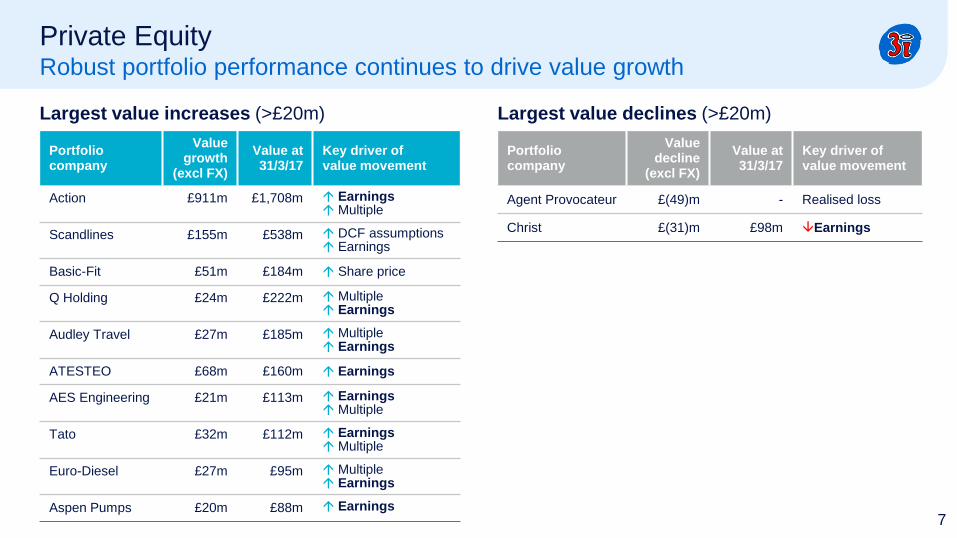
Private EquityRobust portfolio performance continues to drive value growth
7
Portfolio company
Valuegrowth
(excl FX)
Value at 31/3/17
Key driver of value movement
Action £911m £1,708m Earnings Multiple
Scandlines £155m £538m DCF assumptions Earnings
Basic-Fit £51m £184m Share price
Q Holding £24m £222m Multiple Earnings
Audley Travel £27m £185m Multiple Earnings
ATESTEO £68m £160m Earnings
AES Engineering £21m £113m Earnings Multiple
Tato £32m £112m Earnings Multiple
Euro-Diesel £27m £95m Multiple Earnings
Aspen Pumps £20m £88m Earnings
Portfolio company
Valuedecline
(excl FX)
Value at 31/3/17
Key driver of value movement
Agent Provocateur £(49)m - Realised loss
Christ £(31)m £98m Earnings
Largest value increases (>£20m) Largest value declines (>£20m)

Private EquityFY2013+ vintages continue to perform well
1 Excludes new investments made in FY2017 but includes the further investment in Q/Degania. Sterling MM
FY2013 FY2014 FY2015 FY2016 FY2017
GekaJMJ
Scand-lines
ATESTEO
Basic-Fit
Dynatect
Aspen Pumps
Q Holding
Christ
WP
Euro-Diesel
AudleyTravel
BoConcept
Schlemmer
PonroySanté
Q/Degania
£1.5bn invested since FY2013
Aggregate MM of 1.7x1
£100m £265m £328m £352m £471m
Proprietary capital invested in each vintage
Blue
Oticas Carol
8
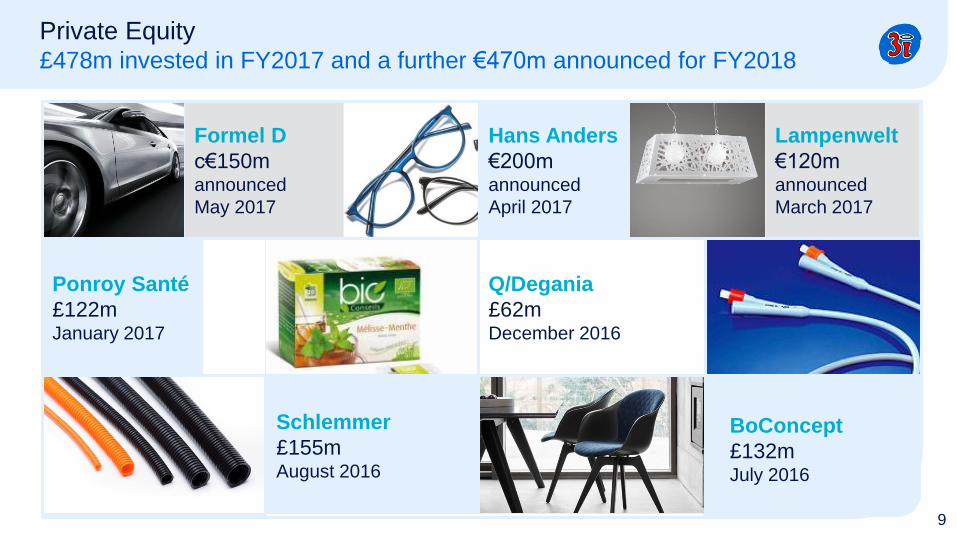
Hans Anders
€200mannounced
April 2017
Private Equity£478m invested in FY2017 and a further €470m announced for FY2018
9
Lampenwelt
€120mannounced
March 2017
Formel D
c€150mannounced
May 2017
Schlemmer
£155mAugust 2016
Q/Degania
£62mDecember 2016
Ponroy Santé
£122mJanuary 2017
BoConcept
£132mJuly 2016

Private EquityContinuing to reshape the portfolio through realisations
101 For partial realisations and refinancings, valuations of any remaining investment are included in the multiple.Note: Full detail in the appendix.
FY2017 realisations
£982m total proceeds
12 full realisations
2 refinancings
Mayborn
£136m; 3.5x
Selected full realisations
Quintiles
£107m; 3.3x
Amor
£88m; 2.3xGeka
£85m; 1.8x
Polyconcept
£44m; 2.1x
UFO Moviez
£16m; 2.9x
Loxam
£40m; 1.9xLekolar
£34m; 1.6x
Selected partial realisations1
Basic-Fit
£82m; 3.3x
Scandlines
£16m; 4.6x
Refresco
£11m; 1.8x
Refinancings1
Action
£187m; 20.8x
ATESTEO
£48m; 2.7x

Private EquityA portfolio weighted towards our better assets
11
The buckets Selected examples % of value
FY2017 FY2016
1 Longer-term hold and
value creation
Action, Scandlines,
Aspen Pumps, ATESTEOc.64% c.62%
2 Strong performers; performing in
line with investment caseWP, Q Holding, BoConcept,
Schlemmerc.22% c.22%
3 Manage intensively; potential
value upsideOneMed, Etanco, SLR c.9% c.10%
4 Low or nil-valued assets Indiareit 0.4% 0.3%
5 Quoted assets Basic-Fit, Refresco c.5% c.5%
37 portfolio companies and 3 quoted holdings at 31 March 2017, down
from 47 portfolio companies and 5 quoted holdings at start of FY2017

Private Equity - ActionAction continues to exceed expectations
• 3i acquired Action in September 2011 at 8.3x EBITDA
• Executive team completed in 2015 with recruitment of
CEO and CFO
• Number of stores has grown from 269 to over 890
currently
• Carrying value increased from £106m to £1,708m
based on 16.0x run-rate earnings to the end of
March 2017
• 4.9x money realised from refinancing distributions
• Money multiple and IRR to date of 20.8x and 84%
respectively FASHION & LINEN
GARDEN &
OUTDOOR
LAUNDRY &
CLEANING
STATIONERY &
HOBBY
PETS
FOOD &
DRINK
TOYS &
ENTERTAINMENT
PERSONAL CARE
FUN &
MULTIMEDIA
DECORATION DO IT YOURSELF
HOUSEHOLD
GOODS
12

96%89%
94%92%
20162015201420132012
307%
267%
177%
106%
20162015201420132012
6.9%6.9%
8.6%
7.0% 6.7%
20162015201420132012
11.6%11.3%11.0%11.1%11.3%
Private Equity - Action Strong financial track record across all KPIs
Cash conversion: (EBITDA-maintenance CAPEX)/EBITDAROCE: EBIT/Capital Employed (excluding Goodwill)
Net sales (EURm) Like-for-like sales growth (%) # stores
2,675
1,995
1,506
1,155
873
+32%
20162015201420132012
852
655
514
406321
+28%
20162015201420132012
EBITDA (EURm) Cash conversion ROCE
310
226
166129
99
+33%
2014 2016201520132012
EBITDA margin
13
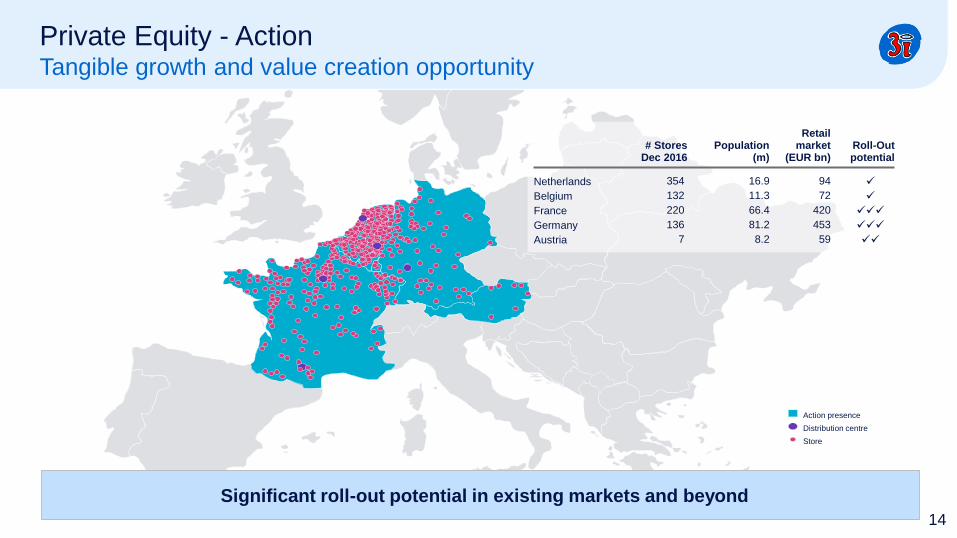
Private Equity - Action Tangible growth and value creation opportunity
Distribution centre
Store
Action presence
Netherlands 354 16.9 94
# Stores Dec 2016
Population(m)
Retail market
(EUR bn)Roll-Out potential
Belgium 132 11.3 72
France 220 66.4 420
Germany 136 81.2 453
Austria 7 8.2 59
Significant roll-out potential in existing markets and beyond
14

20.1%
32.3%
+12.2%
5.1%
7.2%
+2.1%
Private Equity - ActionLeading KPIs versus Inditex, Dollarama, Five Below, XXL and B&M
Sales growth, 2012-16 (%) Like-for-like sales growth, 2012-2016 (%) New store growth, 2012-16 (%)
EBITDA Margin, 2012-2016 (%) Cash Conversion, 2012-2016 (%) EBITDA growth, 2012-16 (%)
15.6%
27.6%
+12.0%
15.6%
11.3%
-4.3%
76.0%
92.9%
+16.9%
22.1%
33.1%
+11.0%
10.0%
27.7%
3.3%
6.5%
5.0%
24.1%
10.0%
22.7%
60.5%
96.5%
6.5%
33.7%
Action Core comparators 15Cash conversion: (EBITDA-maintenance CAPEX)/EBITDA

InfrastructureInflows in the asset class continue to grow and asset values are rising
16Source: 2017 Preqin Global Infrastructure Report
9 17 34 51 6193
124145
164190
216 232
15 37
6566
64
68
8474
109
105
109
141
Dec-05 Dec-06 Dec-07 Dec-08 Dec-09 Dec-10 Dec-11 Dec-12 Dec-13 Dec-14 Dec-15 Jun-16
Unrealised value ($bn) Dry powder ($bn)
Global unlisted infrastructure assets under management ($bn)

InfrastructureA year of increased activity
17
Contributing to capital and income
returns
• £87m gross investment return, or 17% of
opening book value
• £59m operating cash income
3iN continues to perform strongly • Advised 3iN on new investment of £479m
• Total return of 9% and TSR of 16% in FY2017
Supporting growth in the franchise
and in fee income
• 3iN raised £385m in new equity in June, of which
£131m from 3i
• Two new funds launched, raising a total of
c£800m in AUM
Objective: grow fee and portfolio income

Infrastructure3iN: robust returns and strong momentum in investment activity
• New capital of £385m raised in June 2016
• All deployed in 6 new investments worth £479m
• £131m investment by 3i to maintain its 34% holding
• TSR of 16% in FY2017
18
* Basket includes HICL, INPP, JLIF and BBGISource: Bloomberg
3iN to remain our key infrastructure
investment vehicle, with new funds
raised to leverage our capabilities
3iN relative share price performance (rebased to 100)
+11%
+7%
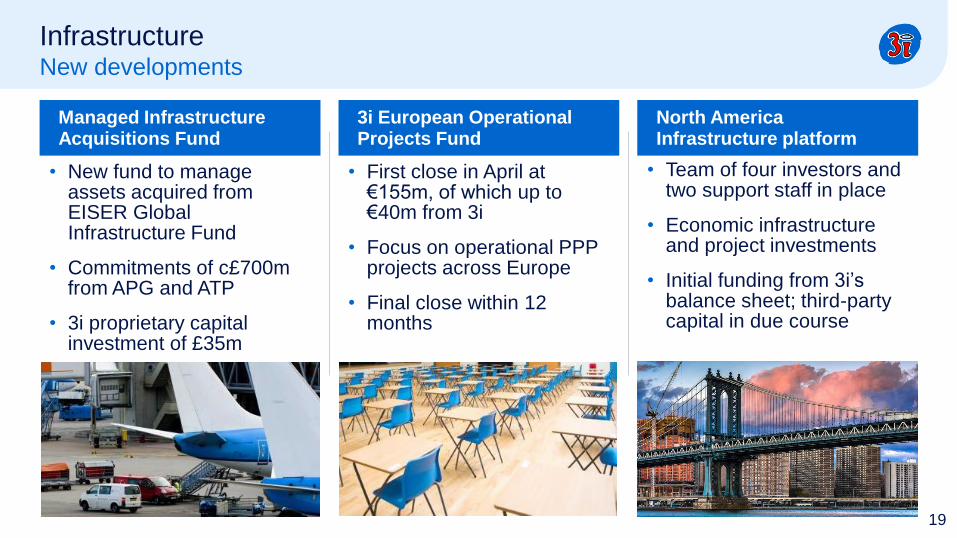
InfrastructureNew developments
19
• New fund to manage assets acquired from EISER Global Infrastructure Fund
• Commitments of c£700m from APG and ATP
• 3i proprietary capital investment of £35m
• First close in April at €155m, of which up to €40m from 3i
• Focus on operational PPP projects across Europe
• Final close within 12 months
• Team of four investors and two support staff in place
• Economic infrastructure and project investments
• Initial funding from 3i’s balance sheet; third-party capital in due course
Managed Infrastructure Acquisitions Fund
3i European Operational Projects Fund
North America Infrastructure platform

Our strategy is clear and consistent
20
Grow investment portfolio earnings
Realise investments with good cash-to-cash returns
Maintain an operating cash profit
Use our strong balance sheet
Increase shareholder distributions
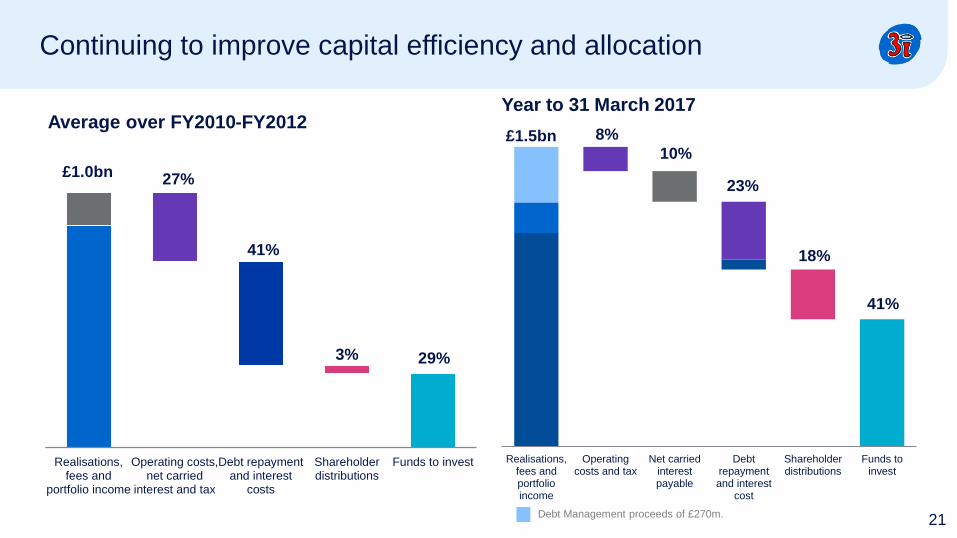
Continuing to improve capital efficiency and allocation
21
Realisations,fees and
portfolio income
Operating costs,net carried
interest and tax
Debt repaymentand interest
costs
Shareholderdistributions
Funds to invest
Average over FY2010-FY2012
27%
41%
3% 29%
£1.0bn
Realisations,fees andportfolioincome
Operatingcosts and tax
Net carriedinterestpayable
Debtrepaymentand interest
cost
Shareholderdistributions
Funds toinvest
Year to 31 March 2017
£1.5bn 8%
10%
23%
18%
41%
Debt Management proceeds of £270m.

NAV up 30% to 604 pence driven by strong portfolio performance
22
463
(24)
604
4
138
309 (16)
350
400
450
500
550
600
650
700
31 March2016
Realisedprofits
Value growth FX DebtManagementbusiness sold
Net carrypayable
Dividends 31 March2017
NAV per share (pence)

Private EquityStrong performance
231 Excludes refinancings.
£ million 2017 2016
Gross investment return 1,624 1,011
% of opening portfolio 43% 32%
Realised profit 38 69
Uplift over book value1 5% 14%
Money multiple 3.7x 2.6x
Realisations 982 743
Cash Investment 478 365
Portfolio value 4,831 3,741
Portfolio now 37 assets and 3 quoted stakes

Private EquityStrong performance
24
3,741
4,831
478
1,274 (944)
282
3,000
3,500
4,000
4,500
5,000
5,500
6,000
Portfolio value as at1 April 2016
Cash investment Value movement Divestment value FX / Other Portfolio value as at 31March 2017
1
£ million
ash1

Private EquityHigh quality portfolio with strong earnings growth
241
1,327
370
112
2,362
<0% 0-9% 10-19% 20-30% >30%
25
3i carrying value at 31 March 20171
£ million
Number of companies:
3
7
4
1
5
1 Earnings growth in the top 20 investments

Action valuationConsistency in performance and execution since our acquisition
26
• Updated valuation methodology
– Run-rate earnings to 26 March 2017
– Run-rate multiple: 16.0x (post discount)
£1,708 million value at 31 March 2017, £911 million value growth in the year
Post discountmultiple: 9.26x
16.0x
12.5x13.5x 14.0x
18.2x
16.8x 15.8x
Mar-13 Mar-14 Mar-15 Mar-16 Jun 16 Sep 16 Dec 16 Mar 17
1
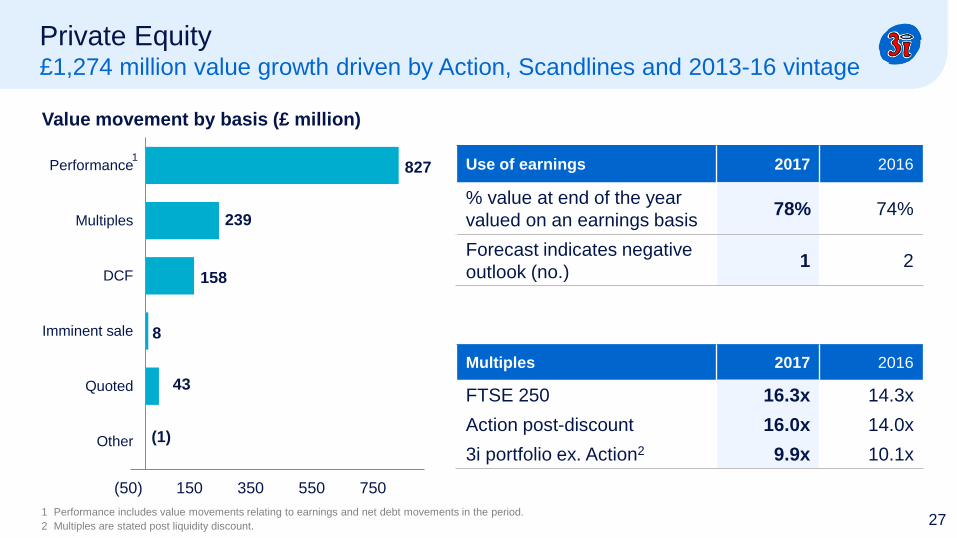
Multiples 2017 2016
FTSE 250 16.3x 14.3x
Action post-discount 16.0x 14.0x
3i portfolio ex. Action2 9.9x 10.1x
Private Equity£1,274 million value growth driven by Action, Scandlines and 2013-16 vintage
27
Use of earnings 2017 2016
% value at end of the year
valued on an earnings basis78% 74%
Forecast indicates negative
outlook (no.)1 2
(1)
43
8
158
239
827
(50) 150 350 550 750
Other
Quoted
Imminent sale
DCF
Multiples
Performance
Value movement by basis (£ million)
1
1 Performance includes value movements relating to earnings and net debt movements in the period.
2 Multiples are stated post liquidity discount.

Private EquityCarry receivable and payable a function of good performance
28
£ million 2017 2016
Income statement
Carried interest receivable 275 58
Carried interest payable (431) (171)
Net total return charge (156) (113)
Balance sheet
Carried interest receivable 359 92
Carried interest payable 650 356
Net cash paid 127 9

InfrastructureSignificant contribution to cash income
29
£ million 2017 2016
Gross investment return 87 47
% of opening portfolio 17% 8%
Fee income 36 28
Cash income 59 49
Cash investment 131 -
Portfolio value 706 527
3iN TSR of 16% in the year

1 Operating expenses have been shown on a cash basis
Continuing to focus on operating cash profit
Significant progress since the 2012 strategic review
£ million
(200)
(100)
-
100
200
FY 2011 FY 2012 FY 2013 FY 2014 FY 2015 FY 2016 FY 2017
Total cash income Operating expenses
Operating cash profit/(loss) Operating cash profit/(loss) excluding Debt Management
30
1

Well funded balance sheet for investment….
31
£ million 2017 2016
Portfolio value 5,675 4,497
Gross debt (575) (837)
Cash 994 1,002
Net cash 419 165
Liquidity 1,323 1,352
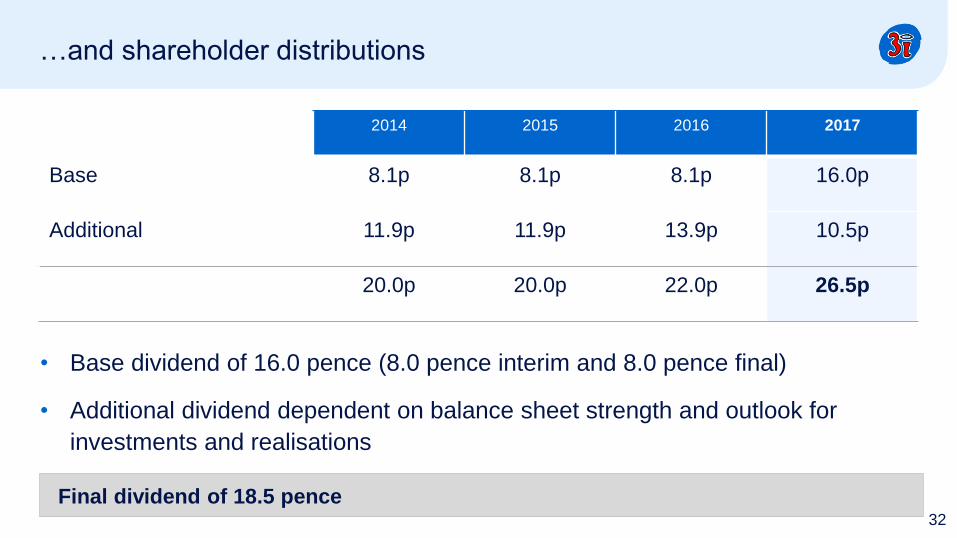
…and shareholder distributions
32
Final dividend of 18.5 pence
2014 2015 2016 2017
Base 8.1p 8.1p 8.1p 16.0p
Additional 11.9p 11.9p 13.9p 10.5p
20.0p 20.0p 22.0p 26.5p
• Base dividend of 16.0 pence (8.0 pence interim and 8.0 pence final)
• Additional dividend dependent on balance sheet strength and outlook for
investments and realisations

Our strategy is clear and consistent
33
Grow investment portfolio earnings
Realise investments with good cash-to-cash returns
Maintain an operating cash profit
Use our strong balance sheet
Increase shareholder distributions

Additional information

558
553 (4)
(8)
604
550
560
570
580
590
600
610
620
31 December 2016 Realised profits andvalue growth
Debt Managementbusiness sold
Net carry payable Dividends 31 March 2017
Q4 NAV up from 558 pence to 604 pence
35
NAV per share (pence)

Key performance indicators
361 Includes proceeds from the sale of Debt Management of £270m.
2 Balances include the contribution of the Debt Management business sold to Investcorp.
18% 20%24%
29%
40%
2013 2014 2015 2016 2017
Gross investment return (%)
606 671841 769
1,308
2013 2014 2015 2016 2017
Cash realisations (£m)
126
276369
433
638
2013 2014 2015 2016 2017
Cash investment (£m)
(32)
11
4537 33
2013 2014 2015 2016 2017
Operating cash profit (£m)2
311 348 396463
604
2013 2014 2015 2016 2017
NAV per share (GBp)
54%
30% 27%
(2)%
71%
2013 2014 2015 2016 2017
Total shareholder return(%)
1
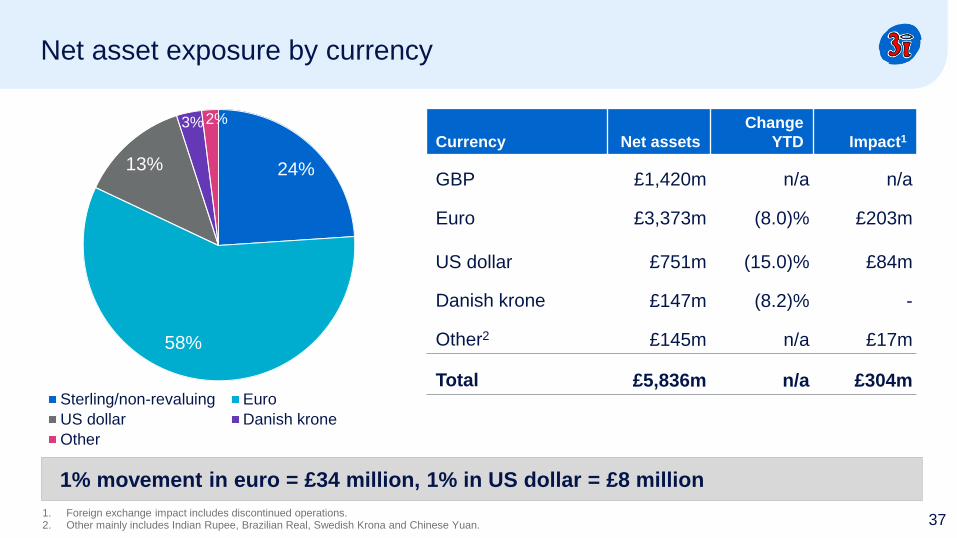
Net asset exposure by currency
1. Foreign exchange impact includes discontinued operations.2. Other mainly includes Indian Rupee, Brazilian Real, Swedish Krona and Chinese Yuan.
Currency Net assets
Change
YTD Impact1
GBP £1,420m n/a n/a
Euro £3,373m (8.0)% £203m
US dollar £751m (15.0)% £84m
Danish krone £147m (8.2)% -
Other2 £145m n/a £17m
Total £5,836m n/a £304m
1% movement in euro = £34 million, 1% in US dollar = £8 million
37
24%
58%
13%
3% 2%
Sterling/non-revaluing Euro
US dollar Danish krone
Other
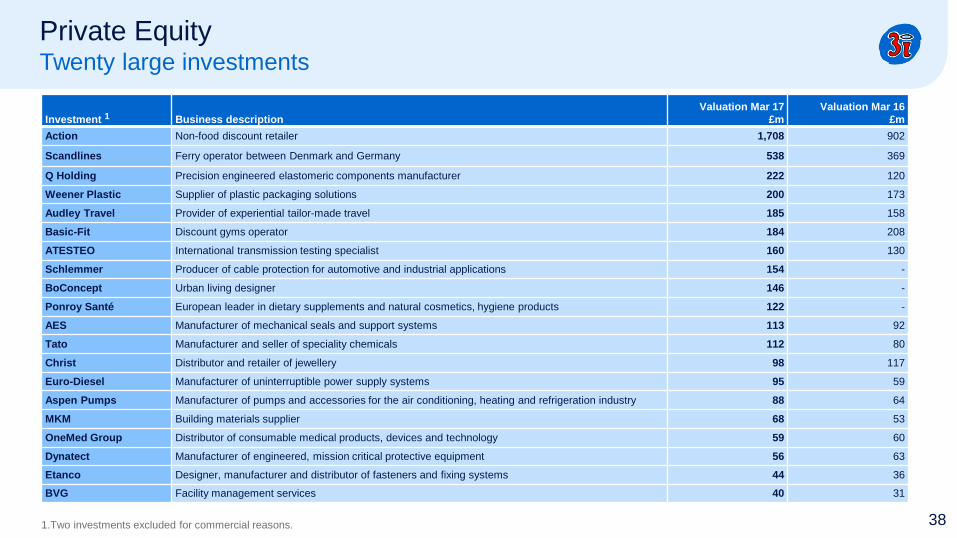
Private EquityTwenty large investments
381.Two investments excluded for commercial reasons.
Investment 1 Business description
Valuation Mar 17
£m
Valuation Mar 16
£m
Action Non-food discount retailer 1,708 902
Scandlines Ferry operator between Denmark and Germany 538 369
Q Holding Precision engineered elastomeric components manufacturer 222 120
Weener Plastic Supplier of plastic packaging solutions 200 173
Audley Travel Provider of experiential tailor-made travel 185 158
Basic-Fit Discount gyms operator 184 208
ATESTEO International transmission testing specialist 160 130
Schlemmer Producer of cable protection for automotive and industrial applications 154 -
BoConcept Urban living designer 146 -
Ponroy Santé European leader in dietary supplements and natural cosmetics, hygiene products 122 -
AES Manufacturer of mechanical seals and support systems 113 92
Tato Manufacturer and seller of speciality chemicals 112 80
Christ Distributor and retailer of jewellery 98 117
Euro-Diesel Manufacturer of uninterruptible power supply systems 95 59
Aspen Pumps Manufacturer of pumps and accessories for the air conditioning, heating and refrigeration industry 88 64
MKM Building materials supplier 68 53
OneMed Group Distributor of consumable medical products, devices and technology 59 60
Dynatect Manufacturer of engineered, mission critical protective equipment 56 63
Etanco Designer, manufacturer and distributor of fasteners and fixing systems 44 36
BVG Facility management services 40 31

Private Equity leverage
Ratio of total net debt to EBITDA by 3i carrying value at 31 March 2017
39
(£ million)
Note: The above table includes assets not valued on an EBITDA basis. This represents 99.9% of the Private Equity portfolio by value.
595 545
32
3,181
472
< 1x 1 - 2x 2 - 3x 3 - 4x 4 - 5x 5 - 6x > 6x
Net debt/EBITDA segmentation
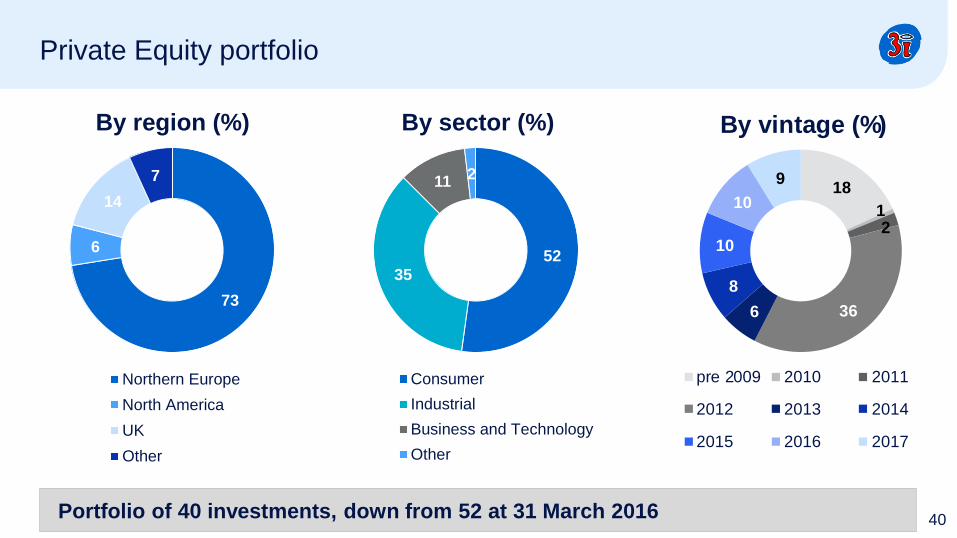
Private Equity portfolio
40Note: Analysed by 30 September 2016 valuation.
73
6
14
7
By region (%)
Northern Europe
North America
UK
Other
5235
112
By sector (%)
Consumer
Industrial
Business and Technology
Other
18
12
366
8
10
10
9
By vintage (%)
pre 2009 2010 2011
2012 2013 2014
2015 2016 2017
Portfolio of 40 investments, down from 52 at 31 March 2016
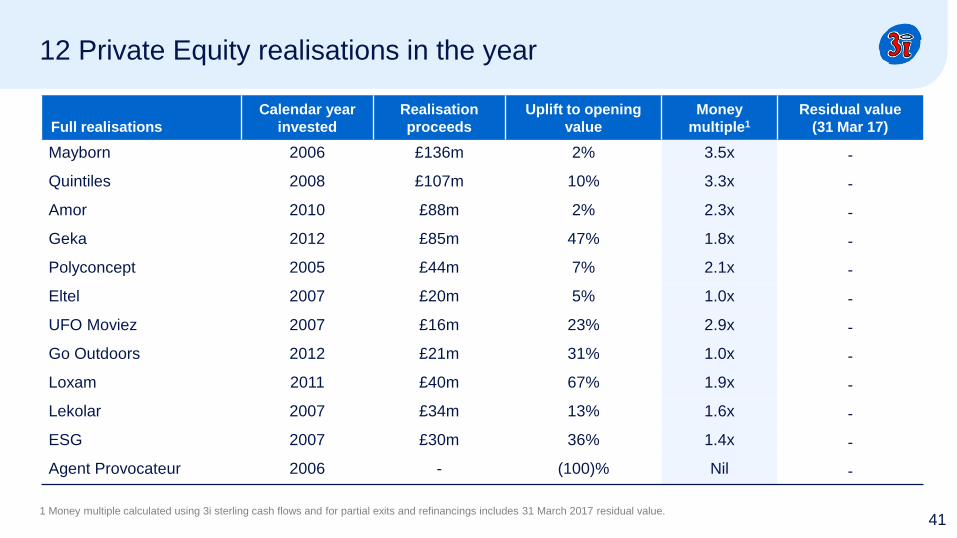
12 Private Equity realisations in the year
411 Money multiple calculated using 3i sterling cash flows and for partial exits and refinancings includes 31 March 2017 residual value.
Full realisations
Calendar year
invested
Realisation
proceeds
Uplift to opening
value
Money
multiple1
Residual value
(31 Mar 17)
Mayborn 2006 £136m 2% 3.5x -
Quintiles 2008 £107m 10% 3.3x -
Amor 2010 £88m 2% 2.3x -
Geka 2012 £85m 47% 1.8x -
Polyconcept 2005 £44m 7% 2.1x -
Eltel 2007 £20m 5% 1.0x -
UFO Moviez 2007 £16m 23% 2.9x -
Go Outdoors 2012 £21m 31% 1.0x -
Loxam 2011 £40m 67% 1.9x -
Lekolar 2007 £34m 13% 1.6x -
ESG 2007 £30m 36% 1.4x -
Agent Provocateur 2006 - (100)% Nil -
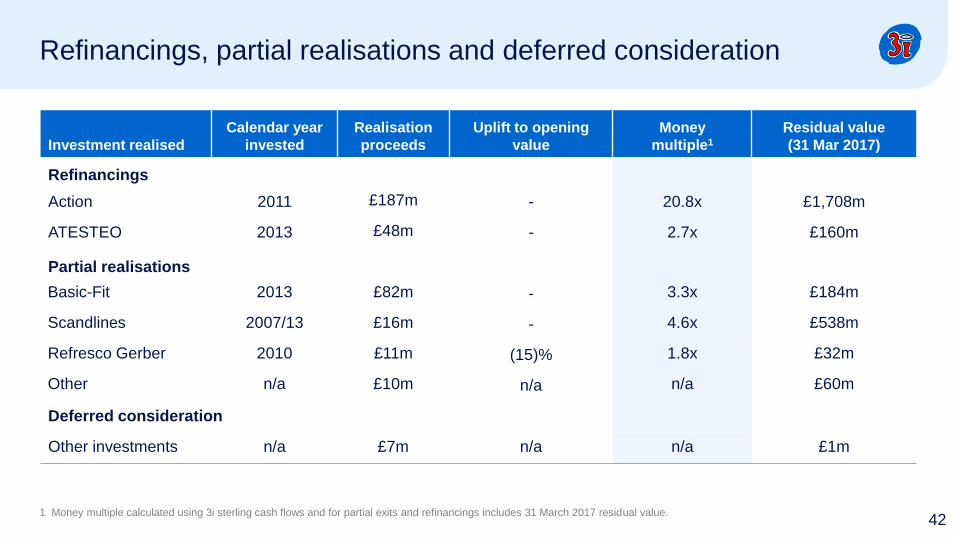
Refinancings, partial realisations and deferred consideration
1 Money multiple calculated using 3i sterling cash flows and for partial exits and refinancings includes 31 March 2017 residual value.
Investment realised
Calendar year
invested
Realisation
proceeds
Uplift to opening
value
Money
multiple1
Residual value
(31 Mar 2017)
Refinancings
Action 2011 £187m - 20.8x £1,708m
ATESTEO 2013 £48m - 2.7x £160m
Partial realisations
Basic-Fit 2013 £82m - 3.3x £184m
Scandlines 2007/13 £16m - 4.6x £538m
Refresco Gerber 2010 £11m (15)% 1.8x £32m
Other n/a £10m n/a n/a £60m
Deferred consideration
Other investments n/a £7m n/a n/a £1m
42

Assets under management Private Equity
1 All funds are beyond their investment period.
2 Gross money multiple is the cash returned to the fund plus value as at 31 March 2017, as a multiple of cash invested.
3 AUM based on NAV.
Close date
Original
fund size
Original 3i
commitment
Remaining 3i
commitment1
at March 2017
%
invested at
March 2017
Gross money
multiple2 at
March 2017 AUM3
Fee income
received
in the year
3i Growth Capital Fund Mar 10 €1,192m €800m €346m 53% 1.9x £50m £1m
3i Eurofund V Nov 06 €5,000m €2,780m €105m 94% 2.2x £1,913m £7m
3i Eurofund IV Jun 04 €3,067m €1,941m €82m 95% 2.3x £5m –
Other (third party) various various various n/a n/a n/a £121m £2m
3i proprietary capital n/a n/a n/a n/a n/a n/a £4,831m n/a
Total Private Equity AUM £6,920m £10m
43
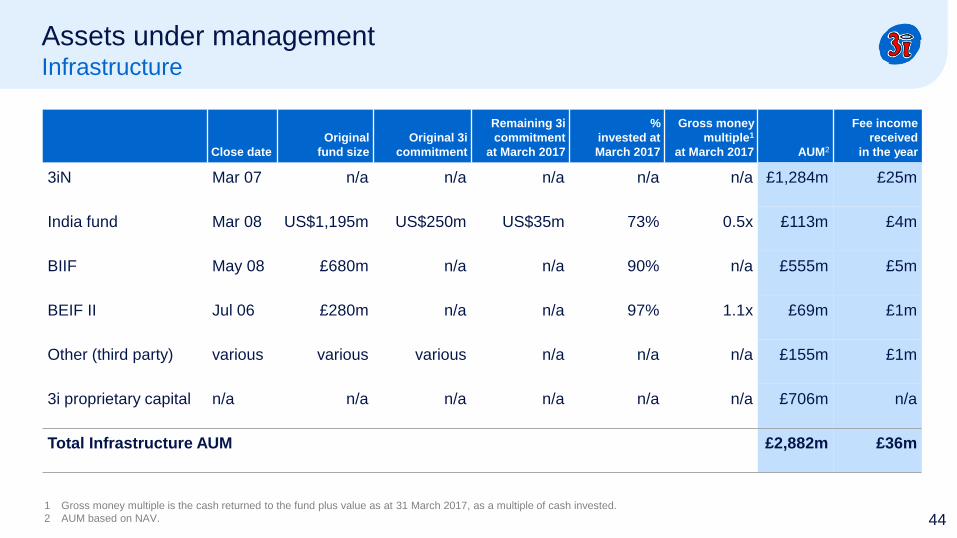
Assets under management Infrastructure
Close date
Original
fund size
Original 3i
commitment
Remaining 3i
commitment
at March 2017
%
invested at
March 2017
Gross money
multiple1
at March 2017 AUM2
Fee income
received
in the year
3iN Mar 07 n/a n/a n/a n/a n/a £1,284m £25m
India fund Mar 08 US$1,195m US$250m US$35m 73% 0.5x £113m £4m
BIIF May 08 £680m n/a n/a 90% n/a £555m £5m
BEIF II Jul 06 £280m n/a n/a 97% 1.1x £69m £1m
Other (third party) various various various n/a n/a n/a £155m £1m
3i proprietary capital n/a n/a n/a n/a n/a n/a £706m n/a
Total Infrastructure AUM £2,882m £36m
1 Gross money multiple is the cash returned to the fund plus value as at 31 March 2017, as a multiple of cash invested.
2 AUM based on NAV. 44
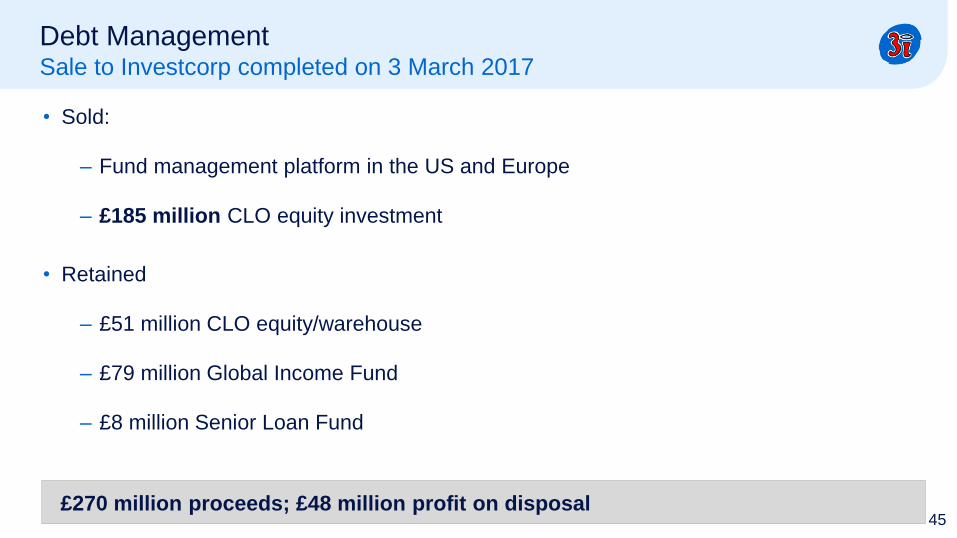
Debt ManagementSale to Investcorp completed on 3 March 2017
• Sold:
– Fund management platform in the US and Europe
– £185 million CLO equity investment
• Retained
– £51 million CLO equity/warehouse
– £79 million Global Income Fund
– £8 million Senior Loan Fund
45£270 million proceeds; £48 million profit on disposal

Debt Management Retained investments
46
£ million 20171 20161
Realised profit 1 -
Unrealised profits/(losses) on revaluation 9 (22)
Portfolio income 19 10
Foreign exchange on investments 15 5
Gross investment return/total return 44 (7)
Investments 29 68
Cash income from retained investments 19 10
1 Numbers based on a continuing basis


